Article

Optimization of the Structural and Motion Parameters of Blade Cutters in Paddy Field Pulping Machines

1
State Key Laboratory of Mechanical Transmission, Chongqing University, Chongqing 400044, China
2
College of Mechanical and Vehicle Engineering, Chongqing University, Chongqing 400044, China
3
College of Mechanical and Electrical Engineering, Fujian Agriculture and Forestry University, Fuzhou 350002, China
*
Author to whom correspondence should be addressed.
Agriculture 2024, 14(1), 132; https://doi.org/10.3390/agriculture14010132
Submission received: 24 December 2023 / Revised: 10 January 2024 / Accepted: 15 January 2024 / Published: 16 January 2024
(This article belongs to the Section Agricultural Technology)

Abstract

:
Blade cutters are a component in paddy field pulping machines that perform mud splashing, and the design of their structural and motion parameters will directly affect the splashed-mud volume and pulping-machine efficiency. Therefore, the optimization of the blade cutter’s structural and motion parameters is an important approach for improving the operating performance of paddy field pulping machines. In this study, based on the central-composite-design (CCD) method and a response-surface-method-based variance analysis, a regression-forecast model for the relationship between the splashing performance of the blade cutter and the blade’s structural and motion parameters was constructed to determine the influence of these parameters on the multi-dimensional splashing performance of blade cutters. Additionally, with the construction of a multi-objective performance-optimization model for pulping-machine blade cutters, the predicted optimal structural and motion parameters could be obtained based on the genetic algorithm. The ideal operating performance could be achieved when the blade turning radius was 180 mm, with a bending angle of 125°, a sub-cutter dip angle of 63°, a forward velocity of 0.15 m/s, and a rotating speed of 158 r/min. Verification of the optimization results in a bench test showed that the mean relative errors between the theoretical and experimental values of the mud volume and power consumption were 9.13% and 8.86%, respectively, revealing the high accuracy of the mud-volume and power-consumption models. Furthermore, there was a significant reduction in blade-cutter unit power consumption of 19.13%. These research results can provide a theoretical reference and technical support for blade-cutter optimization and improving pulping-machine performance.

1. Introduction

Rice is the most widely cultivated food crop globally [1], and a crucial process is required in the rice-planting process: seedling cultivation. Currently, there are two primary methods for rice seeding: direct seeding and seedling transplanting. In the Asian region, seedling transplanting is commonly practiced due to the growth characteristics of rice, the socio-economic background, and other factors. Rice transplantation involves laying seedling trays in the field, pouring mud onto the trays, and sprinkling rice seeds on the mud. After cultivation, these seedlings are then transplanted to the field. However, loading mud onto the seedling tray is currently performed manually, which has several disadvantages, such as a high labor intensity, a low efficiency, and uncontrollable mud quality. To overcome these drawbacks and improve operational efficiency, the use of pulping machines is essential. Unfortunately, existing pulpers suffer from drawbacks like a low volume of splashed mud and high power consumption during operation. Therefore, it is imperative to determine the optimal design of the blade cutters used in pulping machines to enhance mechanization levels in seedling transplantation in fields. This research will hold great practical significance in promoting high-end agricultural machinery and industry development while advancing agricultural modernization.
Numerous scholars have conducted extensive research on the blade cutters utilized in agricultural machinery and have achieved significant outcomes. Their research primarily focused on the soil’s rotary tillage and the trenching functions performed by the blade cutter. Some scholars have devised novel blade structures to enhance their operational performance [2,3,4,5,6,7,8,9,10,11,12,13], while others have investigated the interaction between the blades and the soil [14,15,16,17,18,19,20]. Furthermore, certain researchers have enhanced the operational performance by optimizing key blade-cutter parameters [21,22,23,24,25,26,27,28,29,30,31]. The blade cutter is responsible for cutting, transporting, and dispersing mud. Its structure bears resemblance to that of rotary tillers, furrowing machines, churning machines, and other components found in agricultural machinery. During mud splashing using a pulping machine, the structure and motion parameters of the blade directly affect the velocity and direction of mud particles at the moment of being splashed and also determine their moving trajectory after splashing. Inappropriate blade structure and motion parameters will make mud particles deviate from the preset splashing path, and thus, they will not be accurately splashed in the center of the collecting tray. Then, mud might be splashed out of the effective range of the tray or stack and clog up at one side of the collecting tray, leading to various performance problems such as a low mud volume and a high power consumption of the pulping machine. The main reason for this may be the unsuitable geometric and motion parameters of the blade cutter, resulting in ineffective cutting, transferring, and splashing of mud. In order to improve the operational performance of blade cutters, Xie Y et al. [32,33] optimized the structural parameters of the blades for use in paddy fields using a CFD method, and the results showed that the optimal blade performance was greatly improved. Chen C et al. [34] optimized the design of blades in rice seedling growth trays for mud homogenization through discrete element simulations. Ding Q et al. [35] utilized reverse engineering technology to determine the essential geometric parameters of the pulping blade, subsequently investigating both the operational aspects and design methodology of said blade. Xu C et al. [36] optimized the working parameters of blades for puddling and flatting machines in paddy fields. Jeon C et al. [37] studied an autonomous paddy-field-levelling tractor equipped with an optimal coverage path planner (CPP), demonstrating superior performance in terms of distance and fuel efficiency. Ma C et al. [38] performed a dynamic analysis on the soil cutting process involving rotary blades used in paddy fields, establishing a power-consumption model for these blades while optimizing their structure through EDEM simulations. Zhang Y et al. [39] optimized the weed depth, blade rotation speed, and forward speed for a rice weeder operating in paddy fields using secondary orthogonal rotation combination testing. Although numerous studies have been performed on operational-performance optimization of blade cutters in pulping machines, a mathematical model has yet to be built for a quantitative analysis of the relationship between the blade’s structural and motion parameters and its splashing performance. Therefore, a model for the quantitative calculation of blade-cutter splashing performance was established in this paper to explore the influence of the blade’s structural and motion parameters and their mutual effect on the splashing performance of the blade cutter. Finally, the predicted optimal blade structure and motion parameters were calculated based on the genetic algorithm. These research results can provide a theoretical basis for the optimal design of blade cutters.

2. Materials and Methods

The process of splashing mud particles using a paddy field pulping machine is shown in Figure 1. The clockwise rotation of the driving wheels in the pulping machine leads to a uniform linear motion of the blade cutter, which rotates anticlockwise around the revolving shaft. Under the effect of the blade cutter, mud particles are splashed onto a collecting tray at one side of the paddy field. Figure 2 shows the geometric structure of a blade cutter.

2.1. Discrete Element Simulation Model

2.1.1. EDEM Model

The model used to simulate the splashing operation of a pulping machine’s blade cutter based on EDEM is shown in Figure 3, where the internal dimensions of the mud tank are 3000 mm × 400 mm × 400 mm and the size of the collecting tray is 3000 mm × 600 mm. Given that mud is a mixture of soil and water, it is necessary to establish discrete element models for soil particles and water particles in order to simulate the relationship between the blade cutter and the mud. Thus, particle factories were constructed on both the upper and lower layers of the mud tank to generate water particles and soil particles, enabling the simulation of the static mud environment in a paddy field. Subsequently, these two types of particles are mixed into mud after being stirred with the blade cutter. The water-particle depth in the upper layer was 120 mm, with the total quantity of 2.5 × 10⁵, while the soil-particle depth in the lower layer was 280 mm, with the total quantity of 7.7 × 10⁵. Due to the environmental characteristics of paddy fields, there is a certain relationship between the mud particles. A JKR wet-particle contact model was adopted in the simulated environment, where the surface energy was used to express the bonding force between particles. In the discrete element simulation model, the Poisson ratio of soil particles was 0.25, with a shear modulus of 1.24 × 10⁶ MPa and a density of 1450 kg/m3, while the Poisson ratio of water particles was set to 0.5, with a shear modulus of 108 and a density of 1000 kg/m3. The other contact parameters are provided in Table 1. The duration of the simulation test was set to 5 s with a time step of 0.0002 s, and data were recorded every 0.05 s.

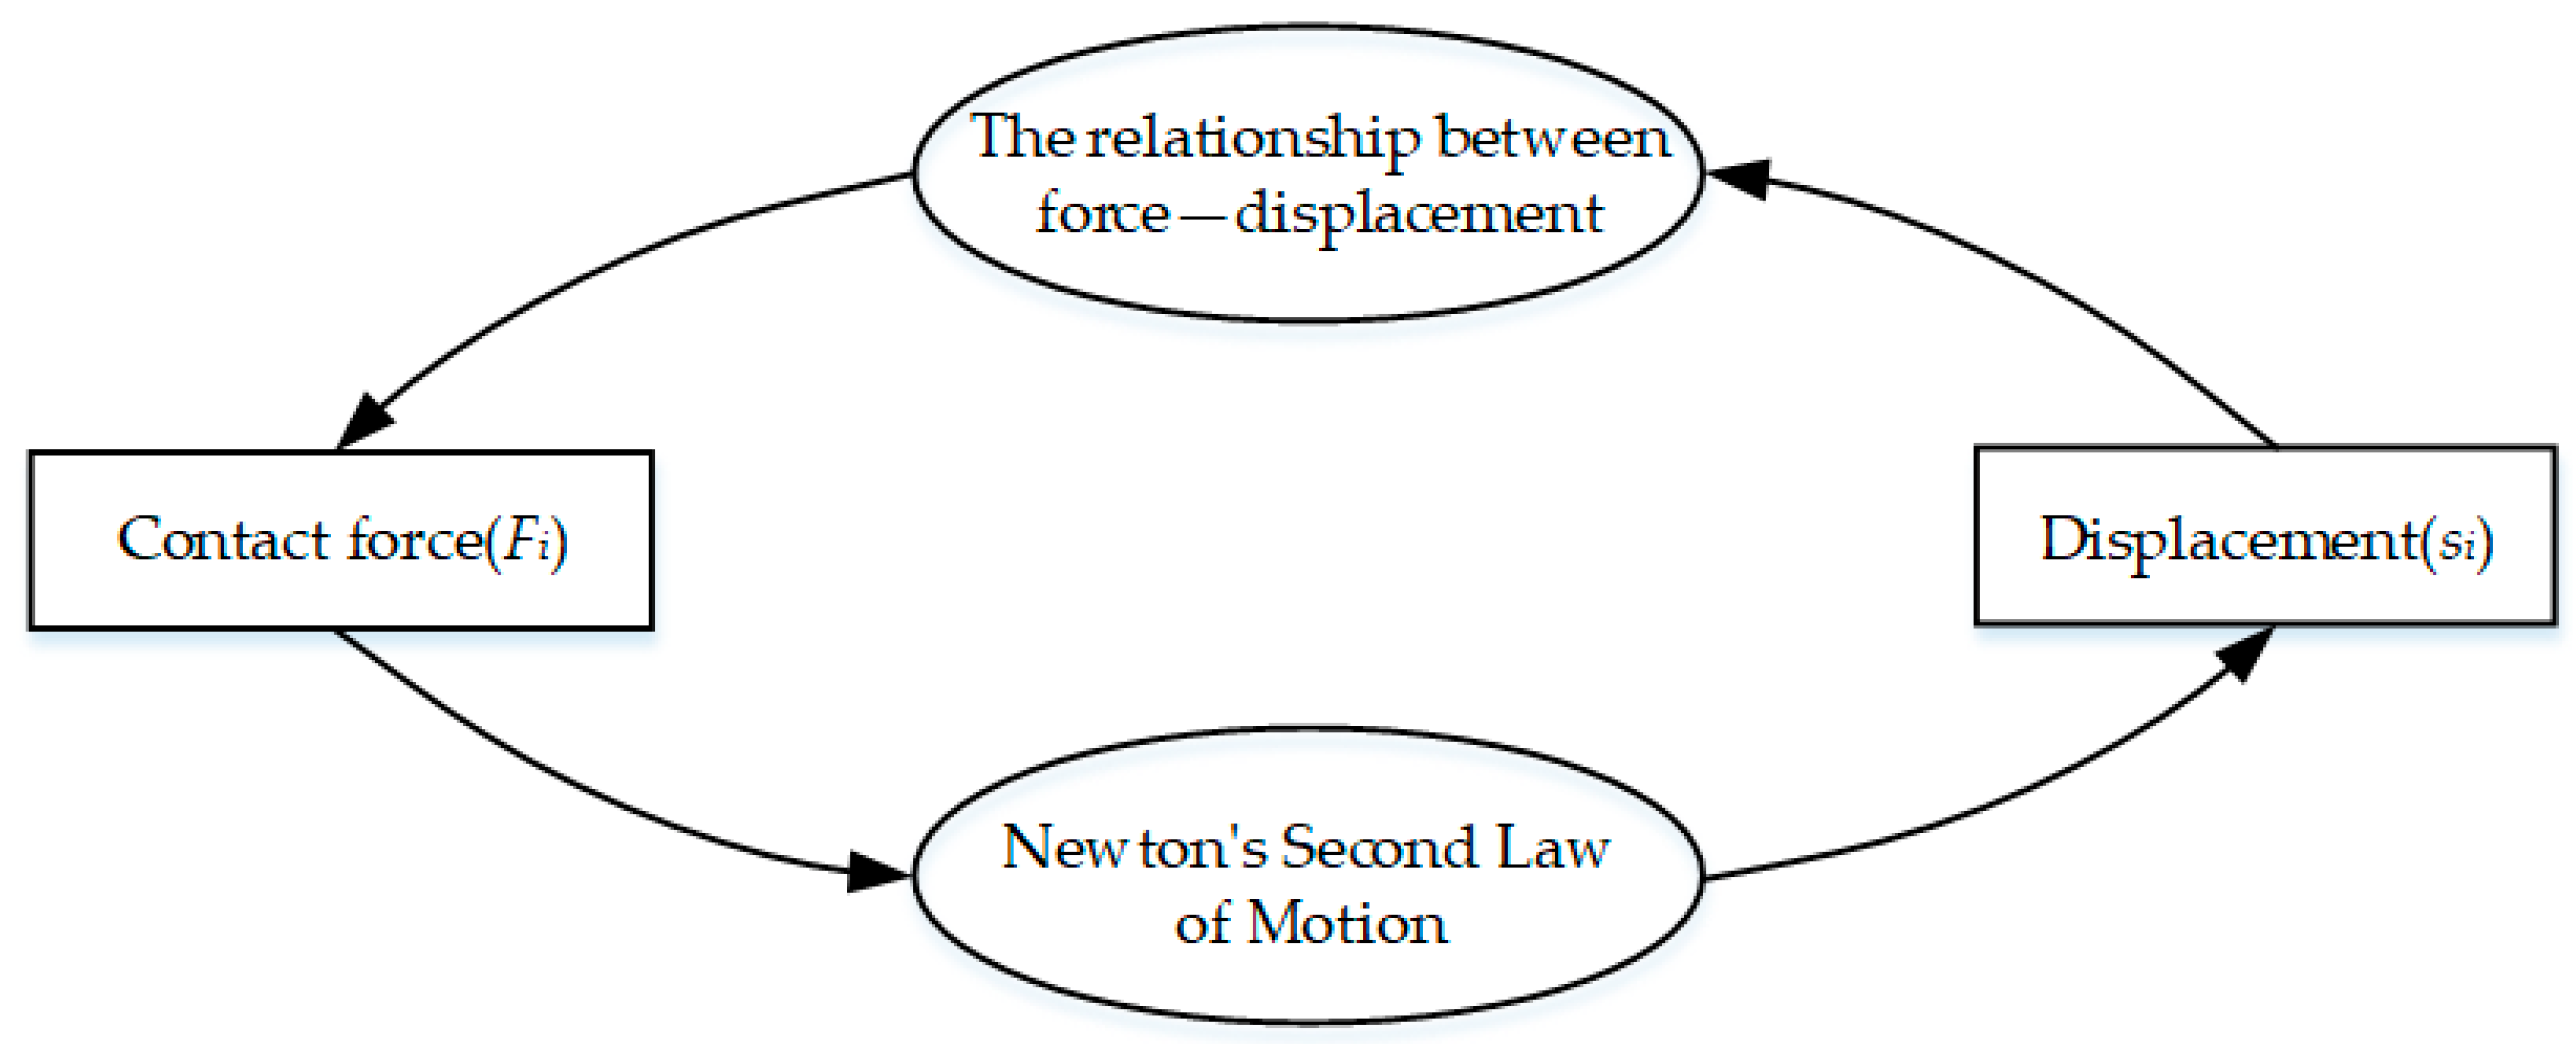
2.1.2. The Governing Equation for Particle Motion

The force exerted on particles can be determined by establishing the relationship between force and displacement. In accordance with Newton’s second law, the equation of motion for particle i can be derived using Formula (1):
j = 1 n j F i j c + F i g = m i d v i dt               j = 1 n j M i j = I i d w i d t
The mass of particle i is represented with mi in Formula (1), while its moment of inertia is denoted as Ii. The linear translational velocity and angular velocity of particle i are, respectively, indicated with vi and wi. F i j c represents the contact force acting on particle i, whereas F i g denotes the gravity exerted on particle i.  M i j refers to the rotational torque experienced by particle i due to particle j, and nj represents the contact number of particle i.
By applying Euler’s method to both sides of Formula (1), we can derive the update rate for the next time step.
( v i ) N   = ( v i ) N 1 + j = 1 n j F i j c + F i g m i N × t               ( w i ) N = ( w i ) N 1 + j = 1 n j M i j I i N × t
In Formula (2), ∆t is the time step, and N is the corresponding time t.
The displacement equation can be derived by integrating velocity Equation (2).
( s i ) N + 1 = ( s i ) N + ( v i ) N t ( θ i ) N + 1 = ( θ i ) N + ( w i ) N t
In Formula (3), s i is the displacement of particle I, and θ i is the angular displacement of particle i.
The new force can be obtained by applying the calculated displacement value to the force–displacement equation. In this manner, calculations are repeatedly performed to track and determine particle positions, as well as the corresponding forces at each moment. The fundamental procedure for solving particle motion using the discrete element method is succinctly summarized in Figure 4.

2.2. Experimental Arrangement and Test

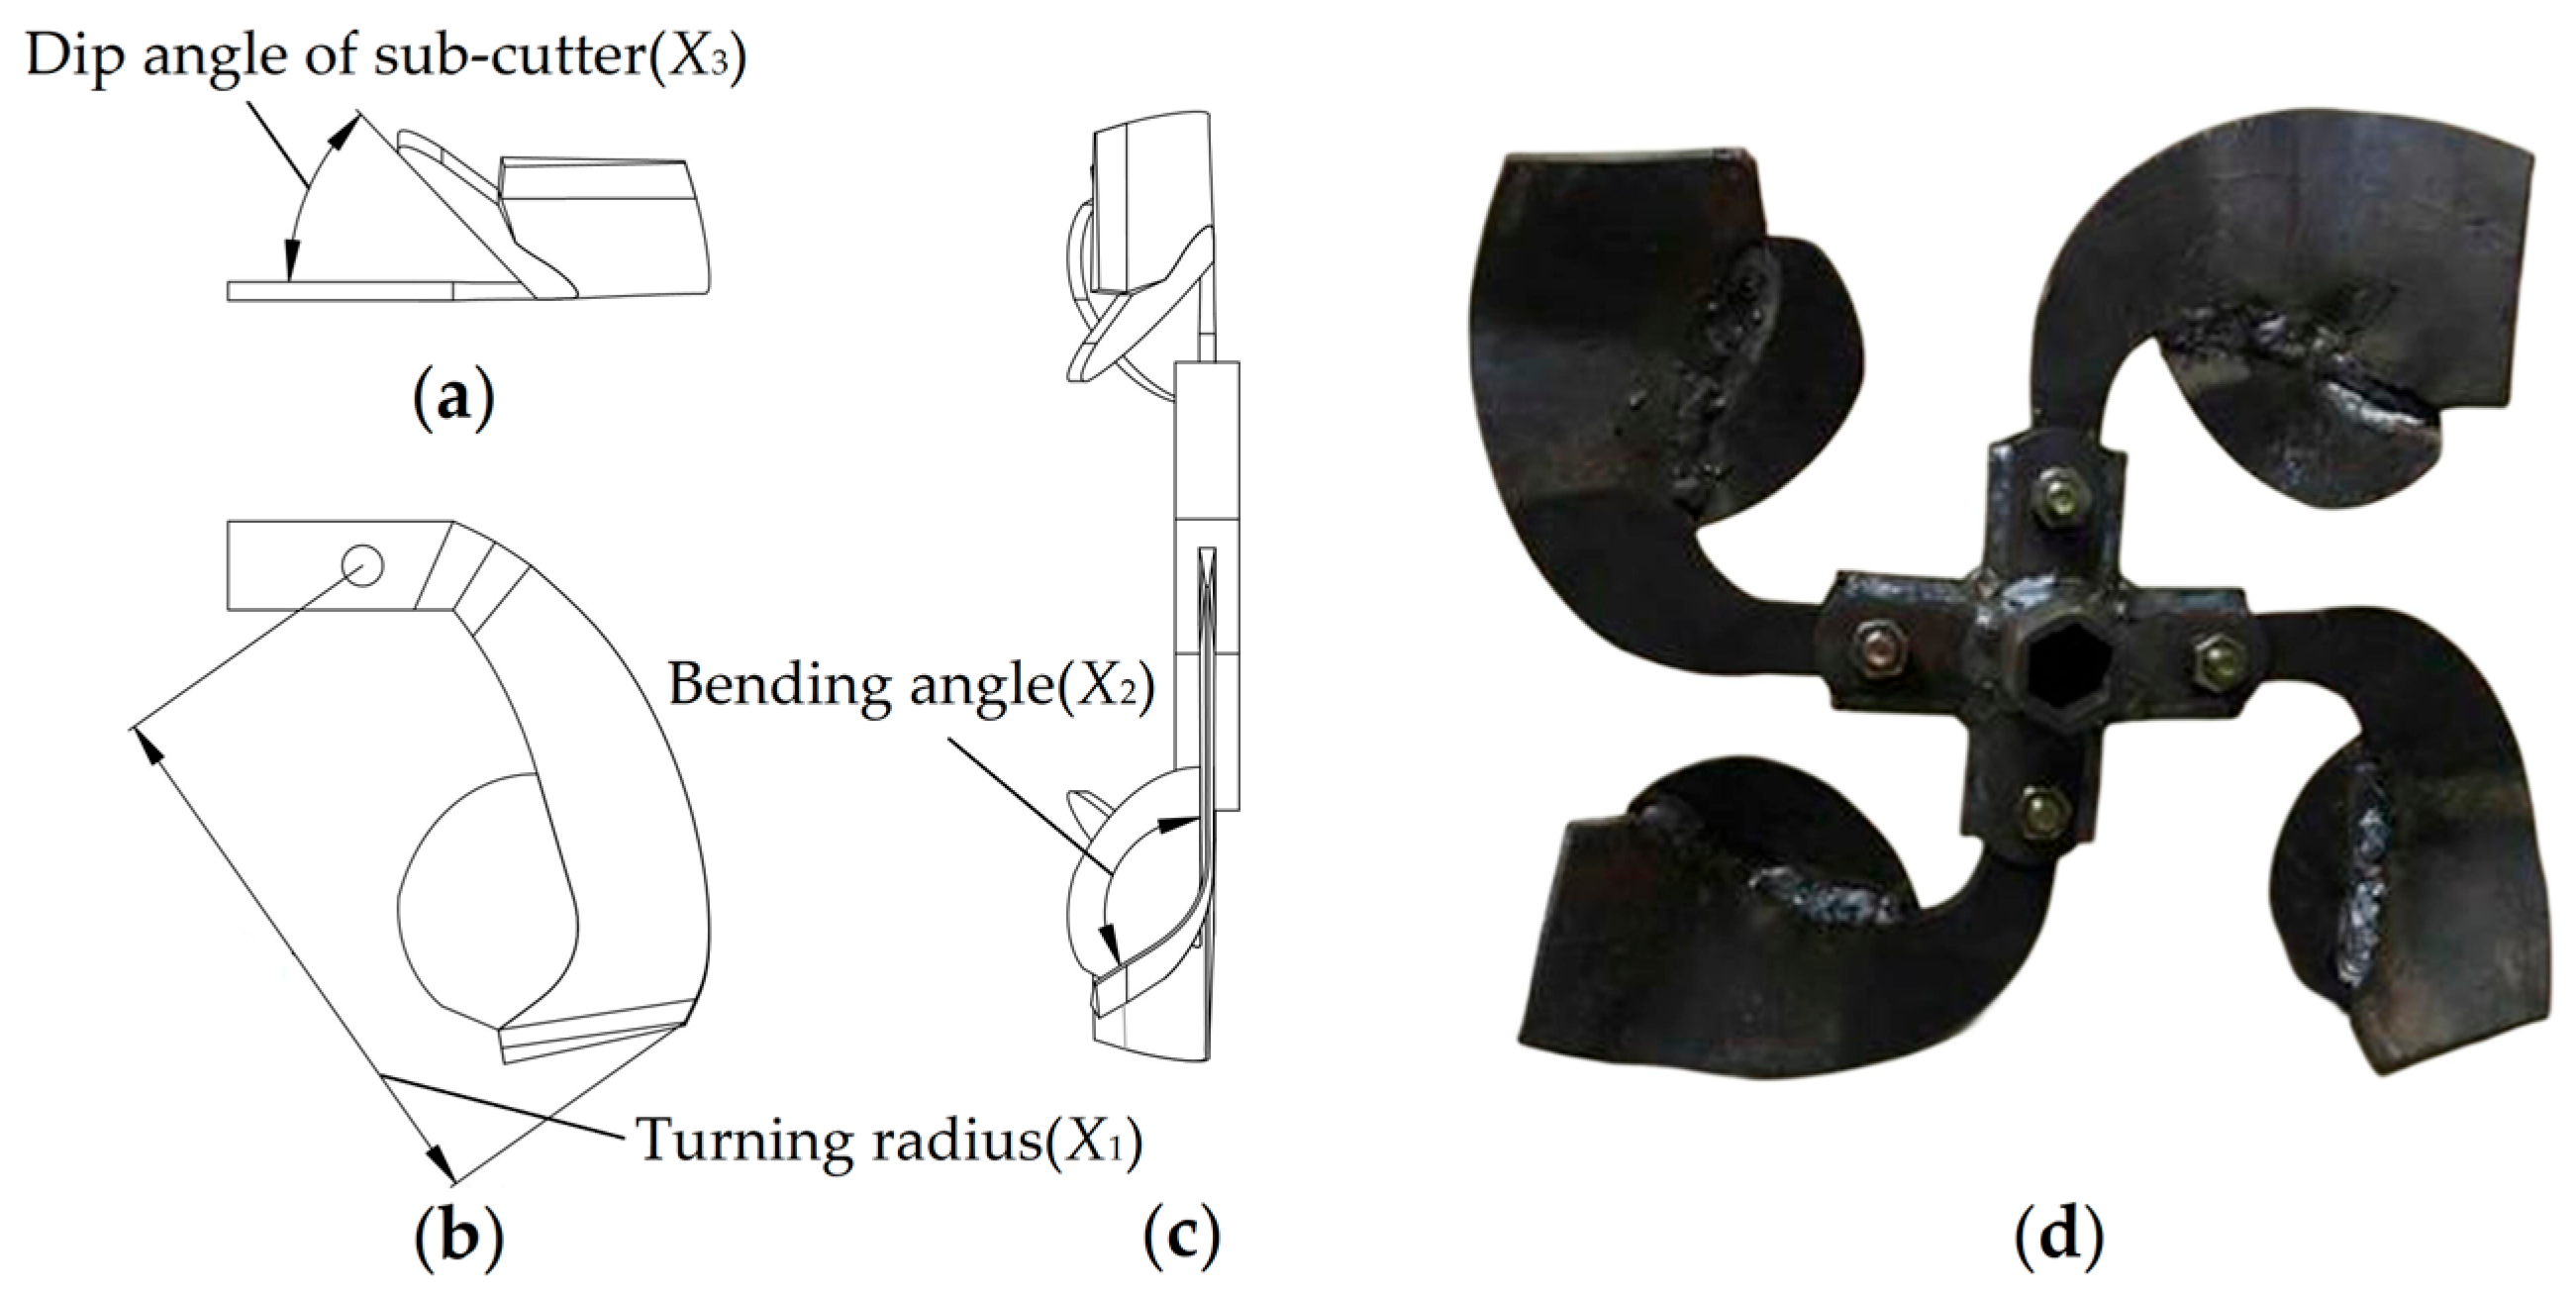
2.2.1. Experimental Arrangement

The experimental factors include the blade turning radius (X1), the bending angle (X2), the dip angle of the sub-cutter (X3), the forward velocity (X4), and the rotating speed (X5). The mud volume M and the power consumption P serve to evaluate the splashing performance of the blade cutter in the pulping machine. A five-factor quadratic orthogonal rotating combination was designed for the test based on the CCD principle. According to the practical application and the agricultural mud splashing requirements, the experimental factors and encoding levels were chosen and are provided in Table 2.

2.2.2. Calculation Methods for Experimental Indexes

  • Mud volume (M)
After the simulation experiment, the effective total mass of mud particles exported from the post-processing of EDEM to the collecting tray was considered as the mud volume splashed by the blade cutter of the pulping machine.
2.
Power consumption (P)
During EDEM post-processing, the torque of the blade cutter in the operating process could be recorded and exported in real time, and its power consumption could be calculated according to Formula (4).
P = 2 π n · T 60
where P is the power consumption of the mud-splashing process (kW), n is the rotating blade speed (r/min), and T is the torque of the blade cutter (N·m).

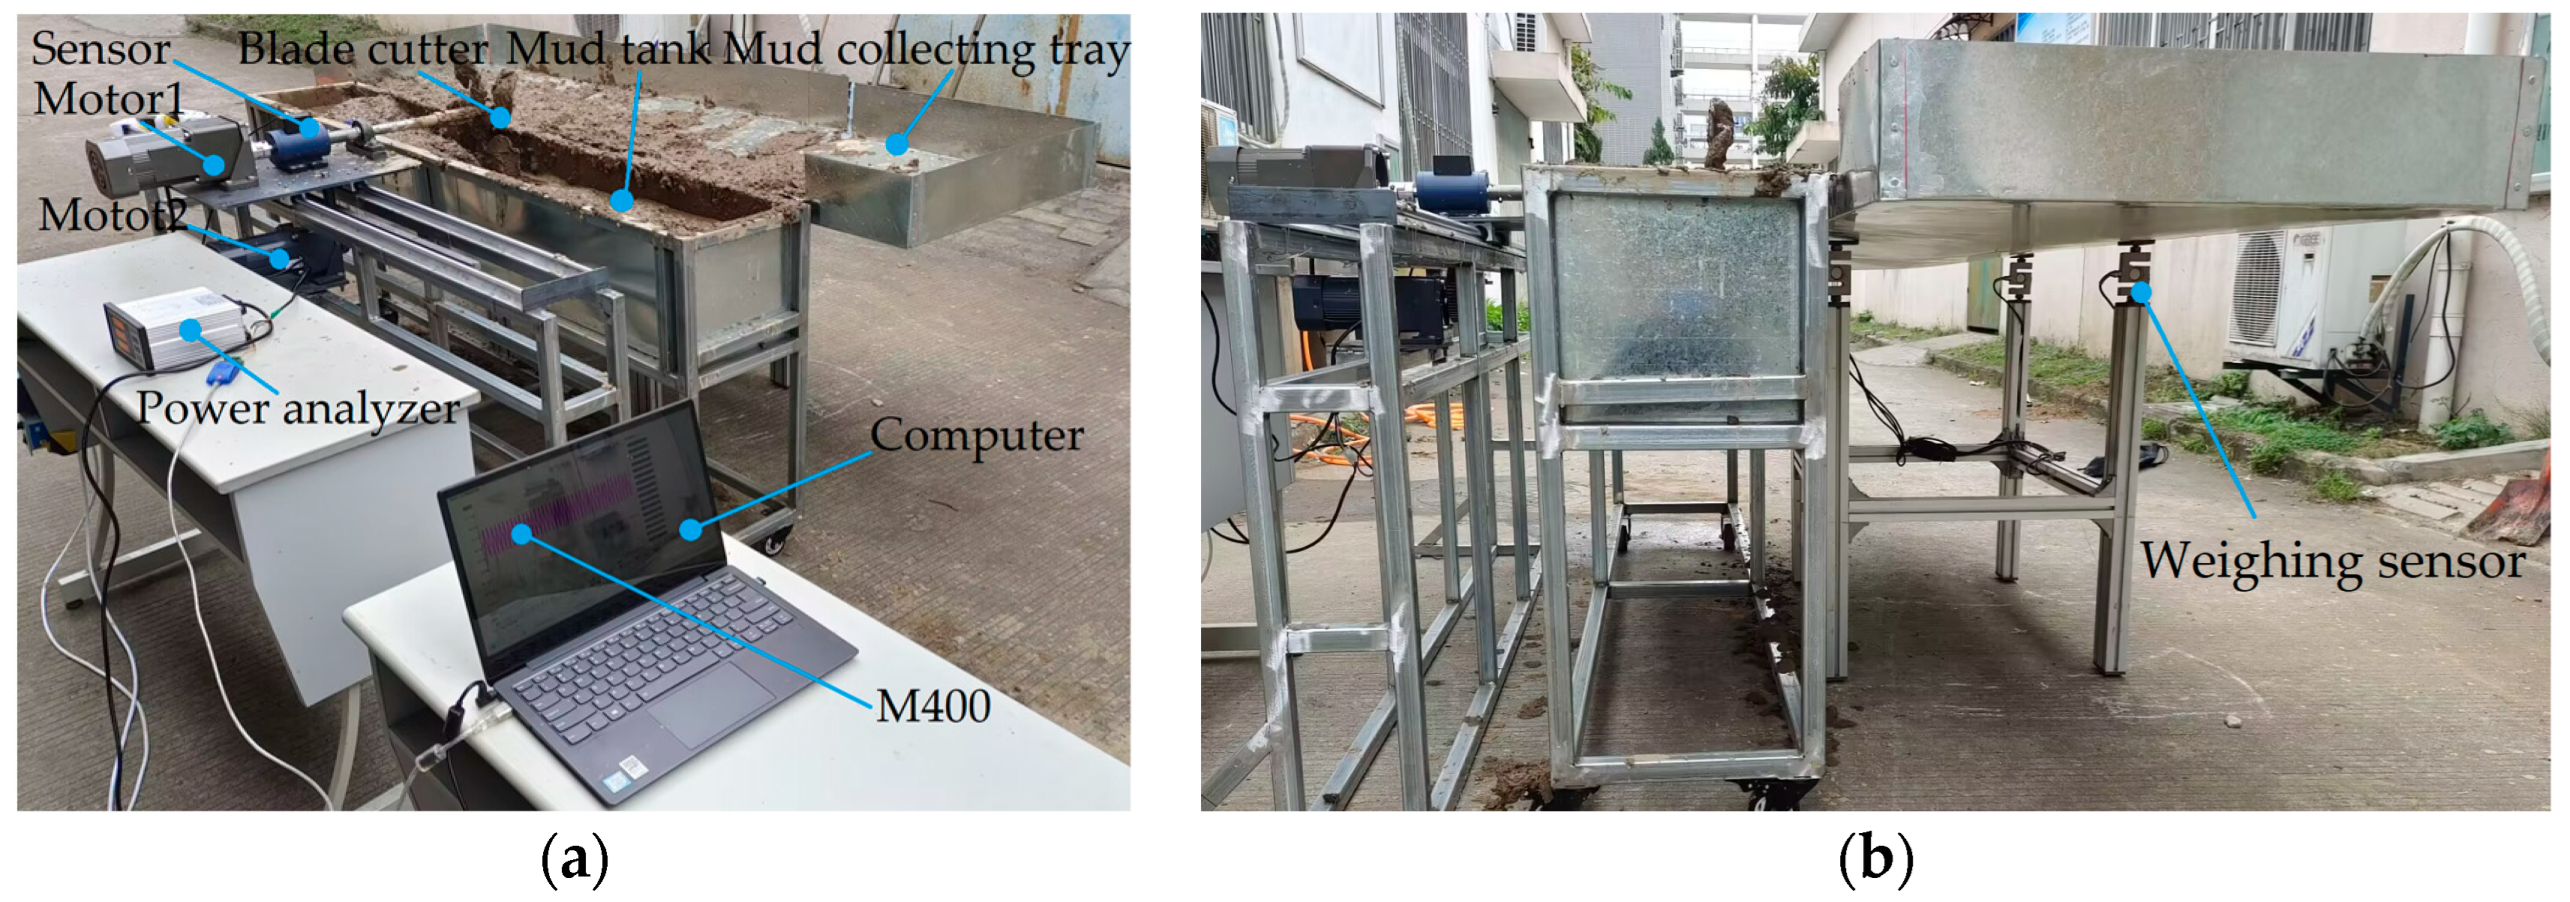
2.3. Testing Apparatus

In order to evaluate the accuracy and reliability of the optimal predicted blade structure/motion parameters obtained in the simulation experiments, a bench test was conducted. The bench test was conducted at the engineering training center, Fujian Agriculture and Forestry University, Fuzhou, Fujian, with the testing apparatus shown in Figure 5.
The testing equipment mainly consisted of a mud tank (dimensions of 3000 mm × 400 mm × 400 mm), a blade cutter (made of 65 Mn), a power analyzer (Beijing Longding Jinlu Measurement and Control Technology Co., LTD, LDN-08D, Beijing, China), a torque and speed sensor (Beijing Tianyu Hengchuang Sensor Technology Co., Ltd., Beijing, China), a data acquisition and management system (M400), a first gear motor (Shanghai Hanao Motor Co., Ltd., YL90S-2, Shanghai, China), a second gear motor (Zhejiang Dongzheng Motor Co., Ltd., 7IK500RGU-CF7GU5K, Dongyang, China), a slide rail with a gear rack, a motor frequency converter, a collecting tray, and a weighing sensor (ZEMIC., Ltd., H8C-C3-1.5T-4B, Downey, CA, USA). During the experiment, the blade cutter was rotated using the first gear motor, and, at the same time, it moved forward under the effect of a rack and pinion mechanism driven by the second gear motor. After blade-cutter movement, mud in the mud tank was splashed onto the collecting tray located at one side. The rotating speed and torque were measured using the torque and speed sensor during blade-cutter operation, and data were input into the power analyzer for processing after data conversion. The volume of mud splashed onto the collecting tray was measured using the weighing sensor. Before each experiment, a trial test was conducted to adjust the motor parameters for a steady rotating speed and forward velocity of the blade cutter. When testing, each experiment was repeated three times to obtain a mean value, which comprised the test data of mud volume and power consumption.

3. Results and Discussion

3.1. Splashing-Performance Regression-Forecast Model

A total of 36 experiments were performed in the simulation environment, and each experiment was repeated three times to obtain a mean mud volume M and power consumption P during blade-cutter operation in the pulping machine, as indicated in Table 3. All of the test data were statistically analyzed in Design-Expert13.0 software, and comparisons were separately made of the mud volume M and the power consumption P regression models in terms of significance and lack of fit based on the ANOVA method. Table 4 shows the ANOVA results of the experimental indexes.
As indicated in Table 4, a statistical analysis of M and P revealed that the influence of X1, X2, X3, X4, X12, X22, X52, X1X2, X1X4, X1X5, X2X3, X2X4, X2X5, and X4X5 on mud volume was significant (P < 0.05). The influence of X1, X3, X4, X5, X12, X22, X32, X42, X52, X1X2, X1X3, X1X4, X1X5, X2X3, X2X4, X2X5, X3X4, X3X5, and X4X5 on power consumption was also significant (P < 0.05). Both of the P values (P1 and P2) of the overall model integrated with M and P were lower than 0.0001, revealing that there was a very significant relationship between the experimental indexes and the blade structure/motion parameters in the regression models, with a high fitting precision and reliable regression equations. The lack of fit was not significant, as both of the P values (P1 and P2) were higher than 0.05, proving the effectiveness of regression and that it could be used to describe the relationship between the blade cutter’s splashing performance and the blade’s structure/motion parameters. After eliminating insignificant factors, the regression-forecast models for M and P can be expressed using Formulas (5) and (6).
M = −629.04 + 5.38X1 + 3.75X2 + 1.61X3 − 112.98X4 − 0.011X1X2 + 1.08X1X4 + 0.004X1X5 − 0.008X2X3 − 0.98X2X4 +
0.001X2X5 + 0.24X4X5 − 0.01X12 − 0.006X22 − 0.0002X52
P = 481.63 + 12.51X1 + 24.54X3 − 3756.74X4 − 9.87X5 + 0.08X1X2 − 0.16X1X3 + 24.42X1X4 + 0.04X1X5 − 0.02X2X3
− 14.64X2X4 + 0.01X2X5 + 8.84X3X4 + 0.02X3X5 + 3.99X4X5 − 0.1X12 − 0.03X22 + 0.01X32 + 356.84X42 − 0.002X52

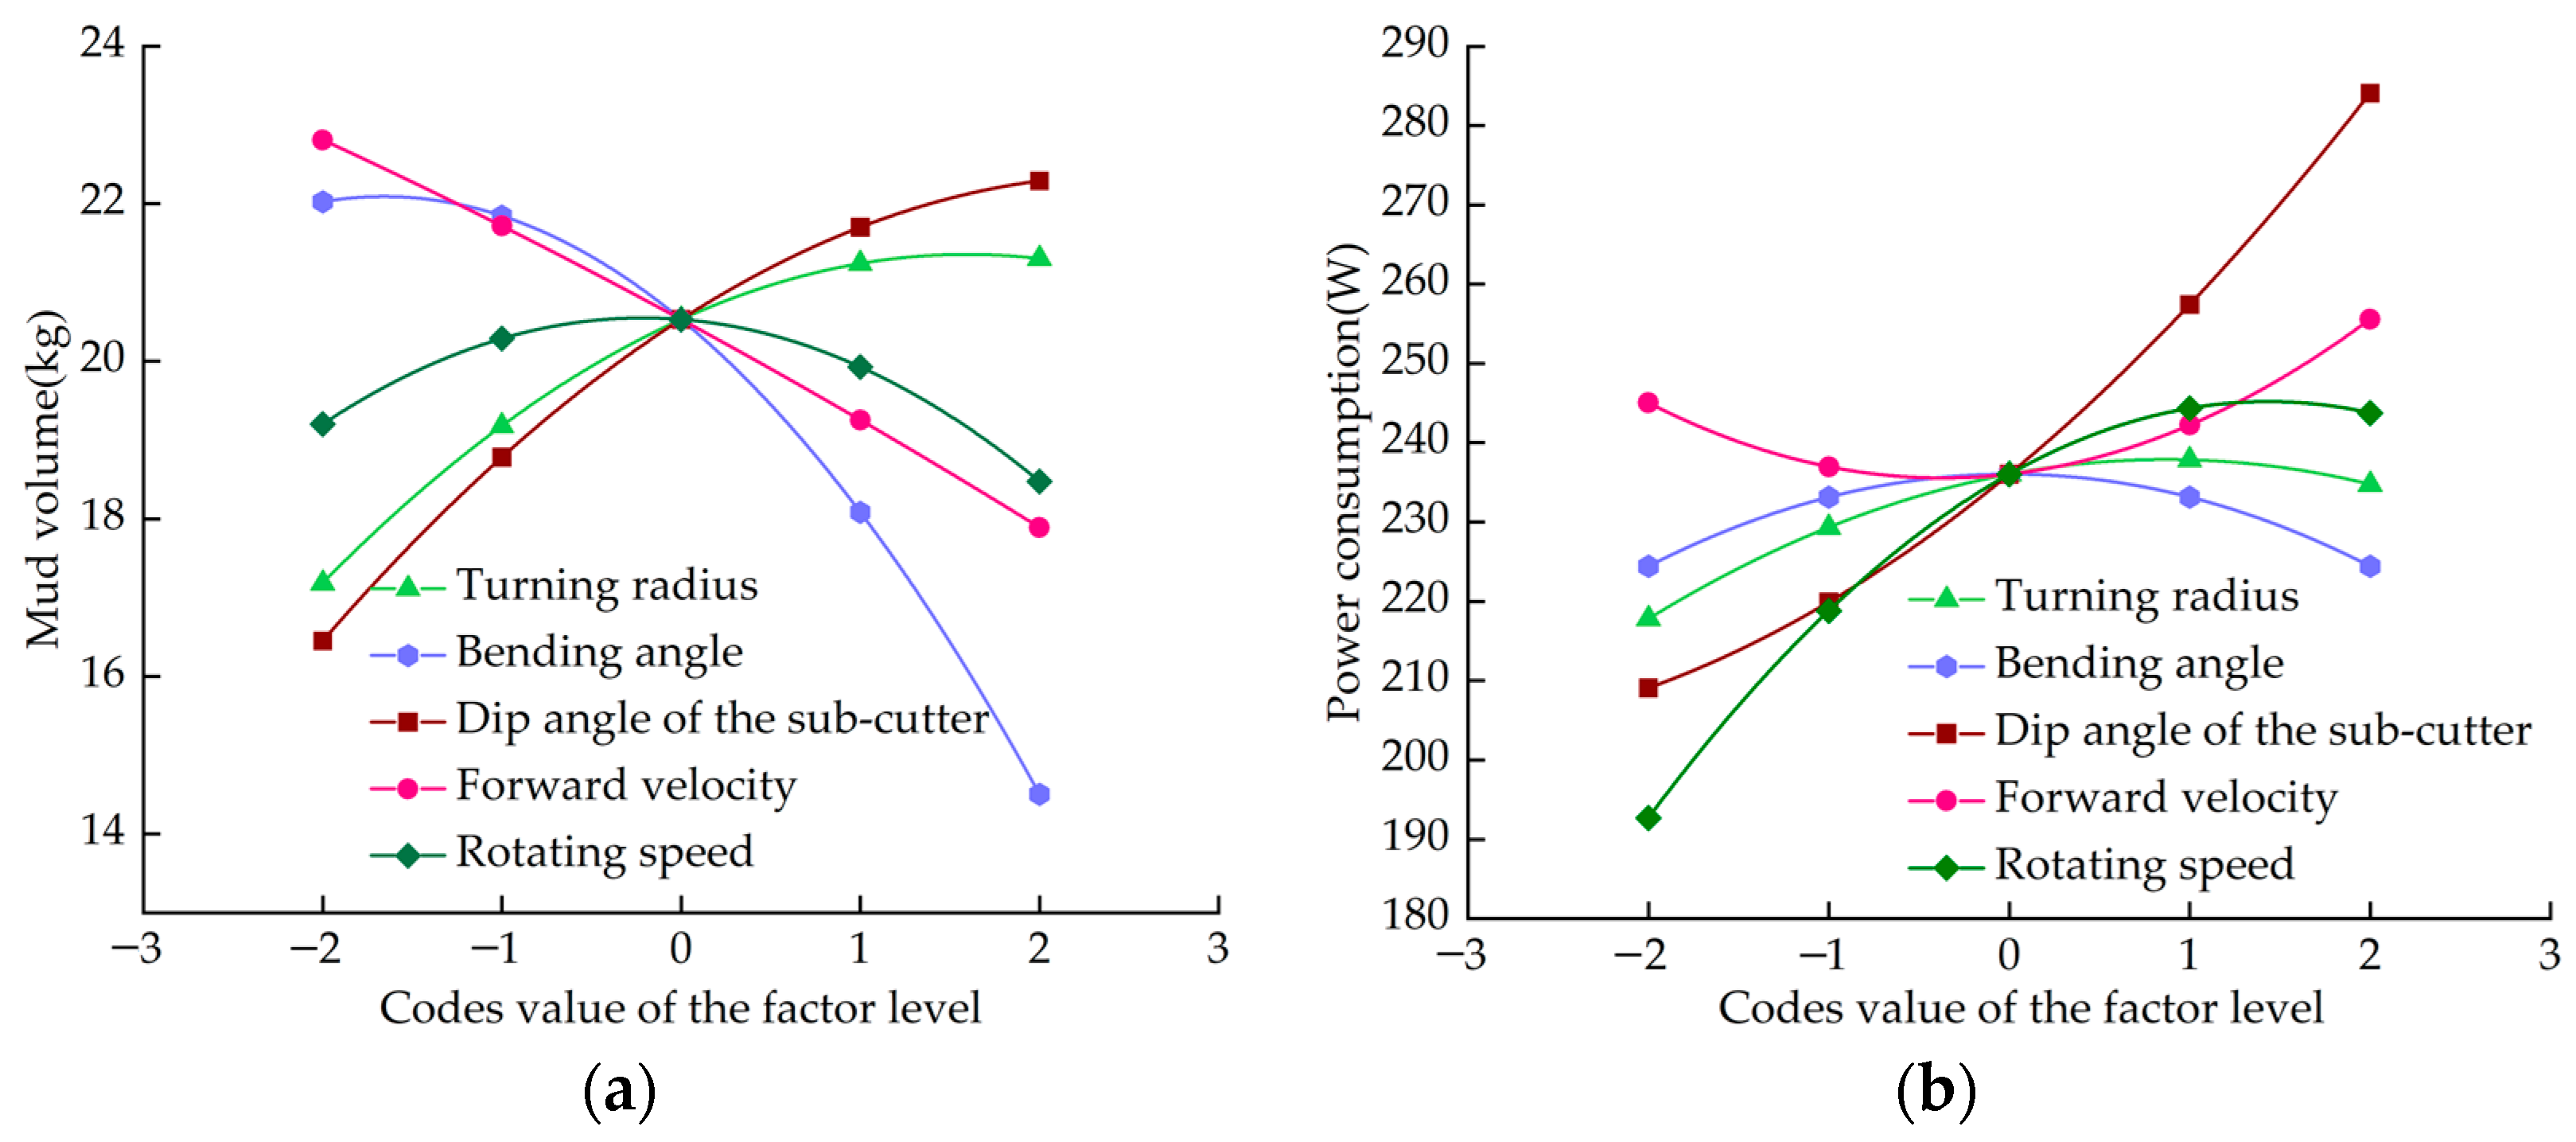
3.2. Analysis of the Influence of Single Factors on Experimental Indexes

According to the regression-forecast model in Formulas (5) and (6) and in order to analyze the influence of a single factor, such as the blade turning radius, the bending angle, the dip angle of the sub-cutter, the forward velocity, and the rotating speed, on the experimental indexes, the effect curve between a single factor and the experimental indexes were obtained by fixing the other four factors at zero, as indicated in Figure 6.
Figure 6a reveals that the mud volume grew with an increase in the turning radius and the dip angle of the sub-cutter, while it was reduced with an increase in the bending angle and forward velocity. However, it was increased and then reduced with an increase in the rotating speed. When the factor-level encoded turning radius, bending angle, sub-cutter dip angle, forward velocity, and rotating speed values were 1.4, −1.54, 2, −2, and 0, respectively, the maximum mud volume was 21.28 kg, 22 kg, 22.14 kg, 23.02 kg, and 21.28 kg, respectively. Figure 6b shows that with an increase in the turning radius, bending angle, and rotating speed, the power consumption increases and then declines. Also, it grew significantly with an increase in the dip angle of the sub-cutter. It declined and then rose with an increase in forward velocity. When the factor-level encoded values of the turning radius, bending angle, sub-cutter dip angle, forward velocity, and rotating speed were −2, −2, −2, −0.37, and −2, respectively, the minimum power consumption was 217.77 W, 223.47 W, 209.1 W, 235.53 W, and 192.7 W, respectively.

3.3. Analysis of the Influence of Interacting Factors on Experimental Indexes

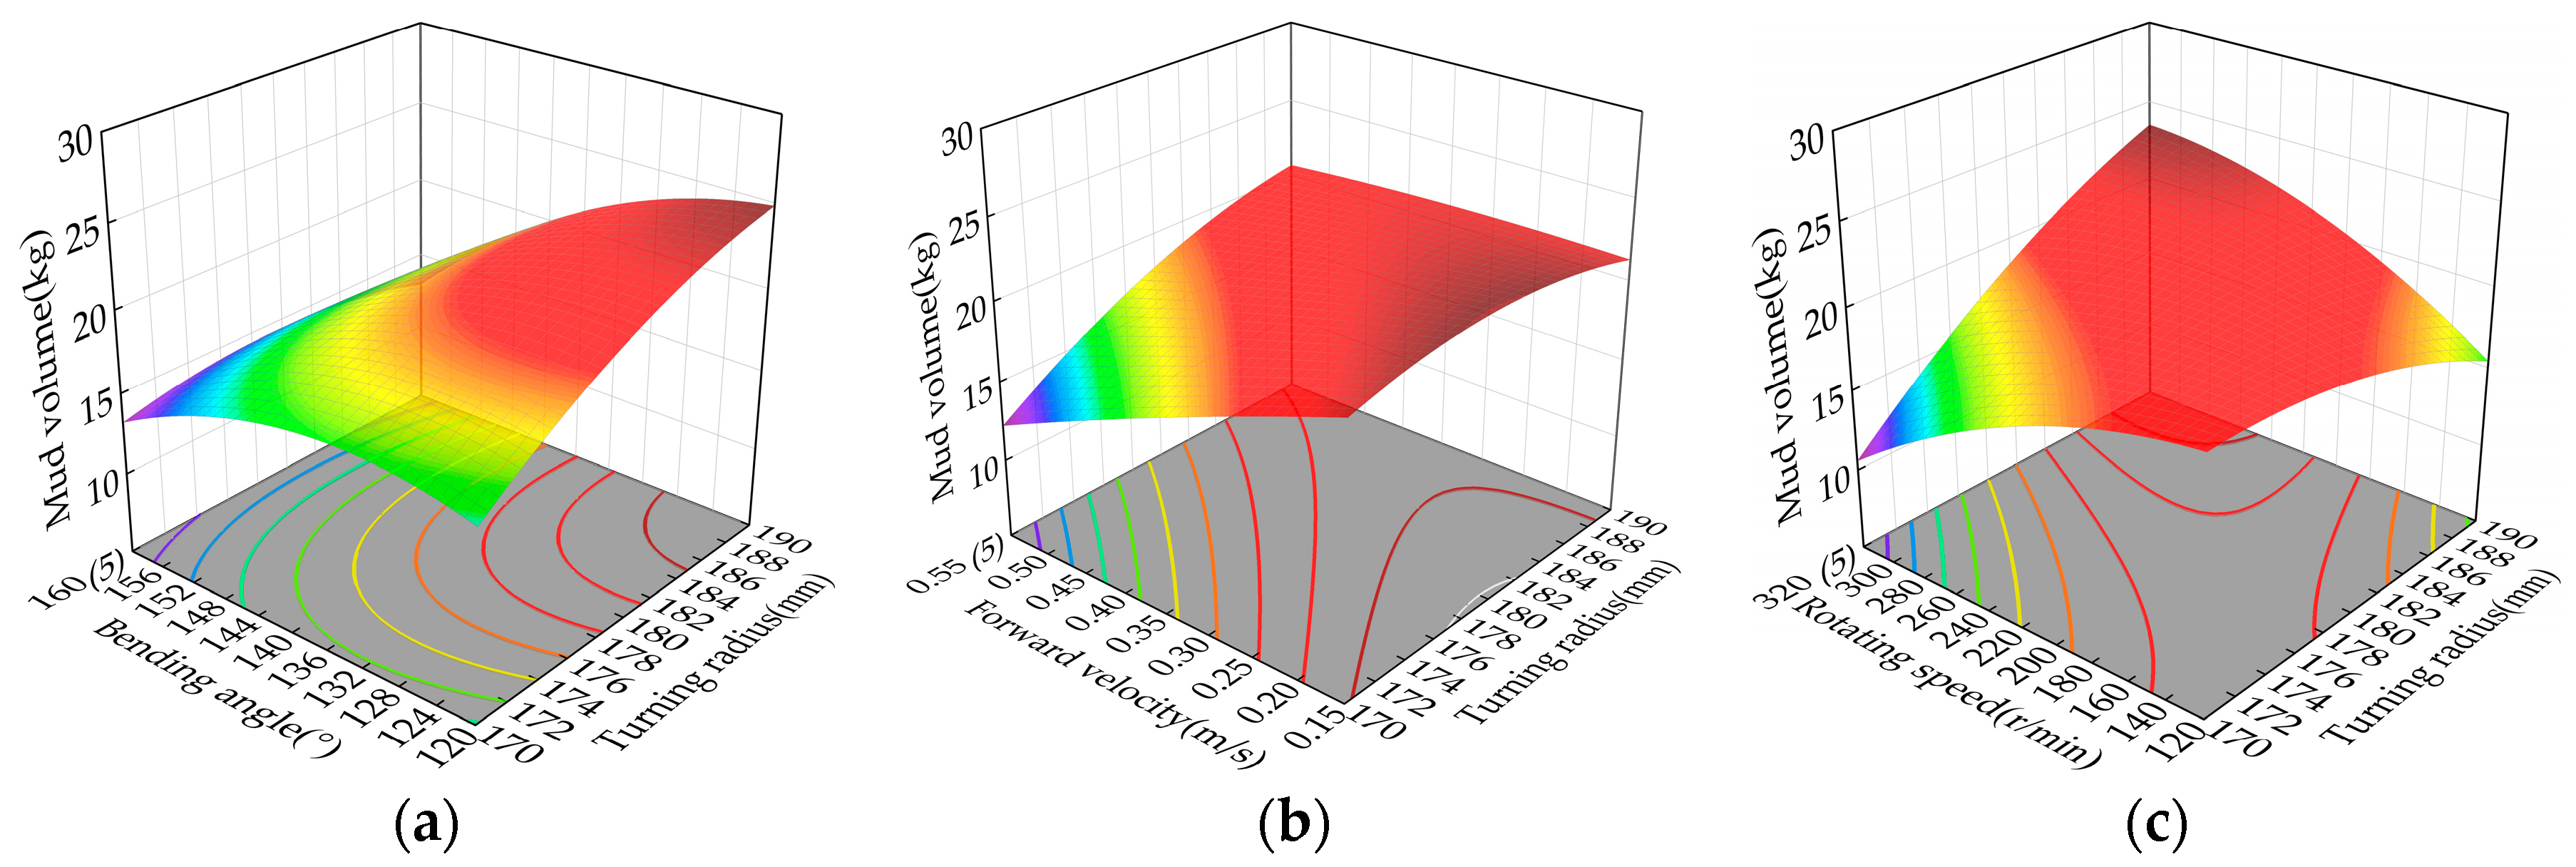
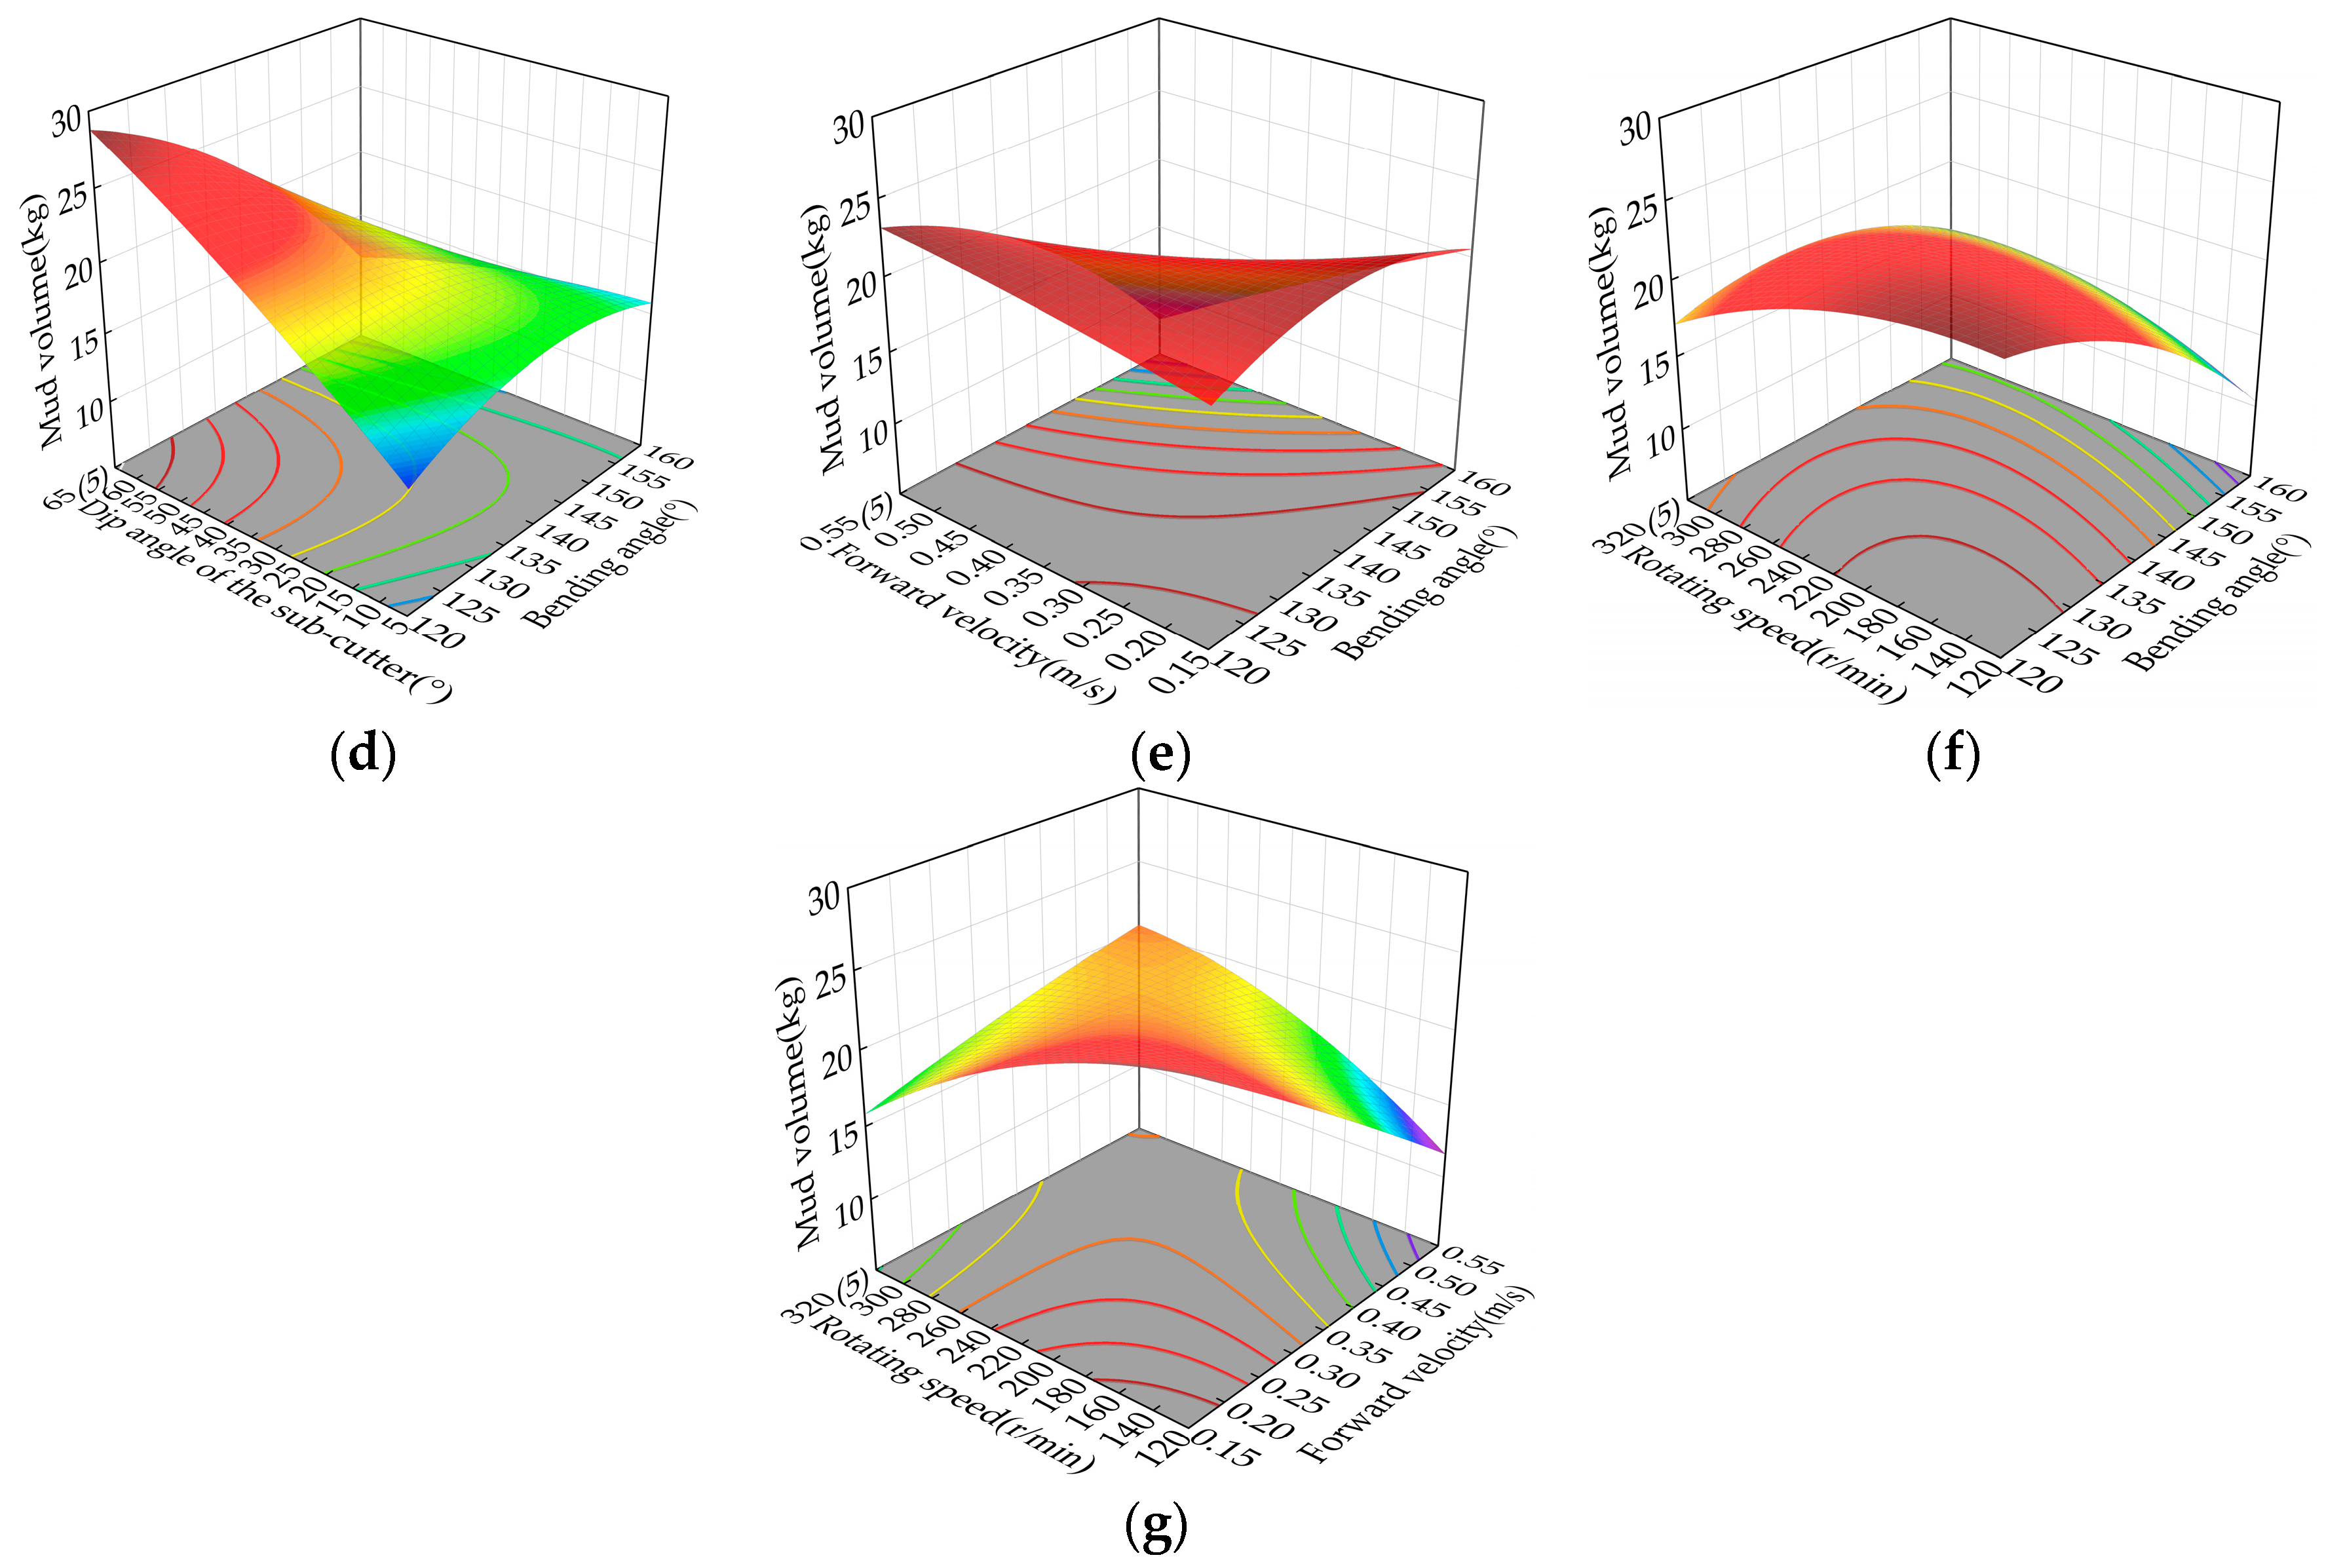
3.3.1. Analysis of the Influence of Interacting Factors on Mud Volume

In order to analyze the influence of the interaction between two factors on the mud volume, the other three factors were set to zero, and insignificant factors were not considered. Then, a mapping relationship of the interaction of significant influencing factors on mud volume was obtained, as indicated in Figure 7.
Figure 7a reveals that, with an increase in the turning radius and a reduction in the bending angle, the mud volume gradually increased, and it was largest when the turning radius was between 180 mm and 190 mm and the bending angle was in the range of 120°–130°. It reached a maximum of 24.86 kg when the turning radius was 190 mm, at a bending angle of 120°. Figure 7b shows that with an increase in the turning radius and a reduction in the forward velocity, the mud volume gradually increased. It became larger when the turning radius was between 180 mm and 190 mm and forward velocity was between 0.15 m/s and 0.35 m/s. It reached a maximum of 22.74 kg when the turning radius was 190 mm at a forward velocity of 0.15 m/s. As indicated in Figure 7c, when the turning radius was in the range of 170 mm–180 mm, the mud volume grew with a decrease in the rotating speed. The opposite occurred when the turning radius was in the range of 180 mm–190 mm. The influence of the turning radius on mud volume was negative when the rotating speed was between 120 r/min and 180 r/min, but it was positive when the rotating speed was between 180 r/min and 320 r/min. Figure 7d shows that when the bending angle was between 120° and 145°, the mud volume grew with an increase in the dip angle of the sub-cutter and remained basically unchanged when the bending angle was between 145° and 160°. The mud volume was also basically unchanged when the dip angle of the sub-cutter was in the range of 5°–20° with an increase in the bending angle, but it rose significantly with a reduction in the bending angle when the dip angle of the sub-cutter was between 20° and 65°. It reached a maximum of 28.51 kg when the bending angle was 120° and the dip angle of the sub-cutter was 65°. As indicated in Figure 7e, the mud volume slowly grew with an increase in the forward velocity when the bending angle was between 120° and 140°, but it reduced with an increase in forward velocity when the bending angle was between 140° and 160°. It rose and then declined with an increase in the bending angle when the forward velocity was in the range of 0.15 m/s–0.35 m/s. However, it increased with a reduction in the bending angle when the forward velocity was between 0.35 m/s and 0.55 m/s. Figure 7f shows that when the rotating speed was between 120° and 320°, the mud volume grew with a reduction in the bending angle. The influence of the rotating speed on mud volume was negative when the bending angle was in the range of 120°–140°, but it was positive when the bending angle was between 140° and 160°. As indicated in Figure 7g, the mud volume grew with a reduction in rotating speed when the forward velocity was in the range of 0.15 m/s–0.35 m/s. The opposite was true when the forward velocity was between 0.35 m/s and 0.55 m/s. The influence of the forward velocity on mud volume was negative when the rotating speed was between 120 r/min and 200 r/min, but it was positive when the rotating speed was between 200 r/min and 320 r/min.

3.3.2. Analysis of the Influence Effect of Interacting Factors on Power Consumption

The same approach was employed to analyze the influence of interacting factors on power consumption, the results are shown in Figure 8.
As indicated in Figure 8a, the power consumption of the blade cutter fluctuated slightly during operation when the turning radius was in the range of 170 mm–190 mm, and the dip angle varied between 120° and 160°. Figure 8b shows that power consumption grew with an increase in the bending angle when the turning radius was between 170 mm and 180 mm, but it did not vary very much with the change in bending angle when the turning radius was between 180 mm and 190 mm. The influence of the turning radius on power consumption was positive when the bending angle was between 5° and 35°, but it was negative when the bending angle was between 35° and 65°. Figure 8c shows that the power consumption reduced with an increase in the forward velocity when the turning radius was between 170 mm and 180 mm. However, the opposite occurred when the turning radius was between 180 mm and 90 mm. The influence of the turning radius on power consumption was negative when the forward velocity was in the range of 0.15 m/s–0.35 m/s, but it was positive when the forward velocity varied between 0.35 m/s and 0.55 m/s. As shown in Figure 8d, the power consumption grew significantly with an increase in the rotating speed when the turning radius was between 170 mm and 190 mm, and it gradually rose with an increase in the turning radius when the rotating speed was between 120 r/min and 320 r/min. Figure 8e reveals that the power consumption rose with an increase in the dip angle of the sub-cutter when the bending angle varied between 120° and 160°. It did not vary very much with the change in bending angle when the dip angle of the sub-cutter was between 5° and 65°. As shown in Figure 8f, the power consumption grew with an increase in the forward velocity when the bending angle varied between 120° and 140°. The opposite was true when the bending angle was between 140° and 160°. The influence of the bending angle on power consumption was positive when the forward velocity was between 0.15 m/s and 0.35 m/s, but it was negative when the forward velocity was in the range of 0.35 m/s–0.55 m/s. Figure 8g shows that power consumption rose with an increase in the rotating speed when the bending angle was in the range of 120°–160°. It gradually grew with an increase in the bending angle when the rotating speed was in the range of 120 r/min–320 r/min. As shown in Figure 8h, the power consumption gradually rose with an increase in the forward velocity when the dip angle of the sub-cutter was between 5° and 30°. It grew significantly with an increase in the forward velocity when the dip angle of the sub-cutter was between 30° and 65°. Actually, when the forward velocity was in the range of 0.15 m/s–0.55 m/s, the dip angle of the sub-cutter had a positive effect on the power consumption. Figure 8i reveals that the power consumption grew with an increase in the rotating speed when the dip angle of the sub-cutter varied between 5° and 65°. When the rotating speed was in the range of 120 r/min–320 r/min, the dip angle of the sub-cutter had a positive effect on power consumption. As shown in Figure 8j, the power consumption varied very slightly with an increase in the rotating speed when the forward velocity was in the range of 0.15 m/s–0.35 m/s, but it grew significantly with an increase in rotating speed when the forward velocity increased to 0.35 m/s–0.55 m/s. The influence of the forward velocity on power consumption was negative when the rotating speed was between 120 r/min and 220 r/min, but it was positive when the rotating speed was in the range of 220 r/min–320 r/min.

3.4. Parameter Optimization and Experimental Verification

3.4.1. Parameter Optimization

The purpose of optimizing the blade cutter’s structural and motion parameters in the pulping machine was to obtain the optimal parameter combination for the minimum power consumption at the maximum mud volume. Therefore, a mathematical model for the multi-objective optimization of the blade cutter’s splashing performance was established using Formula (7):
max M ( X 1 , X 2 , X 3 , X 4 , X 5 ) min P X 1 , X 2 , X 3 , X 4 , X 5 s . t 170   mm < X 1 < 190   mm 120 ° < X 2 < 160 ° 5 ° < X 3 < 65 ° 0.15   m / s < X 4 < 0.55   m / s 120   r / min < X 5 < 320   r / min
After the optimization based on the genetic algorithm using Matlab software 2018a, the blade’s structural and motion parameters for the optimal splashing performance of the blade cutter were determined as follows: X1 = 179.59 mm, X2 = 125.47°, X3 = 63.26°, X4 = 0.15 m/s, and X5 = 158.42 r/min. Considering the experimental operability, adjustments were made to these optimization conditions as follows: X1 = 180mm, X2 = 125°, X3 = 63°, X4 = 0.15 m/s, and X5 = 158 r/min. Under these conditions, the theoretical predicted mud volume splashed by the blade cutter was 30.92 Kg, and the theoretical predicted power consumption was 210.62 W.

3.4.2. Bench Test

In order to verify the accuracy of the numerical simulation optimizations of the blade cutter’s structural and motion parameters based on EDEM, bench tests were conducted based on the optimal parameter combination. A comparative analysis of the tests and the optimization results is provided in Table 5.
As indicated in Table 5, the theoretical mud volume splashed by the blade cutter during the operation of the pulping machine was higher than the experimental value and the theoretical power consumption was lower than the experimental value. The main reason for this might lie in the difference in splashed mud volume and power consumption caused by the error in mud moisture content, neglecting to consider air resistance, and inevitable friction and wear during operation. The mean relative error between the theoretical and experimental values of mud volume splashed by the blade cutter is 9.13%. This error is primarily caused by external conditions like temperature and humidity affecting the viscosity, density, and particle size of the mud during testing. Additionally, vibrations generated by the motor can disrupt the stability of the blade cutter, thereby influencing the motion and velocity of mud during operation and subsequently affecting the test results. The average relative error between the theoretical and experimental power consumption values of the blade cutter is 8.86%. This discrepancy primarily arises from the vibrations generated by the transmission device during testing, which leads to unstable cutter operation and, consequently, results in additional power consumption due to friction and collisions. Furthermore, motor vibrations can also impact the stability of spindle rotation, leading to an additional increase in power consumption. Although there are errors in theoretical modeling and experimental testing, they fall within acceptable limits, indicating that the blade-cutter operating-performance regression-forecast model exhibits a considerably high level of accuracy and feasibility with regard to the blade’s structural and motion parameters. Consequently, it can serve as a reliable theoretical foundation for parameter-combination optimization to enhance the operating performance of blade cutters in pulping machines. In future research endeavors, this prediction model can be further refined by considering all relevant factors and continuously optimizing its structure.
To obtain the operational performance after optimizing the blade cutter, the unit power consumption was used to evaluate the field capacity and benefit/cost ratio. The formula for unit power consumption is given in Formula (8). The unit power consumption measured after completing the bench tests is shown in Table 6.
U = P M
According to the bench test, the average unit power consumption of the blade cutter during operation was measured as 10.09 W/Kg before optimization. However, as shown in Table 6, after optimization, the average unit power consumption of the blade cutter reduced to 8.16 W/Kg, indicating a significant improvement in performance with a reduction of 19.13%.

4. Conclusions

The primary objective of this work was to study the enhancement in blade-cutter performance in pulping machines, aiming to enhance the production efficiency of seedling tray breeding. To accomplish this objective, simulation experiments were conducted to simulate and optimize the splashing performance of a blade cutter, resulting in optimal structural and motion parameters and unit power consumption. The key findings derived from this study are as follows:
  • Mud-volume and power-consumption regression-forecast models were developed separately, and they demonstrated a high reliability and flexibility. These constructed models can be effectively utilized to accurately predict blade-cutter splashing performance.
  • The mud volume was not significantly affected by factors such as the interaction between the dip angle of the sub-cutter and the turning radius, forward velocity, and rotating speed. The influence of the rotating speed on the mud volume and the bending angle on the power consumption was found to be insignificant. However, all other factors and their mutual effects had a significant impact on the blade cutter’s splashing performance.
  • A multi-objective and multi-variable method was employed to construct a model to optimize blade-cutter splashing performance. The results demonstrated that the optimal blade structural and motion parameters were a turning radius of 180 mm with a bending angle of 125°, a sub-cutter dip angle of 63°, a forward velocity of 0.15 m/s, and a rotating speed of 158 r/min. Furthermore, bench test verification confirmed that the experimental results aligned closely with those obtained through simulations, exhibiting mean relative errors in mud volume and power consumption of only 9.13% and 8.86%, respectively. Additionally, a reduction in unit power consumption of 19.13% for the blade cutter was observed. These findings demonstrate that these optimized parameters meet the operational requirements of paddy field pulping machines.

Author Contributions

Conceptualization, J.R.; methodology, J.R.; software, C.C.; validation, S.Z.; formal analysis, C.C.; investigation, D.B.; resources, W.W.; data curation, D.B.; writing—original draft preparation, J.R.; writing—review and editing, J.R.; visualization, W.W.; supervision, S.Z. and W.W.; project administration, S.Z.; funding acquisition, S.Z. All authors have read and agreed to the published version of the manuscript.

Funding

This research was funded by the school fund of Fujian Agriculture and Forestry University (grant number K1520005A05); Fujian University Engineering Research Center for Modern Agricultural Equipment (grant number PTJH17004), and Fujian Provincial Science Foundation of China (grant number 2017N0004).

Institutional Review Board Statement

Not applicable.

Data Availability Statement

The data will be made available upon reasonable request from the corresponding authors.

Acknowledgments

The authors would like to express gratitude to Huang Wenbin from Chongqing University and their laboratory, as well as to Fujian University Engineering Research Center for Modern Agricultural Equipment and the reviewers who provided helpful suggestions for this manuscript.

Conflicts of Interest

The authors declare no conflicts of interest.

References

  1. Jiang, M.; Li, X.; Xin, L.; Tan, M. Paddy Rice Multiple Cropping Index Changes in Southern China: Impacts on National Grain Production Capacity and Policy Implications. J. Geogr. Sci. 2019, 29, 1773–1787. [Google Scholar] [CrossRef]
  2. Celik, A.; Raper, R.L. Design and Evaluation of Ground-Driven Rotary Subsoilers. Soil Tillage Res. 2012, 124, 203–210. [Google Scholar] [CrossRef]
  3. Zhao, H.; Li, H.; Ma, S.; He, J.; Wang, Q.; Lu, C.; Zheng, Z.; Zhang, C. The Effect of Various Edge-Curve Types of Plain-Straight Blades for Strip Tillage Seeding on Torque and Soil Disturbance Using DEM. Soil Tillage Res. 2020, 202, 104674. [Google Scholar] [CrossRef]
  4. Du, J.; Heng, Y.; Zheng, K.; Luo, C.; Zhu, Y.; Zhang, J.; Xia, J. Investigation of the Burial and Mixing Performance of a Rotary Tiller Using Discrete Element Method. Soil Tillage Res. 2022, 220, 105349. [Google Scholar] [CrossRef]
  5. Zhang, Z.; Chen, Z.; Lai, Q.; Huseyin, G. Preliminary Investigation of Convergent Evolution-Inspired Serrated Structure for Optimization of Mini Rotavator Blade’s Cutting-Edge. Appl. Eng. Agric. 2023, 39, 95–108. [Google Scholar] [CrossRef]
  6. He, C.; You, Y.; Wang, D.; Wang, G.; Lu, D.; Kaji, J.M. The Effect of Tine Geometry During Vertical Movement on Soil Penetration Resistance Using Finite Element Analysis. Comput. Electron. Agric. 2016, 130, 97–108. [Google Scholar] [CrossRef]
  7. Chen, Z.; Gu, J.; Yang, X. A Novel Rigid Wheel for Agricultural Machinery Applicable to Paddy Field with Muddy Soil. J. Terramech. 2020, 87, 21–27. [Google Scholar] [CrossRef]
  8. Zhai, S.; Shi, Y.; Zhou, J.; Liu, J.; Huang, D.; Zou, A.; Jiang, P. Simulation Optimization and Experimental Study of the Working Performance of a Vertical Rotary Tiller Based on the Discrete Element Method. Actuators 2022, 11, 342. [Google Scholar] [CrossRef]
  9. Zhang, L.; Zhai, Y.; Chen, J.; Zhang, Z.; Huang, S. Optimization design and performance study of a subsoiler underlying the tea garden subsoiling mechanism based on bionics and EDEM. Soil Tillage Res. 2022, 220, 105375. [Google Scholar] [CrossRef]
  10. Tamas, K.; Jori, I.J.; Mouazen, A.M. Modelling Soil-Sweep Interaction with Discrete Element Method. Soil Tillage Res. 2013, 134, 223–231. [Google Scholar] [CrossRef]
  11. Li, B.; Chen, Y.; Chen, J. Modeling of Soil-Claw Interaction Using the Discrete Element Method (DEM). Soil Tillage Res. 2016, 158, 177–185. [Google Scholar] [CrossRef]
  12. Mustafa, U.; Chris, S.; Li, P.; Lee, S. Analyzing the Mixing Performance of a Rotary Spader Using Digital Image Processing and Discrete Element Modelling (DEM). Comput. Electron. Agric. 2018, 151, 1–10. [Google Scholar]
  13. Zeng, Z.; Chen, Y.; Zhang, X. Modelling the Interaction of a Deep Tillage Tool with Heterogeneous Soil. Comput. Electron. Agric. 2017, 143, 130–138. [Google Scholar] [CrossRef]
  14. Gao, J.; Qi, H. Soil Throwing Experiments for Reverse Rotary Tillage at Various Depths, Travel Speeds, and Rotational Speeds. Trans. ASABE 2017, 60, 1113–1121. [Google Scholar] [CrossRef]
  15. Gao, J.; Shen, Y.; Ma, B. Optimized Design of Touching Parts of Soil Disinfection Machine Based on Strain Sensing and Discrete Element Simulation. Sensors 2023, 23, 6369. [Google Scholar] [CrossRef]
  16. Ahmadi, I. A Torque Calculator for Rotary Tiller Using the Laws of Classical Mechanics. Soil Tillage Res. 2017, 165, 137–143. [Google Scholar] [CrossRef]
  17. Yuan, Y.; Wang, J.; Zhang, X.; Zhao, S. Study on Tillage Resistance and Energy Consumption of a Plain Straight Rotary Blade for Strip Tillage. Eng. Agric. 2023, 43, e20220127. [Google Scholar] [CrossRef]
  18. Liu, J.; Jiang, P.; Chen, J.; Zhang, X.; Xu, M.; Huang, D.; Shi, Y. Optimal Design of and Experiment on a Dual-Spiral Ditcher for Orchards. Agriculture 2023, 13, 1628. [Google Scholar] [CrossRef]
  19. Zhao, Z.; Wang, D.; Shang, S.; Hou, J.; He, X.; Gao, Z.; Xu, N.; Chang, Z.; Guo, P.; Zheng, X. Analysis of Cyperus esculentus–Soil Dynamic Behavior during Rotary Tillage Based on Discrete Element Method. Agriculture 2023, 13, 358. [Google Scholar] [CrossRef]
  20. Ahmad, F.; Qiu, B.; Ding, Q.; Ding, W.; Khan, Z.; Shoaib, M.; Chandio, F.; Rehim, A.; Khaliq, A. Discrete element method simulation of disctype furrow openers in paddy soil. Int. J. Agric. Biol. Eng. 2020, 13, 103–110. [Google Scholar]
  21. Matin, M.A.; Fielke, J.M.; Desbiolles, J. Furrow Parameters in Rotary Strip-Tillage: Effect of Blade Geometry and Rotary Speed. Biosyst. Eng. 2014, 118, 7–15. [Google Scholar] [CrossRef]
  22. Matin, M.A.; Fielke, J.M.; Desbiolles, J. Torque and Energy Characteristics for Strip-Tillage Cultivation When Cutting Furrows Using Three Designs of Rotary Blade. Biosyst. Eng. 2015, 129, 329–340. [Google Scholar] [CrossRef]
  23. Matin, M.A.; Desbiolles, J.M.A.; Fielke, J.M. Strip-Tillage Using Rotating Straight Blades: Effect of Cutting Edge Geometry on Furrow Parameters. Soil Tillage Res. 2016, 155, 271–279. [Google Scholar] [CrossRef]
  24. Sun, J.; Chen, H.; Wang, Z.; Ou, Z.; Yang, Z.; Liu, Z.; Duan, J. Study on Plowing Performance of Edem Low-Resistance Animal Bionic Device Based on Red Soil. Soil Tillage Res. 2020, 196, 104336. [Google Scholar] [CrossRef]
  25. Balsari, P.; Biglia, A.; Comba, L.; Sacco, D.; Eloi Alcatrão, L.; Varani, M.; Mattetti, M.; Barge, P.; Tortia, C.; Manzone, M.; et al. Performance Analysis of a Tractor-Power Harrow System under Different Working Conditions. Biosyst. Eng. 2021, 202, 28–41. [Google Scholar] [CrossRef]
  26. Singh, A.; Singh, L.P.; Singh, S.; Singh, H.; Chhuneja, N.K.; Singh, M. Evaluation and Analysis of Occupational Ride Comfort in Rotary Soil Tillage Operation. Measurement 2019, 131, 19–27. [Google Scholar] [CrossRef]
  27. Fajardo, A.L.; Suministrado, D.C.; Peralta, E.K.; Bato, P.M.; Paningbatan, E.P., Jr. Force and Puddling Characteristics of the Tilling Wheel of Float-Assisted Tillers at Different Lug Angle and Shaft Speed. Soil Tillage Res. 2014, 140, 118–125. [Google Scholar] [CrossRef]
  28. Li, S.; Chen, X.; Chen, W.; Zhu, S.; Li, Y.; Yang, L.; Xie, S.; Yang, M. Soil-cutting Simulation and Parameter Optimization of Handheld Tiller’s Rotary Blade by Smoothed Particle Hydrodynamics Modelling and Taguchi Method. J. Clean. Prod. 2018, 179, 55–62. [Google Scholar] [CrossRef]
  29. Tong, Z.; Li, L.; Zhang, X.; Chen, Y.; Liu, X.; Zhou, P.; Xia, Y. Design and Experiment of the Components for Soil Flow Direction Control of Hilling Machine Based on EDEM. Int. J. Agric. Biol. Eng. 2022, 15, 122–131. [Google Scholar] [CrossRef]
  30. Jat, D.; Imran, S.S.; Singh, K.P. Development and Evaluation of Garlic Harvester for Raised Beds. J. Sci. Ind. Res. 2023, 82, 493–503. [Google Scholar]
  31. Shi, Y.; Wang, X.; Hu, Z.; Gu, F.; Wu, F.; Chen, Y. Optimization and Experiment on Key Structural Parameters of No-Tillage Planter with Straw-Smashing and Strip-mulching. Int. J. Agric. Biol. Eng. 2021, 14, 91–96. [Google Scholar] [CrossRef]
  32. Xie, Y.; Ferng, Y.; Miao, J.; Ren, J.; Zhang, X. Numerical and Experimental Study on Optimization of Paddy Field Blade Used in Initial Mud-Cutting Process. Comput. Electron. Agric. 2020, 170, 105243. [Google Scholar] [CrossRef]
  33. Xie, Y.; Hong, Y.; Zhang, X.; Ren, J. Analysis of Mud Splashing Pattern of Paddy Field Blade Using Computational Fluid Dynamics. Comput. Electron. Agric. 2020, 176, 105639. [Google Scholar] [CrossRef]
  34. Chen, C.; Di, Z.; Chen, W.; Zheng, S.; Ren, J. Structure Parameter Design and Bench Test Research of Paddy Field Blades. Sci. Rep. 2022, 12, 14733. [Google Scholar] [CrossRef] [PubMed]
  35. Ding, Q.; Lu, X.; Sun, K.; Li, Y.; He, R.; Wang, X. Performance and Design Parameter Definition on Puddling Knife Using Reverse Engineering. Trans. Chin. Soc. Agric. Mach. 2021, 52, 68–74. (In Chinese) [Google Scholar]
  36. Xu, C.; Zhang, C.; Li, L.; Li, M. Optimization of Working Parameters for Puddling and Flatting Machine in Paddy Field. Int. J. Agric. Biol. Eng. 2016, 9, 88–96. [Google Scholar]
  37. Jeon, C.; Kim, H.; Yun, C.; Park, S.; Hwang, Y.; Han, X. Autonomous Paddy Field Puddling and Leveling Operations Based on Full-Coverage Path Generation and Tracking. Precis. Agric. 2023, 25, 235–256. [Google Scholar] [CrossRef]
  38. Ma, C.; Yi, S.; Tao, G. A Rotary Blade Design for Paddy Fields with Long Rice Straw Based on EDEM. Eng. Agric. 2023, 43, e20220062. [Google Scholar] [CrossRef]
  39. Zhang, Y.; Tian, L.; Cao, C.; Zhu, C.; Qin, K.; Ge, J. Optimization and Validation of Blade Parameters for Inter-Row Weeding Wheel in Paddy Fields. Front. Plant Sci. 2022, 13, 1003471. [Google Scholar] [CrossRef]
Figure 1. The process of mud splashing using a blade cutter. (a) Top view; (b) front view.
Agriculture 14 00132 g001
Figure 2. Structure of a blade cutter. (a) Front view; (b) top view; (c) assembly drawings; and (d) example of a blade cutter.
Agriculture 14 00132 g002
Figure 3. Simulation model for the blade cutter’s splashing operation.
Agriculture 14 00132 g003
Figure 4. Computational cycle process of particle motion.
Agriculture 14 00132 g004
Figure 5. Testing apparatus. (a) Device body; (b) side view.
Agriculture 14 00132 g005
Figure 6. Influence of single factors on the blade cutter’s splashing performance. (a) Mud volume; (b) power consumption.
Agriculture 14 00132 g006
Figure 7. Diagram of response surfaces for the influence of interacting factors on volume splashed. (a) Turning radius and bending angle; (b) turning radius and forward velocity; (c) turning radius and rotating speed; (d) bending angle and dip angle of the sub-cutter; (e) bending angle and forward velocity; (f) bending angle and rotating speed; and (g) forward velocity and rotating speed.
Agriculture 14 00132 g007aAgriculture 14 00132 g007b
Figure 8. Diagram of response surfaces for the influence of interacting factors on power consumption. (a) Turning radius and bending angle; (b) turning radius and dip angle of the sub-cutter; (c) turning radius and forward velocity; (d) turning radius and rotating speed; (e) bending angle and dip angle of the sub-cutter; (f) bending angle and forward velocity; (g) bending angle and rotating speed; (h) dip angle of the sub-cutter and forward velocity; (i) dip angle of the sub-cutter and rotating speed; and (j) forward velocity and rotating speed.
Agriculture 14 00132 g008
Table 1. Contact parameters.
Contact ParametersCoefficientValue
Upper—Upper water particlesRestitution coefficient0.60
Static friction coefficient0.20
Dynamic friction coefficient0.29
Lower—Lower soil particlesRestitution coefficient0.12
Static friction coefficient0.50
Dynamic friction coefficient0.28
Blade cutter—Upper water
particles
Restitution coefficient0.05
Static friction coefficient0.05
Dynamic friction coefficient0.01
Blade cutter—Lower soil
particles
Restitution coefficient0.05
Static friction coefficient0.05
Dynamic friction coefficient0.01
Upper—Lower soil particlesRestitution coefficient0.05
Static friction coefficient0.05
Dynamic friction coefficient0.01
Table 2. Experimental factors and codes.
Factor LevelTurning
Radius X1 (mm)
Bending
Angle X2 (°)
Dip Angle of the Sub-Cutter X3 (°)Forward
Velocity X4 (m/s)
Rotating Speed X5 (r/min)
−217012050.15120
−1175130200.25170
0180140350.35220
1185150500.45270
2190160650.55320
Table 3. Test plan and data.
Test NoX1 (mm)X2 (°)X3 (°)X4 (m/s)X5 (r/min)M (kg)P (W)
1175130500.2517025.91255.04
2180140350.3522020.43236.56
3180140350.5522018.4252.62
4190140350.3522020.79233.73
5185150200.4517013.61190.23
6180140350.3512019.03193.26
7175150500.2527018.23261.85
8175130200.2527013.88169.11
9175150500.4517012.77200.79
10185150500.2517019.07209.73
11175150200.4527014.1175.55
12180140350.3532018.36244.23
13180140350.3522020.71236
14185130200.2517020.91219.52
15180140350.3522020.11237.79
16180140350.3522021.51234.79
17180140350.1522022.02249.02
18180140350.3522020.22236.17
19175130500.4527019.95313.37
20175150200.2517021.03259.01
21180140650.3522023285.26
22175130200.4517016.79185.67
23180120350.3522022.02225.24
2418014050.3522016.46208.99
25185130500.4517023.03235.23
26180140350.3522020.04236.7
27180140350.3522021.21237.79
28180140350.3522020.72236.71
29185130500.2527024.15209.32
30180140350.3522019.91229.79
31185150500.4527018.49320.7
32185150200.2527019.55245.72
33185130200.4527021.77263.89
34180160350.3522014.23224.64
35180140350.3522020.71236.79
36170140350.3522017.41219.83
Table 4. The ANOVA results for the experimental indexes.
Source of
Variance
Mud VolumePower Consumption
F1 ValueSignificance Level P1F2 ValueSignificance Level P2
Model47.03 <0.0001273.41 <0.0001
X175.84 <0.000163.71 <0.0001
X2253.10 <0.00010.78 0.3924
X3135.73 <0.00011245.80 <0.0001
X4108.23 <0.000124.67 0.0002
X52.35 0.1458577.26 <0.0001
X1  X214.27 0.001838.31 <0.0001
X1  X30.87 0.3658319.73 <0.0001
X1  X414.02 0.0020352.50 <0.0001
X1  X558.31 <0.0001253.04 <0.0001
X2  X370.21 <0.000125.18 0.0002
X2  X445.52 <0.0001506.50 <0.0001
X2  X521.59 0.000364.90 <0.0001
X3  X43.05 0.1010415.56 <0.0001
X3  X51.79 0.2008386.55 <0.0001
X4  X568.88 <0.0001938.90 <0.0001
X1211.22 0.004428.18 <0.0001
X2232.98 <0.000139.81 <0.0001
X323.310.088933.06 <0.0001
X420.420.526960.19 <0.0001
X5218.850.000693.63 <0.0001
Lack of fit1.600.25351.65 0.239
Note: P < 0.01 (extremely significant); 0.01 ≤ P < 0.05 (significant).
Table 5. Comparison of optimization results and test values.
Test IndexTest NumberTheoretical ValueTest ResultsRelative Error/%
Mud volume
(M/Kg)
130.9228.568.26%
230.9228.339.14%
330.9227.9210.75%
430.9228.159.84%
530.9228.717.70%
Average value30.9228.339.13%
Power
consumption
(P/W)
1210.62230.678.69%
2210.62226.837.15%
3210.62235.3210.50%
4210.62233.289.71%
5210.62229.368.17%
Average value210.62231.098.86%
Table 6. Unit power consumption values.
Test NumberMud Volume
(M/Kg)
Power Consumption
(P/W)
Unit Power Consumption
(W/Kg)
128.56230.678.08
228.33226.838.01
327.92235.328.43
428.15233.288.29
528.71229.367.99
Average value28.33231.098.16
Disclaimer/Publisher’s Note: The statements, opinions and data contained in all publications are solely those of the individual author(s) and contributor(s) and not of MDPI and/or the editor(s). MDPI and/or the editor(s) disclaim responsibility for any injury to people or property resulting from any ideas, methods, instructions or products referred to in the content.

