Article

Monitoring of Wheat Fusarium Head Blight on Spectral and Textural Analysis of UAV Multispectral Imagery

1
College of Information and Management Science, Henan Agricultural University, Zhengzhou 450046, China
2
Henan Key Laboratory of Agrometeorological Support and Applied Technique, Zhengzhou 450003, China
3
Henan Institute of Meteorological Sciences, Zhengzhou 450003, China
*
Author to whom correspondence should be addressed.
Agriculture 2023, 13(2), 293; https://doi.org/10.3390/agriculture13020293
Submission received: 8 January 2023 / Revised: 21 January 2023 / Accepted: 23 January 2023 / Published: 26 January 2023

Abstract

:
Crop disease identification and monitoring is an important research topic in smart agriculture. In particular, it is a prerequisite for disease detection and the mapping of infected areas. Wheat fusarium head blight (FHB) is a serious threat to the quality and yield of wheat, so the rapid monitoring of wheat FHB is important. This study proposed a method based on unmanned aerial vehicle (UAV) low-altitude remote sensing and multispectral imaging technology combined with spectral and textural analysis to monitor FHB. First, the multispectral imagery of the wheat population was collected by UAV. Second, 10 vegetation indices (VIs)were extracted from multispectral imagery. In addition, three types of textural indices (TIs), including the normalized difference texture index (NDTI), difference texture index (DTI), and ratio texture index (RTI) were extracted for subsequent analysis and modeling. Finally, VIs, TIs, and VIs and TIs integrated as the input features, combined with k-nearest neighbor (KNN), the particle swarm optimization support vector machine (PSO-SVM), and XGBoost were used to construct wheat FHB monitoring models. The results showed that the XGBoost algorithm with the fusion of VIs and TIs as the input features has the highest performance with the accuracy and F1 score of the test set being 93.63% and 92.93%, respectively. This study provides a new approach and technology for the rapid and nondestructive monitoring of wheat FHB.

1. Introduction

Wheat is one of the three major grain crops in the world, and it is also the second-largest grain crop in China [1]. It is also a staple food for about two-thirds of the world’s population, which is of a great significance to ensure national food security [2,3]. Fusarium head blight (FHB), also known as scab, is an economically destructive wheat disease mainly caused by Fusarium graminearum, which mainly damages wheat ears [4]. The prevention and control of FHB is extraordinarily important because FHB cannot only cause a serious yield reduction but it can also lead to the deterioration of the wheat’s quality [5,6,7]. More seriously, infected wheat will produce mycotoxins, especially deoxynivalenol (DON) and zearalenone (ZEA), which are detrimental to humans and animals and can lead to acute poisoning symptoms, the destruction of immunity, and even death [8]. Therefore, the effective monitoring of FHB in time and space is particularly important in the investigation of crop health and food security.
The traditional disease assessment and investigation is mainly based on a field visual investigation, which is not only time-consuming and laborious but also has a certain subjectivity and cannot ensure the authenticity and accuracy of the investigation data [9,10]. It is difficult to meet the current requirements for the rapid and accurate detection and real-time monitoring of crop diseases in large-scale planting areas [11]. Remote sensing technology has alleviated this problem to a certain extent, so more and more researchers are attempting to apply remote sensing technology to disease monitoring [12,13]. These studies are based on the theory that disease infection will change the transpiration rate, leaf color, chlorosis, and morphology of crops [13,14]. In particular, UAV remote sensing technology has been widely developed in the field of agricultural monitoring because of its high flexibility, low cost, fast image acquisition, and ability to carry multiple sensors [15].
Some studies have been conducted to use UAV images to retrieve the growth parameters of different crops [16,17,18,19]. In recent years, multispectral imagery provides new concepts and methods for crop disease monitoring. Compared with the traditional methods and hyperspectral imagery, multispectral imagery has the advantages of relatively rich spectral information, simple data processing, and a low computing cost in disease detection and it has a certain potential in crop disease monitoring applications. In addition, it has a red-edge (RE) band, which is located between the maximum red absorption and high reflectivity in the near infrared (NIR) region. It is an important spectral feature of vegetation, where the transformation from chlorophyll absorption to cell scattering takes place [3,20]. So far, UAV multispectral images have been used to estimate the chlorophyll content, nitrogen content, biomass, and leaf area index (LAI) [21,22,23,24]. In addition, they have been also used by some scholars to monitor the diseases of different crops. Lei et al. [25] achieved the severity monitoring of the yellow leaf disease of areca nut using VIs such as the normalized difference vegetation index (NDVI) and normalized difference red-edge index (NDRE) and using support vector machine (SVM) and decision trees algorithms. Zhao et al. [26] used VIs to monitor rice sheath blight and the results showed that using multispectral imagery was more accurate and sensitive (R2 = 0.624, RMSE = 0.801), which was better than visible light imagery (R2 = 0.580, RMSE = 0.847). Rodriguez et al. [27] used five machine learning algorithms, including random forest (RF) and a linear support vector classifier, to monitor potato late blight based on UAV multispectral imagery. Ye et al. [28] used artificial neural network (ANN), RF, and SVM classification algorithms to monitor banana fusarium wilt using UAV multispectral imagery. These studies fully illustrate the potential of using high-resolution UAV multispectral images in the agricultural field. Additionally, the majority of studies on the disease monitoring of crops used the spectral information of UAV images, but the inherent spatial information in the form of texture has not been fully explored. Therefore, it would be promising to take full advantage of the textural feature for the disease monitoring of crops.
Textural analysis is an image processing technique that is widely used for classification tasks [29,30]. The textural feature reflects the visual roughness of ground objects through gray spatial change and its repeatability, which can fully reflect the image characteristics. Different objects generally show different texture types, which can be used to describe and identify ground objects. The overall representation of the same category of characteristics seems similar, but the local detail is different [31]. It has a certain effect on the recognition of crop diseases and the improvement of their accuracy [32]. In recent years, textural analysis has also been used for the estimation of crop biomass and LAI [33,34,35]. Zheng et al. [30] compared the performance of VIs, raw textural features, the NDTI, and combinations of VIs and the NDTI for estimating the aboveground biomass of rice using UAV multispectral data and found that integrating the NDTI with VIs significantly improved the accuracy compared to using spectral information alone. Li et al. [35] combined color indices and textural features for estimating rice LAI and exhibited the best estimation accuracy when the VIs and textural features were combined as the inputs. Some scholars have also introduced primitive textural features for disease identification and monitoring [13,36]. These studies all showed the potential of combining spectral information with textural information.
However, most of the studies used only raw textural features, and the contribution of textural features did not reach satisfactory results. In addition, few research scholars have focused on the potential of TIs for disease monitoring. So, in this study, we proposed a method that integrated VIs and TIs to monitor wheat FHB. UAV multispectral imagery was used to monitor wheat FHB. The specific work of this study is as follows: (1) 10 commonly used VIs (VARI, CIgreen, CIrededge, DVI, DVIRE, EVI, NDRE, NDVI NPCI, and RVI) were extracted. In addition, three types of TIs, which are NDTI, DTI, and RTI, were constructed to make the most use of the textural information of the imagery. (2) The obtained features were screened to obtain the features sensitive to wheat FHB. (3) Nine wheat FHB monitoring models were constructed with VIs, TIs, and integrated VIs and TIs as the input features to explore the effects of different feature inputs on wheat FHB monitoring. (4) The best FHB monitoring models were applied to map the distribution of wheat diseases in the study area and evaluate the potential of using UAV multispectral imagery to monitor wheat diseases.

2. Materials and Methods
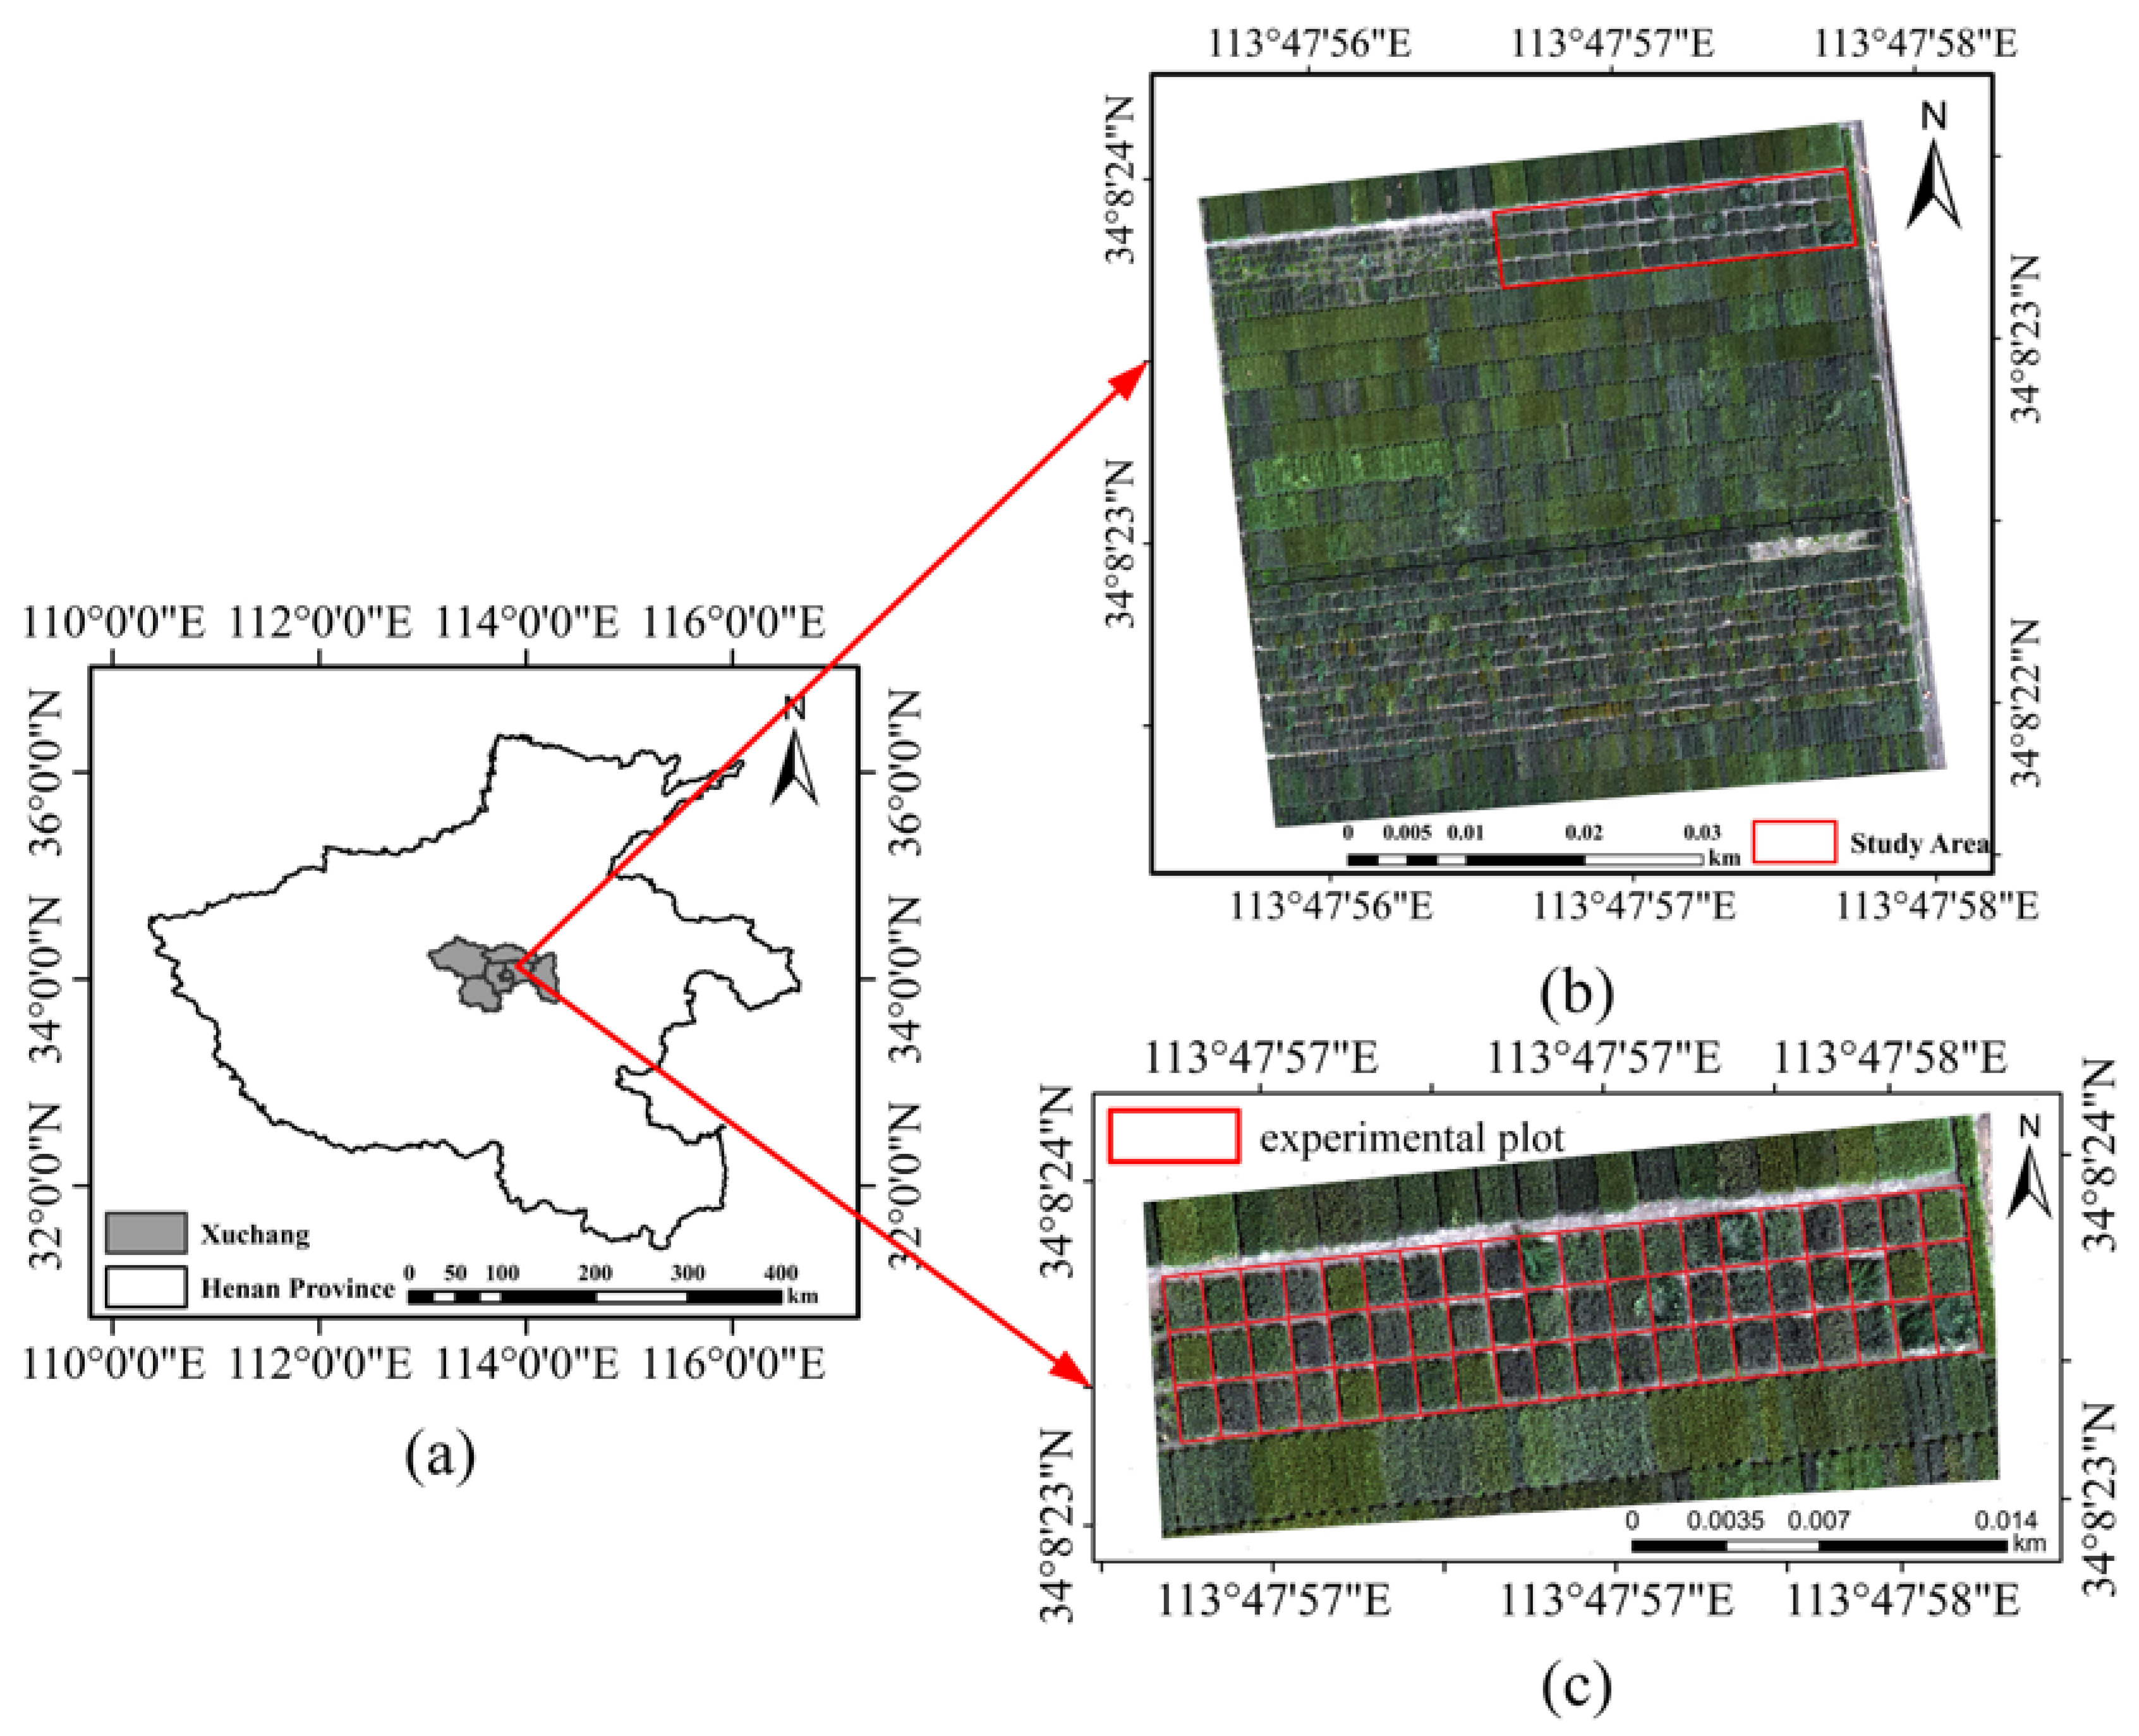
2.1. Study Area

The experiment site was conducted on May 18, 2021 at the experimental farm (34°08′23″ N, 113°47′57″ E) on the Xuchang Campus of Henan Agricultural University, Xuchang City, Henan Province. At this time, the wheat was growing in the wheat field and it was at the grain filling stage. Xuchang is located in the central part of Henan Province. It has a typical temperate and continental monsoon climate. The annual average temperature ranges from 14.3 °C to 14.6 °C and the annual average precipitation is between 671 mm and 736 mm.
Figure 1 demonstrates the study area. The terrain of the experimental farm was relatively flat and the soil belonged to loam. In the previous season, maize was the main grain crop. The study area consisted of 60 experimental plots; they were divided into 3 rows for planting and each row contained 20 experimental plots. The length of each experimental plot was about 1.5 m and the width was about 1 m. During the period from 2019 to 2020, the experimental wheat varieties were sown in autumn. The management measures, such as irrigation and fertilization, in the experimental plots were all the same. At the early stage of wheat flowering in April 2021, professionals randomly selected some wheat plants in each experimental plot and used a micropipette to inject the spore suspension made of fusarium oxysporum into the florets in the middle and upper part of the wheat ear. The inoculated wheat ears were marked with awn cutting and bagged for 1~7 days. The incidence mainly depended on an artificial drip and mutual infection.

2.2. Field Data Acquisition and Preprocessing

2.2.1. Remote Sensing Image Acquisition and Preprocessing

In this study, the UAV remote sensing platform used was Phantom 4 Multispectral (P4M). There are several built-in sensors in the P4M which make it a dedicated and customized UAV for the detection and identification of plants or crops. Multispectral cameras were available in the P4M and included six CMOS sensors, one of which was used for RGB visible light imaging, and the other five monochrome sensors were used for multispectral imaging (blue (B), green (G), red (R), RE and NIR). The UAV had a takeoff weight of 1487 g, a maximum ascending speed of 6 m/s, a maximum descending speed of 3 m/s, and a flight time of approximately 27 min. To detect millisecond errors in the camera imaging time, the TimeSync time synchronization system was adopted. The remote sensing images of the study area in five bands were obtained on 18 May 2021. The UAV remote sensing operation was carried out on a sunny day with a low wind speed. The flight time was between 9:00 a.m. and 11:00 a.m., the flight altitude was 20.3 m, the heading overlap and the lateral overlap were 80%, and the ground resolution was 1 cm.
Using Pix4Dmapper, the original images captured by the UAV were spliced together. First, with the flight POS data, the same-named points were found and then the real positions and splicing parameters of the original images were calculated through a space–time measurement to establish the point cloud model. Finally, according to the calibration ground panel used before and after the flight, the pixel values were converted into the surface reflectivity of each spectrum and the imagery is automatically calibrated and generated into orthophoto imagery by optimizing the image content and using the block adjustment technology [37].

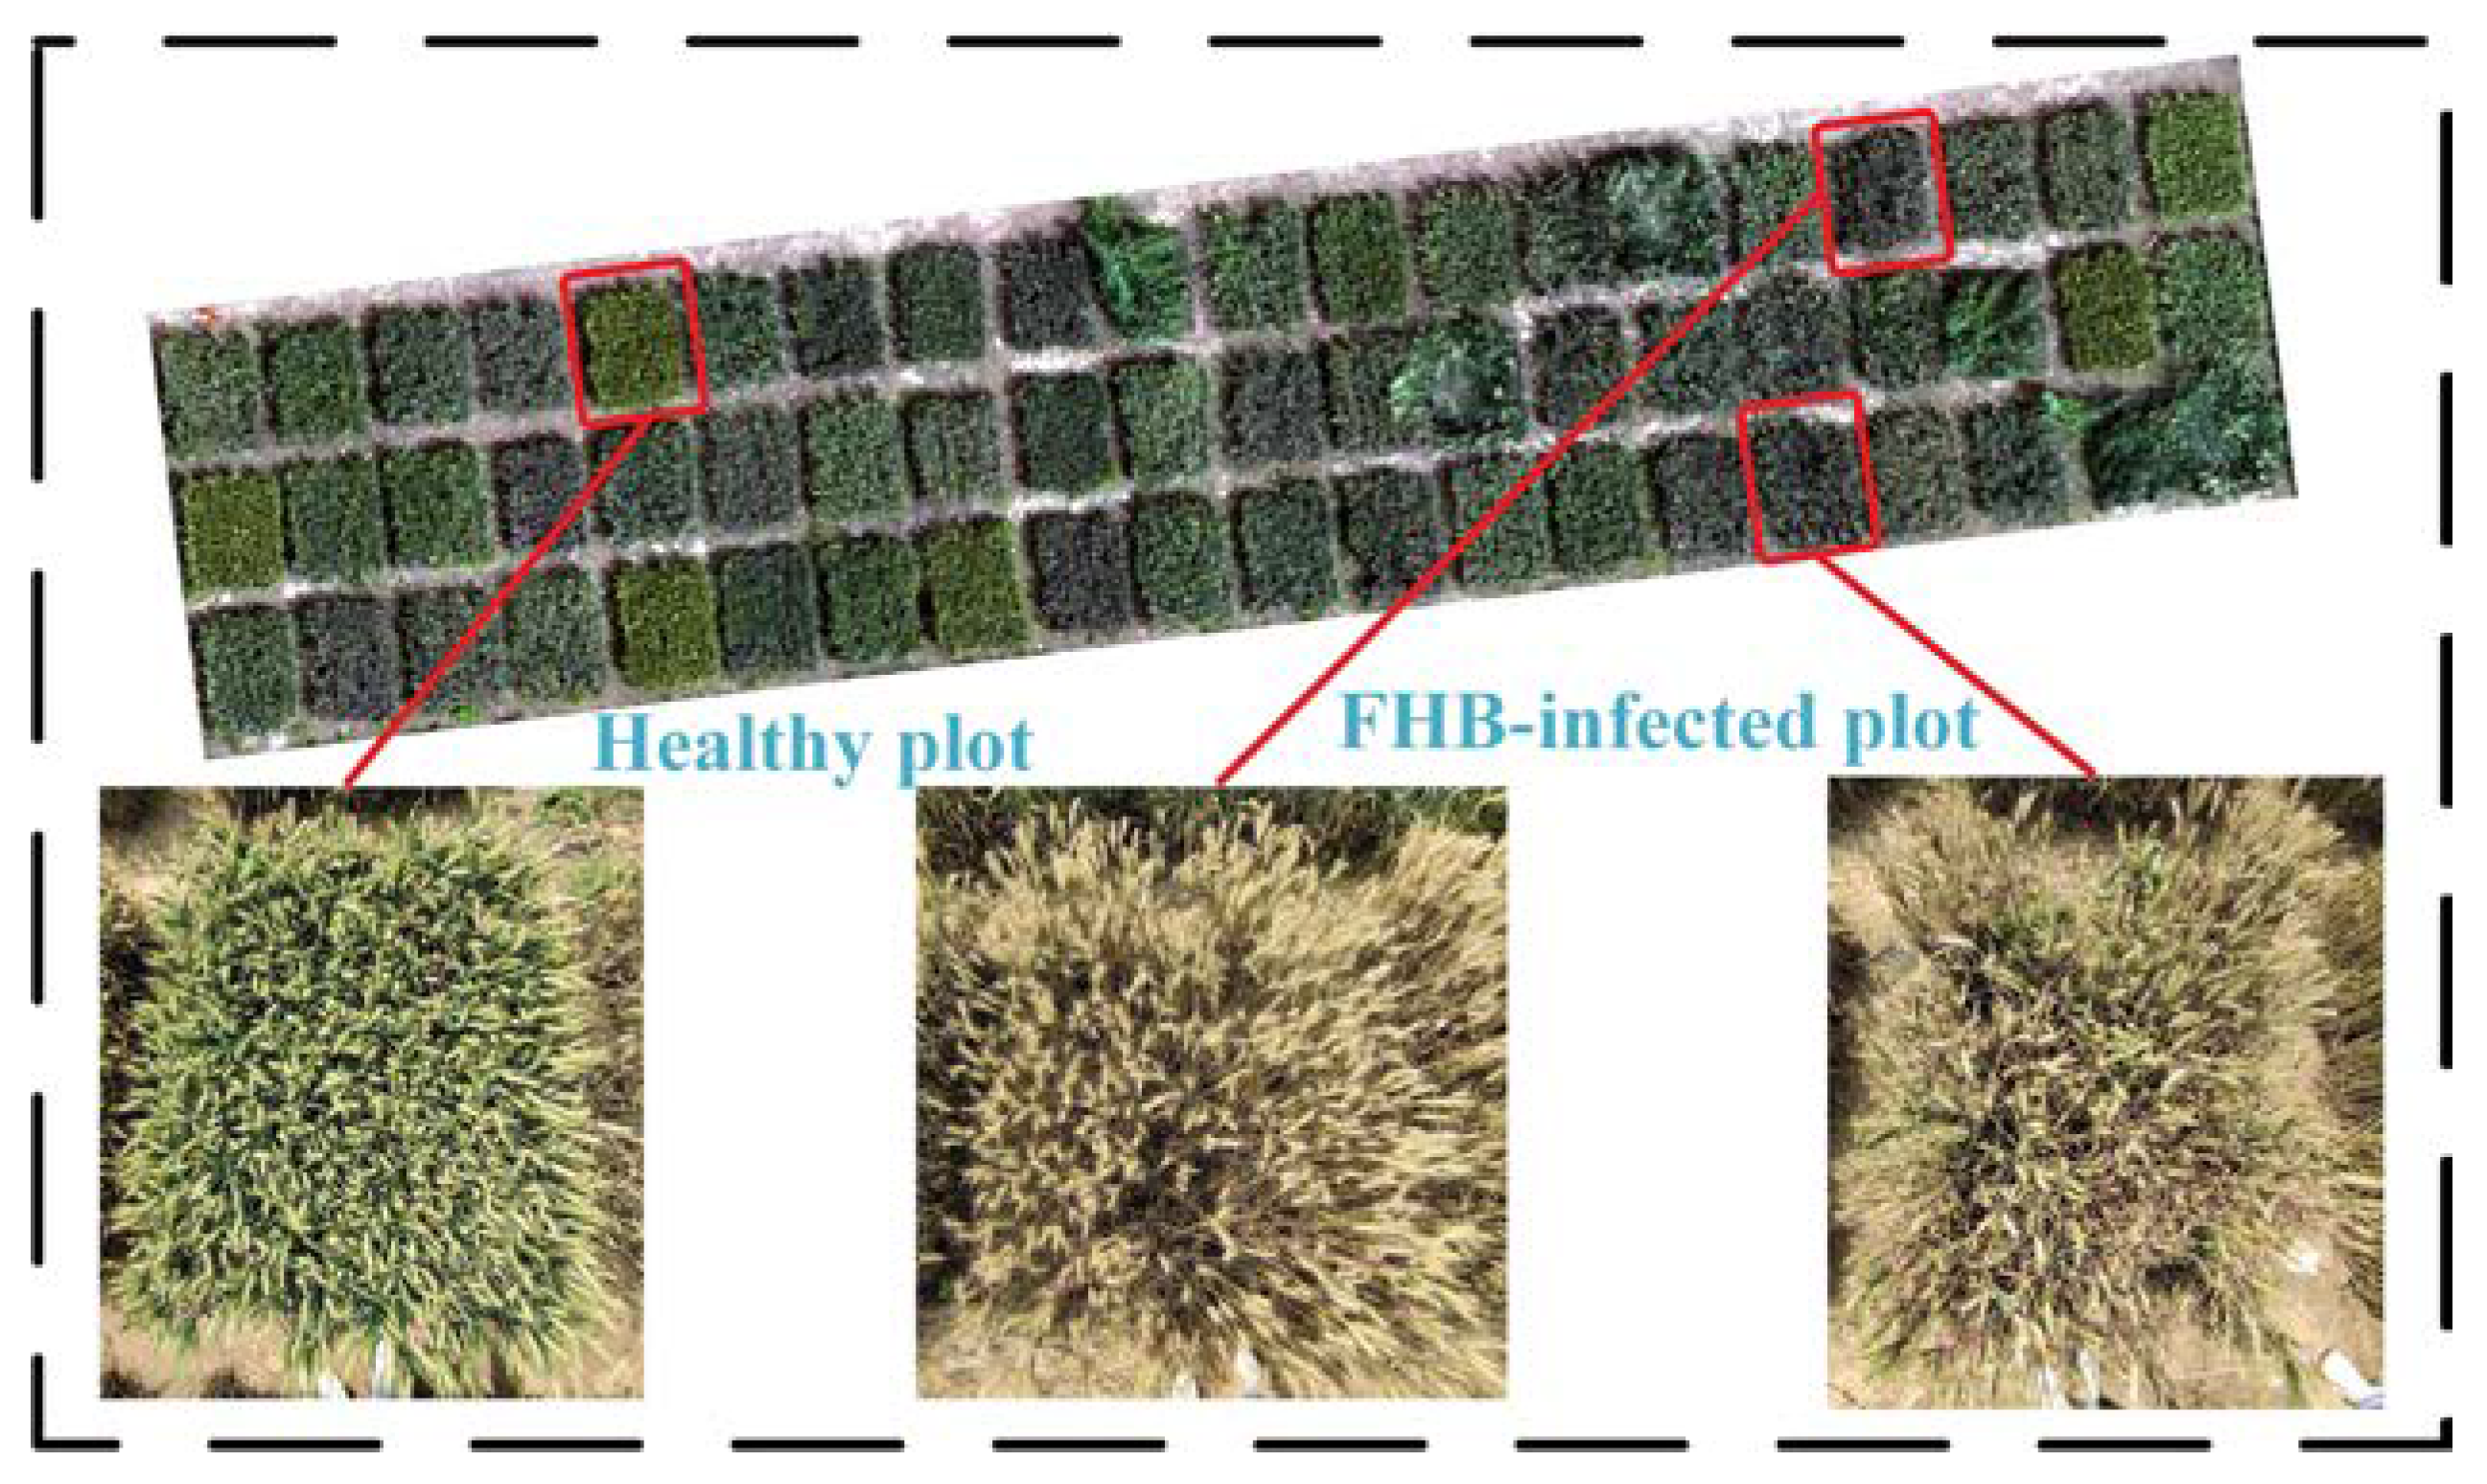
2.2.2. Selection of Survey Sampling Points
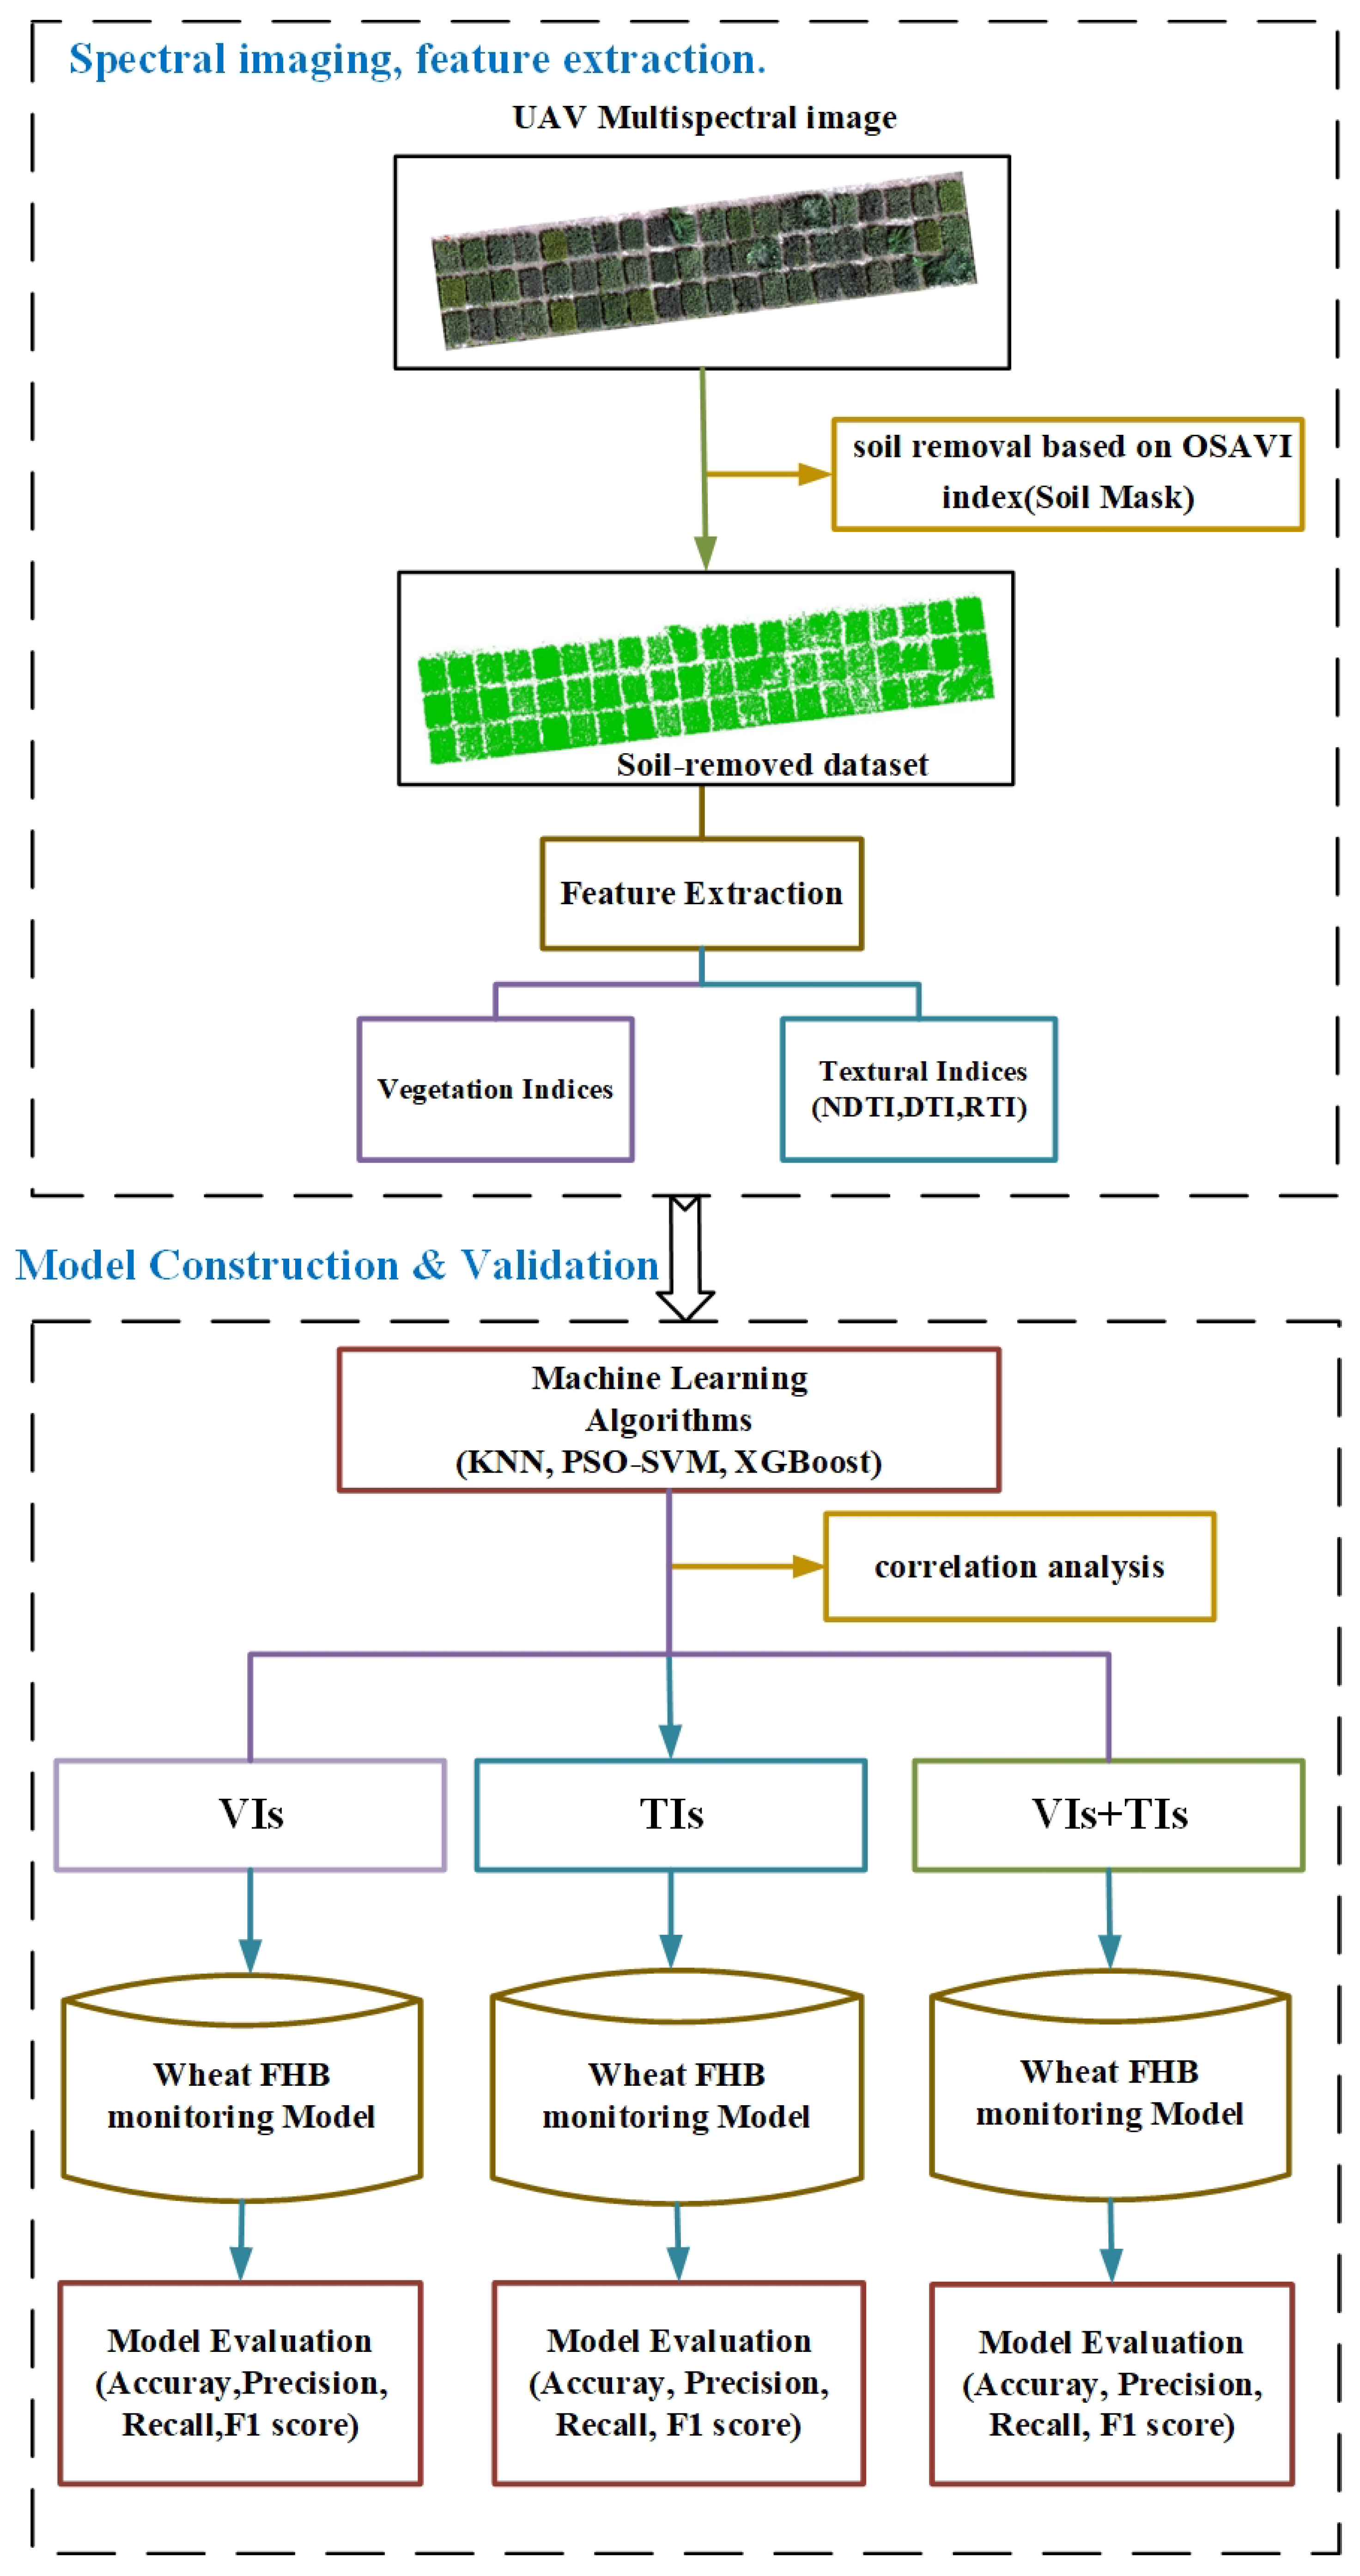
In this study, canopy images of 60 experimental plots were taken with mobile camera equipment as the auxiliary data for the selection of the sample points. At a height of about 1.2 m vertically above the canopy, images were acquired in bright weather, and each image was taken on a vivo iQOO Neo3 mobile phone, which has 48 million pixels in the rear camera. The images were taken with a fixed shooting direction to ensure that the canopy images of each plot corresponded to the corresponding plot of the multispectral imagery. Some of the typical experimental plots with the corresponding plots of the UAV multispectral imagery are shown in Figure 2. Three categories of sample points were selected: healthy, diseased, and background. In the diseased plots, 470 FHB-infected sampling points were selected, and in the healthy plots, 450 healthy sampling points were selected. In addition, 415 background sampling points were selected. These three types of sample points were used for subsequent model training and verification.

2.3. Methods

Our research process was conducted in two sections (Figure 3). The first section was a feature extraction to prepare the input features for the wheat FHB monitoring models and the second section was the construction and validation of the wheat FHB monitoring models; and the best feature combination and rapid wheat FHB monitoring method can be found through the study of these two sections. The two sections are described below.
Considering that the soil may affect the performance of the models, this study conducted a series of studies based on multispectral imagery after removing the soil area. First, the process of removing the soil area from the study area was as follows: the optimized soil-adjusted vegetation index (OSAVI) was used to segment the soil area and wheat area in the multispectral imagery by setting the suitable threshold [38], and the final threshold range was determined through multiple adjustments to construct a binary mask image. This mask was used to remove the soil region. The OSAVI was calculated as follows:
( NIR R ) / ( NIR + R + 0.16 )
Subsequently, we calculated 10 commonly used VIs and extracted three TIs (NDTI, DTI, and RTI). The correlation coefficient analysis was used to screen the sensitive classification features to explore the impact of VIs, TIs, and integrated VIs and TIs on the model’s accuracy. Then, three machine learning algorithms (KNN, PSO-SVM, and XGBoost) were used for training and classification. The overall recognition effect of each classification algorithm was analyzed and evaluated through the accuracy, precision, recall, and F1 score. Finally, based on the UAV multispectral imagery, the optimal feature combination and classification algorithm for the recognition of FHB in the farmland were obtained. The pixel-level region recognition of FHB based on the best wheat FHB monitoring model was realized. The overall research scheme is shown in Figure 3.

2.4. Feature Extraction

2.4.1. Extraction of VIs

The spectral information from UAVs is mainly used in the form of VIs [39]. VIs represent the mathematical transformation of reflectance of two or more bands to characterize the canopy spectral characteristics of crops [39,40]. To obtain the desired classification accuracy, a group of 10 VIs were calculated based on five spectral bands of UAV imagery (Table 1). These varieties were selected because they may help to distinguish between symptomatic and asymptomatic wheat. The formula and corresponding reference of the selected VIs are given in Table 1. These VIs include the traditional VIs and the red-edge VIs. The traditional VIs (NDVI, RVI, and DVI) are often used to monitor the growth status of crops [41,42]. CIgreen, CIrededge, and NPCI are often used to estimate the chlorophyll content of crops. The red-edge VIs include DVIRE and NDRE, which are similar to DVI and NDVI, but the red band is replaced by the red-edge band. According to the literature review, these VIs have been used to identify crop diseases [41]. In addition, VIs are simple to calculate and their potential for disease monitoring has been discussed by many scholars.

2.4.2. Extraction of TIs

When wheat is infected with FHB, the ear of the wheat will turn yellow and dry and certain brown spots will appear. With time, the brown spots will gradually expand and eventually spread to the whole ear [3,13]. Wheat canopy infected by FHB and wheat canopy not infected by FHB have different textural characteristics. Therefore, using the textural information reflected by the textural characteristics can effectively solve the problem that characteristics are difficult to distinguish from spectral features and it can also can effectively improve the classification accuracy.
Among several texture algorithms, the commonly used GLCM [50,51] was selected to explore the potential of textural information for wheat FHB monitoring. In this study, 40 textural features of 5 spectral bands were extracted from UAV multispectral imagery. Based on the GLCM, eight textural features of each band, including the mean, variance, homogeneity, contrast, dissimilarity, entropy, second moment, and correlation, were obtained. Since wheat is a row planting crop, usually, the row spacing of wheat planting is about 0.2–0.3 m. Considering the spatial resolution of UAV multispectral imagery was 0.01 m, this study used a 3 × 3 window size for the extraction of the textural features. The details of the textural features are shown in Table 2.
To improve the correlation between the textural features and wheat FHB, three TIs (NDTI, DTI, and RTI) were constructed following the thought of NDVI, DVI, and RVI. Combining eight textural features from five spectral bands (40 features in total), all possible combinations of the two textural features were constructed to explore their ability to identify wheat FHB. Finally, 1560 combinations were obtained for each TI and the best combination form was selected to constitute that TI. The three TIs were defined as follows.
N D T I = ( T 1 T 2 ) / ( T 1 + T 2 )
D T I = T 1 T 2
R T I = T 1 / T 2
where T 1 and T 2 represent the textural feature values in five random bands.

2.5. Training and Evaluation of Machine Learning Models

Based on the three inputs of VIs, TIs, and VIs and TIs integrated, a total of 1335 sampling points were selected, including 450 sampling points in the healthy area, 470 sampling points in the FHB-infected area, and 415 sampling points in the background area (considering the soil removal, the image was still disturbed by other external objects as well as shadows, so the background sampling points were retained). The training and test set were randomly divided according to the ratio of 8:2, and the KNN, PSO-SVM, and XGBoost were used to identify the infected FHB area.

2.5.1. KNN Model

The KNN is a typical supervised learning method and is widely used in classification tasks [52]. The basic principle is to calculate the distance between the sample to be classified as x and all the samples in the training set based on the distance metric, and the k samples with the smallest distance from the sample to be classified are taken as the k nearest neighbor samples of x. Finally, the classification category of x is determined based on the vote. The selection of the k value has a significant impact on the classification result of the KNN algorithm. If the value of k is too small, the phenomenon of overfitting will easily occur and the prediction error will be large, leading to a wrong prediction; if the value of k is too large, the phenomenon of underfitting will occur. So, this study used five-fold cross-validation to select the k value to ensure that a more appropriate k value was chosen.

2.5.2. PSO-SVM Model

Particle swarm optimization (PSO) was first proposed by Eberhart and Kennedy in 1995 [53], which simulated the clustering behavior of insects, birds, and fish for global optimization. SVM is a machine learning algorithm for supervised classification, which has certain advantages in solving small samples, and nonlinear and high-dimensional pattern recognition [54,55]. It first searches for a maximum marginal hyperplane and maps the low-dimensional data to the high-dimensional space through the kernel function [56], so as to turn the linearly inseparable samples into linearly separable samples, and introduces the model penalty factor to improve the generalization of the classification model. However, this method has a large workload and a low efficiency [57,58]. In addition, radial basis function (RBF) was used in this study, in which the kernel function parameter gamma and penalty factor c have a great impact on the accuracy of the model [58]. Therefore, PSO was used to find the appropriate gamma and c to reduce the model’s complexity and accelerate the model’s convergence.

2.5.3. XGBoost Model

XGBoost [59] is a novel gradient tree boosting method introduced by Chen and Guestrin in 2016. It is an improvement of the gradient boosting algorithm for enhancing the speed and performance of decision trees using gradients [60]. The thought of XGBoost is to adopt a group of classification and regression trees as weak learners and subsequently improve the performance of the trees by creating a cluster of trees that minimizes the regular objective function.
The objective function consists of two parts: training loss and regularization. The representation of the objective function is shown in the following equation.
o b j ( θ ) = T L ( θ ) + R ( θ )
TL represents the training loss and R represents the regularization term. TL is used to measure the predictive power of the model. Regularization has the advantage of retaining the complexity of the model within the desired range, eliminating problems such as over-stacking or over-fitting of data, and XGBoost can optimize the results by simply adding the predictions from all trees formed from the dataset.

2.5.4. Model Performance Evaluation Metrics

In this study, the accuracy, precision, recall, and F1 score will be used to evaluate the performance of the model. The calculation formulas are as follows.
Accuracy = TP + TN TP + TN + FP + FN
P r e c i s i o n = T P T P + F P
R e c a l l = T P T P + F N
F 1 = 2 P r e c i s i o n R e c a l l P r e c i s i o n + R e c a l l
where true positive (TP) and true negative (TN) represent the number of correctly classified positive samples and the number of correctly classified negative samples; false positive (FP) and false negative (FN) represent the number of misclassified positive samples and the number of misclassified negative samples.

3. Results

3.1. Correlation between Different Modeling Features and Wheat FHB

Correlation analysis is also widely used in studies of pest and disease monitoring [42]. So, in the study, the correlation between the different modeling features and wheat FHB was analyzed. In this study, Spearman correlation was adopted to measure the ability of VIs and TIs to identify wheat FHB. Spearman correlation differs from Pearson correlation in that it allows the variables to be categories and has a stronger robustness [61,62]. From Table 3, it can be seen that the correlation coefficient R between VIs and wheat FHB was between −0.580 and −0.882 and the vegetation index with the highest correlation coefficient was EVI; the correlation coefficient R between TIs and wheat FHB was between −0.866 and −0.893 and the textural index with the highest correlation coefficient was DTI. Compared with VIs, only DTI was higher than EVI, which had the highest correlation coefficient. The P value between the different features and wheat FHB was less than 0.01, indicating that the extraction of VIs and TIs based on UAV multispectral imagery were significantly different from wheat FHB. VIs and TIs can be used as input features for constructing wheat FHB monitoring models.

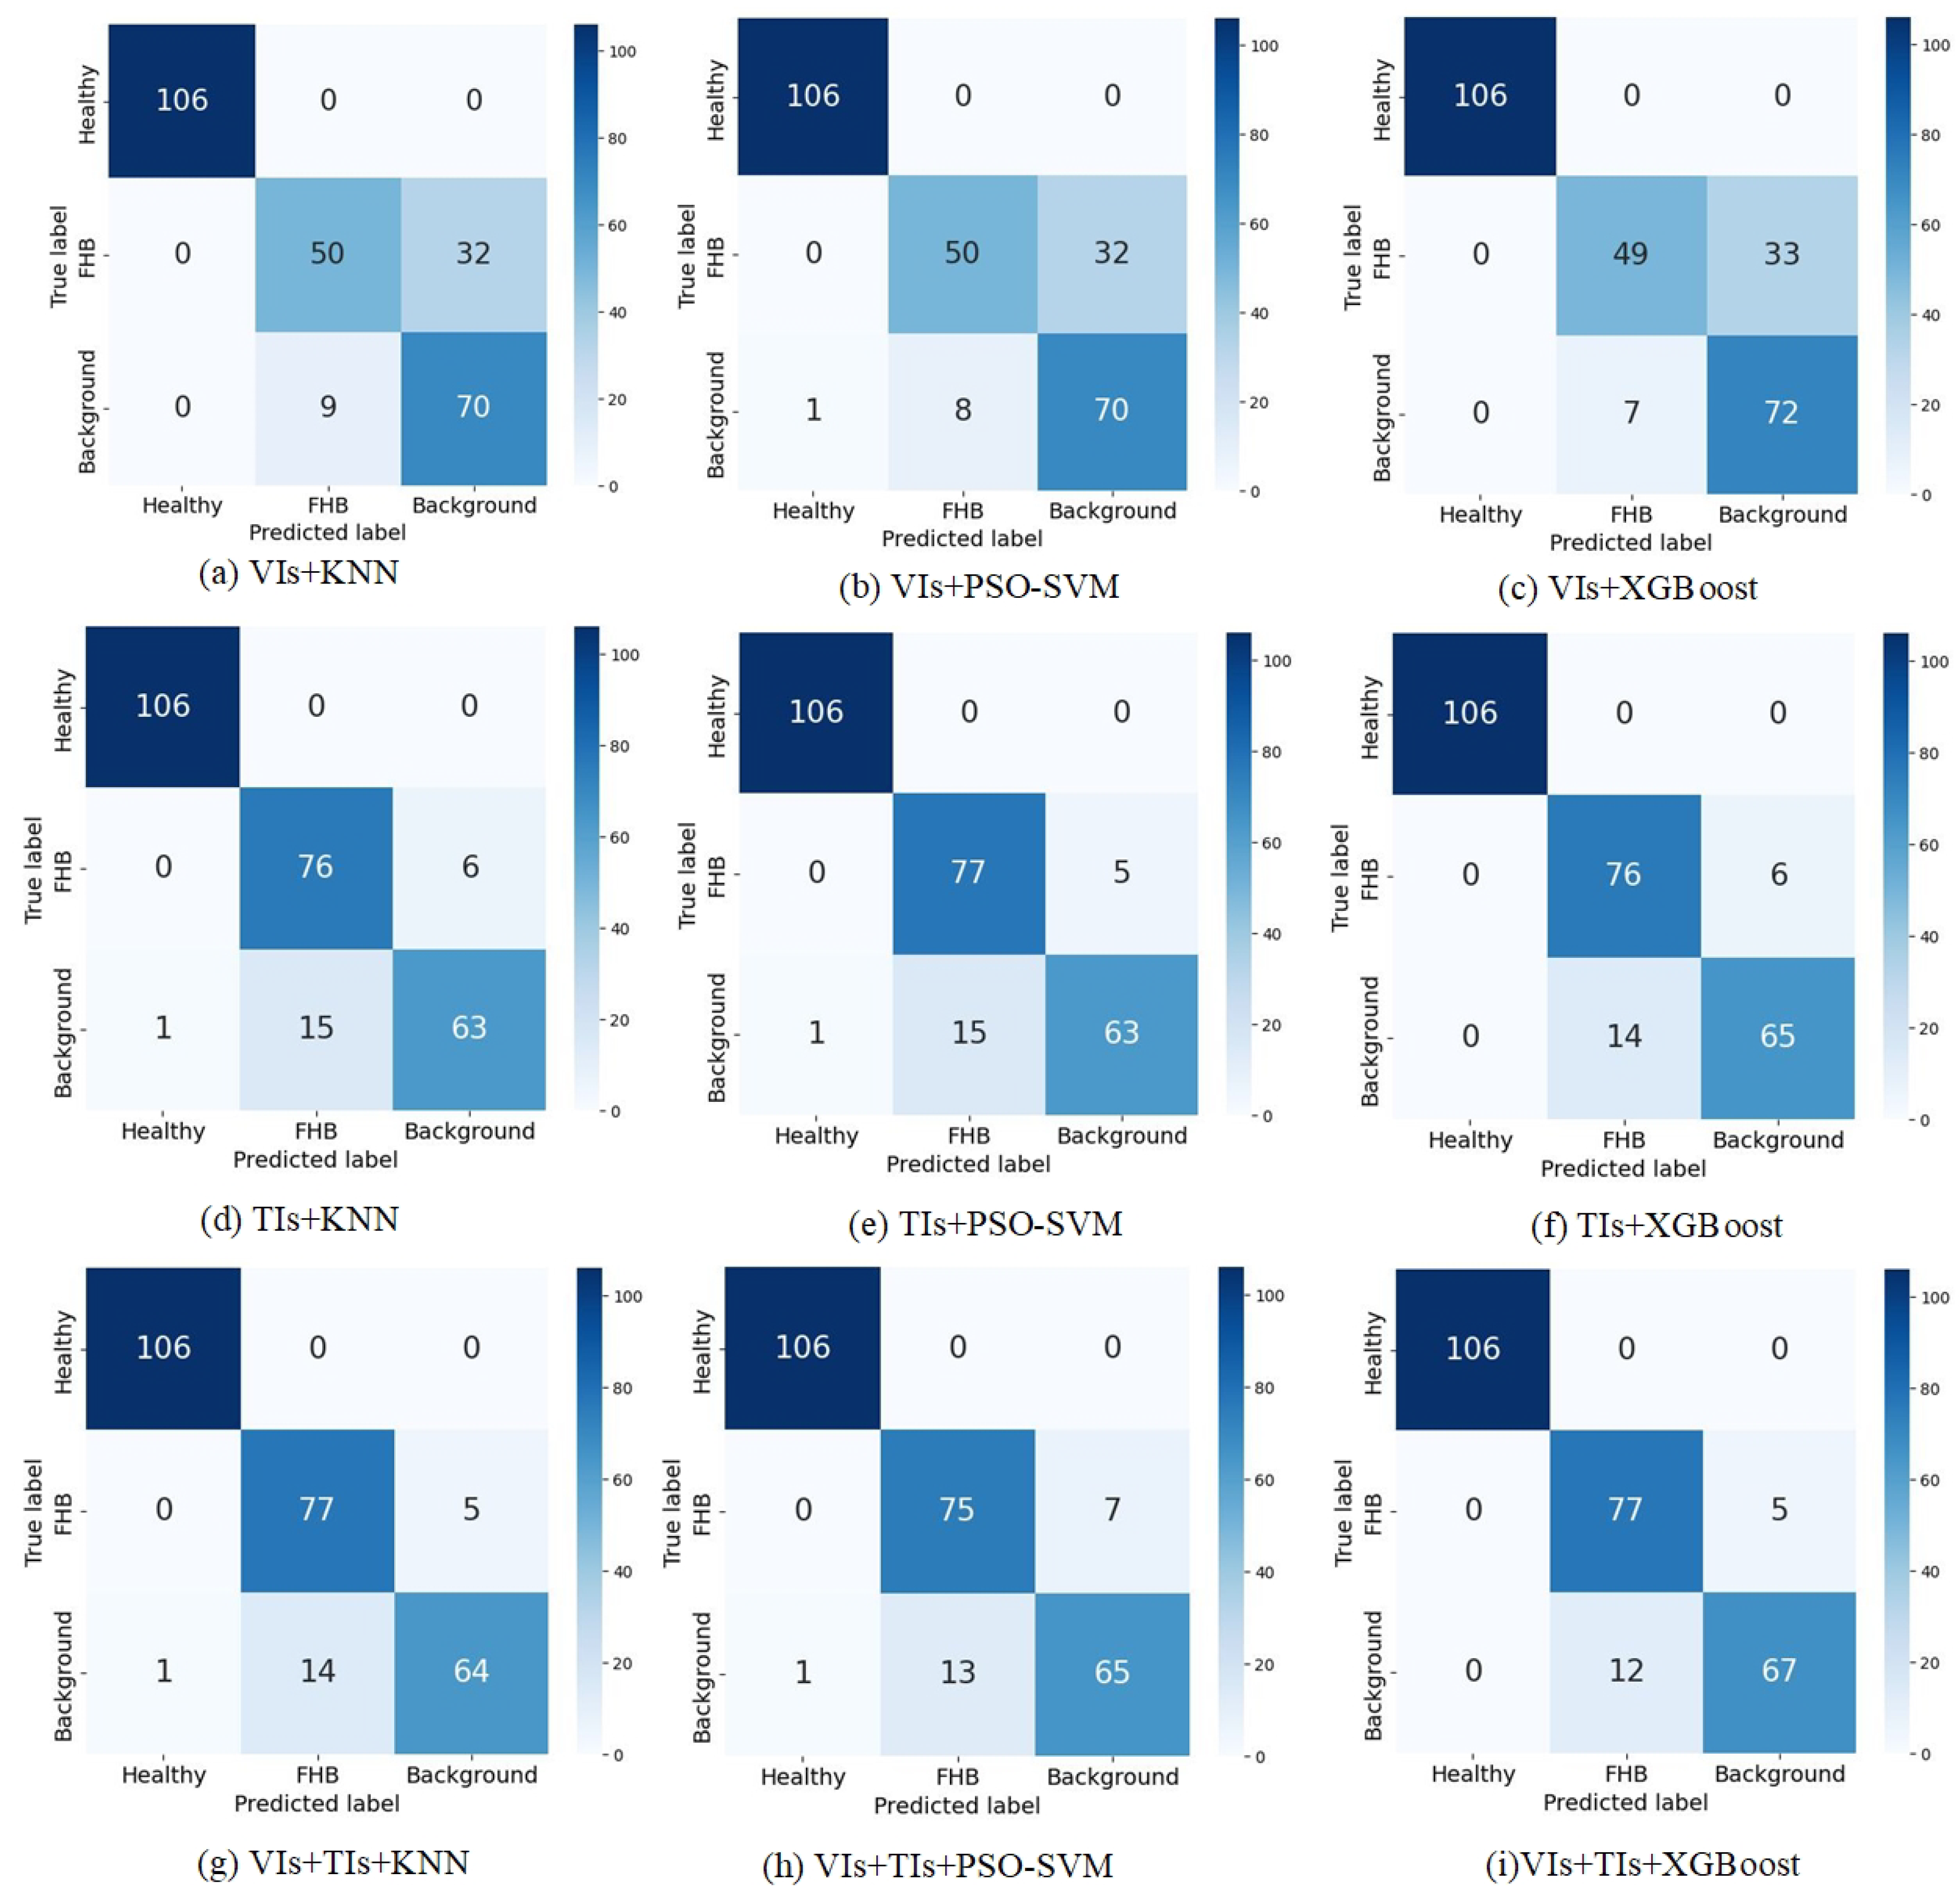
3.2. Model Analysis and Evaluation

In this study, KNN, PSO-SVM, and XGBoost were used for the modeling. We selected the three VIs (EVI, DVI, and DVIRE) with the highest correlation coefficients as the input features for VIs, combined NDTI, DTI, and RTI as the input features for TIs (these three TIs are made up of their respective best combinations), and integrated these VIs and TIs as the input features to construct wheat FHB monitoring models, respectively. A total of 267 sampling points were used for the test set, including 106 healthy sampling points, 82 sampling points infected with FHB, and 79 background sampling points. In KKN, a five-fold cross-validation was adopted to find the appropriate K value, and in PSO-SVM, the PSO algorithm was utilized to optimize the parameters gamma and c of the model, finding the best gamma and c in each different combination of features. ln XGBoost, the parameters of the model were determined through several tuning attempts.
The accuracy, precision, recall, and F1 score were used to evaluate the effect of the monitoring results of the three models and the final parameter setting of the monitoring models are shown in Table 4. From Table 4, the accuracy of the training set and the test set showed that there was no overfitting or underfitting of the models. It can be seen that when VIs were used as the input, the accuracy of the models reached 84.64%–85.02% and the F1 score reached 82.75%–83.09%. When TIs were used as the input, the accuracy of the models reached 91.76%–92.51% and the F1 score reached 90.84%–91.68%. When VIs and TIs were used as the inputs, the accuracy of the models reached 92.13%–93.63% and the F1 score reached 91.29%–92.93%. It can be seen that the models using only VIs as the input performed the worst, lower than the other two forms of feature combinations. This result indicated that TIs outperformed VIs under a single type of feature input, probably because TIs were richer in showing the textural information of FHB-infected wheat, which was different from the healthy wheat canopy. Under both types of feature inputs, the combined use of the spectral and textural information of the imagery enhanced the performance of the models compared with using only VIs or TIs as the inputs, with XGBoost showing the highest performance and outperforming the other two models with an accuracy of 93.63%. It was shown that the performance of wheat FHB monitoring could be improved by taking full advantage of different features and suitable model.

3.3. Analysis of Monitoring Effect

Figure 4 shows the confusion matrix of the three models with different inputs. From the confusion matrix, it could be seen that the misclassified sampling points of the models were basically concentrated between the sampling points infected with FHB and the background, and the healthy sampling points were better classified, probably because the healthy sampling points are more different from the sampling points infected with FHB and the background sampling points, while the sampling points of FHB will gradually show the symptoms of whitening and drying on the wheat canopy due to the infection by FHB, thus causing a loss of pigment and being easily confused with the background area.
When only VIs were used as the input, the misclassification between FHB-infected sampling points and the background sampling points was more serious, indicating that the spectral information of the images alone could not monitor wheat FHB well. The misclassification was improved to some extent when only TIs were adopted as the input, probably because the textural information of the canopy of wheat infected with FHB was different from that of the background sample points, and the TIs improved the phenomenon that the spectral features were difficult to distinguish detailed information. The integration of VIs and TIs as the input further improved the misclassification of the samples and enhanced the performance of the models, among which the XGBoost achieved satisfactory results with only 17 misclassified samples, the least misclassified samples, and the model also has the advantage of being fast, so it is well suited for the monitoring of wheat FHB.
In this study, different feature inputs as well as KNN, PSO-SVM, and XGBoost were used for the monitoring of wheat FHB, and it was clear from the analysis that XGBoost with VIs and TIs as the inputs achieved the best performance, so this model was used for spatial distribution mapping of wheat FHB (Figure 5). The trained XGBoost was used to perform a pixel-level classification of the UAV multispectral imagery. From Figure 5, we can see that the overall FHB incidence in the study area was heavy, probably because wheat FHB is a climatic disease, mainly affected by temperature and humidity, and the images of the study area were acquired during the wheat grain filling stage, which was the peak of the wheat FHB outbreak, making the incidence more serious. In addition, we could see that some background areas and areas infected with FHB were confused with each other, which may be related to the gradual drying of FHB after its incidence. Despite this phenomenon, XGBoost achieved satisfactory results and could be used to achieve the monitoring of wheat FHB. This study provides a new approach for the rapid and nondestructive monitoring of wheat FHB.

4. Discussion

Many previous studies, which have used multispectral images from UAVs for plant or crop pests and diseases, have been conducted. Some research scholars have used multispectral images from UAVs to try to monitor citrus huanglongbing (citrus greening) by extracting VIs that were sensitive to the disease, combined with models such as KNN and SVM [63,64]. Other research scholars have used multispectral images for monitoring other diseases such as wheat yellow rust [65], potato late blight [27], and Flavescence dorée [66]. These studies well demonstrated the potential of low-altitude multispectral images for the rapid monitoring of crop diseases. The traditional remote sensing monitoring of pests and diseases, especially based on UAV images [67,68,69], mostly uses some VIs as the input features. This method only considered the changes in the host conditions and neglects the local detailed textural information of remote sensing images [70,71]. Textural features in UAV remote sensing images can describe the spatial distribution of the brightness of adjacent pixels and unique textural information and are increasingly used in the monitoring of pests and diseases.
Therefore, this study used spectral information and textural information extracted from UAV multispectral imagery to try to monitor wheat FHB. First, to reduce the influence of soil on the monitoring results, OSAVI was used to construct a mask file and set an appropriate threshold to remove the soil areas from the image. Second, we analyzed the correlation of 10 commonly used VIs and three TIs on wheat FHB, and through correlation analysis, we selected three VIs that were significantly correlated with FHB as the input features for the models, which were EVI, DVIRE, and DVI. These VIs were all associated with either NIR or RE, which may be related to the stress state of the crops or plants. After being stressed by pests and diseases, crops will show differential absorption and reflection characteristics in different bands, causing changes in the crops’ pigments, water, morphology, and structure [72]. Wheat FHB mainly infects wheat ears, making wheat ears yellow and dry, thus causing the loss of chlorophyll [73], and this symptom can be well reflected by the red-edge band [74,75].
Considering that FHB-infected wheat canopies may present different structures and textures from healthy wheat canopies as well as the background, to further enhance the description of wheat FHB by the textural features, three TIs (NDTI, DTI, and RTI) were constructed instead of the original textural features as the input features for the models. It was found that the TIs were significantly correlated with wheat FHB, probably because the constructed TIs were combinations of different textural features and better-utilized textural information to describe wheat FHB, where the correlation coefficient between DTI and wheat FHB reached -0.893, which was better than VIs, indicating that TIs could also be used as the input features for the wheat FHB monitoring models, and the performance may be better than VIs. Finally, based on the multispectral imagery after the removal of the soil, we used three VIs, three TIs, and integrated VIs and TIs as the input features and selected KNN, PSO-SVM, and XGBoost to construct the wheat FHB monitoring models. Through our analysis, we found that XGBoost, which integrated VIs and TIs as the inputs, could better achieve wheat FHB monitoring with an accuracy of 93.63% and an F1 score as high as 92.93%. The reason may be that XGBoost has the advantage of transforming weak learners into strong learners, and its regularization parameters can ensure the accuracy while avoiding the problem of over fitting. In addition, the model is faster, so the model can be applied to the monitoring of wheat FHB.
In this study, multispectral imaging technology combined with machine learning has achieved great results in wheat FHB monitoring, but there are still some problems that need to be improved. Wheat FHB is one of the most harmful diseases. The infection of wheat FHB will bring irreparable harm to the wheat’s quality. Therefore, the early detection of FHB in wheat is particularly important. The research field of this study is relatively single, and further research is needed in more fields to verify the spatial and generalization capabilities of the models used. In addition, we should also consider using the images of multiple stages and key growth periods to further explore the disease characteristics of wheat FHB so as to achieve the goal of an early detection and control. At present, deep learning technology also has a very broad application prospect in plant or crop pest detection, thus the potential of deep learning technology in disease monitoring needs to be further explored.

5. Conclusions

This research proposed a wheat FHB monitoring method combining VIs, TIs, and an XGBoost model. First, based on the multispectral imagery obtained by UAV, OASVI was used to reduce the interference of the soil area. Second, we made full use of the VIs and TIs of UAV multispectral imagery and explored the ability of KNN, PSO-SVM, and XGBoost to monitor wheat FHB under different feature combinations. Lastly, combined with the accuracy evaluation index of the models, the XGBoost model with VIs and TIs as the inputs had the best performance, with an accuracy of 93.63% and an F1 score of 92.93%. The results showed that the fusion of VIs and TIs could improve the accuracy of the model, and XGBoost could quickly and accurately monitor wheat FHB. This research provides technical support and reference for the rapid and nondestructive monitoring of wheat FHB.

Author Contributions

Conceptualization, C.G., X.J. and Z.G.; methodology, C.G. and Z.G.; formal analysis, X.J. and Z.G.; validation, C.G., X.J., Z.G., T.W., Q.H., H.S. and W.G.; investigation, C.G., Z.G., T.W., Q.H. and H.S.; resources, W.G. and C.G.; data curation, W.G.; writing—original draft preparation, C.G. and W.G.; writing—review and editing, W.G. and C.G.; visualization, Z.G. and X.J.; supervision, W.G. and C.G.; funding acquisition, W.G. and X.J. All authors have read and agreed to the published version of the manuscript.

Funding

This research was funded by Henan Province Science and Technology Research Project (212102110028, 22102320035); the National Engineering Research Center for Argo-ecological Big Data Analysis and Application (AE202005); the Science and Technology Innovation Fund of Henan Agricultural University (KJCX2021A16); National Natural Science Foundation of China (32271993).

Institutional Review Board Statement

Not applicable.

Data Availability Statement

Not applicable.

Conflicts of Interest

The authors declare no conflict of interest.

References

  1. Palazzini, J.; Fumero, V.; Yerkovich, N.; Barros, G.; Cuniberti, M.; Chulze, S. Correlation between Fusarium graminearum and deoxynivalenol during the 2012/13 wheat Fusarium head blight outbreak in Argentina. Cereal Res. Commun. 2015, 43, 627–637. [Google Scholar] [CrossRef] [Green Version]
  2. Cao, Z.S.; Yao, X.; Liu, H.Y.; Liu, B.; Cheng, T.; Tian, Y.C.; Cao, W.X.; Zhu, Y. Comparison of the abilities of vegetation indices and photosynthetic parameters to detect heat stress in wheat. Agric. Forest Meteorol. 2019, 265, 121–136. [Google Scholar] [CrossRef]
  3. Liu, L.; Dong, Y.; Huang, W.; Du, X.; Ren, B.; Huang, L.; Zheng, Q.; Ma, H. A disease index for efficiently detecting wheat fusarium head blight using sentinel-2 multispectral imagery. IEEE Access 2020, 8, 52181–52191. [Google Scholar] [CrossRef]
  4. Salgado, J.D.; Madden, L.V.; Paul, P.A. Quantifying the effects of Fusarium head blight on grain yield and test weight in soft red winter wheat. Phytopathology 2015, 105, 295–306. [Google Scholar] [CrossRef] [PubMed] [Green Version]
  5. Palacios, S.A.; Erazo, J.G.; Ciasca, B.; Lattanzio, V.M.; Reynoso, M.M.; Farnochi, M.C.; Torres, A.M. Occurrence of deoxynivalenol and deoxynivalenol-3-glucoside in durum wheat from Argentina. Food Chem. 2017, 230, 728–734. [Google Scholar] [CrossRef] [PubMed]
  6. Bai, G.; Shaner, G. Scab of wheat: Prospects for control. Plant Dis. 1994, 78, 760–766. [Google Scholar]
  7. Semagn, K.; Iqbal, M.; Jarquin, D.; Crossa, J.; Howard, R.; Ciechanowska, I.; Henriquez, M.A.; Randhawa, H.; Aboukhaddour, R.; McCallum, B.D. Genomic Predictions for Common Bunt, FHB, Stripe Rust, Leaf Rust, and Leaf Spotting Resistance in Spring Wheat. Genes 2022, 13, 565. [Google Scholar] [CrossRef]
  8. Gilbert, J.; Tekauz, A. Recent developments in research on Fusarium head blight of wheat in Canada. Can. J. Plant Pathol. 2000, 22, 1–8. [Google Scholar] [CrossRef]
  9. Qiu, R.; Yang, C.; Moghimi, A.; Zhang, M.; Steffenson, B.J.; Hirsch, C.D. Detection of fusarium head blight in wheat using a deep neural network and color imaging. Remote Sens. 2019, 11, 2658. [Google Scholar] [CrossRef] [Green Version]
  10. Huang, L.; Zhang, H.; Huang, W.; Dong, Y.; Ye, H.; Ma, H.; Zhao, J. Identification of Fusarium head blight in wheat ears using vertical angle-based reflectance spectroscopy. Arab. J. Geosci. 2021, 14, 423. [Google Scholar] [CrossRef]
  11. Bauriegel, E.; Herppich, W.B. Hyperspectral and chlorophyll fluorescence imaging for early detection of plant diseases, with special reference to Fusarium spec. infections on wheat. Agriculture 2014, 4, 32–57. [Google Scholar] [CrossRef]
  12. Zhang, J.; Huang, Y.; Pu, R.; Gonzalez-Moreno, P.; Yuan, L.; Wu, K.; Huang, W. Monitoring plant diseases and pests through remote sensing technology: A review. Comput. Electron. Agric. 2019, 165, 104943. [Google Scholar] [CrossRef]
  13. Liu, L.; Dong, Y.; Huang, W.; Du, X.; Ma, H. Monitoring wheat fusarium head blight using unmanned aerial vehicle hyperspectral imagery. Remote Sens. 2020, 12, 3811. [Google Scholar] [CrossRef]
  14. Mutanga, O.; Dube, T.; Galal, O. Remote sensing of crop health for food security in Africa: Potentials and constraints. Remote Sens. Appl. Soc. Environ. 2017, 8, 231–239. [Google Scholar] [CrossRef]
  15. Chu, H.; Zhang, D.; Shao, Y.; Chang, Z.; Guo, Y.; Zhang, N. Using HOG Descriptors and UAV for Crop Pest Monitoring. In Proceedings of the 2018 Chinese Automation Congress (CAC), Xi’an, China, 30 November–2 December 2018; pp. 1516–1519. [Google Scholar]
  16. Guo, Y.H.; Yin, G.D.; Sun, H.Y.; Wang, H.X.; Chen, S.Z.; Senthilnath, J.; Wang, J.Z.; Fu, Y.S. Scaling Effects on Chlorophyll Content Estimations with RGB Camera Mounted on a UAV Platform Using Machine-Learning Methods. Sensors 2020, 20, 5130. [Google Scholar] [CrossRef]
  17. Zhang, J.; Cheng, T.; Guo, W.; Xu, X.; Qiao, H.; Xie, Y.; Ma, X. Leaf area index estimation model for UAV image hyperspectral data based on wavelength variable selection and machine learning methods. Plant Methods 2021, 17, s13007–s13021. [Google Scholar] [CrossRef]
  18. Kou, J.; Duan, L.; Yin, C.; Ma, L.; Chen, X.; Gao, P.; Lv, X. Predicting Leaf Nitrogen Content in Cotton with UAV RGB Images. Sustainability 2022, 14, 9259. [Google Scholar] [CrossRef]
  19. Li, B.; Xu, X.; Zhang, L.; Han, J.; Bian, C.; Li, G.; Liu, J.; Jin, L. Above-ground biomass estimation and yield prediction in potato by using UAV-based RGB and hyperspectral imaging. ISPRS J. Photogramm. Remote Sens. 2020, 162, 161–172. [Google Scholar] [CrossRef]
  20. Kim, M.S.; Daughtry, C.; Chappelle, E.; McMurtrey, J.; Walthall, C. The Use of High Spectral Resolution Bands for Estimating Absorbed Photosynthetically Active Radiation (A par). In Proceedings of 6th International Symposium on Physical Measurements and Signatures in Remote Sensing, Val D’Isere, France, 17–22 January 1994. [Google Scholar]
  21. Xu, X.; Lu, J.; Zhang, N.; Yang, T.; He, J.; Yao, X.; Cheng, T.; Zhu, Y.; Cao, W.; Tian, Y. Inversion of rice canopy chlorophyll content and leaf area index based on coupling of radiative transfer and Bayesian network models. ISPRS J. Photogramm. Remote Sens. 2019, 150, 185–196. [Google Scholar] [CrossRef]
  22. Zheng, H.; Li, W.; Jiang, J.; Liu, Y.; Cheng, T.; Tian, Y.; Zhu, Y.; Cao, W.; Zhang, Y.; Yao, X. A comparative assessment of different modeling algorithms for estimating leaf nitrogen content in winter wheat using multispectral images from an unmanned aerial vehicle. Remote Sens. 2018, 10, 2026. [Google Scholar] [CrossRef] [Green Version]
  23. Han, X.; Wei, Z.; Chen, H.; Zhang, B.; Li, Y.; Du, T. Inversion of winter wheat growth parameters and yield under different water treatments based on UAV multispectral remote sensing. Front. Plant Sci. 2021, 639. [Google Scholar] [CrossRef] [PubMed]
  24. Han, S.; Zhao, Y.; Cheng, J.; Zhao, F.; Yang, H.; Feng, H.; Li, Z.; Ma, X.; Zhao, C.; Yang, G. Monitoring Key Wheat Growth Variables by Integrating Phenology and UAV Multispectral Imagery Data into Random Forest Model. Remote Sens. 2022, 14, 3723. [Google Scholar] [CrossRef]
  25. Lei, S.; Luo, J.; Tao, X.; Qiu, Z. Remote Sensing Detecting of Yellow Leaf Disease of Arecanut Based on UAV Multisource Sensors. Remote Sens. 2021, 13, 4562. [Google Scholar] [CrossRef]
  26. Zhao, X.-y.; Zhang, J.; Zhang, D.-y.; Zhou, X.-g.; Liu, X.-h.; Xie, J. Comparison between the Effects of Visible Light and Multispectral Sensor Based on Low-Altitude Remote Sensing Platform in the Evaluation of Rice Sheath Blight. Spectrosc. Spectr. Anal. 2019, 39, 1192–1198. [Google Scholar] [CrossRef]
  27. Rodriguez, J.; Lizarazo, I.; Prieto, F.; Angulo-Morales, V. Assessment of potato late blight from UAV-based multispectral imagery. Comput. Electron. Agric. 2021, 184. [Google Scholar] [CrossRef]
  28. Ye, H.; Huang, W.; Huang, S.; Cui, B.; Dong, Y.; Guo, A.; Ren, Y.; Jin, Y. Identification of banana fusarium wilt using supervised classification algorithms with UAV-based multi-spectral imagery. Int. J. Agric. Biol. Eng. 2020, 13, 136–142. [Google Scholar] [CrossRef]
  29. Yang, M.D.; Huang, K.S.; Kuo, Y.H.; Tsai, H.P.; Lin, L.M. Spatial and Spectral Hybrid Image Classification for Rice Lodging Assessment through UAV Imagery. Remote Sens. 2017, 9, 583. [Google Scholar] [CrossRef] [Green Version]
  30. Zheng, H.; Cheng, T.; Zhou, M.; Li, D.; Yao, X.; Tian, Y.; Cao, W.; Zhu, Y. Improved estimation of rice aboveground biomass combining textural and spectral analysis of UAV imagery. Precis. Agric. 2019, 20, 611–629. [Google Scholar] [CrossRef]
  31. Haralick, R.M.; Shanmugam, K.; Dinstein, I.H. Textural features for image classification. IEEE Trans. Syst. Man Cybern. 1973, 610–621. [Google Scholar] [CrossRef] [Green Version]
  32. Arivazhagan, S.; Shebiah, R.N.; Ananthi, S.; Varthini, S.V. Detection of unhealthy region of plant leaves and classification of plant leaf diseases using texture features. Agric. Eng. Int. CIGR J. 2013, 15, 211–217. [Google Scholar]
  33. Yue, J.; Yang, G.; Tian, Q.; Feng, H.; Xu, K.; Zhou, C. Estimate of winter-wheat above-ground biomass based on UAV ultrahigh-ground-resolution image textures and vegetation indices. ISPRS J. Photogramm. Remote Sens. 2019, 150, 226–244. [Google Scholar] [CrossRef]
  34. Turgut, R.; Gunlu, A. Estimating aboveground biomass using Landsat 8 OLI satellite image in pure Crimean pine (Pinus nigra JF Arnold subsp. pallasiana (Lamb.) Holmboe) stands: A case from Turkey. Geocarto Int. 2022, 37, 720–734. [Google Scholar] [CrossRef]
  35. Li, S.; Yuan, F.; Ata-Ui-Karim, S.T.; Zheng, H.; Cheng, T.; Liu, X.; Tian, Y.; Zhu, Y.; Cao, W.; Cao, Q. Combining Color Indices and Textures of UAV-Based Digital Imagery for Rice LAI Estimation. Remote Sens. 2019, 11, 1763. [Google Scholar] [CrossRef] [Green Version]
  36. Huang, L.; Li, T.; Ding, C.; Zhao, J.; Zhang, D.; Yang, G. Diagnosis of the Severity of Fusarium Head Blight of Wheat Ears on the Basis of Image and Spectral Feature Fusion. Sensors 2020, 20, 2887. [Google Scholar] [CrossRef] [PubMed]
  37. Berber, M.; Munjy, R.; Lopez, J. Kinematic GNSS positioning results compared against Agisoft Metashape and Pix4dmapper results produced in the San Joaquin experimental range in Fresno County, California. J. Geod. Sci. 2021, 11, 48–57. [Google Scholar] [CrossRef]
  38. Rondeaux, G.; Steven, M.; Baret, F. Optimization of soil-adjusted vegetation indices. Remote Sens. Environ. 1996, 55, 95–107. [Google Scholar] [CrossRef]
  39. Liu, J.; Zhu, Y.; Tao, X.; Chen, X.; Li, X. Rapid prediction of winter wheat yield and nitrogen use efficiency using consumer-grade unmanned aerial vehicles multispectral imagery. Front. Plant Sci. 2022, 13, 1032170. [Google Scholar] [CrossRef]
  40. Qiu, R.; Wei, S.; Zhang, M.; Li, H.; Sun, H.; Liu, G.; Li, M. Sensors for measuring plant phenotyping: A review. Int. J. Agric. Biol. Eng. 2018, 11, 1–17. [Google Scholar] [CrossRef] [Green Version]
  41. Zheng, Q.; Huang, W.; Cui, X.; Shi, Y.; Liu, L. New spectral index for detecting wheat yellow rust using Sentinel-2 multispectral imagery. Sensors 2018, 18, 868. [Google Scholar] [CrossRef] [Green Version]
  42. Zhang, D.; Zhou, X.; Zhang, J.; Lan, Y.; Xu, C.; Liang, D. Detection of rice sheath blight using an unmanned aerial system with high-resolution color and multispectral imaging. PLOS ONE 2018, 13, e0187470. [Google Scholar] [CrossRef] [Green Version]
  43. Gitelson, A.A.; Kaufman, Y.J.; Stark, R.; Rundquist, D. Novel algorithms for remote estimation of vegetation fraction. Remote Sens. Environ. 2002, 80, 76–87. [Google Scholar] [CrossRef] [Green Version]
  44. Gitelson, A.A.; Viña, A.; Ciganda, V.; Rundquist, D.C.; Arkebauer, T.J. Remote estimation of canopy chlorophyll content in crops. Geophys. Res. Lett. 2005, 32, L08403. [Google Scholar] [CrossRef]
  45. Tucker, C.J. Red and photographic infrared linear combinations for monitoring vegetation. Remote Sens. Environ. 1979, 8, 127–150. [Google Scholar] [CrossRef] [Green Version]
  46. Patrick, A.; Pelham, S.; Culbreath, A.; Holbrook, C.C.; De Godoy, I.J.; Li, C. High throughput phenotyping of tomato spot wilt disease in peanuts using unmanned aerial systems and multispectral imaging. IEEE Instrum. Meas. Mag. 2017, 20, 4–12. [Google Scholar] [CrossRef]
  47. Huete, A.; Didan, K.; Miura, T.; Rodriguez, E.P.; Gao, X.; Ferreira, L.G. Overview of the radiometric and biophysical performance of the MODIS vegetation indices. Remote Sens. Environ. 2002, 83, 195–213. [Google Scholar] [CrossRef]
  48. Barnes, E.; Clarke, T.; Richards, S.; Colaizzi, P.; Haberland, J.; Kostrzewski, M.; Waller, P.; Choi, C.; Riley, E.; Thompson, T. Coincident Detection of Crop Water Stress, Nitrogen Status and Canopy Density Using Ground Based Multispectral Data. In Proceedings of the Fifth International Conference on Precision Agriculture, Bloomington, MN, USA, 16–19 July 2000; p. 6. [Google Scholar]
  49. Rouse Jr, J.; Haas, R.; Schell, J.; Deering, D. Monitoring Vegetation Systems in the Great Plains with ERTS. Third Earth Resources Technology Satellite-1 Symposium: Volume 1; Technical Presentations, Section B; Freden, S., Mercanti, E., Becker, M., Eds.; NASA Special Publication: Washington, DC, USA, 1974; Document ID: 19740022592; pp. 1–9. [Google Scholar]
  50. Liu, L.Y.; Fan, X.J. The Design of System to Texture Feature Analysis Based on Gray Level Co-Occurrence Matrix. In Proceedings of the Applied Mechanics and Materials, The Island of Crete, Greece, 30 May 2015; pp. 904–907. [Google Scholar]
  51. Haralick, R.M. Statistical and structural approaches to texture. Proc. IEEE 1979, 67, 786–804. [Google Scholar] [CrossRef]
  52. Wolff, J.; Backofen, R.; Grüning, B. Robust and efficient single-cell Hi-C clustering with approximate k-nearest neighbor graphs. Bioinformatics 2021, 37, 4006–4013. [Google Scholar] [CrossRef] [PubMed]
  53. Venter, G.; Sobieszczanski-Sobieski, J. Particle swarm optimization. AIAA J. 2003, 41, 1583–1589. [Google Scholar] [CrossRef] [Green Version]
  54. Yang, S.; Hu, L.; Wu, H.; Ren, H.; Qiao, H.; Li, P.; Fan, W. Integration of crop growth model and random forest for winter wheat yield estimation from UAV hyperspectral imagery. IEEE J. Sel. Top. Appl. Earth Obs. Remote Sens. 2021, 14, 6253–6269. [Google Scholar] [CrossRef]
  55. Guo, A.; Huang, W.; Ye, H.; Dong, Y.; Ma, H.; Ren, Y.; Ruan, C. Identification of Wheat Yellow Rust Using Spectral and Texture Features of Hyperspectral Images. Remote Sens. 2020, 12, 1419. [Google Scholar] [CrossRef]
  56. Peng, X.; Chen, D.; Zhou, Z.; Zhang, Z.; Xu, C.; Zha, Q.; Wang, F.; Hu, X. Prediction of the Nitrogen, Phosphorus and Potassium Contents in Grape Leaves at Different Growth Stages Based on UAV Multispectral Remote Sensing. Remote Sens. 2022, 14, 2659. [Google Scholar] [CrossRef]
  57. Han, Z.Y.; Zhu, X.C.; Fang, X.Y.; Wang, Z.Y.; Wang, L.; Zhao, G.X.; Jiang, Y.M. Hyperspectral Estimation of Apple Tree Canopy LAI Based on SVM and RF Regression. Spectrosc. Spectr. Anal. 2016, 36, 800–805. [Google Scholar] [CrossRef]
  58. Huang, L.; Wu, K.; Huang, W.; Dong, Y.; Ma, H.; Liu, Y.; Liu, L. Detection of Fusarium Head Blight in Wheat Ears Using Continuous Wavelet Analysis and PSO-SVM. Agriculture 2021, 11, 998. [Google Scholar] [CrossRef]
  59. Chen, T.; Guestrin, C. Xgboost: A Scalable Tree Boosting System. In Proceedings of the 22nd ACM SIGKDD International Conference on Knowledge Discovery and Data Mining, San Francisco, CA, USA, 13–17 August 2016; pp. 785–794. [Google Scholar]
  60. Dhaliwal, S.S.; Nahid, A.-A.; Abbas, R. Effective intrusion detection system using XGBoost. Information 2018, 9, 149. [Google Scholar] [CrossRef] [Green Version]
  61. Croux, C.; Dehon, C. Influence functions of the Spearman and Kendall correlation measures. Stat. Methods Appl. 2010, 19, 497–515. [Google Scholar] [CrossRef] [Green Version]
  62. Croux, C.; Dehon, C. Robustness versus efficiency for nonparametric correlation measures. FBE Res. Rep. KBI_0803 2008. [Google Scholar]
  63. Lan, Y.; Huang, Z.; Deng, X.; Zhu, Z.; Huang, H.; Zheng, Z.; Lian, B.; Zeng, G.; Tong, Z. Comparison of machine learning methods for citrus greening detection on UAV multispectral images. Comput. Electron. Agric. 2020, 171, 105234. [Google Scholar] [CrossRef]
  64. DadrasJavan, F.; Samadzadegan, F.; Seyed Pourazar, S.H.; Fazeli, H. UAV-based multispectral imagery for fast Citrus Greening detection. J. Plant Dis. Prot. 2019, 126, 307–318. [Google Scholar] [CrossRef]
  65. Su, J.; Liu, C.; Hu, X.; Xu, X.; Guo, L.; Chen, W.-H. Spatio-temporal monitoring of wheat yellow rust using UAV multispectral imagery. Comput. Electron. Agric. 2019, 167, 105035. [Google Scholar] [CrossRef]
  66. Albetis, J.; Duthoit, S.; Guttler, F.; Jacquin, A.; Goulard, M.; Poilvé, H.; Féret, J.-B.; Dedieu, G. Detection of Flavescence dorée grapevine disease using unmanned aerial vehicle (UAV) multispectral imagery. Remote Sens. 2017, 9, 308. [Google Scholar] [CrossRef] [Green Version]
  67. West, J.S.; Canning, G.G.; Perryman, S.A.; King, K. Novel Technologies for the detection of Fusarium head blight disease and airborne inoculum. Trop. Plant Pathol. 2017, 42, 203–209. [Google Scholar] [CrossRef] [PubMed] [Green Version]
  68. Guo, A.; Huang, W.; Dong, Y.; Ye, H.; Ma, H.; Liu, B.; Wu, W.; Ren, Y.; Ruan, C.; Geng, Y. Wheat yellow rust detection using UAV-based hyperspectral technology. Remote Sens. 2021, 13, 123. [Google Scholar] [CrossRef]
  69. Ye, H.; Huang, W.; Huang, S.; Cui, B.; Dong, Y.; Guo, A.; Ren, Y.; Jin, Y. Recognition of banana fusarium wilt based on UAV remote sensing. Remote Sens. 2020, 12, 938. [Google Scholar] [CrossRef]
  70. Jain, A.K.; Murty, M.N.; Flynn, P.J. Data clustering: A review. ACM Comput. Surv. 1999, 31, 264–323. [Google Scholar] [CrossRef]
  71. Xiao, Y.; Dong, Y.; Huang, W.; Liu, L.; Ma, H. Wheat fusarium head blight detection using UAV-based spectral and texture features in optimal window size. Remote Sens. 2021, 13, 2437. [Google Scholar] [CrossRef]
  72. Hanley, J.A.; McNeil, B.J. The meaning and use of the area under a receiver operating characteristic (ROC) curve. Radiology 1982, 143, 29–36. [Google Scholar] [CrossRef] [Green Version]
  73. Fernando, W.D.; Oghenekaro, A.O.; Tucker, J.R.; Badea, A. Building on a foundation: Advances in epidemiology, resistance breeding, and forecasting research for reducing the impact of Fusarium head blight in wheat and barley. Can. J. Plant Pathol. 2021, 43, 495–526. [Google Scholar] [CrossRef]
  74. Filella, I.; Penuelas, J. The red edge position and shape as indicators of plant chlorophyll content, biomass and hydric status. Int. J. Remote Sens. 1994, 15, 1459–1470. [Google Scholar] [CrossRef]
  75. Fu, Y.; Yang, G.; Wang, J.; Song, X.; Feng, H. Winter wheat biomass estimation based on spectral indices, band depth analysis and partial least squares regression using hyperspectral measurements. Comput. Electron. Agric. 2014, 100, 51–59. [Google Scholar] [CrossRef]
Figure 1. Overview of the study area. (a) Location of Xuchang City in Henan Province; (b) distribution and location of the study area in the experimental farm; (c) distribution and location of the experimental plots.
Agriculture 13 00293 g001
Figure 2. Distribution of images of the canopy experimental plots with the plots corresponding to the UAV multispectral imagery.
Agriculture 13 00293 g002
Figure 3. Workflow diagram for feature extraction and model construction and validation.
Agriculture 13 00293 g003
Figure 4. Confusion matrix for the three models with different inputs.
Agriculture 13 00293 g004
Figure 5. Mapping of the spatial distribution of FHB in wheat.
Agriculture 13 00293 g005
Table 1. Formulas and sources of spectral VIs for monitoring wheat FHB.
VIs NameCalculation FormulaReference
Visible atmospherically resistant index (VARI)(G − R)/(G + R − B) [43]
Green chlorophyll index (CIgreen)NIR/G − 1 [44]
Red-edge chlorophyll index (CIrededge)NIR/RE − 1 [44]
Difference vegetation index (DVI)NIR − R [45]
Red-edge difference vegetation index (DVIRE)NIR − RE [46]
Enhanced vegetation index (EVI)2.5(NIR − R)/(NIR + 6R − 7.5B + 1) [47]
Normalized difference red-edge index (NDRE)(NIR − RE)/(NIR + RE) [48]
Normalized difference vegetation index (NDVI)(NIR − R)/(NIR + R) [49]
Normalized pigment chlorophyll index (NPCI)(RE − B)/(RE + B) [46]
Ratio vegetation index (RVI)NIR/R [46]
Table 2. Calculation formulas of textural features.
Textural FeaturesCalculation Formula
Mean i j P ( i , j ) i
Variance i j ( i m e a n ) 2 P ( i , j )  
Homogeneity i j P ( i , j ) 1 1 + ( i j ) 2
Contrast i j P ( i , j ) ( i j ) 2
Dissimilarity i j P ( i , j ) | i j |
Entropy i j P ( i , j ) l o g ( P ( i , j ) )
Second moment i j P ( i , j ) 2
Correlation i j ( i m e a n ) ( j m e a n ) × P ( i , j ) 2 v a r i a n c e
Where P(i, j) represents the image element value of the image at the point (i, j).
Table 3. Correlation analysis result between different modeling feature and wheat FHB.
FeatureRP Value
VARI−0.580**
CIgreen−0.757**
CIrededge−0.747**
DVI−0.879**
DVIRE−0.872**
EVI−0.882**
NDRE−0.757**
NDVI−0.861**
NPCI−0.805**
RVI−0.807**
NDTI−0.866**
DTI−0.893**
RTI−0.869**
** indicates that the correlation is highly significant at the 0.01 levels.
Table 4. Evaluation metrics of wheat FHB monitoring models.
FeaturesModelsTraining SetTest Set
ParametersAccuracy/%Accuracy/%Precision/%Recall/%F1 Score/%
VIsKNN K = 581.9384.6484.4683.1982.75
PSO-SVMGamma = 0.14, c = 9.3182.1184.6484.6383.2082.77
XGBoostEstimators = 10, max depth = 383.0585.0285.3683.6383.09
TIsKNN K = 989.7991.7691.390.8190.84
PSO-SVMGamma = 0.15, c = 3.7090.6392.1391.8091.2291.25
XGBoostEstimators = 10, max depth = 391.1092.5192.0091.6591.68
VIs+TIsKNN K = 790.0792.5192.1491.6491.68
PSO-SVMGamma = 1.64, c = 7.5391.8592.1391.5291.2591.29
XGBoostEstimators = 10, max depth = 393.1693.6393.1992.9092.93
Disclaimer/Publisher’s Note: The statements, opinions and data contained in all publications are solely those of the individual author(s) and contributor(s) and not of MDPI and/or the editor(s). MDPI and/or the editor(s) disclaim responsibility for any injury to people or property resulting from any ideas, methods, instructions or products referred to in the content.

