Abstract
Trade facilitation is essential to lowering overall trade costs and increasing economic returns on both the multilateral and regional levels. Trade facilitation is also an integral part of trade agreements and has become an important component of the Belt and Road Initiative (BRI). This paper adopts a time-varying stochastic frontier gravity model and a trade inefficiency model and assigns values to different trade facilitation provisions to construct relevant indicators to assess the impacts of the trade facilitation provisions of the World Trade Organization Trade Facilitation Agreement (WTO TFA) and regional trade agreements (RTAs) on trade efficiency between China and BRI countries, as well as on the current conditions and challenges of fresh agricultural product trade between China and countries of the BRI, using data from 2011 to 2020. The results show that the size of domestic markets and population positively affect agricultural trade between China and BRI countries, while geographical distance has a negative impact on their scale of trade. Moreover, this study finds that the obligations set out in trade facilitation provisions of RTAs play an important role in improving trade efficiency, and among these trade facilitation obligations improving the legal provisions of “information transparency”, “customs cooperation” and “advance ruling” can significantly improve trade efficiency, however, some measures relating to “formalities” could potentially constitute barriers to trade. This study innovatively carried out an analysis of the impact of trade facilitation provisions on agricultural trade flows and efficiency from the perspectives of international trade law and economics and provides new policy recommendations for BRI countries to support agricultural trade.
1. Introduction
Globalization and trade liberalization have provided an incentivizing backdrop for the flourishment of trade facilitation. Trade facilitation has gradually become a key part of non-tariff barrier negotiations in the Doha Round of multilateral trade negotiations and regional trade agreements (RTAs). The increased availability of advanced information technology has been shown to bolster these trends, guaranteeing the acceleration of cross-border transshipments of goods [1]. It is worth keeping in mind that facilitating trade and trade efficiency is a central concern for the World Trade Organization (WTO) and, according to statistics produced by the WTO, 259 of the RTAs in force include sections or provisions on trade facilitation.
Improving the level of trade facilitation is one of the crucial undertakings of Belt and Road Initiative (BRI), and trade in agricultural products holds a significant position among all goods traded between China and the BRI countries [2]. So far, China has signed agreements on agricultural cooperation with 86 BRI countries and established stable working mechanisms with more than half of them. China has invested in more than 820 agricultural projects in BRI countries [3]. In 2021, China imported CNY 326.55 billion (USD 47.6 billion) in agricultural products from BRI countries, and the scale of agricultural product trade has steadily increased [4]. Fresh agricultural products are easily affected by the measures of trade facilitation that touch upon these goods, due to their short shelf-life and demanding storage requirements. Studying the trade facilitation of fresh agricultural products is of central relevance for improving trade efficiency across countries participating in the BRI and can further promote the development of regional trade more generally.
Trade facilitation has become an increasingly significant part of both multilateral and regional trade agreements. However, most of the current research on trade facilitation focuses on measuring the degree of trade facilitation of one or more countries, leaving a gap in the field of research on the impacts of trade facilitation rules and provisions in the trade agreements themselves. This paper makes a comparative analysis of trade facilitation provisions in RTAs and the Trade Facilitation Agreement (TFA) developed under the auspices of the WTO; assigns values to the relevant provisions; and uses the stochastic frontier gravity model to conduct empirical research so as to summarize the development trends and impacts of trade facilitation rules on fresh agricultural product trade between China and BRI countries and formulate their beneficial moves in the direction of international trade.
This research combines existing empirical trade data into treaty obligations and brings the language of treaty provisions and their bindingness to attention. The highlighted research object “provisions of trade facilitation agreements” is both unique in the field of economic analysis and of prime importance for trade performance, and for trade flows of perishable agricultural products in particular. It aims to investigate the overlooked research questions: Is there a relationship between the level of commitment in RTAs and trade flows? How does the treaty language in trade agreements affect trade efficiency? This research tries to address these questions with evidence from fresh agricultural trade between China and BRI countries.
2. Literature Review
2.1. Existing Research on Trade Facilitation and Its Impacts on Cross-Border Trade
Early research by scholars on trade facilitation paid more attention to the theories surrounding the ease of trade and highlighted various countries’ implementations qualitatively. Taneja, for example, examined how developing and developed countries view trade facilitation. According to Taneja, developed and developing countries agree that trade facilitation will reduce trade costs, eliminate uncertainties, and increase trade and investment. Developing countries, however, have found that the extent to which trade procedures can be harmonized is limited to the country’s level of development; their access to and availability of technology; administrative traditions and capacity; etc. [5]. Satapathy points out that customs procedures at borders are often burdensome and that trade facilitation often requires simplifying procedures that need attention from all stakeholders irrespective of their stance on trade negotiations [6]. With increasingly close economic trade links among countries (regions), the trends within the field of trade and international relations academia have shifted from being purely theoretical to now including empirical research. Akinkugbe explored the impacts of trade facilitation on the exports of manufactured goods from Africa through empirical analysis of the relationships between the Corruption Perception Index of trade, road networks, the number of enterprise registration start-up procedures, export taxes and other indicators. His research led to the conclusion that improving policy regimes and making conscious efforts to eliminate any and all forms of restrictions on the movement of goods has a catalytic effect on exports of Africa’s manufactured goods [7]. Felipe and Kumar looked at the role of trade facilitation in Central Asia and measured its extent with the Logistics Performance Index (LPI); the experimental results showed that the two main factors affecting trade flow were the efficiency of the border agencies and the infrastructure [8].
According to the above literature, most scholars choose country-specific measures as the main factor to their trade facilitation index with a focus on contributing aspects surrounding customs clearance efficiency.
2.2. Existing Research on the Influencing Factors of Cross-Border Trade
There is abundant literature studying the influencing factors of cross-border trade. Cho et al. researched the impact of exchange rate changes on the bilateral trade flows of agricultural products, and the results showed that volatile exchange rates, as per their data selection period, significantly reduced agricultural trade flows. The negative impacts on trade caused by exchange rate uncertainty are more significant in the agricultural sector than in any other sectors [9]. Lewis added to this consideration by using previous studies on the impact of exchange rates and enterprise pricing as a basis to indicate that trade flows would not change if prices did not respond to exchange rate changes [10]. Kim et al. estimated the impact of trade facilitation on reducing time and costs of cargo clearance at border crossing points within the CAREC region [11]. Huang et al. analyzed the mechanism of trade facilitation to agriculture exports and tested the actual promotion effect of trade facilitation to export of Chinese agricultural products by the United States, Japan, South Korea and 28 EU countries based on the extended gravity model [12]. Based on the existing literature, the level of economic development, geographical distance [13], per capita income [14], population size [14,15] and other factors have proven to be influencing factors. In addition, cultural distance [16], trade dependency [17] and other specialized factors have also been considered by some studies. Some scholars focus their research on specific industries, including that of meat, cereal and grain [18,19].
Trade efficiency is an important indicator for trade potential estimation. Trade efficiencies can be measured by the stochastic gravity model. Drysdale et al. applied the stochastic gravity model to identify the policy determinants of trade efficiency in China’s bilateral trade with other countries and suggested inefficiency determinants to be removed through appropriate policy reform [20]. Devadason and Chandran studied the trade potential in China–ASEAN relations by measuring the trade efficiency between China and Vietnam [21].
With regard to the analysis of trade facilitation of the BRI, scholars have mostly analyzed the influencing factors and development trends of trade from the perspective of their own countries or regions. Ghiasy believes that the BRI can promote regional security and stability within the domains of assisting political stability, regional cooperation and government requirements, so as to promote agricultural trade between China and the Middle East [22]. Khan et al. emphasize the importance of the China–Pakistan Economic Corridor (CPEC) belonging to China’s BRI and focus on the strategic positioning of Gwadar Port in particular, believing that port construction and improvements play an important role in promoting agricultural trade [23].
2.3. Research Mapping and Gaps in Trade Facilitation-Related Literature
A map was obtained by item clustering the trade facilitation-related literature to date since the launch of Doha Round Negotiation 2001, when trade facilitation became an issue under multi-lateral negotiation (as shown in Figure 1). The items mined from the Web of Science database by VOS viewer are clustered into 4 clusters. Cluster#1 (red) is the most studied cluster, with items mostly related to economic analysis on impacts of trade facilitation on cross-border trade; cluster#2 (green) items are associated with legal analysis of trade facilitation-related international treaties and provisions; cluster#3 (blue) and cluster#4 (yellow) are less studied and focus on customs procedures in selected countries and regional integration perspective of trade facilitation, respectively.
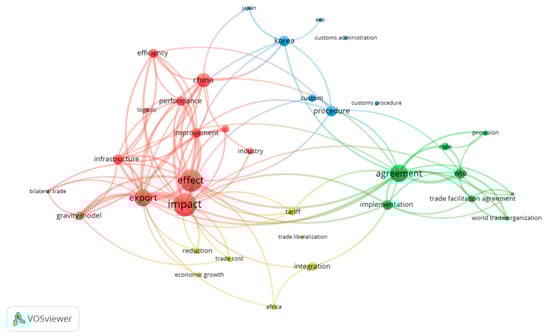
Figure 1.
Map of trade facilitation keyword clustering.
Based on the mapping of the existing literature, little research has been found to study the trade impacts of trade facilitation provisions as a research object in international agreements. In addition, few studies focus on the trade facilitation rules that govern agricultural trade flows, and there is an equal lack of disciplinary focus on the impacts of the differences between the BRI-participating countries and China when signing RTAs on trade flows. This research aims to fill the gap in the existing literature, with the objective to investigate the relationship between the level of commitment in RTAs and trade flows between China and BRI countries.
3. Background
3.1. The Influence of Trade Facilitation on Trade Flows
Trade costs are richly linked to economic policy. Trade facilitation has the potential to substantially reduce trade costs and thereby positively contribute to the increasing global trade and output [24]. United Nations ESCAP and the World Bank have jointly developed a common standard methodology for calculating comprehensive international trade costs and provide the research and policy community with a global community. The latest version covers over 180 countries [25]. According to the 2021 Global Survey on Digital and Sustainable Trade Facilitation, trade costs are estimated to reduce by 13.47% when binding and non-binding WTO TFA plus measures are implemented [26].
Many theoretical models (e.g., the “iceberg” model [27], the New Trade Theory [28], and the supply chain model [29]) have highlighted that increasing levels of trade facilitation indeed reduces trade costs; that is, a reduction in overall costs other than production costs that arise from the laborious work required for the supply of goods from producer to end consumer [30,31]. Nevertheless, facilitating trade through measures of reducing both variable and fixed costs of exports has repeatedly been found to increase trade flows by encouraging exports from firms already involved in international trade and new firms to enter the market as exporters for the first time [32].
3.1.1. The WTO Trade Facilitation Agreement
The Trade Facilitation Agreement (TFA) entered into force on the 22nd of February 2017. As of the date of writing, the TFA has since been ratified by 154 WTO members (WTO TFA database).
By building on specific requirements out of the WTO’s General Agreement on Tariffs and Trade (GATT), Section I of the TFA w made as a revisionary agenda with the aim of clarifying and improving on existing, relevant commitments. Some of these provisions were made with broader, thematic links in the image of the GATT (articles V, VIII and X), such as the publication and availability of information; the ability to appeal or review procedures; opportunities to comment, information before entry into force, and consultations; release and clearance of goods; formalities connected with importation, exportation and transit, freedom of transit as examples. It also set out provisions on customs cooperation. Section II of the TFA contains special and differential treatment (SDT) and technical assistance provisions that allow developing and least-developed countries (LDCs) to determine when they will implement individual provisions of the Agreement and where technical assistance is needed. Section III laid out requirements to establish a national trade facilitation committee (TFA legal text).
3.1.2. Trade Facilitation Provisions in RTAs
Trade facilitation is central to the agendas of both the WTO and many RTAs, but there are differences in their design and implementation. For example, part of the TFA that is not normally covered by RTAs is the leading section containing Special and Differential Treatment (SDT) and Technical Assistance. There are also substantial differences between RTAs in terms of their substantial coverage and level of commitment to said relevant provisions. This is acceptable because the assignment of RTAs is, to some extent, to find room for preferential treatment within the framework of world trade agreements.
According to the data collected on RTAs from the WTO database, the frequency or repetition of a particular clause and their topics are measurable across various RTAs (See Table 1). As shown in Table 1, “exchange of customs-related information”, “simplification/harmonization of formalities/procedures”, “border agency cooperation”, and “publication and availability of information” are the four most frequent subject clauses employed in the documented RTAs, and are included in over half of all signed RTAs.

Table 1.
Frequency of Trade Facilitation Measures within RTAs.
Information exchange and customs cooperation are the two actual areas in which a gap is revealed within RTAs, and this gap is most pronounced between RTAs and the TFA. Customs cooperation-related clauses most directly reflect the differences between RTAs to which members are enabled varying degrees of trade closeness indicating significant differences within the agreements and their scope. Such variance between clauses and agreements are indicative of which are also the most likely to be discriminatory in nature as a result. For example, the RTAs that require member signatories to provide relevant information to each other without having to extend such information to all trading partners creates problems of discrimination and preferential treatment.
3.2. The Current Situation of Fresh Agricultural Products Traded between China and BRI-Participants
The current data on the imports and exports of fresh agricultural products between China and the BRI countries comes from the UN Comtrade database and are calculated with statistics from the Food and Agriculture Organization (FAO) of the United Nations as a reference. Fresh agricultural products include products with HS codes 02-04 and 07-08. With the exclusion of certain countries due to insufficient data, this paper selects as a final sample trade data from 40 BRI countries between 2011 and 2020 as our empirical research and includes, but is not limited to, Afghanistan, Albania, Armenia, Bahrain, Bangladesh, Brunei, Bulgaria, Cambodia, the Czech Republic, Egypt, Estonia, Georgia, Greece, Hungary, India, Indonesia, Kazakhstan, Kuwait, Kyrgyzstan, Laos, Lithuania, Malaysia, Maldives, Myanmar, Nepal, Oman, Pakistan, the Philippines, Belgium, Poland, Qatar, the Russian Federation, Saudi Arabia, Singapore, Slovakia, Slovenia, Thailand, Turkey, Turkmenistan, Ukraine and Vietnam.
3.2.1. The Scale and Proportion of Fresh Agricultural Products Traded
The scale of fresh agricultural products traded between China and the BRI countries is sizable in value and proportion, accounting for more than 30% of the total level of trade of fresh agricultural products in a given year. In terms of trading scalability, the total trade valued between China and the economies of the BRI has increased from USD 13.805 billion in 2011 to USD 27.832 billion in 2020. In terms of their growth rates, however, the average annual growth rate of value traded here has remained at 8.3% over the preceding 10-year period. These statistics prove that the BRI countries are China’s major trading partners for fresh agricultural products and vice versa.
The fresh agricultural products imported to China from countries belonging to the BRI and exported by China in return show rapid growth. The total value imported increased from USD 5.513 billion in 2011 to USD 14.921 billion in 2020, while the value of exports also increased from USD 8.292 billion to USD 12.91 billion. The average annual growth rate from the same given years reached 12.7% and 5.4%, respectively. BRI-related countries are playing a vital role in both the import and export sectors of trade and China should therefore continue to expand the scale of fresh agricultural products traded with these countries.
As shown in Table 2, from 2011 to 2020, the proportion of China’s imports of fresh agricultural products from the BRI countries dropped by 10%.
Table 2.
China’s Imports of Fresh Agricultural Products from BRI-countries (Unit: USD billion).
As shown in Table 3, from 2011 to 2020, the proportion of China’s exports of fresh agricultural products to the BRI countries has been increasing.
Table 3.
China’s Exports of Fresh Agricultural Products to BRI-countries (Unit: USD billion).
Therefore, the exports and imports between BRI countries and China imply that the decrease in the proportion of trade value of China from the BRI countries in the total trade value of China results from the decrease in the import value of China from the BRI countries.
3.2.2. Market Concentration of the Major Trading Partners
Thailand, Russia, Vietnam, Indonesia and Malaysia rank as the top five countries trading with China at scale for fresh agricultural products and their market concentration as China’s leading trading partners in this sector is increasing year by year. Between 2011 and 2020, the share of fresh agricultural products traded between these five countries and China remained at around 75% (Table 4). Among these five countries, Thailand and Russia are the most important trading partners, and their market concentration as the top two destinations for China’s fresh agricultural products shows no obvious signs of an increasing trend.
Table 4.
Market Shares of the Major Trading Partners of Fresh Agricultural Products (Unit: %).
3.2.3. The Overall Traded Value from All Categories of Fresh Agricultural Products
According to the specific product categories identified by HS code, fresh agricultural products can be divided into five categories. The annual statistics released show that the value of trade of these five categories of products followed an upward trend from 2011 to 2020 (see Table 5). Among them, fish, crustaceans, mollusks, and other aquatic invertebrates have always been the most traded among all fresh agricultural products between China and the BRI countries with a year-on-year increase of 70.1% in 2019 compared to 2011. Dairy products, birds’ eggs, natural honey, and other edible products of animal origins not specified or included, accounted for the least amount of trade, but have remained stable and slightly increased over the last decade. Meat and edible meat offal, is a type of fresh agricultural product which has seen the largest increase in trade value between China and the BRI countries-up 230.95% year on year. This is followed by fruits, nuts, and citrus fruits, also up more than 100%, reaching 140.13%.
Table 5.
The Trade Value of Fresh Agricultural Products of the BRI Countries (by Product Category) (Unit: USD billion).
4. Methods and Data
4.1. Methods
The stochastic frontier gravity model is a fusion of the traditional gravity model and the stochastic frontier production function model, which was formally introduced by Kalirajan [33] to resolve the inherent bias of the traditional trade gravity model and to estimate potential trade flows. The general form of the stochastic frontier gravity model is as follows:
Tijt represents the actual trade values of country I and country j. f(xijtβ) is the function determining trade potential and is a vector with unknown parameters; trade potential, the maximum value of trade reached at the highest state of efficiency, is also given to mean the maximum possible value of trade that can be achieved using the most open (and efficient) trade policy assumptions. uijt is the trade inefficiency term, which takes a value between 0 and 1 and is dependent on the importing countries’ “post-border measures”. This bias creates structural differences in actual versus potential trade between two countries. vijt is responsible for including the effects on trade flows of other omitted variables, such as measurement errors, that are randomly distributed among the observations in the sample. TEijt is the trade efficiency value set between 0 and 1; value of 1 indicates that the trade between the two countries has reached the highest level of efficiency, while a value of 0 indicates that there is no trade between the two countries. Taking the logarithms of the left and right sides of Equation (1), we get:
As mentioned, the data in this study are intertemporal panel data from 40 countries across the span of 10 years from 2011 to 2020. Therefore, we introduce time-varying factors into the trade inefficiency model for historical accuracy. The expression of trade inefficiency is as follows:
In Equation (5), T represents the number of observation periods, and η is the eigenvalue to judge whether trade efficiency changes overtime. If η = 0, it indicates that a time invariance model is most appropriate and should be applied here; if η is not equal to 0, a time-varying model should be applied, where η > 0 means that trade inefficiency increases with time while, conversely, η < 0 means that trade inefficiency decreases with time.
In order to facilitate a quantitative analysis of trade facilitation provisions, the following part classifies and assigns values to the main provisions related to trade facilitation and builds a measurement index of the level of the provision’s commitments to trade facilitation. Trade facilitation is defined by four indicators and as a simplification for data visualization. The operational steps and statistical analysis are detailed as follows:
As shown in Figure 2, to begin with, each agreement is assigned with a “0 point” or “1 point” according to whether it covers to any provision ‘X’; “0 point” means there is no mention at all; “1 point” means provision ‘X’ is included in the TF Chapter of the RTA. Secondly, points are further assigned to coincide with the expression of the terms wherein “1 point” is for clear, detailed, and legally binding expressions while “0 point” stands for the inverse. “Legally binding” means that the provisions use normative legal terms and clearly specify the commitments observed by the parties. Finally, “1 point” will additionally be assigned to any and all provisions that may be congruous with the dispute settlement mechanism. The requirement is that the agreement must contain specific provisions indicating that it can be applied for dispute resolutions (expressed in some agreements as “consultation”, which can also be counted).
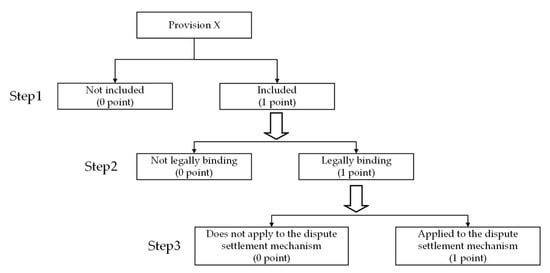
Figure 2.
Measuring the Level of the Provisions’ Commitments to Trade Facilitation.
The final score of certain trade facilitation indicators is obtained after these steps by adding up the individual scores of which the highest score would then be “4” and the lowest “0”. This step-by-step process is exemplified through a flow chart as Figure 2:
Based on the above methods and outcomes, this paper constructs four logical indicators out of the point classifications and scores—“information transparency”, “formalities“, “customs cooperation” and “advance ruling”—to measure the commitment level by the WTO’s provisions from both the TFA and RTAs to facilitating trade. Through our empirical work, the research is also able to analyze the four indicators impacts on trade inefficiency to help explore their impact on global trade and trade overall.
To study their respective impacts on fresh agricultural products traded along the BRI, the “one-step method” is applied simultaneously to the regression stochastic frontier model and the trade inefficiency model. The theoretical equations are expressed as follows:
In Equations (6) and (7), zijt represents the factors affecting trade inefficiency; εijt is the residual term; and uijt and vijt are independent of each other.
4.2. Econometric Model Setting and Variable Selection
This paper constructs a revision to the time-varying stochastic frontier gravity model, introducing appropriate variables on the basis of Equation (6). This specific expression is as follows:
In Equation (8), Tijt, as the explanatory variable, represents the trade value of fresh agricultural products between China (j is used to represent China in the following) and the BRI countries (i in period t). β1~β6 are the parameter coefficients yet to be estimated, and β0 is the residual term. PGDPit and PGDPjt signify the per capita GDP of trading countries i and j. Data of per capita GDP are drawn from the World Development Indicators (WDI) database of the World Bank, representing the degree of domestic economic development as well as residents’ living standards. In order to avoid multi-collinearity, GDP is not directly used as the variable in this case. POPit and POPjt represent the trading countries’ population sizes of j and i, respectively, and measures their domestic market demands. The data of this variable are also from WDI. DISij stands for the distance between the capital cities of the two given countries when discussed and is included because geographical distance directly affects costs of trade to differing extents. This data comes from the CEPII database; t is the variable that captures the trends with time change and vijt represents the residual term.
Building on from Equation (7), this paper constructs a trade inefficiency model manifested as follows:
In Equation (9), uijt is the explained variable and represents the trade inefficiency term of total fresh agricultural products trade between China and the BRI countries. α1~α8 are the parameter coefficients to be estimated, and α0 is the residual term. TFAit is an indication as to whether trading country i approves the WTO Trade Facilitation Agreement (TFA) at period t and, if so, then the value is placed at 1 or the value is placed at 0 if there is no approval. BFTAijt represents whether or not the given trading country and China sign an FTA during period t. If trading country and China sign an FTA during period t, then the value is 1 or, if not, then the value is 0. lnPGDPit is a reciprocal value for the number of farmers in a given trading country. It is generally believed that the more farmers there are, the higher the yield of agricultural products and the higher the value of potential trade. All the other indicators in the trade inefficiency model come from the work deduced in the previous part of this section. Equally, we can assume that the higher these indicators’ scores, the better the potential for trade in efficiency and value.
Table 6 shows descriptive statistics and variable meaning of all the variables in this study.
Table 6.
Variable Meaning and Descriptive Statistics.
5. Results and Analysis
5.1. Model Applicability Test
In order to secure the robustness and credibility of the measurement results, we need to determine an appropriate and feasible functional form [34]. This paper uses Frontier4.1 software to assess how the two models perform when practically applied. The likelihood of actual trade inefficiency is firstly tested, and time-variability within that existing trade inefficiency is then tested. The results of the likelihood ratio test below in Table 7 show that the LR statistics are 629.548 and 12.546, respectively, which rejects the null hypothesis at the significance level of 1%. The first test shows that the model’s trade composition is inefficient and is therefore suitable for further scrutiny under the stochastic frontier gravity model. The second test shows that the trade value of fresh agricultural products between China and the 40 BRI countries sampled has changed from 2011 to 2020, making this study suited to the time-varying model.
Table 7.
Hypothesis Testing of the Stochastic Frontier Gravity Model.
5.2. Analysis of Results from the Time-Varying Stochastic Frontier Gravity Model
To further test the applicability of the time-varying stochastic frontier gravity model, the “one-step method” framework is adopted. The estimated results shown in Table 8 are conducive to our empirical results. The value of γ represents the proportion of the inefficient factor that falls under the term of random trade disturbances. As shown in Table 8, the value of γ is 0.641, which is significant at the significance level of 1%. The results show that there is a gap between the actual value traded and its potential value, which can be directly attributed as a source of trade inefficiency. Equally, the value of η at 0.047 is significant at the 1% significance level, providing indication that the efficiency of the China-BRI trade of fresh agricultural products is decreasing over time. The use of the time-varying model proves itself logical as it verifies our longitudinal and empirical observation and points to why factors impeding on trade require further scrutiny. With regard to the main variables of the model, the coefficient of lnPOPit is positive, consistent with the expected sign, and is significant at the 1% significance level, indicating that the larger the population size of the BRI trading country, the greater the scale of foreign trade will be. As mentioned above, the reason for this is primarily because population size affects domestic market demands. The coefficient of lnDISij is negative, as expected, and is significant at the 1% significance level, indicating that geographical distance will indeed affect the level of trade between two countries; the farther the distance, the greater the financial burden is on trade value will decrease accordingly.
Table 8.
Estimated Results of the Time-Varying Stochastic Frontier Gravity Model.
5.3. Results and Analysis of Estimation Results from the Trade Inefficiency Model
The “one-step method” used to estimate the trade inefficiency model and the results are shown in Table 9.
Table 9.
Estimation Results of the Trade Inefficiency Model.
The following are summaries from each sections’ regression results and their analysis.
As shown in Table 9, in the stochastic frontier gravity model section, all the estimated coefficients of variables are statistically significant at a 1% significance level:
- lnPGDPjt and lnPGDPit are both significant at the 1% significance level, but the coefficient of lnPGDPjt is negative while the coefficient of lnPGDPit is positive. The positive coefficient of lnPGDPit indicates that the higher living standards and the higher level of economic development within the BRI countries, the more favorable trade is with China. The negative coefficient of lnPGDPjt implies that when China’s level of economic development is higher, the international trade with BRI countries will be reduced correspondingly. This could be due to the fact that when China’s economic development is high its domestic circulation of economy and efficiency will rise accordingly, thus will reduce its demand for imports.
- The coefficient of lnPOPit is significantly positive. This indicates that the larger the domestic market of the BRI country is, the greater the scale is of fresh agricultural products traded with China. This is consistent with most existing studies and also the economic theory of demand and supply equilibrium that a larger population has a larger supply and demand for fresh agricultural products.
- The coefficient of lnPOPjt is significantly positive at the 1% significance level. We can understand from this that China’s population affects trade output of fresh agricultural products with the BRI countries also because of the sheer size of China’s domestic demands that can promote China’s total imports of fresh agricultural products with the BRI.
- The coefficient of ln lnDISij is significantly negative at the 1% significance level. This indicates that further geographical distances will increase variable trade costs, which will have a negative impact on the scale of fresh agricultural products that can be traded between China and BRI-participants. In particular, fresh agricultural products have the characteristics of short shelf life and are perishable, thus having high requirements for transportation conditions and time. Longer geographical distances are one of the major obstacles for the time of transportation.
As shown in the second part of Table 9, in the trade inefficiency model section, most of the estimated coefficients are statistically significant:
- The coefficient of TFAit is significantly negative at the significance level of 1%. This suggests that trade facilitation with a ratified and enforced WTO agreement can reduce inefficiency within the China-BRI and improve the scalability of fresh agricultural products traded between the areas and throughout the countries. Our result is consistent with the expectations of the WTO and the research conclusions from existing literature. International trade facilitation regulations are institutional arrangements that effectively improve the efficiency of trade between two or more given countries. Therefore, it is necessary to urge WTO member countries to speed up the ratification of TFAs, join the trade facilitation “group chat”, and share in convenience and mutual benefits.
- Provisions of the TFA categorized as “Formalities”, denoted as formit, as seen, does not reach the expected significance test level and the coefficient sign of this indicator is different from the expected directions as assumed. This can be explained, as not all measures of formalities can contribute to trade efficiency. Some risk management measures relating to formalities are necessary to protect human, animal or plant life, and health, and can potentially constitute barriers to trade.
- The coefficients of transit, preit, corit are significantly negative at the 5% significance level, indicating that a low commitment to “transparency”, “advance ruling” and “customs cooperation” in FTAs will lead to or further trade inefficiency. This is in part because a reduced transparency of information, for example, on customs inspection procedures may cause problems such as the backlog of goods at customs borders. Similarly, the lack of detail on and low commitment to advance ruling provisions may reduce efficient information processing to be submitted to customs, prolonging clearance time and further negatively impacting the efficiency of trade. In addition, low commitment to customs cooperation may result in uncoordinated border management and subsequent prolonged clearance delays, thus causing inefficiency in trade.
- The coefficient of whether a BRI country sign a free trade agreement with China, BFTAijt, is not statistically significant. This could be explained by the fact that most of trade facilitation provisions in RTA are soft in nature and countries are only subject to “best endeavor” obligations. The level of implementation of trade facilitation measures could be very different across countries in reality.
- The coefficient of the logarithm of the number of farmers in trading country i, lnPGDPit, is negative and not statistically significant. This result is understandable as the development level of the agriculture sector and its agricultural trade could be characterized by many factors such as high agricultural mechanization and automation, supportive agriculture policy, knowledge and technology mastered by famers, high production and consumption ratio, etc. A large number of farmers does not necessarily indicate the flourishment of the trading country’s agriculture sectors and its agriculture trade.
6. Discussions
6.1. Countries That Have Not Ratified the WTO TFA Are Urged to Speed Up Their Ratification Process
The results suggest that obligations set out by the WTO TFA can improve the trade efficiency of fresh agricultural trade within China-BRI. This result is consistent with other empirical research on the impact of trade facilitation on trade flows in other regions including that in Africa and Central Asia and CAREC region [7,8,11]. The result is not only valuable to China and BRI countries, but also valuable for other countries. At time of writing, 95% of the WTO members have ratified the WTO TFA Agreement while a few countries have not yet completed their domestic ratification process. Therefore, it is recommended that countries that have not yet ratified the WTO TFA should accelerate their approval and ratification process.
6.2. Countries along the BRI Should Strengthen the Legal Bindingness of Trade Facilitation Provisions When Negotiating RTAs
The results of the research show that geographic distance and social formation are important indicators for trade efficiency in the BRI region. This echoes with the findings evidenced from other countries and regions using gravity models [13,14,15,16]. This study further complementary the existing literature with a result that the level of commitment of the trade facilitation provisions in trade agreements can impact trade efficiencies. Trade facilitation provisions when designing and negotiating RTAs should pay more attention to “information transparency”, “customs cooperation” and “advance ruling” to improve their clarity and state of legal bindingness with the hopes that this lays a legal foundation that enforces the improvement of the rate of customs clearance, reduces the loss of fresh agricultural products and reduces the trade costs in order to boost the trade efficiency of fresh agricultural products along the China-BRI.
6.3. Other Countries Should Also Strengthen Trade Facilitation Measures by Improving Transparency, Adopting Advance Ruling and Streamlining Customs Cooperation
At present, the measures of trade facilitation are included in nearly all RTAs concluded, indicating that countries across the board realize the value of trade facilitation for improving efficiency. However, due to the vague definition of trade facilitation and what these measures cover, and the sporadic specific clauses, trade facilitation changes to varying degrees across the RTAs studied. A global food security crisis felled by climate change, the COVID-19 and the war in Ukraine is growing. Trade facilitation is a key to addressing the worsening food security crisis. Some recent studies have identified the trends and problematic aspects of agricultural exports in the context of aggravating food crisis and assessed China’s agricultural trade development with other countries including Ukraine [35,36,37]. Results drawn from this paper reiterate that agreements are best based on openness and transparency of customs information; cooperation between customs agencies; and advance ruling of tariff classification and origin of goods, and can significantly improve trade efficiency. These findings borne from existing research are based on longitudinal, empirical, and quantitative results that together provide summary observations and frame a direction towards efficiency for the future development of future negotiation of trade facilitation provisions in other RTAs.
7. Conclusions and Prospects
7.1. Conclusions
Based on data extracted from the UN Comtrade database, this paper analyzes trade facilitation provisions in international trade agreements and summarizes the current situation of fresh agricultural products traded between China and the BRI countries using trade data from 2011 to 2020. From this, we then were able to revise the time-varying stochastic frontier gravity model applied to assess the impacts of trade facilitation provisions on trade efficiency. Based on the constructed indicators and results from empirical analysis, the following conclusions can be drawn: (1) The scope of RTAs only includes a small part of the WTO TFA but often extend into other trade facilitation areas not covered by the TFA. There are also differences between how RTAs provisions are designed in terms of the substance covered as well as varying implementations in the level of provisional commitment and strength. (2) The stochastic frontier gravity model showed that geographical distance and social formation impacts the scalability of fresh agricultural products traded between two given countries; the greater the distance, the higher the trade costs and the lower the trade value will be; the larger the population size of the trading countries, the greater the domestic market demand will be and the larger the scale of foreign trade is required. (3) The trade efficiency model is a reminder of the importance of the terms of trade facilitation—improving the level of commitment with regards to “information transparency”, “customs cooperation” and, “advance ruling” can significantly increase the trade efficiency of fresh agricultural products. However, some measures relating to “formalities” could potentially constitute barriers to trade.
7.2. Limitations and Prospects
Note that trade facilitation is one of the lowest-hanging fruits in cross-border trade, a few limitations and prospects for future research should be addressed. In terms of trade facilitation indicators, four most frequently occurred provisions were selected as research case objects. These four provisions reflect the most basic obligations set out in the multilateral WTO TFA. The impacts of other provisions, especially those going beyond the multilateral trade agreements and imposing WTO plus obligations warrant future research attention. Therefore, constructing indicators of these provisions mentioned in RTAs and WTO TFAs and incorporating them into analysis will be a direction for future research.
In some of the trade agreements, trade facilitation is not only incorporated, but also provided with very specific rules rather than general obligations. Therefore, on top of the existing judgement on whether a provision is included or not, frequency of provisions can also be counted to further measure the significance of a certain provision in the future research.
In addition, the multilateral WTO TFA contains special and differential treatment provisions that allow developing and least-developed countries to determine when they will implement individual provisions. An agreement in place does not necessarily lead to full implementation of relevant measures. Therefore, different levels of treaty implementation can also be considered as a variable to test how treaty obligations impact trade flows and trade efficiency.
Finally, the research insofar has been limited to China and BRI-participating economies, further studies with wider scope and coverage, and comparison between countries along the “Silk Road Economic Belt” and countries along the “Maritime Silk Road” can be carried out in the research field to suggest the relationship between trade facilitation provisions and regional integration.
Author Contributions
Conceptualization, J.F., H.X. and L.C.; methodology, J.F., H.X. and L.C.; software, J.F., H.X. and L.C.; validation, J.F., H.X. and L.C.; formal analysis, J.F., L.C. and H.X.; investigation, J.F. and H.X.; resources, J.F.; data curation, L.C.; writing—original draft preparation, J.F., L.C. and H.X.; writing—review and editing, J.F., H.X. and L.C.; supervision, J.F. and H.X.; and funding acquisition, J.F. All authors have read and agreed to the published version of the manuscript.
Funding
This research was funded by HUST Social Science Fund, grant number 2021XXJS103.
Institutional Review Board Statement
Not applicable.
Informed Consent Statement
Not applicable.
Data Availability Statement
Publicly available datasets were analyzed in this study.
Conflicts of Interest
The authors declare no conflict of interest.
References
- Vorontsova, N.A.; Klimova, I.A. Trade Liberalization and Trade Facilitation: Two Paths to One Goal. Vestn. St. Petersburg Univ.-Law-Vestn. St.-Peterbg. Univ.-Pravo 2021, 12, 167–183. [Google Scholar] [CrossRef]
- Foo, N.; Lean, H.H.; Salim, R. The Impact of China’s One Belt One Road Initiative on International Trade in the ASEAN Region. North Am. J. Econ. Finance 2020, 54, 101089. [Google Scholar] [CrossRef]
- China and BRI Countries Share Fruits of Agricultural Cooperation under BRI-National Development and Reform Commission (NDRC) People’s Republic of China. Available online: https://en.ndrc.gov.cn/netcoo/achievements/202112/t20211231_1311220.html (accessed on 10 November 2022).
- Zhao, S. BRI Countries Advance Agricultural Imports, Exports. Available online: https://www.chinadaily.com.cn/a/202208/29/WS630c151aa310fd2b29e74af0.html (accessed on 10 November 2022).
- Taneja, N. Trade Facilitation: Issues and Concerns. Econ. Polit. Wkly. 2004, 39, 126–129. [Google Scholar]
- Satapathy, C. Trade Facilitation: A Singapore Issue Knocking at WTO’s Door. Econ. Polit. Wkly. 2002, 37, 1587–1590. [Google Scholar]
- Iwanow, T.; Kirkpatrick, C. Trade Facilitation and Manufactured Exports: Is Africa Different? World Dev. 2009, 37, 1039–1050. [Google Scholar] [CrossRef]
- Felipe, J.; Kumar, U. The Role of Trade Facilitation in Central Asia: A Gravity Model. East. Eur. Econ. 2012, 50, 5–20. [Google Scholar] [CrossRef]
- Cho, G.; Sheldon, I.M.; McCorriston, S. Exchange Rate Uncertainty and Agricultural Trade. Am. J. Agric. Econ. 2002, 84, 931–942. [Google Scholar] [CrossRef]
- LEWIS, L.T. How Important Are Trade Prices for Trade Flows? IMF Econ. Rev. 2017, 65, 471–497. [Google Scholar] [CrossRef]
- Kim, K.; Mariano, P.; Abesamis, J. Trade Impact of Reducing Time and Costs at Borders in the Central Asia Regional Economic Cooperation Region. Emerg. Mark. Financ. Trade 2022, 58, 2602–2619. [Google Scholar] [CrossRef]
- Huang, Y.-R.; Fang, H.; Li, X.-M. Evaluation of the Promoting Effect of Trade Facilitation of Importing Countries to Agricultural Product Export of China. Int. J. Electr. Eng. Educ. 2020, 2020, 0020720920931432. [Google Scholar] [CrossRef]
- Wu, Z.; Cai, H.; Zhao, R.; Fan, Y.; Di, Z.; Zhang, J. A Topological Analysis of Trade Distance: Evidence from the Gravity Model and Complex Flow Networks. Sustainability 2020, 12, 3511. [Google Scholar] [CrossRef]
- Suwanprasert, W. Endogenous Markup, Per Capita Income and Population Size in the Gravity Equation. BE J. Theor. Econ. 2019, 19, 20170166. [Google Scholar] [CrossRef]
- Khayat, S.H. A Gravity Model Analysis for Trade between the GCC and Developed Countries. Cogent Econ. Financ. 2019, 7, 1703440. [Google Scholar] [CrossRef]
- Liu, A.; Lu, C.; Wang, Z. The Roles of Cultural and Institutional Distance in International Trade: Evidence from China’s Trade with the Belt and Road Countries. China Econ. Rev. 2020, 61, 101234. [Google Scholar] [CrossRef]
- Lehikoinen, E.; Kinnunen, P.; Piipponen, J.; Heslin, A.; Puma, M.J.; Kummu, M. Importance of Trade Dependencies for Agricultural Inputs: A Case Study of Finland. Environ. Res. Commun. 2021, 3, 061003. [Google Scholar] [CrossRef]
- Nurgazina, Z.; Lu, Q.; Zhang, S.; Ali, U. Competitiveness of Agricultural Trade Between Kazakhstan and China. Pak. J. Agric. Sci. 2020, 57, 1447–1454. [Google Scholar] [CrossRef]
- Shahriar, S.; Qian, L.; Kea, S. Determinants of Exports in China’s Meat Industry: A Gravity Model Analysis. Emerg. Mark. Financ. Trade 2019, 55, 2544–2565. [Google Scholar] [CrossRef]
- Drysdale, P.; Huang, Y.; Kalirajan, K.P. China’s Trade Efficiency: Measurement and Determinants. In APEC and Liberalisation of the Chinese Economy; ANU Press: Canberra, Australia, 2012; pp. 259–271. ISBN 978-1-922144-56-0. [Google Scholar]
- Devadason, E.S.; Chandran, V.G.R. Unlocking the Trade Potential in China-ASEAN Relations The China-Vietnam Context. J. Southeast Asian Econ. 2019, 36, 380–399. [Google Scholar] [CrossRef]
- Ghiasy, R.; Zhou, J. The Silk Road Economic Belt: Considering Security Implications and EU—China Cooperation Prospects; Stockholm International Peace Research Institute: Stockholm, Sweden, 2017; pp. 19–44. [Google Scholar]
- Khan, M.Z.U.; Khan, M.M. China-Pakistan Economic Corridor: Opportunities and Challenges. Strateg. Stud. 2019, 39, 67–82. [Google Scholar]
- Geraci, V.J.; Prewo, W. Bilateral Trade Flows and Transport Costs. Rev. Econ. Stat. 1977, 59, 67–74. [Google Scholar] [CrossRef]
- UN ESCAP. ESCAP-World Bank Trade Cost Database; UN ESCAP: Bangkok, Thaildan, 2022. [Google Scholar]
- UN ESCAP. Digital and Sustainable Trade Facilitation: Global Report 2021; UN ESCAP: Bangkok, Thaildan, 2022. [Google Scholar]
- Samuelson, P.A. The Transfer Problem and Transport Costs, II: Analysis of Effects of Trade Impediments. Econ. J. 1954, 64, 264–289. [Google Scholar] [CrossRef]
- Krugman, P. Trade, Accumulation, and Uneven Development. J. Dev. Econ. 1981, 8, 149–161. [Google Scholar] [CrossRef]
- Stevens, G.C.; Johnson, M. Integrating the Supply Chain... 25 Years On. Int. J. Phys. Distrib. Logist. Manag. 2016, 46, 19–42. [Google Scholar] [CrossRef]
- Walmsley, T.; Minor, P. Demand Shifts and Willingness to Pay in Applied Trade Models. World Econ. 2020, 43, 1499–1520. [Google Scholar] [CrossRef]
- Shepherd, B. Modelling Global Value Chains: From Trade Costs to Policy Impacts. World Econ. 2022, 45, 2478–2509. [Google Scholar] [CrossRef]
- Nikiforovich Sidorov, V.; Victorovna Sidorova, E. The Trade Facilitation in Three Dimensions: “Soft”, “Hard” and Digital. Rev. Fac. Derecho 2021, 51, e20215108. [Google Scholar] [CrossRef]
- Kalirajan, K.P. Indian Ocean Rim Association for Regional Cooperation (IOR-ARC): Impact on Australia’s Trade. J. Econ. Integr. 2000, 15, 533–547. [Google Scholar] [CrossRef]
- Wilson, J.S.; Mann, C.L.; Otsuki, T. Trade Facilitation and Economic Development: A New Approach to Quantifying the Impact. World Bank Econ. Rev. 2003, 17, 367–389. [Google Scholar] [CrossRef]
- Al-Ababneh, H.A.; Osmonova, A.; Dumanska, I.; Matkovskyi, P.; Kalynovskyy, A. Analysis of Export of Agricultural Products in the Context of the Global Food Crisis. Agric. Resour. Econ. Int. Sci. E-J. 2021, 7, 5–26. [Google Scholar] [CrossRef]
- Fenghe, Z. Analysis of the Current Situation of Agricultural Trade Development between China and Ukraine. Agric. Resour. Econ. Int. Sci. E-J. 2020, 6, 23–36. [Google Scholar] [CrossRef]
- Maslak, N.; Lei, Z.; Xu, L. Analysis of Agricultural Trade in China Based on the Theory of Factor Endowment. Agric. Resour. Econ. Int. Sci. E-J. 2020, 6, 50–61. [Google Scholar] [CrossRef]
Disclaimer/Publisher’s Note: The statements, opinions and data contained in all publications are solely those of the individual author(s) and contributor(s) and not of MDPI and/or the editor(s). MDPI and/or the editor(s) disclaim responsibility for any injury to people or property resulting from any ideas, methods, instructions or products referred to in the content. |
© 2023 by the authors. Licensee MDPI, Basel, Switzerland. This article is an open access article distributed under the terms and conditions of the Creative Commons Attribution (CC BY) license (https://creativecommons.org/licenses/by/4.0/).