Abstract
Finger millet (Eleusine coracana (L.) Gaertn.) is one of the most important cereal crops for people in Asia and Africa. It supplies energy and nutrients for all people, particularly poor people in these continents. Phosphorus (P) is an essential macronutrient for plant growth and grain quality, so an adequate amount of P is required for healthy plant life. There is considerable evidence that P deficiency affects the growths and yields of all cereals, including finger millet. The present study aimed at identifying the quantitative trait loci (QTL) for various agro-morphological and P-content traits under low P (LP) and high P (HP) conditions through linkage mapping. Two cultivars, IE-2606 (low-P-susceptible) and PR-202 (low-P-tolerant) were used to develop 100 recombinant inbred lines (RILs). In total, 55 QTL, associated with various agro-morphological (primary root length (PRL), shoot fresh weight (SFW), root fresh weight (RFW), shoot dry weight (SDW), root dry weight (RDW), and root hair density (RHD)) and P-content traits (inorganic phosphate content in shoots (PiS), inorganic phosphate content in roots (PiR), and total P content in shoots (TPS)) were detected under LP conditions. Similarly, 37 QTL for various agro-morphological (PRL, RFW, SDW, and root hair length (RHL)) and P-content traits (PiS, PiR, TPS, and total P content in roots (TPR)) were detected under HP conditions. Biotic and abiotic stress-responsive candidate genes linked to a few QTL were also identified. The identified QTL associated with agro-morphological and P-content traits in finger millet under P deficiency could be used in breeding programs to develop finger millet with better P use efficiency (PUE). Furthermore, improving finger millet growth and yield under LP soil will help to reduce Pi application and eutrophication, which may help to improve the lives of poor farmers and maintain sustainable environments in Asia and African countries.
1. Introduction
Finger millet (Eleusine coracana L. Gaertn) is an essential cereal in arid and semiarid regions of the world due to its resistance to pests, diseases, and drought [1,2,3]. It is also considered an important cereal for future human survival due to increasing and decreasing water supplies globally [1]. Finger millet is commonly cultivated in African and Asian countries for poor people’s consumption; therefore, it is considered a poor man’s crop [2,3]. Finger millet contains proteins, fat, essential macro- and micronutrients, and crude fiber, which are all equivalent to those found in other major cereals [4,5]. In particular, calcium (Ca) content is much higher in finger millet than in milk, dairy products, or other major cereals [6]. Therefore, finger millet is one of the best alternative plant sources from which to obtain more Ca for healthy human life. Many researchers have strongly suggested that finger millet can help to alleviate Ca deficiency worldwide [6,7,8,9,10]. The low carbohydrate content in finger millet grains helps reduce body weight and sugar levels in humans; hence, finger millet is the most suitable cereal for controlling obesity and treating diabetic patients [11,12]. Based on these benefits, researchers have started calling finger millet a “Super cereal or Nutra cereal” [13,14]. Finger millet is somewhat tolerant to growing under drought, insects, and pests, but cannot grow normally without a supply of essential nutrients (including phosphorus (P)) [15]. For example, finger millet growth, biomass, and yield were severely affected by low P (LP) in one instance [16]. In another study, P deficiency reduced the growths and biomasses of more than 50 finger millet genotypes [17]. Under LP stress, many cereals (rice, wheat, maize, barley, and finger millet) produce more lateral roots and root hairs and increase their lateral-root and root-hair length to increase their forage area and absorb more Pi under stress [16,17,18]. All previous studies have indicated that P is an essential macronutrient for finger millet growth and development [19]. Soil P limitation can impede crop growth and signifies poor soil health [20]. P deficiency is one of the current global problems affecting the growths and yields of cereals including finger millet and other millets [16]. In continuous cropping systems, replacement of depleted P is carried out through external application of phosphate (Pi) fertilizers to sustain crop production. Sustainable use of Pi fertilizer is as essential as its requirement because its natural supply is fast-receding and its natural distribution is geographically minimal.
Improving P use efficiency (PUE) and P acquisition efficiency (PAE) via molecular breeding will help improve plants’ aboveground and belowground traits [18,21,22]. For many years, plant breeders have identified several quantitative trait loci (QTL) associated with plant biomass, root architecture, P content, and yield in cereals under LP stress [23,24,25,26,27]. A total of 16 QTL associated with plant height (PH), shoot length (SL), number of productive tillers (NPT), panicle length (PL), shoot dry weight (SDW), seed yield (SY), plant biomass, root–shoot ratio (RSR), and seed P content (SPC) were identified in rice (Oryza sativa) under LP conditions [24]. Similarly, 36 QTL associated with SDW; root dry weight (RDW); total dry weight (TDW); RSR; shoot P content; total P content (TPC); and shoot, root, and total P-utilization efficiency were identified in wheat (Triticum aestivum) under LP conditions [28]. Gao et al., 2020 identified several QTL for PAE-, PUE-, and yield-related traits at the maturity stages in 128 recombinant inbred lines (RILs) of barley (Hordeum vulgare) under LP conditions [29]. Various researchers identified several other QTL associated with biomass, yield, PUE, and PAE traits, including those of barley [30,31], rice [32,33,34], wheat [35,36,37], sorghum (Sorghum bicolor) [26,27,38], and maize (Zea mays) [39,40] under LP conditions. As with PAE and PUE traits, several QTL associated with macro- and micronutrients have also been identified in many cereals. Recently, more than 400 QTL associated with 70 traits (including micronutrient contents, agronomic traits, and grain quality) were identified in wheat [41]. The same group also identified 483 QTL for ionomic traits (including P) from 12 segregated populations in Arabidopsis [42] and several candidate genes related to improvement of macro- and micronutrient use efficiency.
In finger millet, QTL for plant-biomass- and growth-related traits under drought stress were evaluated via association mapping [43]. QTL associated with Ca content traits in finger millet were also evaluated with association mapping [44,45,46,47]. Compared with other cereals, less attention has been paid to identify QTL associated with PUE and PAE traits in finger millet under LP conditions. Only one study has attempted to identify QTL associated with plant-biomass- and root-related traits in finger millet under LP conditions at the seedling stage [17] through association mapping. Based on previous reports, we confirmed that most QTL had been identified in finger millet through association mapping. Several linkage-mapping studies have been conducted in other cereals to dissect the genetic mechanisms that control different traits using RILs [24,28,29,32,35]. Very recently, eight QTL for blast-resistance traits (leaf blast severity and panicle blast incidence at maturity) and agronomic traits (flowering date, pH, and panicle number) were identified in finger millet through linkage mapping [48]. This is the only available study on linkage mapping in finger millet. Application of linkage mapping to identify QTL that are related to any traits under abiotic stress (particularly nutrient deficiency) has not yet been initiated in finger millet. In this study, we have identified QTL for SL, primary root length (PRL), shoot fresh weight (SFW), root fresh weight (RFW), SDW, RDW, root hair length (RHL), root hair density (RHD), Pi content in shoots and roots (PiS and PiR), and total P (TP) content in shoots and roots (TPS and TPR) using 101 simple sequence repeat (SSR) markers via linkage mapping under LP and high P (HP) conditions. We also detected candidate genes linked to a few QTL from genome sequences of various cereals under LP conditions. This study may lay the foundation to improve PUE and PAE in finger millet in LP soil via molecular marker-assisted breeding.
2. Materials and Methods
2.1. Plant Materials
Based on the previous report, two contrasting finger millet genotypes, viz., IE-2606 (low-Pi-susceptible) and PR-202 (low-Pi-tolerant) [17], were selected as parents to develop RILs. These two genotypes were used to cross and develop F1 RILs [49]. Around 100 F2 RILs were developed from the F1 RILs following a single-seed descent (SSD) method; all seeds were genetically different, and each seed was maintained as a separate line. All 100 F2 RILs were used for genotypic analysis using 21 polymorphic SSR markers (Supplementary Materials Table S1). Similarly, 100 F2:3 RILs (F2-derived F3 population) were developed from the F2 RILs, following the SSD method. These F2:3 RILs were used to collect phenotypic and P-content-related traits under LP and HP conditions. All 100 F2:3 RILs were subsequently used to construct linkage mapping for various agro-morphological and P-content-related traits under LP and HP conditions. The F2:3 RILs were used to detect several QTL for agro-morphological and biochemical traits under various abiotic stresses from other groups [50,51,52,53,54]. Therefore, we used the same strategy in our studies.
2.2. Plant Growth Experiments
This experiment was conducted in the containment greenhouse at the Entomology Research Institute, Loyola College, Chennai, India. All 100 F2:3 RILs were grown in plastic nursery pots filled with horticultural-grade perlite (Astra Chemical, India). Two different Pi levels (10 µM (low) and 300 µM (high)) were prepared with basal nutrient solutions, as has been reported previously [16,55,56], and supplied to each RIL. More than 20 seeds from all RILs were sown in separate nursery pots. The nutrient solutions were prepared in deionized water. To avoid P contamination, all pots, glassware, and measuring cylinders were washed with acid. The pH value of the basal nutrient solutions was adjusted to 5.8 with H2SO4 (0.1 M) or NaOH (0.1 M). After the seeds were sown, around 500 mL of nutrient solution was supplied to each RIL separately, once in three days. After one week of seedling growth, overgrown seedlings of each RIL were thinned from the nursery pots. A total of 15 plants were maintained in each RIL in each pot, under LP and HP conditions separately. All agro-morphological and P-content traits were examined from each RIL after 30 days of growth.
2.3. Agro-Morphological Trait Measurements
A total of eight agro-morphological traits (SL, PRL, SFW, RFW, SDW, RDW, RHL, and RHD) were measured with three replicates from 100 F2:3 RILs under LP and HP conditions. SL and PRL were measured using a stainless-steel ruler. SFW, RFW, SDW, and RDW were determined via digital weight balance. SFW and RFW were measured immediately after the seedlings were removed from their pots, the samples were dried in a 60 °C hot-air oven for 48 h, and dry weights were determined.
For measurement of RHL and RHD, the roots of each F2:3 RIL were preserved in deionized water directly after the roots were removed from perlite to avoid root hair loss. First, lateral roots were cut into pieces of about 0.7 to 1.0 cm in length for each F2:3 RIL grown in LP and HP conditions. These pieces were placed on a stage micrometer with a scale (0.01 mm), and an image of the root portion with hairs was captured with the help of 10× optical lenses using a stereo microscope (Leitz Laborlux 12, Oberkochen, Germany) and a Canon digital camera (Canon EOS 1500D 24.1 Digital SLR Camera with EF S18-55 is II Lens). RHL and RHD were counted using “ImageJ” software (http://imagej.net/; accessed on 25 February 2020). These data were measured from three representative pieces of lateral root for each F2:3 RIL grown under LP and HP conditions, and the mean values and standard deviations were analyzed.
2.4. Analysis of Pi and TP Contents in Shoot and Root Tissues of RILs
The TP and Pi contents were assayed in the shoot and root tissues (30-day-old seedlings) of 100 F2:3 RILs, based on our previous experiments [55,56]. In our previous studies, we modified the protocol based on a previously standardized protocol [57,58].
2.5. Genotyping of F2 RILs for Linkage Mapping
Genomic DNA was isolated from 28-day-old leaf tissue of all 100 F2 RILs and parental lines based on previously reported protocol [49,59]. All 100 F2 RIL seeds were assumed to be genetically different, and each seed was maintained as a separate line. A set of 101 SSR primers (Supplementary Materials Table S2) were screened into the parental lines of the finger millet to check the parental polymorphism between them [49]. Of these, 21 SSR primers produced polymorphic bands between the parental lines. Therefore, 21 polymorphic SSR primers (Supplementary Materials Table S1) were selected to analyze the genotypic variation among all 100 F2 RILs. Genotypic data were used to analyze the genetic linkage map with QTL IciMapping software [60].
2.6. QTL Mapping in RILs of Finger Millet for Agro-Morphological and P-Content Traits
The QTL mapping was carried out with QTL IciMapping software (QTL IciMapping version 4.0) using a composite interval mapping (CIM) method [60]. The LOD value threshold for claiming QTL was 2.5. QTL were detected for eight agro-morphological traits, viz., PRL, SL, SFW, RFW, SDW, RDW, RHL, and RHD, and four P-content traits (PiS, PiR, TPS, and TPR) under LP and HP conditions. All markers were assigned to linkage groups using a log of the odds ratio (LOD) score of 3.0. The LOD values were assigned based on the permutation test through QTL IciMapping software [61,62]. QTL nomenclature followed the method of McCouch, 2008 [61].
2.7. In Silico Comparative Genomics Analysis
Six molecular markers’ (UGEP16, 27, 67, 95, 101, and 104) nucleotide sequences were used to detect any candidate gene linked to the QTL. Nucleotide sequences of six markers were blasted with other Poaceae family members, such as rice, maize, wheat, sorghum, foxtail millet (Setaria italica), green foxtail (Setaria viridis), purple false brome (Brachypodium distachyon), panicgrass (Panicum hallii), and switchgrass (Panicum virgatum), using Phytozome v12.1 (http://phytozome.jgi.doe.gov/pz/portal.html; accessed on 10 June 2020) to identify any candidate genes linked to the QTL.
2.8. Statistical Analysis
The correlation between various agro-morphological and P-content-related traits was estimated with Pearson’s correlation coefficient using GraphPad Prism 6 software.
3. Results
3.1. Effects of Agro-Morphological and P-Content Traits of Finger Millet under LP Conditions
The agro-morphological and P-content traits of each RIL under LP and HP conditions were analyzed and are provided in Supplementary Materials Tables S3–S5. Initially, no variation was seen, but after 15 days, the shoot and root growths of all of the F2:3 RILs were affected by LP. For example, the PRL and SL values ranged from 5.3 to 14.8 cm and 0.9 to 5.0 cm, respectively, under LP conditions (Table 1). Eleven RILs (RIL1, 16, 25, 36, 44, 53, 54, 65, 78, 83, and 92) produced PRLs between 6.0 and 7.0 cm. These results confirmed that no significant variation was observed among these genotypes. Similarly, no significant variation was observed between RIL10, 47, 81, 88, and 95; they all produced PRLs between 14.0 and 15.0 cm. As with PRL, many RILs had no significant SL variation under LP conditions. The PRL and SL values ranged from 9.6 to 24.7 cm and 3.3 to 8.1 cm, respectively, under HP conditions (Table 1). The highest PRL (24.7 cm) was observed only in RIL71 under HP conditions, and it was significantly different from those of other RILs. Thirteen genotypes (RIL5, 9, 17, 27, 41, 55, 59, 73, 79, 84, 88, 93, and 100) produced the highest SLs (between 7.0 and 8.1 cm) and had no significant variation under HP conditions. The SLs and PRLs of the F2:3 RILs were reduced (>50%) under LP conditions compared to under HP conditions. However, some F2:3 RILs produced higher PRL and SL numbers compared to those of other F2:3 RILs under LP conditions (Supplementary Materials Table S3).

Table 1.
Mean performances of agro-morphological and P-content-related traits of 100 F2:3 RILs of finger millet grown under LP and HP conditions.
Under LP conditions, the SFW values ranged from 57.3 to 356.3 mg, averaging 192.9 mg. Around 27 RILs produced higher SFWs (>250 mg) under LP conditions compared to those of the other RILs (Supplementary Materials Table S3). Among them, four RILs (RIL19, 57, 68, and 94) produced SFWs between 250 and 260 mg under LP conditions, with no significant variation between these RILs. Under HP conditions, the mean SFW ranged from 0.9 to 4200 mg, with an average of 2.7 gm (Supplementary Materials Table S4). Twenty-four RILs (RIL1, 4, 12, 16, 22, 31, 41, 42, 45, 47, 49, 50, 63, 66, 69, 70, 71, 75, 82, 87, 89, 90, 97, and 99) produced SFWs between 2.5 and 3.0 gm under HP conditions; there was also no significant variation in SFW between these RILs. This result shows that SFWs were reduced by more than 75% in all of the finger millet RILs under LP conditions compared to under HP conditions. The average RFW of the 100 RILs was 76.2 mg, in a range from 29.1 to 146.7 mg under LP conditions (Table 1). The mean RFW among all of the RILs was 1017.5 mg, in a range from 372.1 to 1996.0 mg, under HP conditions. Among the 100 RILs, around 45 RILs produced higher (>1000 mg) RFWs under HP conditions. In particular, eleven RILs (RIL9, 17, 28, 29, 42, 57, 65, 70, 77, 83, and 97) produced RFWs between 1100 and 1200 mg and had no significant variation under HP conditions. Their RFWs were also reduced by more than 70% under LP conditions compared to HP conditions. As with SFW and RFW, the highest SDW and RDW were obtained under HP conditions in all of the finger millet RILs. The SDWs of the 100 finger millet RILs ranged from 23.8 to 196.4 mg, with RIL 95 having the highest SDW (196.4 mg) and RIL 43 having the lowest SDW (23.8 mg) under LP conditions (Supplementary Materials Table S3). Hence, both RILs were significantly different in SDW under LP conditions. The mean SDW value recorded among all of the RILs in the same LP conditions was 97.16 mg. The highest SDW was seen in RIL 56 (1986 mg), whereas RIL 25 had the lowest SDW (366.3 mg); the average SDW under HP conditions was 1219 mg (Table 1). These two RILs were also significantly different under HP conditions. Under LP conditions, RDWs ranged from 9.4 to 61.7 mg, with the mean value of 29.4 mg among all of the RILs. The average mean RDW value recorded among all of the F2:3 RILs was 296.0 mg, with RIL 9 having the highest RDW (469.6 mg) under HP conditions.
All RILs grown under LP conditions showed higher RHLs and RHDs than those grown under HP conditions. The root hair modifications of some RILs under LP and HP conditions are provided in Figure 1. Under HP conditions, the mean RHL ranged from 0.003 to 0.013 mm and the mean RHD from 10 to 37.33 in all finger millet RILs (Supplementary Materials Table S4). However, under LP conditions, the mean RHL and RHD in all of the finger millet RILs ranged from 0.006 to 0.017 mm and 24.67 to 48.67, respectively (Supplementary Materials Table S3). Most of the RILs showed average RHL and RHD values of <0.005 mm and <20, respectively, under HP conditions. Under LP conditions, many RILs showed mean RHL and RHD values of >0.008 mm and >30, respectively. Very few RILs showed mean RHL and RHD values of <0.007 mm and <26 under LP conditions, respectively. These results revealed that all of the RILs increased their RHLs and RHDs under LP conditions compared to under HP conditions.
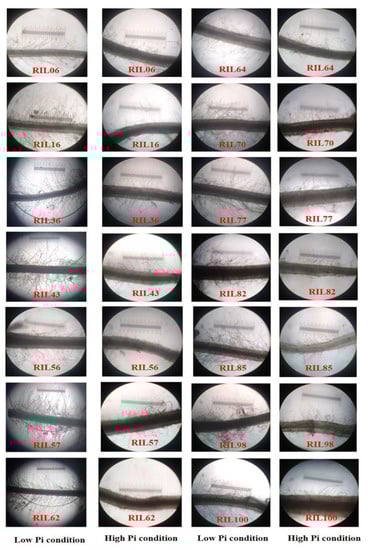
Figure 1.
Root hair images of selected F2:3 RILs of finger millet grown under LP and HP conditions in the greenhouse. These images were taken after 30 days of growth under these conditions, using 109 magnifications in a microscope (Leitz Wetzlar Germany 513,558 (Model no. Laborlux 12)).
Pi and TP contents were measured in the leaf and root tissues of all of the RILs grown under LP and HP conditions (Supplementary Materials Table S5). The leaf samples of all of the RILs contained higher amounts of Pi and TP than did the root samples grown under both LP and HP conditions.
3.2. Correlation Coefficient Variations among Agro-Morphological and P-Content Traits under LP and HP Conditions
The correlation coefficients among the agro-morphological and P-content traits were further analyzed under LP and HP conditions separately (Table 2 and Table 3). Under LP, there was a strong positive correlation (0.735) between PRL and RL. PRL was moderately correlated with SFW (0.566), RFW (0.531), SDW (0.493), and RDW (0.502) under LP conditions. SL had a strong positive correlation with SFW (0.727) and a moderate positive correlation with RFW (0.695), SDW (0.648), and RDW (0.662) under LP conditions. SFW showed a perfect positive correlation with RFW (0.917), SDW (0.864), and RDW (0.833) under LP conditions (Table 2). Similarly, RFW also showed a perfect positive correlation with SDW (0.844) and RDW (0.943) under LP conditions. A perfect positive correlation (0.868) was found between SDW and RDW under LP conditions. SL, RL, SDW, and RDW were negatively correlated with RHL, RHD, PiS, PiR, TPS, and TPR under LP conditions. A weak positive correlation (0.087) was found between RHD and RHL under LP conditions. PiS had perfect (0.820), strong (0.738), and moderate (0.682) positive correlations with TPS, PiR, and TPR, respectively, under LP conditions. A moderate positive correlation (0.556) was found between TPS and TPR under LP conditions.
Table 2.
Pearson’s correlation coefficients among agro-morphological and P-content-related traits in 100 finger millet F2:3 RILs under LP conditions.
Table 3.
Pearson’s correlation coefficients among agro-morphological and P-content-related traits in 100 finger millet F2:3 RILs under HP conditions.
Under HP conditions, a strong positive correlation (0.747) was found between PRL and SL (Table 3). PRL had a moderate positive correlation (>0.5) with SFW, RFW, SDW, and RDW and a weak positive correlation (>0.020) with RHD, RHL, PIS, PIR, TPS, and TPR under HP conditions. Similarly, SL had a perfect positive correlation (0.876) with SFW, a strong positive correlation (>0.7) with RFW and SDW and a moderate positive correlation (0.656) with RDW under HP conditions. As with PRL, SL also had a weak positive correlation (>0.04) with RHD, RHL, PIS, PIR, TPS, and TPR under HP conditions. A perfect positive correlation (>0.8) was found between SFW and RFW and between SFW and SDW at HP conditions. Similarly, a perfect positive correlation (>0.84) was found between P-content-related traits. SDW had a moderate positive correlation (0.649) only with RDW, and it had a weak positive correlation (>0.03) with RHL and all of the P-content-related traits. RHL had a negative correlation (−0.022) with RHD and a weak positive correlation (>0.05) with PiS, PiR, TPS, and TPR (Table 3).
3.3. Identification of QTL for Various Agro-Morphological, P-Content, and Root-Related Traits via Linkage Mapping under LP Conditions
QTL were identified with the CIM model of QTL IciMapping under an LOD threshold of 3.00. In total, 50 QTL were identified for six agro-morphological traits—PRL, SFW, RFW, SDW, RDW, and RHD—under LP conditions and located on chromosomes 1, 2, 3, and 4 using 21 SSR markers (Table 4). One quantitative trait locus (qPRL-4-1) was associated with PRL and flanked by the ICECP24-UGEP105 marker. qPRL-4-1 was located on chromosome 4. Fifteen QTL (qSFW-1-1, qSFW-1-2, qSFW-2-1, qSFW-2-2, qSFW-2-3, qSFW-2-4, qSFW-3-1, qSFW-3-2, qSFW-3-3, qSFW-3-4, qSFW-4-1, qSFW-4-2, qSFW-4-3, qSFW-4-4, and qSFW-4-5) associated with SFW were found under LP conditions (Table 4). The LOD score range and the percentage of the phenotypic variation between these 15 QTL were 3.44 -9.83 and 0.23–0.33%, respectively. All of these QTL were mapped on chromosomes 1, 2, 3, and 4. Under LP conditions. seven (qSDW-1-1, qSDW-2-1, qSDW-2-2, qSDW-2-3, qSDW-3-1, qSDW-4-1, and qSDW-4-2) and ten (qRDW-1-1, qRDW-1-2, qRDW-2-1, qRDW-2-2, qRDW-2-3, qRDW-2-4, qRDW-3-1, qRDW-3-2, qRDW-4-1, and qRDW-4-2) QTL were detected for SDW and RDW, respectively, and located on chromosomes 1, 2, 3, and 4. Two QTL (qPiS-1-1 and qPiS-3-1) were linked to PiS and located on chromosomes 1 and 3. The LOD scores of qPiS-1-1 and qPiS-3-1 were 3.72 and 2.52, respectively. The percentages of phenotypic variation explained with qPiS-1-1 and qPiS-3-1 were 8.39 and 9.45, respectively. One quantitative trait locus (qPiR-3-1) was closely associated with PiR and flanked by UGEP78 and UGEP95. qPiR-3-1 was located on chromosome 3, had a LOD score of 2.58, and explained 10.72% of the total phenotypic variation. Two QTL (qTPS-1-1 and qTPS-1-2) for TPS were identified between the flanking markers UGEP12 to UGEP 27 and UGEP16 to UGEP27, respectively, under LP conditions. These two QTL were located on chromosome 1. No quantitative trait locus was detected for SL under LP conditions.
Table 4.
Putative QTL identified for various agro-morphological and P-content traits via linkage mapping, using 100 RILs derived from IE-2606 and PR-202 genotypes.
3.4. Identification of QTL for Various Agro-Morphological Traits through Linkage Mapping under HP Conditions
Thirty-seven QTL were detected for five traits (PRL, RFW, SDW, and RH) and mapped to four chromosomes under HP conditions (Table 5). One quantitative trait locus (qPRL-4-1) flanked by UGEP111 to UGEP104 on chromosome 4 was detected for PRL under HP conditions. The LOD score and phenotypic variation of qPRL-4-1 were 3.18 and 13.65%, respectively. Thirteen QTL—qRFW-1-1, qRFW-1-2, qRFW-1-3, qRFW-2-1, qRFW-2-2, qRFW-2-3, qRFW-2-4, qRFW-3-1, qRFW-3-2, qRFW-3-3, qRFW-4-1, qRFW-4-2, and qRFW-4-3—were found for RFW and mapped on chromosomes 1, 2, 3, and 4 (Table 5). Each of these QTL explained more than 1.5% of the phenotypic variation. These QTL were mapped for SDW on chromosome 1 (qSDW-1-1), 2 (qSDW-2-1, qSDW-2-2, qSDW-2-3, and qSDW-2-4), 3 (qSDW-3-1, qSDW-3-2, qSDW-3-3, and qSDW-3-4), and 4 (qSDW-4-1, qSDW-4-2, qSDW-4-3, and qSDW-4-4). The LOD score range of all 13 QTL was >25, except for that of qSDW-2-1. A single quantitative trait locus (qRHL-1-1) for RHL was detected on chromosome 1, with a LOD score of 2.7, and explained about 14.28% of the total phenotypic variance (Table 5). No quantitative trait locus was detected for SFW, RDW, or SL under HP conditions. A total of nine QTL related to P-content traits were detected under HP conditions: two for PiS, one for PiR, five for TPS, and one for TPR. The LOD scores of these nine QTL ranged from 2.56 to 3.67 for P-content traits, and these QTL could explain 3.32–12.97% of the phenotypic variance. Among these nine QTL, one (qPiR-1-1) was detected for Pi content in roots, with a LOD threshold of 2.97 and flanked by UGEP27 to UGEP16. Five QTL (qTPS-1-1, qTPS-2-1, qTPS-3-1, qTPS-4-1, and qTPS-4-2) were identified for TP content in shoots and located on chromosomes 1, 2, 3, and 4. Quantitative trait locus (qTPS-1-1), found on chromosome 1, was flanked by UGEP27-UGEP16 and had a LOD threshold of 3.72, which explained 6.57% of the total phenotypic variation for TPS in the RILs. The remaining four QTL, which explained about >3% of the total phenotypic variation for TPS in the RILs, were located on chromosomes 2, 3, and 4. A quantitative trait locus (qTPR-1-1) for TPR under HP conditions was located on chromosome 1, between markers UGEP27 and UGEP16.
Table 5.
Putative QTL identified for various agro-morphological and P-content traits via linkage mapping, using 100 RILs derived from IE-2606 and PR-202 genotypes.
3.5. Identification of Candidate Genes Linked to QTL from the Genome Sequences of Various Cereals
Six SSR markers (UGEP16, 27, 67, 95, 101, and 104) were selected for the identification of any candidate genes linked to the QTL. These six SSR markers were mainly flanked by several QTL. The nucleotide sequences of each SSR marker were BLAST-searched with the genomes of other Poaceae family members, such as rice, maize, wheat, sorghum, foxtail millet, green foxtail, purple false brome, panicgrass, and switchgrass, to identify the candidate genes. More than fifteen candidate genes were identified using these six SSR markers (Table 6). UGEP27 corresponded to the Myb/SANT-like DNA-binding domain (Myb_DNA-bind_3), ATP-binding cassette, subfamily B (MDR/TAP) member 1, and transferase family genes. Several genes, namely GATA transcription factor 2 and ubiquitin carboxyl-terminal hydrolase 48, were found in the foxtail millet (Seita.9G325200.1) and sorghum (Sobic.008G098300.1) genomes, for the same marker. BTB/POZ domain (BTB)/NPR1/NIM1-like defense protein C terminal (NPR1-like-C) was detected in the foxtail millet genome at 5.37 kb upstream from UGEP67.
Table 6.
Details of candidate genes linked to the QTL, identified with SSR markers of finger millet in different members of the Poaceae family.
Additionally, two transcription factors, RING-H2 finger protein ATL13-related and serine/threonine-protein kinase, were detected in the panicgrass genome at 5.37 kb and 1.07 kb downstream, respectively, from the same marker. Notably, the score was higher and E-values were lower for both RING-H2 finger protein ATL13-related and serine/threonine-protein kinase. IgA-specific serine endopeptidase was located at 10.7 kb upstream of UGEP16 in the switchgrass genome. The UGEP95 sequence showed a match with the Heat shock protein 70 KDa and calcium-binding EGF domain (EGF_CA) genes of the foxtail millet genome and the Beta catenin-related armadillo repeat-containing maize genome.
4. Discussion
P is the second most growth-limiting macronutrient after nitrogen and plays several important roles in all organisms, including plants [18,20,63]. In soil, P is available in both organic and inorganic forms. P deficiency reduces the growths and yields of several crop plants, including finger millet [16,64]. Plants respond to P deficiency through phenotypic changes, especially through modification of root architecture [65]. In this study, the SLs, SFWs, RFWs, SDWs, and RDWs were reduced in all of the RILs of finger millet under LP conditions compared to under HP conditions. In addition, LP stress decreased PRL and increased root hair development. The contents of Pi and TP were also decreased in both the root and shoot tissues of all of the RILs under LP conditions compared to under HP conditions (Supplementary Materials Table S5). These results revealed that finger millet could uptake a sufficient amount of Pi under HP conditions; therefore, all of these RILs produced higher fresh and dry weights of shoots and roots compared to those grown under LP conditions. Under LP conditions, plants cannot uptake a sufficient amount of Pi; therefore, the fresh and dry weights of the shoots and roots and the Pi and TP contents were severely reduced in all of these finger millet RILs compared to those under HP conditions. However, RIL RHL and RHD increased under LP conditions compared to under HP conditions in order to capture more Pi. The same type of mechanism has been reported in finger millet [17], all millets [16], foxtail millet [55,66], rice [67,68], and wheat [69]. The root is an essential plant organ that helps absorb nutrients and water from the soil. Plants modify their root architectural traits, including reduced PRL, increased length and number of lateral roots and root hairs, increased root surface area and volume, and shallower root growth, under LP conditions [70,71]. Many studies have identified a series of phytohormones (sugars, auxins, ethylene, cytokinins, and abscisic acid), genes (LP root 1 (LPR1), P-deficiency response 2 (PDR2), P-starvation-insensitive (PSI), and P-starvation response 1 (PHR1)) and transcription factors (WRKY, ZAT6, MYB, etc.) involved in root-architecture modification under LP conditions [65,72]. All of these phytohormones, root-responsive genes, and transcription factors become active during plant growth under LP, triggering changes in molecular, physiological, and cellular processes. As a result, root architecture is modified, allowing plants to adapt effectively to LP soil. Some RILs produced higher mean SL, PRL, SDW, and RDW values under LP conditions (Supplementary Materials Table S3). A similar study was performed in 128 genotypes of finger millet under LP and HP conditions [17]. Those researchers also reported that LP stress reduced the SDWs, RDWs, and PRLs of 128 finger millet genotypes under LP conditions compared to under HP conditions. In addition, root hair density and length were significantly increased under LP conditions [17]. In another study, all small millets reduced their PRLs, SLs, SDWs, RDWs, and Pi and total P contents in shoot and root tissues under LP conditions [16]. Fifty-four foxtail millet genotypes were screened under LP and HP conditions to analyze their growths and yields [66]. Among them, most of the genotypes reduced pH, number of tillers, leaf length, leaf width, number of clusters, seeds per cluster, and total seed yield under LP conditions. P deficiency not only affects millet growth; it affects all of the major cereals, including rice [73,74], wheat [75,76], maize [77,78], barley [79,80], and sorghum [81]. Based on the previous and present reports, P loss will be one of the major abiotic stresses that will affect finger millet growth and yield in the future. Therefore, the effort is needed from biotechnologists, agronomists, and plant breeders to develop newer finger millet varieties to acclimatize in LP soil.
Marker-assisted breeding has been proposed as an important tool to identify and develop improved varieties of crop plants with high PUE and PAE. Identification of QTL for traits related to PUE and PAE has been considered the first step in marker-assisted selection and improvement of crop yield programs. In the present study, 100 RILs were used to detect QTL for various agro-morphological, root, and P-content-related traits under LP and HP conditions, using 21 polymorphic SSR markers (out of 101 SSR markers). In total, 55 QTL associated with PRL, SFW, RFW, SDW, RDW, RHD, PiS, PiR, and TPS were detected under LP conditions. Among these 55 QTL, one (qPRL-4-1) and four (qRHD-2-1, qRHD-2-2, qRHD-3-1, and qRHD-3-2) were identified for PRL and RHD, respectively, under LP conditions (Table 4). In an earlier report, several QTL were identified for root-system-related traits, including lateral root length (LRL) and lateral root number (LRN) [82], and for RHL [83] in maize under LP conditions. A single quantitative trait locus for seminal root length and three QTL for seminal root number were identified in maize under LP conditions by the same group [84]. In 138 RILs of wheat, seven QTL for root diameter were identified using 120,370 single-nucleotide polymorphisms, 733 diversity arrays technology markers (DArT), and 119 SSR markers [85]. Many QTL for root number and maximum root length were identified in 271 introgression lines (ILs) of rice, using 178 SSR markers under LP conditions [86]. A total of 10 QTL for root architecture traits (four QTL for root surface area (RSA), four for root volume, and two for PRL) related to P deficiency were identified in 124 RILs of Brassica napus using 202 SSR, 62 amplified fragment length polymorphisms (AFLPs), 234 sequence-related amplified polymorphisms (SRAPs), and 55 functional markers [87]. A single quantitative trait locus for root width and two QTL each for PRL and RSA were detected in 106 soybean RILs derived from BD2 × BX10 [88]. All of these results will help us to understand better the genetic relationships between plant-root-architecture modification and P efficiency. Two contrasting soybean genotypes (CN4 and XM6) and their 88 RILs were used to detect QTL for RHD, average root hair length and root hair length per unit root under LP conditions [89]. Under LP conditions, seven and ten QTL were detected for SDW and RDW, respectively, in this study. In our previous study, we reported two QTL for RDW in LP starvation, with seedlings of 127 finger millet genotypes, using 72 SSR markers through association mapping [17]. QTL for biomass traits has not yet been reported in finger millet through linkage mapping under LP conditions. However, several reports are available on identification of QTL for crop plants’ shoot- and root-related traits under LP conditions. The parents, Hanxuan 10 × Lumai 14, were used to develop 120 doubled haploid lines (DHLs) that were used to detect seven QTL for SDW at seedling stages of wheat under LP conditions [38]. In wheat, three different crosses were developed from crosses among four Chinese genotypes to develop RILs: Weimai 8 × Luohan 2 (179 RILs), Weimai 8 × Yannong 19 (175 RILs), and Weimai 8 × Jimai 20 (172 RILs). These three related RILs were used to identify six and four QTL for RDW and SDW, respectively, under LP conditions, using 576 DArT and 496 expressed sequence tag (EST)-SSR markers [90]. In another study, a single quantitative trait locus associated with RDW in 142 RILs derived from two Chinese winter wheat varieties (Xiaoyan 54 × Jing 411) was identified [35]. A total of 176 RILs of wheat derived from Shannong 0431 × Lumai 21 were used to detect more than two QTL for SDW and RDW under LP conditions, using 5916 SSR markers [28]. Seven QTL associated with RDW were determined in 241 RILs of maize derived from the cross of 082 and Ye107 genotypes under LP conditions [91]. Ming et al., 2000 mapped three QTL, one each for RDW, SDW, and TDW, in 127 DHLs of rice derived from the cross of genotypes ZYQ8 × JX17 [92].
Five QTL associated with P-content traits (two for PiS, one for PiR, and two for TPS) were identified in finger millet through linkage mapping under LP conditions. Previously, some QTL associated with agro-morphological traits were identified in finger millet through association mapping under LP conditions [17]. In addition, neither association nor linkage mapping has yet detected QTL related to P-content traits in finger millet. In the present study, linkage mapping identified QTL in various agro-morphological and P-content traits. Seven QTL associated with root and leaf P contents were reported in 184 RILs of soybean developed from the Kefeng no. 1 × Nanong 1138-2 genotypes [93]. Five QTL for root P content were identified in 106 soybean RILs derived from a cross of BD2 × BX10 [88]. In wheat, four QTL for P concentration and six QTL for P content were identified with 395 SSR markers in 119 DHLs developed from a cross of Hanxuan 10 × Lumai 14 [94]. This study identified no quantitative trait locus for SL under both LP and HP conditions. In addition, more QTL related to various agro-morphological and P-content traits were detected under LP conditions than under HP conditions in this study. The identified QTL associated with PUE traits from this study may help to improve finger millet growth under LP conditions. Furthermore, we identified various biotic- and abiotic-stress-responsive genes and transcription factors from the genomes of cereals using the nucleotide sequences of LP stress-response QTL in the present study (Table 6). In our previous study, we also found several candidate genes, linked to QTL, that were responsive to biotic and abiotic stresses from the genomes of different cereals [17,95]. In the present study, GATA transcription factor 2 was identified from the genome sequence of foxtail millet and corresponded to quantitative trait locus UGEP27. GATA transcription factors are involved in seed germination; chloroplast and flower development; lateral root formation; nitrogen metabolism and assimilation; and responses to cold, drought, and heat stresses [96,97,98,99,100]. In rice, OsGATA2b was found to be highly expressed in shoot tissue under cold and salinity stresses [101]. Very recently, GATA transcription factors were expressed in roots, leaves, stems, spikes, and wheat grains under LP conditions [102]. Hence, analyzing the expression pattern and functional characterization of GATA transcription factor 2 in finger millet may help to improve its growth under LP and other abiotic stress conditions. Based on the previous report, we assumed that the GATA transcription factors played a potential role in coordinating nutrition utility and vegetative growth. A really interesting new gene (RING) finger protein was linked to quantitative trait locus UGEP67 and identified in the genome of Panicum halli (Table 6). RINGs have been reported to be involved in plant responses to biotic (bacterial and viral disease) and abiotic stresses (drought, salinity) [103,104]. For example, RING finger proteins were highly expressed in root tissues of rice under different abiotic stresses, such as salinity, drought, heat, and abscisic acid [105]. RING finger proteins also enhance the growths of maize [106], wheat [107] and other cereals [108] under drought, salinity, and heat stresses. The serine/threonine-protein kinase gene confers enhanced plant growth and development under cold, drought, and salt stresses [109]. As in our studies, several biotic- and abiotic-stress-responsive candidate genes have been identified using sequences of various markers linked closely to QTL from various cereals. For example, shoot P use efficiency QTL of barley were used to identify the phosphate transporter 1 family gene (PHT1;8) in rice and Arabidopsis [29]. In the same study, many acid phosphatase genes from the genomes of rice, maize, and Arabidopsis were identified using the nucleotide sequences of QTL for PAE and PUE traits. The PHT1;8 gene was also identified from the rice genome using finger millet QTL for SDW [17]. PHT1-family transporters have been involved in uptake, translocation, and remobilization of Pi under LP conditions. The expression levels of PHT1-family transporters were identified in leaf and root tissues of finger millet under LP conditions. However, the analyzed PHT1-family transporters were not retrieved from the genome sequences of the finger millet. We have recently identified various nutrient-family transporters (including PHT1 members) for finger millet from its draft genome sequences [10]. Hence, analyzing the expression levels of PHT1-family genes in various tissues of finger millet may help to initiate further functional characterization studies. Functional characterization of PHT1-family members might help researchers in identifying the exact role of PHT1-family genes in finger millet. Nowadays, genome-editing tools are widely used to identify the roles of genes and transcription factors in response to biotic and abiotic stresses. Several articles have been published on the importance of genome-editing tools in cereals under biotic and abiotic stresses [110,111,112,113]. Genome-editing tools have not yet been implemented in any millet under any stress [114]. Hence, characterization of identified candidate genes with a genome-editing tool helps to understand the accurate role of each candidate gene under various biotic and abiotic stresses in finger millet. Our study did not find any candidate genes related to PHT-family transporters due to use of non-native SSR markers. Therefore, development of markers and genes from the finger millet genome will help to initiate in-depth molecular experiments that may improve finger millet growth and yield under biotic and abiotic stresses.
5. Conclusions
Unlike with rice, maize, wheat, and other major cereals, reports of QTL via linkage mapping study are in their juvenile stage in finger millet. When finger millet is x with other cereals, few efforts have been initiated to identify QTL associated with agro-morphological and P-content-related traits under LP conditions. In the present study, we identified many QTL for agro-morphological and P-content-related traits via linkage mapping under LP conditions for the first time. The identified QTL in finger millet ought to be further mapped and validated to develop new finger millet varieties with enhanced PUE in LP soils worldwide. Development of new and improved varieties using marker-assisted breeding will limit use of nonrenewable Pi fertilizers and improve PUE of key crop plants in low-input agriculture. This study will offer a new opportunity for collaboration among breeders, geneticists, physiologists, crop physiologists, soil scientists, and others. Recent developments in genotyping and selection of whole-genome sequencing may accelerate the QTL identification process. To this end, new technologies, such as rAmpSeq, will make it easier and cheaper to genotype large numbers of lines for QTL and association mapping. This can turn emerging genetic PUE data into improved crop performance all over the world.
Supplementary Materials
The following supporting information can be downloaded at: https://www.mdpi.com/article/10.3390/agriculture13020262/s1, Table S1: Details of polymorphic SSR primers used to analyze the genetic variation between 100 RILs of finger millet; Table S2: Details of SSR primers used to check the polymorphism between the parental lines; Table S3: Details on the agro-morphological traits in 100 RILs of finger millet under LP condition; Table S4: Details on the agro-morphological traits in 100 RILs of finger millet under HP condition; Table S5: Details on the P content traits in 100 RILs of finger millet under low and high Pi condition
Author Contributions
Conceptualization, T.M., T.P.A.K. and S.A.C.; methodology, T.M., T.P.A.K. and S.A.C.; software, TMR, T.P.A.K. and K.R.; validation, T.M., T.P.A.K. and S.A.C.; formal analysis, T.M., T.P.A.K. and S.A.C.; investigation, T.M., T.P.A.K., S.A.C. and S.I.; writing—original draft preparation, T.M. and T.P.A.K.; writing—review and editing, T.M., S.A.C., M.R. (Manikandan Ramesh), M.R.(Muthusamy Ramakrishnan) and S.I.; supervision, S.A.C. and S.I.; funding acquisition, S.A.C. and S.I. All authors have read and agreed to the published version of this manuscript.
Funding
The authors thank the Loyola College-Times of India project for providing financial support through grant 7LCTOI14ERI001.
Institutional Review Board Statement
Not applicable.
Data Availability Statement
Not applicable.
Acknowledgments
We thank ICRISAT, Hyderabad, India for supplying finger millet seeds. We also sincerely thank the Rajagiri College of Social Sciences for all of its support of and help with this research.
Conflicts of Interest
The authors declare no conflict of interest.
References
- Ceasar, S.A.; Maharajan, T. The role of millets in attaining United Nation’s sustainable developmental goals. Plants People Planet 2022, 4, 345–349. [Google Scholar] [CrossRef]
- Krishna, T.P.A.; Maharajan, T.; Ignacimuthu, S.; Ceasar, S.A. Improving the Nutrient-Use Efficiency in Millets by Genomics Approaches. In Omics of Climate Resilient Small Millets; Springer: Berlin/Heidelberg, Germany, 2022; pp. 205–220. [Google Scholar]
- Maharajan, T.; Ceasar, S.A.; Krishna, T.P.A.; Ignacimuthu, S. Mining Genes and Markers Across Minor Millets Using Comparative Genomics Approaches. In Omics of Climate Resilient Small Millets; Springer: Berlin/Heidelberg, Germany, 2022; pp. 185–203. [Google Scholar]
- Hassan, Z.M.; Sebola, N.A.; Mabelebele, M. The nutritional use of millet grain for food and feed: A review. Agric. Food Secur. 2021, 10, 16. [Google Scholar] [CrossRef] [PubMed]
- Nithiyanantham, S.; Kalaiselvi, P.; Mahomoodally, M.F.; Zengin, G.; Abirami, A.; Srinivasan, G. Nutritional and functional roles of millets—A review. J. Food Biochem. 2019, 43, e12859. [Google Scholar] [CrossRef] [PubMed]
- Maharajan, T.; Ceasar, S.A.; Krishna, T.P.A.; Ignacimuthu, S. Finger millet [Eleusine coracana [L.] Gaertn]: An orphan crop with a potential to alleviate the calcium deficiency in the semi-arid tropics of Asia and Africa. Front. Sustain. Food Syst. 2021, 5, 684447. [Google Scholar] [CrossRef]
- Anitha, S.; Givens, D.I.; Botha, R.; Kane-Potaka, J.; Sulaiman, N.L.B.; Tsusaka, T.W. Calcium from Finger Millet—A Systematic Review and Meta-Analysis on Calcium Retention, Bone Resorption, and In Vitro Bioavailability. Sustainability 2021, 13, 8677. [Google Scholar] [CrossRef]
- Puranik, S.; Kam, J.; Sahu, P.P.; YadavM, R.; Srivastava, R.K.; Ojulong, H. Harnessing finger millet to combat calcium deficiency in humans: Challenges and prospects. Front. Plant Sci. 2017, 8, 1311. [Google Scholar] [CrossRef]
- Chandra, D.; Chandra, S.; Sharma, A.K. Review of Finger millet [Eleusine coracana [L.] Gaertn]: A power house of health benefiting nutrients. Food Sci. Hum. Wellness 2016, 5, 149–155. [Google Scholar] [CrossRef]
- Maharajan, T.; Ceasar, S.A.; Krishna, T.P.A. Finger Millet [Eleusine coracana [L.] Gaertn]: Nutritional Importance and Nutrient Transporters. Crit. Rev. Plant Sci. 2022, 41, 1–31. [Google Scholar] [CrossRef]
- Gull, A.; Jan, R.; Nayik, G.A.; Prasad, K.; Kumar, P. Significance of finger millet in nutrition, health and value added products: A review. Magnes 2014, 3, 1601–1608. [Google Scholar]
- Devi, P.B.; Vijayabharathi, R.; Sathyabama, S.; Malleshi, N.G.; Priyadarisini, V.B. Health benefits of finger millet [Eleusine coracana L.] polyphenols and dietary fiber: A review. J. Food Sci. Technol. 2014, 51, 1021–1040. [Google Scholar] [CrossRef]
- Kumar, A.; Metwal, M.; Kaur, S.; Gupta, A.K.; Puranik, S.; Singh, S.; Yadav, R. Nutraceutical value of finger millet [Eleusine coracana (L.) Gaertn.], and their improvement using omics approaches. Front. Plant Sci. 2016, 7, 934. [Google Scholar] [CrossRef]
- Onipe, O.O.; Ramashia, S.E. Finger Millet Seed Coat—A Functional Nutrient-Rich Cereal By-Product. Molecules 2022, 27, 7837. [Google Scholar] [CrossRef]
- Ceasar, S.A.; Maharajan, T.; Krishna, T.P.A.; RamakrishnanM, M.; Roch, G.V.; Satish, L. Finger millet [Eleusine coracana [L.] Gaertn.] improvement: Current status and future interventions of whole genome sequence. Front. Plant Sci. 2018, 9, 1054. [Google Scholar] [CrossRef]
- Maharajan, T.; Ceasar, S.A.; Krishna, T.P.A.; Ignacimuthu, S. Phosphate supply influenced the growth, yield and expression of PHT1 family phosphate transporters in seven millets. Planta 2019, 50, 1433–1448. [Google Scholar] [CrossRef]
- Ramakrishnan, M.; Ceasar, S.A.; Vinod, K.K.; Duraipandiyan, V.; Krishna, T.P.; Upadhyaya, H.D. Identification of putative QTLs for seedling stage phosphorus starvation response in finger millet [Eleusine coracana L. Gaertn.] by association mapping and cross species synteny analysis. PLoS ONE 2017, 12, e0183261. [Google Scholar] [CrossRef]
- Maharajan, T.; Ceasar, S.A.; Krishna, T.P.A.; Ramakrishnan, M.; Duraipandiyan, V.; Naif Abdulla, A. Utilization of molecular markers for improving the phosphorus efficiency in crop plants. Plant Breed. 2018, 137, 10–26. [Google Scholar] [CrossRef]
- Roch, G.V.; Maharajan, T.; Ceasar, S.A.; Ignacimuthu, S. The Role of PHT1 Family Transporters in the Acquisition and Redistribution of Phosphorus in Plants. Crit. Rev. Plant Sci. 2019, 38, 171–198. [Google Scholar] [CrossRef]
- Baker, A.; Ceasar, S.A.; Palmer, A.J.; Paterson, J.B.; Qi, W.; Muench, S.P. Replace, reuse, recycle: Improving the sustainable use of phosphorus by plants. J. Exp. Bot. 2015, 66, 3523–3540. [Google Scholar] [CrossRef]
- Balyan, H.S.; Gahlaut, V.; Kumar, A.; Jaiswal, V.; Dhariwal, R.; Tyagi, S. Nitrogen and phosphorus use efficiencies in wheat: Physiology, phenotyping, genetics, and breeding. Plant Breed. Rev. 2016, 40, 167–234. [Google Scholar]
- Rose, T.J.; Liu, L.; Wissuwa, M. Improving phosphorus efficiency in cereal crops: Is breeding for reduced grain phosphorus concentration part of the solution? Front. Plant Sci. 2013, 4, 444. [Google Scholar] [CrossRef]
- Ali, J.; Jewel, Z.A.; Mahender, A.; Anandan, A.; Hernandez, J.; Li, Z. Molecular genetics and breeding for nutrient use efficiency in rice. Int. J. Mol. Sci. 2018, 19, 1762. [Google Scholar] [CrossRef] [PubMed]
- Kale, R.R.; Durga Rani, C.V.; Anila, M.; Mahadeva Swamy, H.K.; Bhadana, V.P.; Senguttuvel, P. Novel major QTLs associated with low soil phosphorus tolerance identified from the Indian rice landrace, Wazuhophek. PLoS ONE 2021, 16, e0254526. [Google Scholar] [CrossRef] [PubMed]
- Maharajan, T.; Roch, G.V.; Ceasar, S.A. Recent advancements of molecular breeding and functional genomics for improving nitrogen-phosphorus-and potassium-use efficiencies in wheat. In Molecular Breeding in Wheat, Maize and Sorghum: Strategies for Improving Abiotic Stress Tolerance and Yield; CABI: Wallingford, UK, 2021; pp. 170–196. [Google Scholar]
- Kumar, K.; Yadava, P.; Gupta, M.; Choudhary, M.; Jha, A.K.; Wani, S.H. Narrowing down molecular targets for improving phosphorus-use efficiency in maize [Zea mays L.]. Mol. Biol. Rep. 2022, 49, 12091–12107. [Google Scholar] [CrossRef] [PubMed]
- Maharajan, T.; Krishna, T.P.A.; Kiriyanthan, R.M.; Ignacimuthu, S.; Ceasar, S.A. Improving abiotic stress tolerance in sorghum: Focus on the nutrient transporters and marker-assisted breeding. Planta 2021, 254, 90. [Google Scholar] [CrossRef] [PubMed]
- Yuan, Y.; Zhang, M.; Zheng, H.; Kong, F.; Guo, Y.; Zhao, Y. Detection of QTL for phosphorus efficiency and biomass traits at the seedling stage in wheat. Cereal Res. Commun. 2020, 48, 517–524. [Google Scholar] [CrossRef]
- Gao, S.; Xia, J.; Yuan, S.; Shen, Y.; Zhong, X.; Zhang, S. Novel QTL conferring phosphorus acquisition and utilization efficiencies in barley. Front. Genet. 2020, 11, 580452. [Google Scholar] [CrossRef]
- Gong, X.; Wheeler, R.; Bovill, W.D.; McDonald, G.K. QTL mapping of grain yield and phosphorus efficiency in barley in a Mediterranean-like environment. Theor. Appl. Genet. 2016, 129, 1657–1672. [Google Scholar] [CrossRef]
- Gong, X.; McDonald, G. QTL mapping of root traits in phosphorus-deficient soils reveals important genomic regions for improving NDVI and grain yield in barley. Theor. Appl. Genet. 2017, 130, 1885–1902. [Google Scholar] [CrossRef]
- Mahender, A.; Anandan, A.; Pradhan, S.K.; Singh, O.N. Traits-related QTLs and genes and their potential applications in rice improvement under low phosphorus condition. Arch. Agron. Soil Sci. 2018, 64, 449–464. [Google Scholar] [CrossRef]
- Ping, M.U.; Huang, C.; Jun Xia, L.I.; Li-Feng, L.I.U.; Zi-Chao, L.I. Yield trait variation and QTL mapping in a DH population of rice under phosphorus deficiency. Acta Agron. Sin. 2008, 34, 1137–1142. [Google Scholar]
- Shimizu, A.; Yanagihara, S.; Kawasaki, S.; Ikehashi, H. Phosphorus deficiency-induced root elongation and its QTL in rice [Oryza sativa L.]. Theor. Appl. Genet. 2004, 109, 1361–1368. [Google Scholar] [CrossRef]
- Ren, Y.; Qian, Y.; Xu, Y.; Zou, C.; Liu, D.; Zhao, X. Characterization of QTLs for root traits of wheat grown under different nitrogen and phosphorus supply levels. Front. Plant Sci. 2017, 8, 2096. [Google Scholar] [CrossRef]
- Su, J.Y.; Zheng, Q.; Li, H.W.; Li, B.; Jing, R.L.; Tong, Y.P. Detection of QTLs for phosphorus use efficiency in relation to agronomic performance of wheat grown under phosphorus sufficient and limited conditions. Plant Sci. 2009, 176, 824–836. [Google Scholar] [CrossRef]
- Yang, M.; Wang, C.; Hassan, M.A.; Li, F.; Xia, X.; Shi, S. QTL mapping of root traits in wheat under different phosphorus levels using hydroponic culture. BMC Genom. 2021, 22, 174. [Google Scholar] [CrossRef]
- Bernardino, K.C.; Pastina, M.M.; Menezes, C.B.; de Sousa, S.M.; Maciel, L.S.; Guimarães, C.T. The genetic architecture of phosphorus efficiency in sorghum involves pleiotropic QTL for root morphology and grain yield under low phosphorus availability in the soil. BMC Plant Biol. 2019, 19, 87. [Google Scholar] [CrossRef]
- Uddin, M.S.; Azam, M.G.; Billah, M.; Bagum, S.A.; Biswas, P.L.; Khaldun, A.B.M. High-Throughput Root Network System Analysis for Low Phosphorus Tolerance in Maize at Seedling Stage. Agronomy 2021, 11, 2230. [Google Scholar] [CrossRef]
- Ren, Z.; Zhang, X.; Liu, H.; Liu, W.; Nie, Z.; Liu, D. QTL analysis of delayed maize flowering in response to low phosphate across multi-environments. Euphytica 2019, 215, 128. [Google Scholar] [CrossRef]
- Shariatipour, N.; Heidari, B.; Tahmasebi, A.; Richards, C. Comparative genomic analysis of quantitative trait loci associated with micronutrient contents, grain quality, and agronomic traits in wheat (Triticum aestivum L.). Front. Plant Sci. 2021, 12, 2142. [Google Scholar] [CrossRef]
- Shariatipour, N.; Heidari, B.; Ravi, S.; Stevanato, P. Genomic analysis of ionome-related QTLs in Arabidopsis thaliana. Sci. Rep. 2021, 11, 19194. [Google Scholar] [CrossRef]
- David, R.H.A.; Ramakrishnan, M.; Maharajan, T.; BarathiKannan, K.; Babu, G.A.; Daniel, M.A. Mining QTL and genes for root traits and biochemical parameters under vegetative drought in South Indian genotypes of finger millet [Eleusine coracana [L.] Gaertn] by association mapping and in silico comparative genomics. Biocatal. Agric. Biotechnol. 2021, 32, 101935. [Google Scholar] [CrossRef]
- Kumar, A.; Yadav, S.; Panwar, P.; Gaur, V.S.; Sood, S. Identification of anchored simple sequence repeat markers associated with calcium content in finger millet [Eleusine coracana]. Proc. Natl. Acad. Sci. India Sect. B Biol. Sci. 2015, 85, 311–317. [Google Scholar] [CrossRef]
- Yadav, S.; Kumar, A.; Sood, S. Unraveling the genetics of calcium content in finger millet grains through association mapping. Indian J. Genet. Plant Breed. 2020, 80, 432–440. [Google Scholar] [CrossRef]
- Puranik, S.; Sahu, P.P.; Beynon, S.; Srivastava, R.K.; Sehgal, D.; Ojulong, H. Genome-wide association mapping and comparative genomics identifies genomic regions governing grain nutritional traits in finger millet [Eleusine coracana L. Gaertn.]. Plants People Planet 2020, 2, 649–662. [Google Scholar] [CrossRef]
- Sharma, D.; Tiwari, A.; Sood, S.; Meher, P.K.; Kumar, A. Identification and validation of candidate genes for high calcium content in finger millet [Eleusine coracana [L.] Gaertn.] through genome-wide association study. J. Cereal Sci. 2022, 107, 103517. [Google Scholar] [CrossRef]
- Pendergast, I.V.T.H.; Qi, P.; Odeny, D.A.; Dida, M.M.; Devos, K.M. A high-density linkage map of finger millet provides QTL for blast resistance and other agronomic traits. Plant Genome 2022, 15, e20175. [Google Scholar] [CrossRef]
- Krishna, T.P.A.; Maharajan, T.; Roch, G.V.; Ramakrishnan, M.; Ceasar, S.A.; Ignacimuthu, S. Hybridization and hybrid detection through molecular markers in finger millet [Eleusine coracana [L.] Gaertn.]. J. Crop Improv. 2020, 34, 335–355. [Google Scholar] [CrossRef]
- Li, M.; Guo, X.; Zhang, M.; Wang, X.; Zhang, G.; Tian, Y.; Wang, Z. Mapping QTLs for grain yield and yield components under high and low phosphorus treatments in maize (Zea mays L.). Plant Sci. 2010, 178, 454–462. [Google Scholar] [CrossRef]
- Vengadessan, V.; Rai, K.N.; Kannan Bapu, J.R.; Hash, C.T.; Bhattacharjee, R.; Senthilvel, S.; Nepolean, T. Construction of genetic linkage map and QTL analysis of sink-size traits in pearl millet (Pennisetum glaucum). Int. Sch. Res. Not. 2013, 2013, 471632. [Google Scholar] [CrossRef]
- Zhao, J.; Jamar, D.C.; Lou, P.; Wang, Y.; Wu, J.; Wang, X.; Vreugdenhil, D. Quantitative trait loci analysis of phytate and phosphate concentrations in seeds and leaves of Brassica rapa. Plant Cell Environ. 2008, 31, 887–900. [Google Scholar] [CrossRef]
- Park, K.J.; Sa, K.J.; Koh, H.J.; Lee, J.K. QTL analysis for eating quality-related traits in an F2: 3 population derived from waxy corn× sweet corn cross. Breed. Sci. 2013, 63, 325–332. [Google Scholar] [CrossRef]
- Turki, N.; Shehzad, T.; Harrabi, M.; Okuno, K. Mapping novel QTLs for tolerance to salt stress at the late vegetative stage in durum wheat (Triticum durum L.). J. King Saud. Uni. Sci. 2022, 35, 102506. [Google Scholar] [CrossRef]
- Ceasar, S.A.; Hodge, A.; Baker, A.; Baldwin, S.A.; Öpik, M. Phosphate Concentration and Arbuscular Mycorrhizal Colonisation Influence the Growth, Yield and Expression of Twelve PHT1 Family Phosphate Transporters in Foxtail Millet [Setaria italica]. PLoS ONE 2014, 9, e108459. [Google Scholar] [CrossRef]
- Roch, G.V.; Maharajan, T.; Krishna, T.P.; Ignacimuthu, S.; Ceasar, S.A. Expression of PHT1 family transporter genes contributes for low phosphate stress tolerance in foxtail millet [Setaria italica] genotypes. Planta 2020, 252, 98. [Google Scholar] [CrossRef]
- Ames, B.N. Assay of inorganic phosphate, total phosphate and phosphatases. In Methods in Enzymology; Elsevier: Amsterdam, The Netherlands, 1966; pp. 115–118. [Google Scholar]
- Chiou, T.; Aung, K.; Lin, S.I.; Wu, C.C.; Chiang, S.F.; Su, C. Regulation of phosphate homeostasis by microRNA in Arabidopsis. Plant Cell. 2006, 18, 412–421. [Google Scholar] [CrossRef]
- Krishna, T.P.A.; Maharajan, T.; David, R.H.A.; Ramakrishnan, M.; Ceasar, S.A.; Duraipandiyan, V. Microsatellite markers of finger millet [Eleusine coracana [L.] Gaertn] and foxtail millet [Setaria italica [L.] Beauv] provide resources for cross-genome transferability and genetic diversity analyses in other millets. Biocatal. Agric. Biotechnol. 2018, 16, 493–501. [Google Scholar] [CrossRef]
- Meng, L.; Li, H.; Zhang, L.; Wang, J. QTL IciMapping: Integrated software for genetic linkage map construction and quantitative trait locus mapping in biparental populations. Crop J. 2015, 3, 269–283. [Google Scholar] [CrossRef]
- McCouch, S.R. Gene nomenclature system for rice. Rice 2008, 1, 72–84. [Google Scholar] [CrossRef]
- Zhang, L.; Wang, X.; Wang, K.; Wang, J. GAHP: An integrated software package on genetic analysis with bi-parental immortalized heterozygous populations. Front. Genet. 2022, 13, 1021178. [Google Scholar] [CrossRef]
- Ceasar, S.A. Regulation of low phosphate stress in plants. In Plant Life under Changing Environment; Academic Press: Cambridge, MA, USA, 2020; pp. 123–156. [Google Scholar]
- Malhotra, H.; Sharma, S.; Pandey, R. Phosphorus nutrition: Plant growth in response to deficiency and excess. In Plant Nutrients and Abiotic Stress Tolerance; Springer: Berlin/Heidelberg, Germany, 2018; pp. 171–190. [Google Scholar]
- Niu, Y.F.; Chai, R.S.; Jin, G.L.; Wang, H.; Tang, C.X.; Zhang, Y.S. Responses of root architecture development to low phosphorus availability: A review. Ann. Bot. 2013, 112, 391–408. [Google Scholar] [CrossRef]
- Ceasar, S.A.; Ramakrishnan, M.; Vinod, K.K.; Roch, G.V.; Upadhyaya, H.D.; Baker, A.; Ignacimuthu, S. Phenotypic responses of foxtail millet (Setaria italica) genotypes to phosphate supply under greenhouse and natural field conditions. PLoS ONE 2020, 15, e0233896. [Google Scholar] [CrossRef]
- Aluwihare, Y.C.; Ishan, M.; Chamikara, M.D.M.; Weebadde, C.K.; Sirisena, D.N.; Samarasinghe, W.L.G.; Sooriyapathirana, S.D.S.S. Characterization and selection of phosphorus deficiency tolerant rice genotypes in Sri Lanka. Rice Sci. 2016, 23, 184–195. [Google Scholar] [CrossRef]
- Vejchasarn, P.; Lynch, J.P.; Brown, K.M. Genetic variability in phosphorus responses of rice root phenotypes. Rice 2016, 9, 29. [Google Scholar] [CrossRef] [PubMed]
- Hari-Gowthem, G.; Kaur, S.; Sekhon, B.S.; Sharma, P.; Chhuneja, P. Genetic variation for phosphorus-use efficiency in diverse wheat germplasm. J. Crop Imp. 2019, 33, 536–550. [Google Scholar] [CrossRef]
- Lynch, J.P.; Brown, K.M. Root strategies for phosphorus acquisition. In The Ecophysiology of Plant-Phosphorus Interactions; Springer: Berlin/Heidelberg, Germany, 2008; pp. 83–116. [Google Scholar]
- Lynch, J. Root architecture and plant productivity. Plant Physiol. 1995, 109, 7. [Google Scholar] [CrossRef] [PubMed]
- Lynch, J.P.; Brown, K.M. Topsoil foraging–an architectural adaptation of plants to low phosphorus availability. Plant Soil 2001, 237, 225–237. [Google Scholar] [CrossRef]
- Xu, H.X.; Weng, X.Y.; Yang, Y. Effect of phosphorus deficiency on the photosynthetic characteristics of rice plants. Russ. J. Plant Physiol. 2007, 54, 741–748. [Google Scholar] [CrossRef]
- Hai-Bo, L.I.; Ming, X.I.A.; Ping, W.U. Effect of phosphorus deficiency stress on rice lateral root growth and nutrient absorption. J. Integr. Plant Biol. 2001, 43, 1154–1160. [Google Scholar]
- Rodriguez, D.; Maria, G.E.S.; Pomar, M.C. Phosphorus deficiency affects the early development of wheat plants. J. Agron. Crop Sci. 1994, 173, 69–72. [Google Scholar] [CrossRef]
- Su, J.; Xiao, Y.; Li, M.; Liu, Q.; Li, B.; Tong, Y. Mapping QTLs for phosphorus-deficiency tolerance at wheat seedling stage. Plant Soil 2006, 281, 25–36. [Google Scholar] [CrossRef]
- Sarker, B.C.; Karmoker, J.L.; Rashid, P. Effects of phosphorus deficiency on anatomical structures in maize [Zea mays L.]. Bangladesh J. Bot. 2010, 39, 57–60. [Google Scholar] [CrossRef]
- Plenet, D.; Etchebest, S.; Mollier, A.; Pellerin, S. Growth analysis of maize field crops under phosphorus deficiency. Plant Soil 2000, 223, 119–132. [Google Scholar] [CrossRef]
- Carstensen, A.; Szameitat, A.E.; Frydenvang, J.; Husted, S. Chlorophyll a fluorescence analysis can detect phosphorus deficiency under field conditions and is an effective tool to prevent grain yield reductions in spring barley [Hordeum vulgare L.]. Plant Soil 2019, 434, 79–91. [Google Scholar] [CrossRef]
- Soleimani, B.; Sammler, R.; Backhaus, A.; Beschow, H.; Schumann, E.; Mock, H. Genetic regulation of growth and nutrient content under phosphorus deficiency in the wild barley introgression library S42IL. Plant Breed. 2017, 136, 892–907. [Google Scholar] [CrossRef]
- Gemenet, D.C.; Leiser, W.L.; Beggi, F.; Herrmann, L.H.; Vadez, V.; Rattunde, H.F.W. Overcoming phosphorus deficiency in West African pearl millet and sorghum production systems: Promising options for crop improvement. Front. Plant Sci. 2016, 7, 1389. [Google Scholar] [CrossRef]
- Zhu, J.; Kaeppler, S.M.; Lynch, J.P. Mapping of QTLs for lateral root branching and length in maize [Zea mays L.] under differential phosphorus supply. Theor. Appl. Genet. 2005, 111, 688–695. [Google Scholar] [CrossRef]
- Zhu, J.; Kaeppler, S.M.; Lynch, J.P. Mapping of QTL controlling root hair length in maize [Zea mays L.] under phosphorus deficiency. Plant Soil 2005, 270, 299–310. [Google Scholar] [CrossRef]
- Zhu, J.; Mickelson, S.M.; Kaeppler, S.M.; Lynch, J.P. Detection of quantitative trait loci for seminal root traits in maize [Zea mays L.] seedlings grown under differential phosphorus levels. Theor. Appl. Genet. 2006, 113, 1–10. [Google Scholar] [CrossRef]
- Wu, F.; Yang, X.; Wang, Z.; Deng, M.; Ma, J.; Chen, G.; Liu, Y. Identification of major quantitative trait loci for root diameter in synthetic hexaploid wheat under phosphorus-deficient conditions. J. Appl. Gene 2017, 58, 437–447. [Google Scholar] [CrossRef]
- Li, J.; Xie, Y.; Dai, A.; Liu, L.; Li, Z. Root and shoot traits responses to phosphorus deficiency and QTL analysis at seedling stage using introgression lines of rice. J. Gene Genom. 2009, 36, 173–183. [Google Scholar] [CrossRef]
- Yang, M.; Ding, G.; Shi, L.; Feng, J.; Xu, F.; Meng, J. Quantitative trait loci for root morphology in response to low phosphorus stress in Brassica napus. Theor. Appl. Gene 2010, 121, 181–193. [Google Scholar] [CrossRef]
- Liang, Q.; Cheng, X.; Mei, M.; Yan, X.; Liao, H. QTL analysis of root traits as related to phosphorus efficiency in soybean. Ann. Bot. 2010, 106, 223–234. [Google Scholar] [CrossRef]
- Wang, L.; Liao, H.; Yan, X.; Zhuang, B.; Dong, Y. Genetic variability for root hair traits as related to phosphorus status in soybean. Plant Soil 2004, 261, 77–84. [Google Scholar] [CrossRef]
- Zhang, H.; Wang, H. QTL mapping for traits related to P-deficient tolerance using three related RIL populations in wheat. Euphytica 2015, 203, 505–520. [Google Scholar] [CrossRef]
- Chen, J.; Xu, L.; Cai, Y.; Xu, J. QTL mapping of phosphorus efficiency and relative biologic characteristics in maize [Zea mays L.] at two sites. Plant Soil 2008, 313, 251–266. [Google Scholar] [CrossRef]
- Ming, F.; Zheng, X.; Mi, G.; He, P.; Zhu, L.; Zhang, F. Identification of quantitative trait loci affecting tolerance to low phosphorus in rice [Oryza Sativa L.]. Chin. Sci. Bull. 2000, 45, 520–525. [Google Scholar] [CrossRef]
- Li, Y.D.; Wang, Y.J.; Tong, Y.P.; Gao, J.G.; Zhang, J.S.; Chen, S.Y. QTL mapping of phosphorus deficiency tolerance in soybean [Glycine max L. Merr.]. Euphytica 2005, 142, 137–142. [Google Scholar] [CrossRef]
- Shi, R.; Li, H.; Tong, Y.; Jing, R.; Zhang, F.; Zou, C. Identification of quantitative trait locus of zinc and phosphorus density in wheat [Triticum aestivum L.] grain. Plant Soil 2008, 306, 95–104. [Google Scholar] [CrossRef]
- Ramakrishnan, M.; Ceasar, S.A.; Duraipandiyan, V.; Vinod, K.K.; Kalpana, K.; Al-Dhabi, N.A.; Ignacimuthu, S. Tracing QTLs for leaf blast resistance and agronomic performance of finger millet (Eleusine coracana (L.) Gaertn.) genotypes through association mapping and in silico comparative genomics analyses. PLoS ONE 2016, 11, e0159264. [Google Scholar] [CrossRef]
- Liu, P.; Koizuka, N.; Martin, R.C.; Nonogaki, H. The BME3 [Blue Micropylar End 3] GATA zinc finger transcription factor is a positive regulator of Arabidopsis seed germination. Plant J. 2005, 44, 960–971. [Google Scholar] [CrossRef]
- Chiang, Y.H.; Zubo, Y.O.; Tapken, W.; Kim, H.J.; Lavanway, A.M.; Howard, L. Functional characterization of the GATA transcription factors GNC and CGA1 reveals their key role in chloroplast development, growth, and division in Arabidopsis. Plant Physiol. 2012, 160, 332–348. [Google Scholar] [CrossRef]
- An, Y.; Han, X.; Tang, S.; Xia, X.; Yin, W. Poplar GATA transcription factor PdGNC is capable of regulating chloroplast ultrastructure, photosynthesis, and vegetative growth in Arabidopsis under varying nitrogen levels. Plant Cell Tissue Organ Cult. 2014, 119, 313–327. [Google Scholar] [CrossRef]
- An, Y.; Zhou, Y.; Han, X.; Shen, C.; Wang, S.; Liu, C. The GATA transcription factor GNC plays an important role in photosynthesis and growth in poplar. J. Exp. Bot. 2020, 71, 1969–1984. [Google Scholar] [CrossRef]
- Zhang, H.; Wu, T.; Li, Z.; Huang, K.; Kim, N.E.; Ma, Z. OsGATA16, a GATA transcription factor, confers cold tolerance by repressing OsWRKY45–1 at the seedling stage in rice. Rice 2021, 14, 42. [Google Scholar] [CrossRef]
- Gupta, P.; Nutan, K.K.; Singla-Pareek, S.L.; Pareek, A. Abiotic stresses cause differential regulation of alternative splice forms of GATA transcription factor in rice. Front. Plant Sci. 2017, 8, 1944. [Google Scholar] [CrossRef]
- Feng, X.; Yu, Q.; Zeng, J.; He, X.; Liu, W. Genome-wide identification and characterization of GATA family genes in wheat. BMC Plant Biol. 2022, 22, 372. [Google Scholar] [CrossRef]
- Zeng, D.E.; Hou, P.; Xiao, F.; Liu, Y. Overexpressing a novel RING-H2 finger protein gene, OsRHP1, enhances drought and salt tolerance in rice [Oryza sativa L.]. J. Plant Biol. 2014, 57, 357–365. [Google Scholar] [CrossRef]
- Song, J.; Xing, Y.; Munir, S.; Yu, C.; Song, L.; Li, H. An ATL78-Like RING-H2 finger protein confers abiotic stress tolerance through interacting with RAV2 and CSN5B in tomato. Front. Plant Sci. 2016, 7, 1305. [Google Scholar] [CrossRef]
- Kim, J.H.; Lim, S.D.; Jang, C.S. Oryza sativa drought-, heat-, and salt-induced RING finger protein 1 [OsDHSRP1] negatively regulates abiotic stress-responsive gene expression. Plant Mol. Biol. 2020, 103, 235–252. [Google Scholar] [CrossRef]
- Gao, Y.; Li, H.; Deng, D.; Chen, S.; Jiang, W.; Chen, J. Characterization and expression analysis of the maize RING-H2 finger protein gene ZmXERICO responsive to plant hormones and abiotic stresses. Acta Physiol. Plant. 2012, 34, 1529–1535. [Google Scholar] [CrossRef]
- Agarwal, P.; Khurana, P. Characterization of a novel zinc finger transcription factor [TaZnF] from wheat conferring heat stress tolerance in Arabidopsis. Cell Stress Chaperones 2018, 23, 253–267. [Google Scholar] [CrossRef]
- Han, G.; Qiao, Z.; Li., Y.; Yang., Z.; Wang., C.F.; Zhang, Y. RING Zinc Finger Proteins in Plant Abiotic Stress Tolerance. Front. Plant Sci. 2022, 13, 1055. [Google Scholar] [CrossRef] [PubMed]
- Mao, X.; Zhang, H.; Tian, S.; Chang, X.; Jing, R. TaSnRK2. 4, an SNF1-type serine/threonine protein kinase of wheat [Triticum aestivum L.], confers enhanced multistress tolerance in Arabidopsis. J. Exp. Bot. 2010, 61, 683–696. [Google Scholar] [CrossRef] [PubMed]
- Ceasar, S.A.; Maharajan, T.; Hillary., E.; Krishna., T.P.A. Insights to improve the plant nutrient transport by CRISPR/Cas system. Biotechnol. Adv. 2022, 59, 107963. [Google Scholar] [CrossRef] [PubMed]
- Maharajan, T.; Chellasamy, G.; Krishna, T.P.A.; Ceasar, S.A.; Yun, K. The role of metal transporters in phytoremediation: A closer look at Arabidopsis. Chemosphere 2022, 310, 136881. [Google Scholar] [CrossRef]
- Sathee, L.; Barman, D.; Nagar, S.; Tripathi., S.; Jha., S.K.; Chinnusamy., V. Genome editing targets for improving nutrient use efficiency and nutrient stress adaptation. Front. Genet. 2022, 13, 1427. [Google Scholar] [CrossRef]
- Krishna, T.P.A.; Maharajan, T.; Ceasar, S.A. Application of CRISPR/Cas9 Genome Editing System to Reduce the Pre-and Post-Harvest Yield Losses in Cereals. Open Biotechnol. J. 2022, 16, e187407072205190. [Google Scholar] [CrossRef]
- Ceasar, A. Genome-editing in millets: Current knowledge and future perspectives. Mol. Biol. Rep. 2021, 49, 773–781. [Google Scholar] [CrossRef]

Disclaimer/Publisher’s Note: The statements, opinions and data contained in all publications are solely those of the individual author(s) and contributor(s) and not of MDPI and/or the editor(s). MDPI and/or the editor(s) disclaim responsibility for any injury to people or property resulting from any ideas, methods, instructions or products referred to in the content. |
© 2023 by the authors. Licensee MDPI, Basel, Switzerland. This article is an open access article distributed under the terms and conditions of the Creative Commons Attribution (CC BY) license (https://creativecommons.org/licenses/by/4.0/).