Abstract
This study aimed to improve the measurement accuracy of the discrete element method (DEM) simulation parameters of sorghum seeds for enhanced model accuracy. We measured the intrinsic and contact parameters of sorghum seeds, extracted the outline of the seeds by 3D scanning, and used the multi-spherical particle model filling method in the EDEM (Version 2020) software to obtain the simulation model of the seeds. By simulating the free-fall, slope slip, slope rolling, and rolling experiments of sorghum seeds–photosensitive resin material, we calibrated the collision restitution coefficient of the sorghum seeds–photosensitive resin material to 0.690, static friction coefficient to 0.345, and rolling friction coefficient to 0.040. Through the steepest ascent search and central composite design experiments, we calibrated the collision restitution coefficient of sorghum seeds–sorghum seeds to 0.400, the static friction coefficient to 0.450, and the rolling friction coefficient to 0.043. The angle of repose of the parameter combination and the angle of repose of the physical experiment (33.82°) were verified, and the relative errors of the coefficients were 0.7%, 0.25%, and 0.3%, respectively, indicating that the established model had a high simulation accuracy and reliability. These results show that the established sorghum seeds model and the optimally calibrated parameter combination are effective for DEM studies on sorghum seeds.
1. Introduction
As the world’s fifth largest food crop [], sorghum is characterized by drought, waterlogging, and salinity resistance as well as a high yield. Sorghum is the primary cash crop in arid and semi-arid regions, and its cultivation is significant for ensuring national food security in those regions [,]. Hence, it is crucial to mechanize the planting process of sorghum to improve its yield value and economic benefits []. Currently, the discrete element method (DEM) is widely used in the field of agriculture equipment field [,]. Using the DEM to investigate the interaction mechanism between seeds and perform corresponding digital simulation can effectively provide a reliable method for the study on the motion characteristics of seed particles and the mechanized seeding [,].
Defining the parameters of the seeds model in the EDEM (Version 2020) software is necessary for improving the accuracy of DEM simulations. The software mainly uses intrinsic parameters comprising the triaxial size, density, Poisson’s ratio, and shear modulus of the sample; it also uses contact parameters comprising collision restitution, static friction, and rolling friction coefficients [,,]. Numerous agricultural materials studies using the DEM have proposed discrete element models for wheat, corn, soybeans, rice, potatoes, and other materials while providing calibrations for relevant simulation parameters of these materials. Kruggel-Emden et al. [] proposed a multi-spherical particle aggregate method that replicates the DEM to study agricultural materials with smooth surfaces. Zhang et al. [] scanned rice seeds in 3D using the reverse engineering method, establishing 3D contour and discrete element models of rice using the bonding model method in the EDEM software. Coetzee et al. [] conducted mechanical experiments to determine the coefficients of friction and stiffness of corn particles; they used the angle of repose to calibrate the discrete element simulation parameters. Zhang et al. [] obtained the intrinsic parameters and accumulation angle of soil particles through the shear and bulk density experiments. They fine-tuned the parameter values to determine the parameters to be calibrated. Geldart et al. [] and Wen et al. [] analyzed the influence of different measurement methods on the angle of repose and obtained significant factors affecting the angle of repose and the degree of significance of related factors. However, only few reports exist on the discrete element simulation parameters calibration of sorghum seeds. Sorghum is morphologically different from soybean, corn, and wheat; hence, more related experiments are required for exploring its complex motion characteristics.
Therefore, we established a discrete element model of sorghum seeds based on previous research through 3D scanning and the reverse engineering method, and we used this model to calibrate the sorghum seeds–sorghum seeds and sorghum seeds–photosensitive resin material relationships. To obtain the best sorghum seeds simulation parameters, we verified the calibrated parameters by comparing the angle of repose of the simulated and physical experiments and by using the two-sample t-test. In addition, it is expected to provide a basis for the DEM parameters and modeling in the mechanized seeding process of sorghum seeds.
2. Materials and Methods
2.1. Materials
The research object was the Hongmaoguan-6 sorghum (Hebei Zhigranary Agricultural Development Co., Ltd., Hebei, China). The moisture content of the initial samples was 11.09%, which was measured by a DZX-6020B oven (Shanghai Nanrong Laboratory Equipment Co., Ltd., Shanghai, China). The 1000-kernel weight of the sorghum was 19.63 g, which was measured by an electronic balance with a 0.01 g mass accuracy (Xiamen Jince Electronic Technology Co., Ltd., Xiamen, China). The true density of the sorghum was 1.15 g/cm3, which was determined using the liquid displacement method [].
2.2. Intrinsic Parameters
2.2.1. Size Distribution of Sorghum
We randomly selected 250 sorghum seeds and used an electronic vernier caliper (Mitutoyo Co., Ltd., Kanagawa, Japan) with a 0.01 mm accuracy to measure the length (L), breadth (B), and thickness (T) of each seed. Each seed was measured three times to obtain the average value, as illustrated in Figure 1. Figure 2 shows the size normal distribution fitting curve obtained. Using the data, we determined the equivalent diameter and sphericity from Equations (1) and (2), and Table 1 presents the results.
where D is the equivalent diameter of the seed (mm); Sp is the sphericity of the seed (%); L, B, and T are the length, breadth, and thickness of the sorghum seed (mm), respectively.
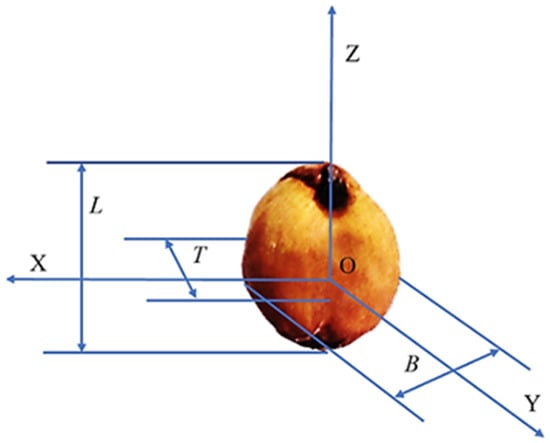
Figure 1.
Size distribution. The vertical direction is the Z-axis, the hilum direction is the Y-axis, and the horizontal direction is the X-axis. O is the center of sorghum seed; L, B, and T are the length, breadth, and thickness of the sorghum seed (mm), respectively.
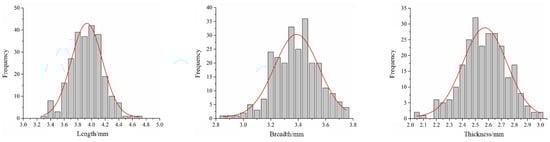
Figure 2.
Triaxial size normal distribution fitting curve.

Table 1.
Design of the single-factor experiment for collision recovery coefficient. (X1 is the collision restitution coefficient of seeds–photosensitive resin material, and Y1 is the highest rebound height of the seed collision in each simulation group.)
The calculation results show that the triaxial size L, B, T were 3.93, 3.38, 2.57 mm, respectively; the equivalent diameter was 3.25 mm; and the sphericity was 82.66%.
2.2.2. Poisson’s Ratio, Shear Modulus, and Elastic Modulus of Sorghum Seeds
In the compression experiment, we used the TA.XTC-18 texture analyzer (Bosin Co., Ltd., Shanghai, China) shown in Figure 3. The sorghum seeds were placed vertically at the center of the texture analyzer’s test bench. The loading speed was set to 0.1 mm/s, and a cylindrical probe with a 3 cm diameter was used to load the sorghum seeds onto the Z-axis direction until the seeds reached the state of maximum critical deformation. We used a post-processing software to obtain the maximum loading force (F) and deformation degree of length (L) and breadth (B) of each sorghum seed after the compression experiment.
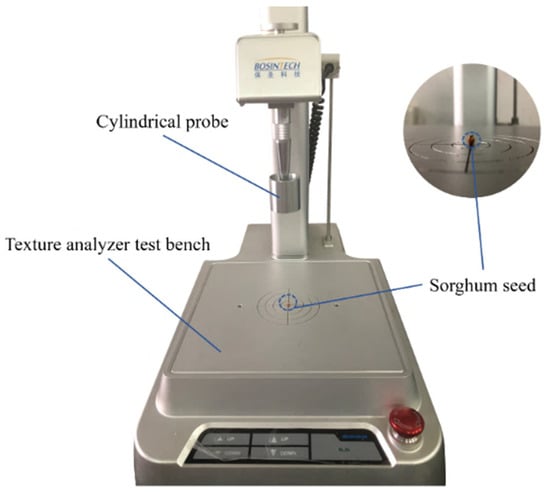
Figure 3.
Compression experiment diagram.
The Poisson’s ratio can be calculated as 0.12 by Equation (3):
where ν is the Poisson’s ratio of the seeds, B1 is the original breadth of the seeds (mm), L1 is the original length of the seeds (mm), B2 is the breadth of the seeds after deformation (mm), L2 is the length of the seeds after deformation (mm), ΔB is the breadth variable of the seeds (mm), and ΔL is the length variable of the seeds (mm).
The elastic modulus can be calculated as 2.307 × 10⁷ Pa by Equation (4):
where E is the elastic modulus of the seed (Pa), F is the maximum loading force (N), and S is the cross-sectional area of the sorghum seeds (approximate ellipse area) (mm2).
The shear modulus was calculated as 1.03 × 10⁷ Pa by Equation (5):
where G is the seeds shear modulus (Pa).
2.3. Contact Parameters
The contact parameters required for the DEM simulation were sorghum seeds–sorghum seeds, sorghum seeds–photosensitive resin material collision restitution coefficient, static friction coefficient, and rolling friction coefficient.
2.3.1. Collision Restitution Coefficient
The coefficient of restitution is the ratio of the velocity of an object after collision to that before collision, and it is only related to the colliding object material [].
The free-fall experiment is illustrated in Figure 4. The photosensitive resin plate and sorghum seeds were arranged neatly and bonded to the seeds plate as the collision contact bottom plate. The seeds fell freely from the seed drop port (a height of 150 mm) and bounced up after colliding with the bottom plate. We used the I-SPEED TR high-speed camera (Olympus Co., Ltd., Tokyo, Japan) to capture the movement of the seeds and analyzed the motion of the physical experiment using the I-SPEED viewer software.
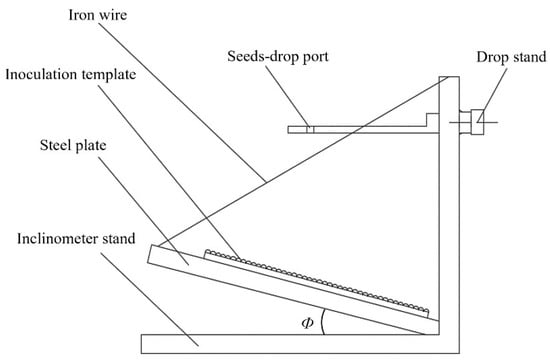
Figure 4.
Schematic of the test principle of the free-fall experiment. Φ is the inclination angle of the inclined plane (36° in the free-fall experiment of sorghum seeds–sorghum seeds, 0° in the free-fall experiment of sorghum seeds–photosensitive resin material). In free-fall experiment of sorghum seeds–sorghum seeds, the inoculation template is seeds plate; in the free-fall experiment of sorghum seeds–photosensitive resin material, the inoculation template is photosensitive resin plate.
The sorghum seeds–sorghum seeds collision motion analysis is illustrated in Figure 5.
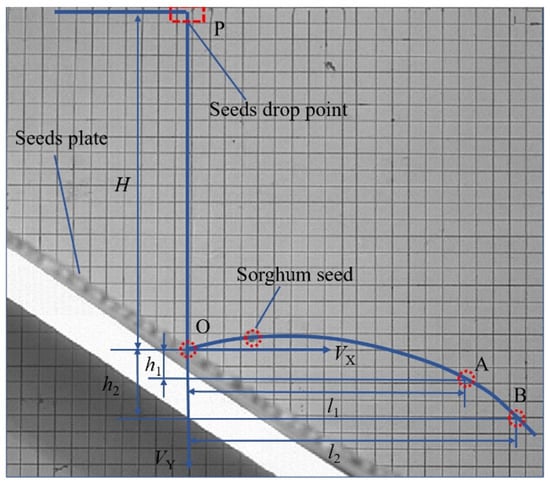
Figure 5.
Analysis of collision motion between sorghum seeds. A and B are any two points on the seed trajectory; VX and VY are the horizontal and vertical sub-velocities (mm/s), respectively, after seeds collision; H is the is the drop height of seed (150 mm); h1 and h2 are the vertical displacements (mm); and l1 and l2 are the horizontal displacements (mm).
We randomly selected two points on the trajectory of the sorghum seed after collision and measured the horizontal (l1 and l2) and vertical (h1 and h2) displacements of the two points. According to the principle of kinematic equations [], we calculated the component velocities in the horizontal and vertical directions of the sorghum seed before and after collision. Then, the collision restitution coefficient range of sorghum seeds was calculated to be 0.4–0.7 by Equation (6).
where Cr1 is the collision restitution coefficient of sorghum seeds–sorghum seeds, V0 is the instantaneous velocity before collision (m/s), Vn is the normal velocity after collision (mm/s), and Vm is the normal velocity before collision (mm/s).
Figure 6 illustrates the sorghum seeds–photosensitive resin material collision motion analysis. According to the actual collision motion, the collision restitution coefficient equation [] can be simplified, as shown in Equation (7). The calculated value of the collision restitution coefficient was 0.4–0.8, and the measured value of the average maximum rebound height (h) was 42.66 mm:
where Cr2 is the collision restitution coefficient of sorghum seeds–photosensitive resin material, g is acceleration due to gravity (m/s2), and h is the rebound height of the seed (mm).
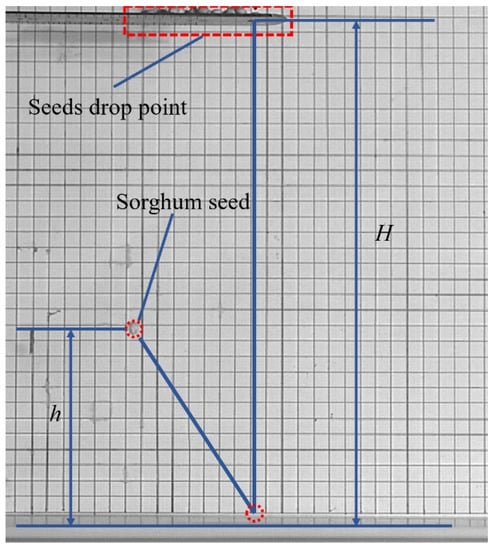
Figure 6.
Analysis of collision motion of seeds–photosensitive resin plate. H is the drop height of seed (150 mm); h is the rebound height of the seed.
2.3.2. Static Friction Coefficient
The static friction coefficient is the ratio of the maximum static friction force to the positive pressure between the contact surfaces. Its direction is opposite the direction of the movement trend of the two objects. When the inclination angle of a certain slope increases gradually until the surface object has a sliding tendency, the slope angle of the object is the static friction angle, as shown in Equation (8).
where f is the static friction coefficient; φ is the slope angle (deg).
In this study, the slope slip experiment was used to measure the sorghum seeds–sorghum seeds and sorghum seeds–photosensitive resin material static friction coefficients. The slope slip experiment is illustrated in Figure 7.
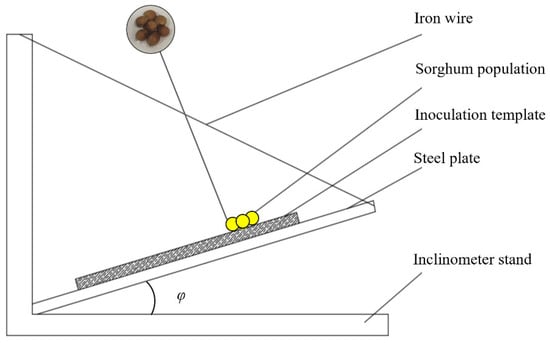
Figure 7.
Schematic diagram of the test principle of the slope slip experiment. In static friction coefficient of sorghum seeds–sorghum seeds, the inoculation template is seeds plate; in the static friction coefficient of sorghum seeds–photosensitive resin material, the inoculation template is photosensitive resin plate.
During the slope slip experiment of sorghum seeds–sorghum seeds, we stuck the sorghum seeds plate on the experiment plane of the inclinometer, placed seven sorghum-adhered populations on the seeds plate, and continually turned the inclinometer test plane counterclockwise. When the sorghum population was on the seeds plate and with a sliding trend, we stopped the rotation and recorded the inclination angle of the slope and calculated the static friction coefficient between the sorghum seeds. During the slope slip experiment of the sorghum seeds–photosensitive resin material, we replaced the seeds plate with the photosensitive resin plate and fixed it on the test plane of the inclinometer. According to the slope slip experiment method for the sorghum seeds–sorghum seeds, we obtained the static friction coefficient of sorghum seeds–photosensitive resin material.
The average value of the static friction coefficient for the sorghum seeds–sorghum seeds was 0.45–0.6, the seeds–photosensitive resin material was 0.32–0.38, and the average value of the physical experiment inclination angle was 19.39°.
2.3.3. Rolling Friction Coefficient
The rolling friction coefficient reflects the comprehensive influence of the contact object on the magnitude of the rolling frictional resistance moment. It is related to the shape, size, and surface properties of the contact surface. In this study, the slope rolling and rolling experiments were used to measure the rolling friction coefficient of sorghum seeds–sorghum seeds and sorghum seeds–photosensitive resin material.
During the slope rolling experiment of sorghum seeds–sorghum seeds, we stuck the sorghum seeds plate on the test plane of the inclinometer, placed single sorghum seeds on the seeds plate, and continually turned the inclinometer test plane counterclockwise. When the sorghum seeds were on the seeds plate and with a rolling trend, we stopped the rotation and recorded the inclination angle of the slope and calculated the rolling friction coefficient between the sorghum seeds. The average value of the rolling friction coefficient for the seeds–seeds experiment ranged from 0 to 0.1.
The rolling friction coefficient of the seeds–photosensitive resin material was measured using the rolling experiment. During the experiment, sorghum seeds were placed on an inclined surface with a height of 30 mm and rolled along the inclined surface to a horizontal surface at zero initial speed. While the seeds were on the horizontal surface and completely still, we measured the horizontal rolling distance (l) of the seeds. Figure 8 illustrates the rolling experiment analysis diagram.
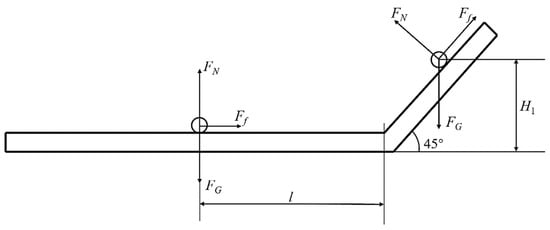
Figure 8.
Analysis diagram of rolling experiment. H1 is the seeds drop height (30 mm), l is the displacement of the seed after rolling (mm), FN is the support force of the photosensitive resin plate on the seed (N), FG is the gravity of the seeds itself, and Ff is the rolling friction force (N).
We ignored the effect of air resistance on the seeds and converted the work (W1) carried out by gravity during the overall movement of the seeds to the rolling friction work (W2):
During motion, W1 = W2 after simplifying the equation. The rolling friction coefficient equation is expressed as Equation (11):
The value range of the rolling friction coefficient of the seeds–photosensitive resin material was 0.02–0.1, and the measured value of the average displacement l after rolling was 106.93 mm.
In Equations (9)–(11) f is the rolling friction coefficient of seeds–photosensitive resin material (mm); m is the mass of the object (g); W1 is the work carried out by gravity (J); W2 is the rolling friction work (J); g is the self-gravity of the seeds (m/s2).
2.4. Angle of Repose Experiment
The cylinder lifting method was used to measure the angle of repose of the sorghum. We poured 2250 sorghum seeds from the top of a cylinder. After stabilization, the cylinder was lifted up at a speed of 0.2 mm/s. The sorghum seeds naturally fell because of gravity and accumulated into an angle, as shown in Figure 9a. Once the seeds settled on the photosensitive resin plate, the front view of the stacked seeds was photographed. To obtain the boundary fitting line, we used Matlab (Version 2018) to perform grayscale processing, binarization processing, image boundary extraction, least square fitting, and other processes on the image. Figure 9b shows the obtained boundary fitting straight line. The average angle of repose from the physical experiment of the sorghum seeds was obtained at 33.82°.
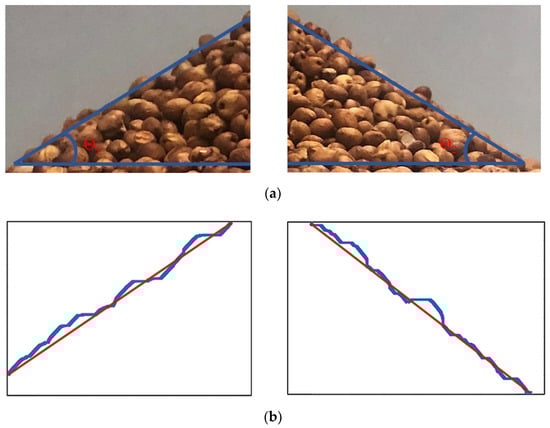
Figure 9.
Angle of repose of sorghum seeds. (a) Image of both sides of stacked seeds; (b) angle of repose least squares fitting diagram.
2.5. Establishment of EDEM Software Model of Sorghum Seeds
In this study, an accurate 3D contour model of sorghum seeds was established through 3D optical scanning and the reverse engineering method. We used the JTsan-MS-50 3D scanner (Jeatech Co., Ltd., Guangzhou, China) with a 0.01 mm accuracy (see Figure 10) to obtain the sorghum seeds point cloud data map by scanning the outline of the sorghum seed (see Figure 11a), while using the Geomagic Wrap (Version 2017) software to convert the point cloud data. The graph was converted into polygons, and the polygon model was optimized by operations such as deleting nails and smoothing. The 3D model of the sorghum seeds contour was obtained by merging meshes, dividing surface slices, constructing grids, fitting surfaces, and merging surfaces (see Figure 11b).
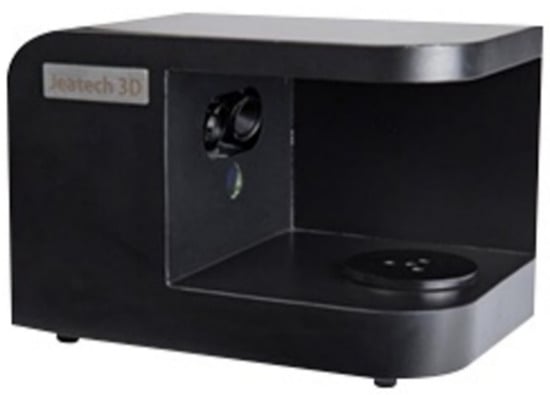
Figure 10.
3D scanner.
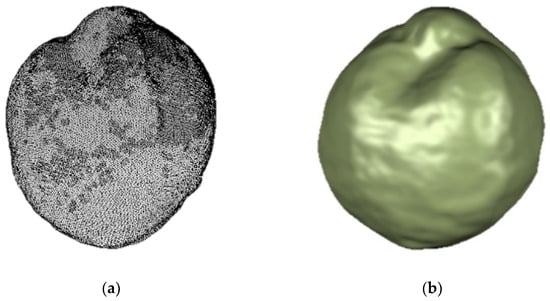
Figure 11.
3D scanning of sorghum seeds. (a) Point cloud data map. (b) 3D model diagram.
Since sorghum seeds have irregular shapes and the collision, tumbling, and occlusion between irregular seeds are more complex to determine, if single spherical particles were used for the discrete element simulation, the inaccuracy of the simulation results would be very high, regardless of the more realistic simulation. In order to simulate the characteristics between seeds realistically, the discrete element model of seeds can be established by the multi-sphere method (MSM) that is carried out by automatically overlapping some spherical particles of different diameters. By adopting this method, the DEM is more consistent with the actual outer contour of the seeds, and since the overall model is formed by overlapping spherical particles, it is judged as an independent body in the EDEM (Version 2020) software [,]. In addition, the MSM only needs a few spherical particles to build the sorghum seed model. Considering the amount of calculation and the length of simulation time in the actual simulation, the use of MSM can improve the simulation efficiency to a certain extent. Therefore, the MSM was employed in the discrete element EDEM (Version 2020) software for the establishment of discrete element model of sorghum seeds.
When establishing the seeds discrete element model, we imported the 3D model of the sorghum seeds into the EDEM (Version 2020) software and set it as the hard template boundary. The number of the grid cells in the x, y, and z directions was 30; the minimum diameter of the filled spherical particles was set to 0.5 mm; and the surface smoothness was set to 6. We completely established the seeds model by filling the particle template automatically. As shown in Figure 12, the seeds model comprised 13 overlapping and stacked, spherical particles of varying diameter, which were regarded as independent elements in the EDEM (Version 2020) software. The outline of the model is consistent with that of the actual seeds. Considering the mechanical properties of sorghum seeds and the calculation accuracy of the model, the Hertz-Mindlin (no slip) contact model built into the EDEM (Version 2020) software was used in the current study [].

Figure 12.
Sorghum seed model of EDEM.
2.6. Calibration of Seeds–Photosensitive Contact Parameters
2.6.1. Single-Factor Experiment of Collision Recovery Coefficient of Seeds–Photosensitive Resin Material
The simulation was performed by the same free-fall experiment used for the physical test, as illustrated in Figure 13.
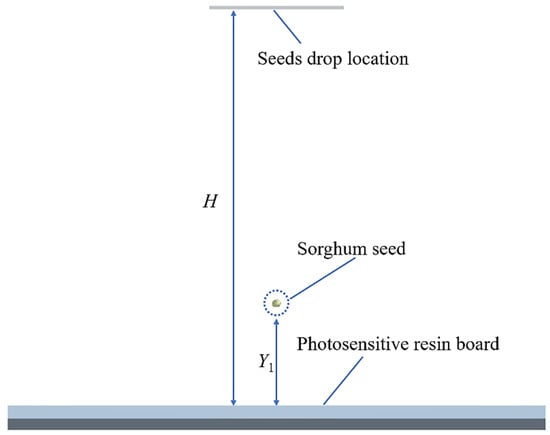
Figure 13.
Simulation diagram of collision restitution coefficient of seeds–photosensitive resin material. H is the seeds drop position (150 mm), and Y1 is the rebound height of the seeds in the simulation (mm).
The rolling and static friction coefficients of the seeds–photosensitive resin material and the contact parameters for the sorghum seeds–sorghum seeds had no effect on the results of this EDEM simulation; hence, the above coefficients were zero in this simulation. The collision restitution coefficient of seeds–photosensitive resin material adopted the numerical range of physical measurement, which ranged from 0.40 to 0.80. Table 1 presents the experimental design scheme of the single-factor experiment for the collision recovery coefficient of seeds–photosensitive resin material.
2.6.2. Single-Factor Experiment for Static Friction Coefficient of Seeds–Photosensitive Resin Material
The simulation was performed by the same slope rolling experiment used for the physical experiment, as illustrated in Figure 14.
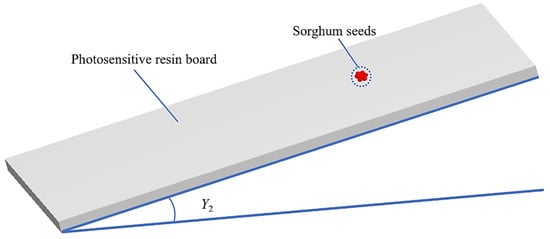
Figure 14.
Simulation experiment diagram of static friction coefficient of seeds–photosensitive resin material. Y2 is the inclination angle of the inclined plate (deg).
The rolling friction coefficient of the seeds–photosensitive resin material and the contact parameters for sorghum seeds–sorghum seeds had no effect on the results of this EDEM simulation. Hence, the above coefficients were zero in this simulation. Using the calibrated parameters, we obtained 0.690 as the collision recovery coefficient of sorghum seeds–photosensitive resin material. The static friction coefficient of seeds–photosensitive resin material adopted the numerical range of physical measurement, which ranged from 0.32 to 0.38. Table 2 presents the experimental design scheme of the single-factor experiment for the static friction coefficient of seeds–photosensitive resin material.
Table 2.
Design of the single-factor experiment for static friction coefficient. (X2 is the static friction coefficient, and Y2 is the simulation value of the inclined plate inclination angle (deg).)
2.6.3. Single-Factor Experiment for Rolling Friction Coefficient of Seeds–Photosensitive Resin Material
The simulation was performed by the same rolling experiment used for the physical experiment, as illustrated in Figure 15.
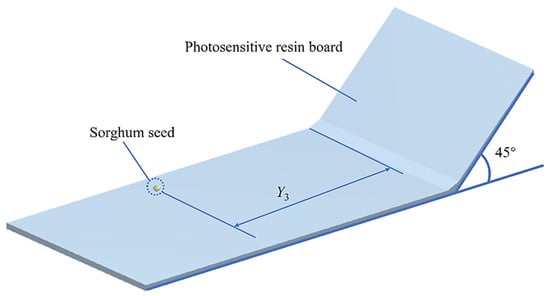
Figure 15.
Simulation measurement diagram of rolling friction coefficient of seeds–photosensitive resin material. Y3 is the horizontal scrolling distance of the seeds model (deg).
The contact parameters for the sorghum seeds–sorghum seeds had no effect on the results of this EDEM simulation. Hence, the above coefficients were zero in this simulation. We used the calibrated parameters and obtained the collision recovery coefficient of sorghum seeds–photosensitive resin material to be 0.690 and the static friction coefficient of sorghum seeds–photosensitive resin material to be 0.345. The rolling friction coefficient of seeds–photosensitive resin material adopted the numerical range of physical measurement, which ranged from 0.02 to 0.10. Table 3 presents the experimental design scheme of the single-factor experiment for the rolling friction coefficient of seeds–photosensitive resin material.
Table 3.
Design of the single-factor experiment for rolling friction coefficient. (X3 is the rolling friction coefficient of sorghum seeds–photosensitive resin material, and Y3 is the rolling distance (mm).)
2.7. Calibration of Sorghum Seeds–Sorghum Seeds Contact Parameters
2.7.1. The Simulation Model of the Simulation Angle of Repose
For determining the angle of repose model of the sorghum seeds for the simulation experiment, we adopted the same method used for the physical experiment (see Figure 16a). We sized the seeds model for discrete-unit simulations according to the normally distributed values of sorghum seeds across the breadth. The model had a standard normal distribution with a standard deviation of 0.05. Owing to the minimum and maximum seeds sizes measured in the physical experiment, we limited the seeds size to a multiple of 0.85–1.11. A particle factory was established 250 mm above the cylinder; we adopted a dynamic method for the particle model. We generated a total of 2250 particles, and the cylinder lifting speed was 0.2 mm/s; the grid size was three times the minimum particle radius, and the total simulation time was 25 s with a time step of 15%, as shown in Figure 16b.
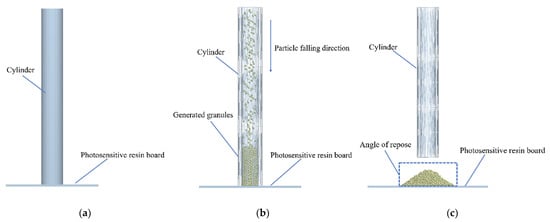
Figure 16.
EDEM simulation of angle of repose experiment. (a) Model establishment; (b) simulation of seeds drop; (c) simulation model of angle of repose.
At the beginning of the simulation, the seeds were generated on the plane of the particle factory and fell freely under the action of gravity. After 1 s, all the seeds had fallen into the cylinder. After 25 s, the seeds model was stacked on the bottom plate to form the angle of repose of sorghum seeds for the simulation, as shown in Figure 16c.
2.7.2. Steepest Ascent Search Experiment
Contact parameters of sorghum seeds–sorghum seeds were selected as significant factors for the steepest ascent search experiment. The relative error of the angle of repose of the simulation and physical experiment were used as indices of the steepest ascent search experiment; the relative error of the accumulation angle is calculated by Equation (12):
where Ɛ is the error between simulation angle of repose and physical angle of repose of sorghum seeds–seeds, θ is the physical experiment value of the accumulation angle of repose of sorghum seeds–sorghum seeds (deg), and γ is the accumulation angle of repose simulation experiment value of sorghum seeds–sorghum seeds (deg).
The steepest ascent search experiment was used to determine the factors of the high- and low-level intervals of the central composite design experiment. Table 4 presents the scheme and results of the steepest ascent search experiment.
Table 4.
Test scheme and results of steepest ascent search experiment. (X4 is the collision restitution coefficient of sorghum seeds–sorghum seeds, X5 is the static friction coefficient of sorghum seeds–sorghum seeds, and X6 is the rolling friction coefficient of sorghum seeds–sorghum seeds.)
Table 5 shows that the relative error of the angle of repose of the sorghum seeds steepest ascent search experiment reduced and then increased. The relative error of the No. 2 test groups was the smallest, indicating that the optimal value interval is near the No. 2 test groups. Therefore, we selected No. 1, No. 2, and No. 3 groups of experiment factors as the −1, 0, and 1 level factors, respectively, of the central composite design.
Table 5.
Central composite design factor coding.
2.7.3. Central Composite Design Experiment
To determine the best parameters combination for the contact parameters of sorghum seeds–sorghum seeds in the simulation experiment, we performed a central composite design using the results of the steepest accent design. Table 5 presents the simulation experiment factor codes, which are the coded values of the collision restitution, static friction, and rolling friction coefficients between sorghum seeds. Table 6 presents the design scheme and results of the simulation experiment; these results were the relative errors of the simulated and measured accumulation angles.
Table 6.
Test results and scheme of central composite design experiment.
3. Results and Discussion
3.1. Determination of Contact Parameters of Sorghum Seeds–Photosensitive Resin Material
3.1.1. Collision Restitution Coefficient
To determine the relationship between the collision restitution coefficient and maximum rebound height of the sorghum seeds–photosensitive resin material in the simulation experiment, we fitted the experiment data presented in Table 1 using Minitab (Version 18). Figure 17 shows the quadratic polynomial fitting curve whose equation is expressed as Equation (13):
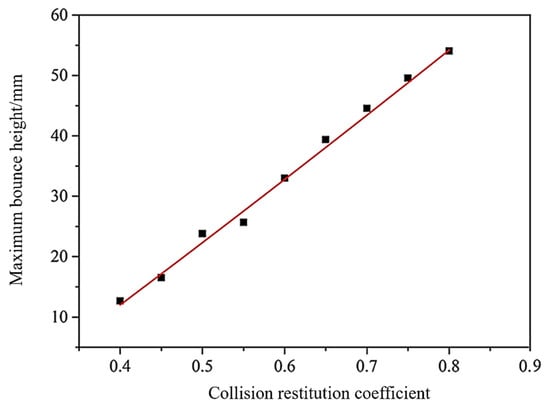
Figure 17.
Second-order polynomial fitting curve of the collision restitution coefficient of sorghum seeds–photosensitive resin material.
The coefficient of determination (R2) of the quadratic polynomial fitting curve was 0.996. We substituted the average maximum rebound height of the physical experiment (42.66 mm) into the quadratic polynomial fitting curve to obtain X1 = 0.69, which was input into the EDEM (Version 2020) software for verification and simulation. The simulated value of the maximum bouncing height was 44.7 mm, and the relative error of the physical measured value was 4.78%, showing that the simulation results after calibration were consistent with those of the physical experiment. Finally, we determined the collision restitution coefficient of the seeds–photosensitive resin material to be 0.690 in EDEM simulation.
3.1.2. Static Friction Coefficient
To determine the relationship between the static friction coefficient of the sorghum seeds–photosensitive resin material and the inclination angle of the simulation experiment, we fitted the experimental data in Table 2 using Minitab (Version 18). Figure 18 shows the quadratic polynomial fitting curve, and the equation of the curve is expressed as Equation (14):
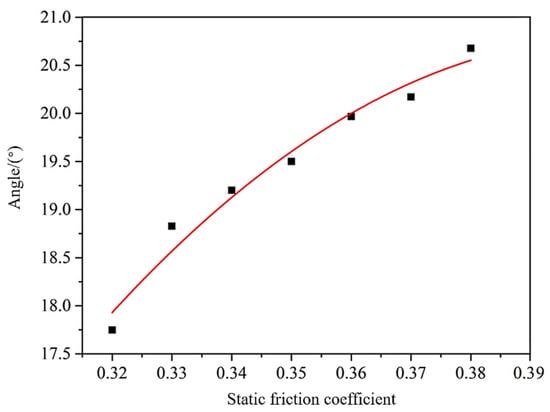
Figure 18.
Second-order polynomial fitting curve of the static friction coefficient of sorghum seeds–photosensitive resin material.
The coefficient of determination (R2) of the quadratic polynomial fitting curve was 0.986. The average value of the physical experiment inclination angle (19.39°) was substituted into the quadratic polynomial fitting curve to obtain X2 = 0.345, which was input into the EDEM (Version 2020) software for verification and simulation. The simulated value of the experimental inclination angle was 19.104°, and the relative error of the physical measured value was 1.46%, showing that the simulation results after calibration were consistent with those of the physical experiment. Finally, we determined the collision recovery coefficient of the seeds–photosensitive resin material to be 0.345 in the EDEM simulation.
3.1.3. Rolling Friction Coefficient
To determine the relationship between the rolling friction coefficient of the sorghum seeds–photosensitive resin material and the rolling distance of the simulation experiment, we fitted the experiment data presented in Table 3 using Minitab (Version 18). Figure 19 shows the quadratic polynomial fitting curve, and the equation of the curve is expressed as Equation (15):
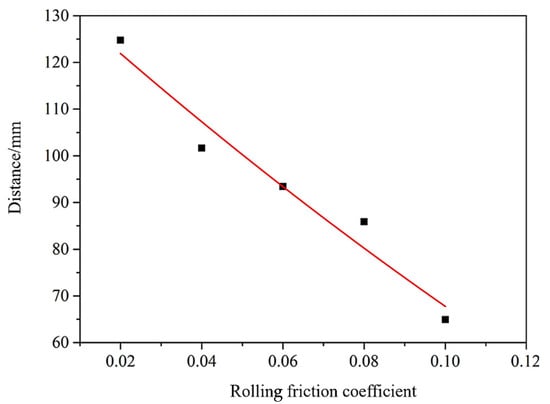
Figure 19.
Second-order polynomial fitting curve of the rolling friction coefficient of sorghum seeds–photosensitive resin material.
The coefficient of determination (R2) of the quadratic polynomial fitting curve was 0.958. The average value of the physical experiment rolling distance (106.93 mm) was substituted into the quadratic polynomial fitting curve to obtain X3 = 0.040, which was input into the EDEM (Version 2020) software for verification and simulation. The simulated value of the experimental rolling distance was 102.75 mm, and the relative error of the physical measured value was 3.9%, showing that the simulation results after calibration were consistent with those of the physical experiment. Finally, we determined the rolling friction coefficient of the seeds–photosensitive resin material to be 0.04 in the EDEM simulation.
3.2. Determination of Contact Parameters of Sorghum Seeds–Sorghum Seeds
Using Design-Expert (Version 10.0.3) to perform multiple regression fitting on the data presented in Table 6, we obtained the regression equation of the relative error of the angle of repose after insignificant factors were removed:
Y = 0.6141X42 + 0.8180X52 + 1.29X62 + 0.6192X4X5 + 1.95X5X6 + 0.3744X4 + 0.3612X5 + 0.6169X6 + 0.8144.
Table 7 presents the variance analysis of the regression equation; the overall fitting degree of the model was highly significant (p < 0.01). The interaction term between the collision restitution coefficient and the rolling friction coefficient of sorghum seeds was significant (p > 0.1), indicating that the influence of the experimental factor on the overall response value was high. The lack of fit item p was 0.0997 (not significant), indicating that no other main factor affected the index. The coefficient of determination (R2) of the quadratic regression equation was 0.955, and the three experimental factors influenced the error in descending order: X6 (rolling friction coefficient), X4 (collision restitution coefficient), and X5 (static friction coefficient). The effect of X6 (rolling friction coefficient) on the angle of repose was more significant than that of the other two factors.
Table 7.
Analysis of variance for regression equation.
To make the accumulation angle of the simulation experiment close to that of the physical experiment, we used the optimal target value of the angle of repose (33.82°) and the minimum value of the relative error of the angle of repose as double optimization objectives in the optimization module of Design-Expert (Version 10.0.3). The regression equation (Equation (16)) was solved, the response surface was analyzed, and the regression model was optimized.
The constraint equations were as follows:
Finally, we obtained the sorghum seeds–sorghum seeds collision restitution, static friction, and rolling friction coefficients to be 0.400, 0.450, and 0.043, respectively.
For different granular materials, the effects of physical parameters on the angle of repose are not completely consistent. In this paper, it was found that the static friction coefficient and rolling friction coefficient of sorghum seeds–sorghum seeds had an obvious effect on the angle of repose, which was in line with the research results of Liu et al. []. In addition, the collision restitution coefficient had a significant effect on the angle of repose, which was in accordance with the research results of Hou et al. [] and Ma et al. []. However, Shi et al. [] considered that the Poisson’s ratio of jujube had a huge effect on the angle of repose, probably due to factors such as the different shape, material, size and moisture content of the granular materials.
3.3. Validation Tests
Table 8 presents all simulation parameters required for the verification experiment.
Table 8.
Overall discrete element simulation parameters.
To verify the reliability and authenticity of the discrete element simulation parameters after the calibration of the sorghum seeds, we performed three simulation experiments for the parameters determined in Table 8. The simulated repose angles of the sorghum seeds were 33.58°, 33.91°, and 33.72°. The relative errors of the simulated angle of repose and the average real physical angle of repose (33.82°) were 0.7%, 0.25%, and 0.3%, indicating that no significant difference existed between both angles of repose. The angle of repose of the sample and the physical experiment were tested by a two-sample t-test (p = 0.216). The test further verified the reliability and authenticity of the simulation experiment and showed that the calibrated discrete element simulation model is applicable to the discrete element simulation of relevant sorghum seeds. Figure 20 shows the experiment comparison.
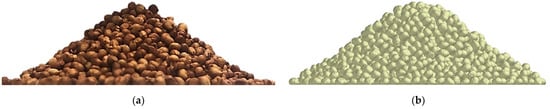
Figure 20.
Comparison of sorghum seeds angle of repose experiments. (a) Physical experiment; (b) simulation experiment.
4. Conclusions
- (1)
- Experiments were conducted to determine intrinsic parameters such as triaxial size, 1000-grain weight, density, moisture content, elastic modulus, shear modulus, and Poisson’s ratio of sorghum seeds. By free-fall, slope slip, slope rolling, and rolling experiments, we found the values of the collision restitution, static friction, and rolling friction coefficients of sorghum seeds–sorghum seeds to be 0.4–0.7, 0.45–0.6, and 0–0.1, respectively; the values of the collision restitution, static friction, and rolling friction coefficients of sorghum seeds–photosensitive resin material were found to be 0.4–0.8, 0.32–0.38, and 0.02–0.1, respectively.
- (2)
- We scanned the outline of the sorghum seed using a 3D scanner to obtain a point cloud data map of the seed. The point cloud data were processed in a software to obtain the 3D model of the sorghum seeds outline, which was used in EDEM. A discrete element simulation particle model of sorghum seeds was established by using the multi-sphere particle aggregation method.
- (3)
- By simulating the free-fall, slope slip, slope rolling, and rolling experiments, we calibrated the collision restitution, static friction, and rolling friction coefficients of sorghum seeds–photosensitive resin material to 0.690, 0.345, and 0.04, respectively. We used the steepest ascent search experiment and central composite design experiment to calibrate the collision restitution, static friction, and rolling friction coefficients of sorghum seeds–sorghum seeds to 0.04, 0.450, and 0.043, respectively.
- (4)
- Three simulation experiments were performed according to the discrete element simulation parameters of the overall calibration. In the simulation, the angles of repose of the seeds were 33.58°, 33.91°, and 33.72°, respectively. The relative errors of the simulated angle of repose and the real physical angle of repose (33.82°) were 0.7%, 0.25%, and 0.3%, respectively. A two-sample t-test was performed on the samples and physical experiment angles of repose, where p was 0.216. The overall verification results show that there was no significant difference between the physical experiment angle of repose and the simulation experiment angle of repose, which further confirms the authenticity and reliability of the simulated parameters after calibration.
This study aims to determine the DEM parameters required for the mechanized sowing process of sorghum seeds, and to provide a discrete element simulation modeling of sorghum seeds to fill the gaps in the research on DEM parameters and models of sorghum seeds. Meanwhile, it offers strong data support and technical support to the discrete element method research between sorghum seeds–equipment and the development of related measurement devices.
Author Contributions
Conceptualization, G.M.; methodology, Y.L.; software, T.W.; validation, J.D.; formal analysis, S.Z.; investigation, Q.L.; resources, K.C.; data curation, G.M.; writing—original draft preparation, G.M.; writing—review and editing, Y.H.; visualization, G.M.; supervision, Y.H.; project administration, Y.H.; funding acquisition, Y.H. All authors have read and agreed to the published version of the manuscript.
Funding
This research was funded by the National Key Research and Development Program of China (No.2018YFD0701102), and the Key Research and Development Program of Shaanxi Province, China (No. 2019ZDLNY02-03).
Institutional Review Board Statement
Not applicable.
Informed Consent Statement
Not applicable.
Data Availability Statement
Not applicable.
Conflicts of Interest
The authors declare no conflict of interest.
References
- Liu, C.; Zhang, H.; Xin, X. Analysis on changes and trends in the world’s sorghum supply and demand. Food Nutr. China 2020, 26, 42–46. [Google Scholar]
- Liu, C.; Zhang, H. Analysis of the development characteristics and trends of sorghum industry in China. J. Agric. Sci. Technol. 2020, 22, 1–9. [Google Scholar]
- Li, H.; Zhou, X. Sorghum trade status quo and development trend at home and abroad. Agric. Outlook 2016, 12, 63–66. [Google Scholar]
- Li, H.; Li, X.; Ping, J.; Du, Z.; Zhang, F. Sorghum mechanization development prospect and corresponding cultivation techniques in China. Mod. Agric. Sci. Technol. 2015, 22, 45–46. [Google Scholar]
- Ma, Z.; Li, Y.; Xu, L. Summarize of particle movements research in agricultural engineering realm. Trans. Chin. Soc. Agric. Mach. 2013, 44, 22–29. [Google Scholar]
- Yu, J.; Fu, H.; Li, H.; Shen, Y. Application of discrete element method to research and design of working parts of agricultural machines. Trans. Chin. Soc. Agric. Eng. 2005, 5, 1–6. [Google Scholar]
- Horabik, J.; Molenda, M. Parameters and contact models for DEM simulations of agricultural granular materials: A review. Biosyst. Eng. 2016, 147, 206–225. [Google Scholar] [CrossRef]
- Oinonen, A.; Marquis, G. A constitutive model for interface problems with frictional contact and cohesion. Eur. J. Mech. A/Solids 2015, 49, 205–213. [Google Scholar] [CrossRef]
- Martin, C.L.; Bouvard, D.; Shima, S. Study of particle rearrangement during powder compaction by the discrete element method. J. Mech. Phys. Solids 2003, 51, 667–693. [Google Scholar] [CrossRef]
- Zhang, T.; Liu, F.; Zhao, M.; Liu, Y.; Li, F.; Chen, C.; Zhang, Y. Movement law of maize population in seeds room of seeds metering device based on discrete element method. Trans. Chin. Soc. Agric. Eng. 2016, 32, 27–35. [Google Scholar]
- Han, Y.; Jia, F.; Tang, Y.; Liu, Y.; Zhang, Q. Effect of particle rolling friction coefficient on stacking properties. Acta Phys. Sin. 2014, 63, 173–179. [Google Scholar]
- Kruggel-Emden, H.; Rickelts, S.; Wirtz, S.; Schere, V. A study on the validity of the multi-sphere discrete element method. Powder Technol. 2008, 188, 153–165. [Google Scholar] [CrossRef]
- Zhang, R.; Jiao, W.; Zhou, J.; Qi, B.; Liu, H.; Xia, Q. Parameter calibration and experiment of rice seeds discrete element model with different filling particle radius. Trans. Chin. Soc. Agric. Mach. 2020, 51, 227–235. [Google Scholar]
- Coetzee, C.J.; Els, D.N.J. Calibration of discrete element parameters and the modelling of Silo discharge and bucket filling. Comput. Electron. Agric. 2009, 65, 198–212. [Google Scholar] [CrossRef]
- Zhang, R.; Han, D.; Ji, Q.; He, Y.; Li, J. Calibration methods of sandy soil parameters in simulation of discrete element method. Trans. Chin. Soc. Agric. Mach. 2017, 48, 49–56. [Google Scholar]
- Geldart, D.; Abdullah, E.C.; Hassanpour, A.; Nwoke, L.C.; Wouters, I. Characterization of powder flowability using measurement of angle of repose. China Particuology Sci. Technol. Part. 2006, 4, 104–107. [Google Scholar] [CrossRef]
- Wen, X.; Yuan, H.; Wang, G.; Jia, H. Calibration method of friction coefficient of granular fertilizer by discrete element simulation. Trans. Chin. Soc. Agric. Mach. 2020, 51, 115–122. [Google Scholar]
- Razavi, S.M.A.; Pourfarzad, A.; Sourky, A.H.; Jahromy, S.H.R. The physical properties of fig (Ficus carica L.) as a function of moisture Content and Variety. Philipp. Agric. Sci. 2010, 93, 170–181. [Google Scholar]
- Ye, Y.; Zeng, Y.; Zeng, C.; Jin, L. Experimental study on the normal restitution coefficient of granite spheres. Chin. J. Rock Mech. Eng. 2017, 36, 633–643. [Google Scholar]
- Xing, J.; Zhang, R.; Wu, P.; Zhang, X.; Dong, X.; Chen, Y.; Ru, S. Parameter calibration of discrete element simulation model for latosol particles in hot areas of Hainan Province. Trans. Chin. Soc. Agric. Eng. 2020, 36, 158–166. [Google Scholar]
- Ge, T.; Jia, Z.; Zhou, K. A Theoretical model for the coefficient of restitution calculation of point impact. Mach. Des. Res. 2007, 23, 14–16. [Google Scholar]
- Favier, J.F.; Abbaspour-Fard, M.H.; Kremmer, M.; Raji, A.O. Shape representation of axi-symmetrical, non-spherical particles in discrete element simulation using multi-element model particles. Eng. Comput. 1999, 16, 467–480. [Google Scholar] [CrossRef]
- Abbaspour-Fard, M.H. Theoretical validation of a multi-sphere, discrete element model suitable for biomaterials handling simulation. Biosyst. Eng. 2004, 88, 153–161. [Google Scholar] [CrossRef]
- El-Emam, M.A.; Zhou, L.; Shi, W.; Han, C.; Bai, L.; Agarwal, R. Theories and Applications of CFD—DEM Coupling Approach for Granular Flow: A Review. Arch. Comput. Methods Eng. 2021, 28, 4979–5020. [Google Scholar] [CrossRef]
- Liu, F.Y.; Zhang, J.; Li, B.; Chen, J. Calibration of parameters of wheat required in discrete element method simulation based on repose angle of particle heap. Trans. Chin. Soc. Agric. Eng. 2016, 32, 247–253. [Google Scholar]
- Hou, Z.F.; Dai, N.F.; Chen, Z.; Qiu, Y.; Zhang, X.W. Measurement and calibration of physical property parameters for Agropyron seeds in a discrete element simulation. Trans. Chin. Soc. Agric. Eng. 2020, 36, 46–54. [Google Scholar]
- Ma, W.P.; You, Y.; Wang, D.C.; Yin, S.J.; Huan, X.L. Parameter calibration of alfalfa seed discrete element model based on RSM and NSGA—II. Trans. Chin. Soc. Agric. Eng. 2020, 51, 136–144. [Google Scholar]
- Shi, G.K.; Li, J.B.; Ding, L.P.; Zhang, Z.Y.; Ding, H.Z.; Li, N.; Kan, Z. Calibration and tests for the discrete element simulation parameters of fallen jujube fruit. Agriculture 2022, 12, 38. [Google Scholar] [CrossRef]
- Li, Y.; Wei, Y.; Yang, L.; Zhang, D.; Cui, T.; Zhang, K. Design and experiment of mung bean precision seeds-metering device with disturbance for promoting seeds filling. Trans. Chin. Soc. Agric. Mach. 2020, 51, 43–53. [Google Scholar]
Publisher’s Note: MDPI stays neutral with regard to jurisdictional claims in published maps and institutional affiliations. |
© 2022 by the authors. Licensee MDPI, Basel, Switzerland. This article is an open access article distributed under the terms and conditions of the Creative Commons Attribution (CC BY) license (https://creativecommons.org/licenses/by/4.0/).