Abstract
It is very important to determine the irrigation water requirement (IR) of crops for optimal irrigation scheduling under the changing climate. This study aimed to investigate the impact of climate change on the future IR and yield of three strategic crops (winter wheat, barley, fodder maize) in the semi-arid Qazvin Plateau, Iran, for the periods 2016–2040, 2041–2065, and 2066–2090. The Canadian Earth System Model (CanESM2), applying IPCC scenarios rcp2.6, rcp4.5, and rcp8.5, was used to project the monthly maximum and minimum temperatures and monthly precipitation of the region. The results indicated that the maximum and minimum temperatures will increase by 1.7 °C and 1.2 °C, respectively, under scenario rcp8.5 in the period 2066–2090. The precipitation will decrease (1%–13%) under all scenarios in all months of the future periods, except in August, September, and October. The IR of winter wheat and barley will increase by 38%–79% under scenarios rcp2.6 and rcp8.5 in the future periods. The increase in the IR of fodder maize will be very slight (0.7%–4.1%). The yield of winter wheat and barley will decrease by ~50%–100% under scenarios rcp2.6 and rcp8.5 in the future periods. The reduction in the yield of maize will be ~4%. Serious attention has to be paid to the water resources management of the region. The use of drought-tolerant cultivars in the region can be a good strategy to deal with the predicted future climatic conditions.
1. Introduction
The Earth’s climate is changing at an uncharted speed [1,2,3]. This immense change in the climate is mainly due to increase in the Earth’s temperature [2,3,4]. The rising temperature is projected to continue its trend in the future decades [3,4,5,6]. One of the fundamental reasons for this is the increase in the accumulation of greenhouse gases such as carbon dioxide, methane, nitrous oxide, and water vapor derived mostly from human activities [1,7]. Climate change is also a function of the volume of ozone, aerosols, and sunspots [8].
Climate change is one of the most important challenges that humans are currently facing [1,9]. Climate change has had remarkably negative effects on many countries in the world, specifically on developing countries that have inadequate resources [10]. Climate change can result in economic drawbacks in the future [11]. Environmentally, it leads to water scarcity and deteriorates desertification [1,12].
Climate change also affects crop evapotranspiration (ET) and therefore the irrigation water requirement (IR) [13,14,15]. Crop ET plays a key role in the designation and management of crop irrigation schedules [16]. It is very important to determine the irrigation water requirement of crops for optimal irrigation scheduling. One of the most widely used approaches to determine crop water use is demand-based estimation [17,18,19,20]. This approach uses the computed ET and a crop-specific coefficient (Kc) to estimate the crop water use [21].
The population inhabiting drylands exceeds two million, which constitutes approximately 40% of the world population [22]. Cereals are the main crops grown in dryland regions [23]. Agricultural production in drylands is fundamentally dependent on water availability during the growth period [24]. Furthermore, the rising temperature has caused severe droughts and significant losses in the yield arid and semi-arid zones [25]. Thus, the sustainable management of drylands is necessary to fulfill food security [26]. To do so, possible measurements and predictions have to be accessible to preserve water resources and agricultural sectors in drylands [27].
Iran is a country with fluctuating climatic conditions. Its climatic domain is diverse, ranging from cold and moist regions in the north to arid and semi-arid regions in the south and east. These regions are susceptible to climate change-derived temperature increase [28]. Studies reported a significant increase in annual mean and maximum temperatures from 1960 to 2005 across the different regions in Iran [29,30]. In the mentioned period, the reference crop ET was shown to have an increasing trend over the different regions of Iran [31]. In addition, agroecosystems of Iran experienced severe drought during recent decades [32]. It is expected that the agricultural systems of Iran will be affected by the intense changes in climate and water resources [33].
One of the most advanced tools to simulate responses to the concentration of greenhouse gases is General Circulation Models (GCMs) [2]. Studies have shown that the output data of GCMs cannot be used directly, because they are not adequately precise [2]. To deal with this problem, Statistical Downscaling Models (SDSMs) have been developed [34]. SDSMs are frequently used in natural and agricultural studies, where dependent variables are predicted by independent variables [35]. Using downscaling methods, the authors of [5] applied the Canadian Earth System Model (CanESM2) to project the temperature and precipitation trends of the semi-arid Qazvin Plateau for the future decades. In the study, it was forecasted that the temperature and precipitation would significantly decrease, resulting in decline in the yield of winter wheat.
This study consisted of three main goals:
- To predict the monthly maximum and minimum temperatures and monthly precipitation of the semi-arid Qazvin Plateau, Iran, until the end of the century;
- To analyze the impact of climate change on the future IR of three strategic crops winter wheat (Triticum aestivum L.), barley (Hordeum vulgare L.), and fodder maize (Zea mays L.) of the region;
- To investigate the climate change impact on the future yield of the crops.
2. Methodology
2.1. Study Area
The area of the semi-arid Qazvin Plateau is 15821 km2. Its average altitude, annual precipitation, daily mean temperature, and relative humidity are 1278 m above sea level, 301 mm, 14.2°C, and 51%, respectively. The Siberian and Mediterranean winds significantly affect and control the climate of the region. The study area consisted of six meteorological stations, namely Qazvin, Buin-Zahra, Kohin, Moalem-Kelaye, Takestan, and Avaj (Table 1).

Table 1.
Coordinates of the meteorological stations of the study area.
2.2. Data Collection and Preparation
The daily maximum and minimum temperatures and daily precipitation data for a period of 30 years (1986–2015) were collected from the stations. Then, the daily maximum and minimum temperatures and daily precipitation were calculated distinctly by ArcGIS version 10 using the Thiessen polygons method.
2.3. Prediction of the Climatic Variables
The Canadian Earth System Model (CanESM2) model was used to simulate the future daily maximum and minimum temperatures and daily precipitation. In this model, the long-term time series are extracted into a one-segment text document per lattice cell. This lattice is uniform along the longitude and contains a resolution of 2.81°. The linear regression model was used to calibrate the points (stations) against the pixels (lattice cells). For the calibration and validation of the model, 70% and 30% of the observed data were used, respectively. The Statistical Downscaling Model (SDSM) software version 5.2 was used to analyze the climatic data. SDSM is a powerful statistical technique for recognizing the impact of local climate change [34]. To make statistical connections between the variables, a few regression models were used to project the future climatic variables under the changing climate. After evaluating the regression models, the climate change scenarios were applied by the CanESM2 model for the periods 2016–2040, 2041–2065, and 2066–2090. The properties of these scenarios are indicated in Table 2.
Table 2.
Properties of the applied scenarios authorized by the Intergovernmental Panel on Climate Change (IPCC) [9].
To evaluate and compare the accuracy of the scenarios and to select the most efficient predictive scenario, statistical indices Mean Absolute Error (MAE), Root Mean Square Error (RMSE), Nash-Sutcliffe coefficient (NS), and Coefficient of Determination (R2) were used:
where Oi and Pi are the observed and simulated values, respectively, and and are the averaged observed and simulated values, respectively. is the variance of the observed values, is the variance of the simulated values, and n is the number of data.
MAE and RMSE are statistical indices to evaluate the precision of variables [36]. If the MAE and RMSE values are near zero, the scenario is more efficient for predicting the variables [37]. If they are zero, it means that no prediction error exists [37]. The Nash–Sutcliffe coefficient (NS) indicates the similarity between the simulated and measured data. Its amplitude consists of the negative infinity and one, and NS = 1 means a thorough similarity or a complete performance of the scenario [38]. R2 shows the correlation between the measured and simulated data, and its amplitude is from zero to one [39]. An R2 value closer to zero indicates a significant correlation between the data categories [39].
2.4. Estimation of Actual Evapotranspiration (ETa)
The simulated climatic variables were the daily maximum and minimum temperatures and daily precipitation. Accordingly, the Hargreaves–Samani equation was used to estimate the reference evapotranspiration (ET0) [40]:
where ET0 is the reference evapotranspiration (mm d−1); Tmean, Tmax, and Tmin are the daily mean, maximum, and minimum temperatures (°C); and Ra is the extraterrestrial radiation (mm d−1).
The ET0 was multiplied by the crop coefficients to attain the actual evapotranspiration (ETa). The evapotranspiration model was calibrated and validated versus the baseline values. The R2 (0.984) and RMSE (0.016) values indicated high similarity of the modelled evapotranspiration values to the baseline values. The crop coefficients, growth period, and duration of growth stages were achieved by the OPTIWAT software (Table 3).
Table 3.
Crop coefficients, growth period, and duration of growth stages for winter wheat, barley, and fodder maize in the Qazvin Plateau.
2.5. Estimation of Irrigation Water Requirement (IR)
The monthly irrigation water requirement was calculated by subtracting the ETa from the effective precipitation (Pe) in each month as follows [41]:
where Pe is the precipitation stored in the rhizosphere and consumed by the plant. The Pe was calculated by the CROPWAT software version 8.0 using the equations of SCS (Soil Conservation Service).
2.6. Estimation of Yield
The Stewart model was used to estimate the effect of irrigation water requirement changes on the yield of the crops [42]:
where Ya is the actual yield (ton ha−1), Ym is the maximum yield (ton ha−1), ETa is the actual evapotranspiration (mm d−1), ETm is the maximum evapotranspiration, and Ky is the coefficient of the reaction of crop yield to water stress.
The Ky and Ym of crops are calculated based on field experiments. For the crops in this study, Ky and Ym were attained from the experiment described in [43] on the same crops in the Qazvin Plateau (Table 4). The Stewart model was calibrated and validated against the baseline values. The maximum yield values of the crops for the baseline period (2011) were used to attain the actual yield by the Stewart model. The attained actual yield values were compared with the actual yield values reported for the Qazvin Plateau by the Ministry of Agriculture, which were shown to have a high similarity (R2 = 0.917, RMSE = 0.03). It is important to know that the climate change-derived CO2 fertilization effect was not considered in the used crop yield model.
Table 4.
Total cultivation area, maximum yield (Ym), and the coefficient of the reaction of crop yield to water stress (Ky) for winter wheat, barley, and fodder maize in the Qazvin Plateau (Najarchi et al., 2011).
3. Results
3.1. Evaluation of Model and Scenarios
All statistical indicators showed that the mean daily maximum and minimum temperatures and daily precipitation values had a relatively high fit to the observed values (Table 5). However, scenarios rcp2.6 and rcp8.5 represented a better fit to the observed values than scenario rcp4.5. Therefore, scenarios rcp2.6 and rcp8.5, the most optimistic and least optimistic ones, respectively, were used to estimate the evapotranspiration, irrigation water requirement, and yield of the crops.
Table 5.
Performance of the model in the baseline period (1986–2015) using the statistical error criteria.
3.2. Prediction of Temperature
The simulation results showed that the maximum temperature would rise in the first eight months and decrease in the last four months for all periods and under all scenarios, in comparison with the observed period (Figure 1). The highest increase in the maximum temperature was attributed to the period 2066–2090 and the rcp8.5 scenario, in which the maximum temperature increased by 1.7°C. The lowest increase in the maximum temperature belonged to the period 2016–2040 of the rcp2.6 scenario, with an increase of 0.3°C.
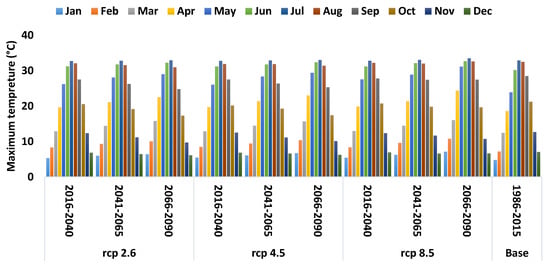
Figure 1.
Comparison of the mean monthly maximum temperature of periods 2016–2040, 2041–2065, and 2066–2090 under scenarios rcp2.6, rcp4.5, and rcp8.5 with the baseline period.
The minimum temperature also increased in the first eight months of the year and decreased in the remaining months in all periods and under all scenarios (Figure 2). The highest increase in the minimum temperature was related to the period 2066–2090 and the scenario rcp8.5, with an increase of 1.2 °C. The lowest increase in the minimum temperature was in the period 2016–2040 and under the scenario rcp.4.5, increasing by 0.1 °C.
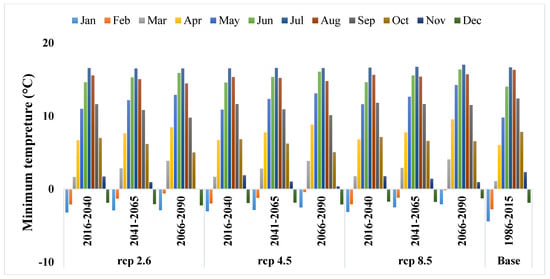
Figure 2.
Comparison of the mean monthly minimum temperature of periods 2016–2040, 2041–2065, and 2066–2090 under scenarios rcp2.6, rcp4.5, and rcp8.5 with the baseline period.
3.3. Prediction of Precipitation
All scenarios projected that the monthly precipitation will decrease in all months of all periods, except in August, September, and October, compared to the observed period (Figure 3). The highest decrease in the monthly precipitation was related to the scenario rcp2.6 (13% decrease) in the period 2016–2040 in comparison with the observed period. The lowest decrease in monthly precipitation belonged to the scenario rcp4.5 (1% decrease) in the period 2066–2090 compared to the observed period. Investigating the month by month precipitation indicated that the precipitation will increase in August, September, and October under all scenarios and periods, with September in 2066–2090 having the highest amount. Except for these months, the precipitation will decrease in all months of all scenarios and periods, with June in 2066–2090 having the greatest decrease.
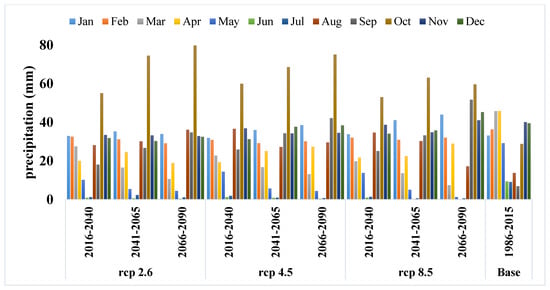
Figure 3.
Comparison of the monthly precipitation of periods 2016–2040, 2041–2065, and 2066–2090 under scenarios rcp2.6, rcp4.5, and rcp8.5 with the baseline period.
3.4. Estimation of Irrigation Water Requirement (IR)
The results demonstrated that the irrigation water requirement (IR) of winter wheat will increase in all periods under both scenarios (Figure 4). Meanwhile, the IR will further increase as the end of the century approaches. The monthly and total change percentage of the IR is also shown in Table 6. An IR change between 38% and 79% was observed under both scenarios in all periods compared to the baseline period.

Figure 4.
Comparison of the irrigation water requirement (IR) of winter wheat under scenarios rcp2.6 and rcp8.5 for the periods 2016–2040, 2041–2065, and 2066–2090 with the baseline period.
Table 6.
Change values of the irrigation water requirement (IR) of winter wheat under scenarios rcp2.6 and rcp8.5 for periods 2016–2040, 2041–2065, and 2066–2090 versus the baseline period.
The IR of barley was also enhanced in all periods under both scenarios, with a further increase toward the end of the century (Figure 5). As in the case of winter wheat, an IR change between 38% and 79% was observed for barley under both scenarios in all periods compared to the baseline period (Table 7).
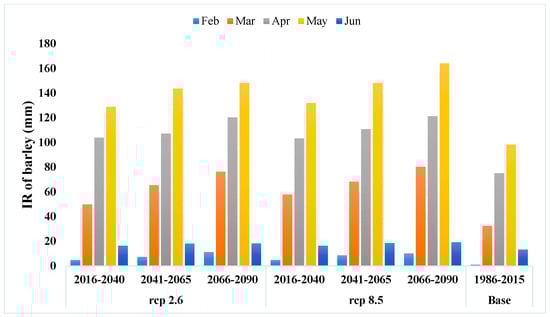
Figure 5.
Comparison of the irrigation water requirement (IR) of barley under scenarios rcp2.6 and rcp8.5 for periods 2016–2040, 2041–2065, and 2066–2090 versus the baseline period.
Table 7.
Change values of the irrigation water requirement (IR) of barley in the periods 2016–2040, 2041–2065, and 2066–2090 and under the scenarios rcp2.6 and rcp8.5 with the baseline period.
For fodder maize, the IR increased in May, June, and July, and decreased in August and September in comparison with the baseline period (Figure 6). In total, the IR decreased by 0.2% and 1.4% in the periods 2016–2040 (under rcp8.5 scenario) and 2066–2090 (under rcp2.6 scenario), respectively (Table 8), while it increased in the remaining periods.
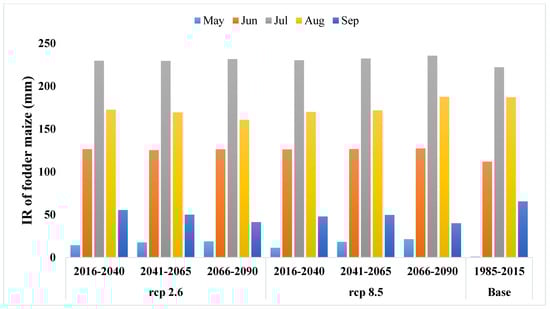
Figure 6.
Comparison of the irrigation water requirement (IR) of fodder maize under scenarios rcp2.6 and rcp8.5 for periods 2016–2040, 2041–2065, and 2066–2090 versus the baseline period.
Table 8.
Change values of the irrigation water requirement (IR) of fodder maize under scenarios rcp2.6 and rcp8.5 for periods 2016–2040, 2041–2065, and 2066–2090 versus the baseline period.
3.5. Estimation of Yield
Except in the two periods 2066–2090 under scenario rcp2.6 and 2016–2040 under scenario rcp8.5 for fodder maize, the crops yield decreased in all periods under both scenarios (Table 9). Meanwhile, the yield reduction became more severe as the end of the century approached. The actual yield of the crops is shown in Table 10. Moreover, the total yield of the crops in the Qazvin Plateau under both scenarios for the future periods is presented in Table 11.
Table 9.
Results of the change percentage of the crops under scenarios rcp2.6 and rcp8.5 in periods 2016–2040, 2041–2065, and 2066–2090 versus the baseline period in the Qazvin Plateau.
Table 10.
Results of the actual yield of the crops under scenarios rcp2.6 and rcp8.5 for periods 2016–2040, 2041–2065, and 2066–2090 in the Qazvin Plateau.
Table 11.
Results of the total yield of the crops under the scenarios rcp2.6 and rcp8.5 for the periods 2016–2040, 2041–2065, and 2066–2090 versus the observed period in the Qazvin Plateau.
4. Discussion
4.1. Evaluation of Model and Scenarios
The CanESM2 model seems to be appropriate for the prediction of the temperature and precipitation of the semi-arid Qazvin Plateau. The scenarios rcp2.6 and rcp8.5 were shown to be the most efficient ones for the prediction of the minimum and maximum temperatures and precipitation. In a study of the Qazvin Plateau using the CanESM2 model, rcp2.6 was found to be the best scenario among the others [5], which is in agreement with the findings of this study. Moreover, the authors of [44,45] showed that CanESM2 model can efficiently predict the temperature and precipitation in the multiple sites with diverse climatic conditions. Evaluating the results of the present study and the other studies presents the usefulness of the CanESM2 model for the prediction of the future temperature and precipitation. However, performing more studies with different climatic models will help us in selecting the most appropriate model for the future research. Furthermore, the model and methods used in the present study can be applied for studies in other regions throughout the world to check whether compatible results are derived. It is also necessary to note that the present model and methods are easy to use and inexpensive. This means that they can be exploited by researchers in regions with less accessibility to scientific facilities. Nonetheless, such models and methods demand a huge data set for being ran efficiently, which might be difficult to attain.
4.2. Prediction of temperature
The maximum temperature was projected to increase in all months of the periods but to decrease in September, October, November, and December under all scenarios in all periods. The same trend was predicted for the minimum temperature. Such predicted increasing trends in the future temperature have been also reported by other studies [3,5,6]. Shifts in the seasons would, however, be the reason for the prospective temperature decrease in September, October, November, and December. Since the Qazvin Plateau is severely impacted by Siberian winds, it is possible that the winds will lead to shifts in the seasons of the area [5]. Furthermore, the highest maximum and minimum temperature will relate to the scenario rcp8.5 and period 2066–2090. The results of the present study are in agreement with the results attained by [44]. The highest temperature was predicted by scenario rcp8.5. This seems acceptable due to the governing physical rules to simulate the continuing increase in the radiative forcing and CO2 accumulations until the end of the century.
4.3. Prediction of Precipitation
It was predicted that the precipitation will decrease under all scenarios in all months of the periods but not in August, September, and October. The precipitation was shown to increase in the three mentioned months, with the greatest increase being in September of the period 2066–2090. The scenario-based projected declines in the precipitation compared to the observed values can overall be explained by the prospective elevation of the radiative forcing and CO2 accumulations by the end of the century. One of the proofs for the projected increase in the precipitation in August, September, and October might be the shift in seasons. Another important reason for the enhancement of the precipitation, specifically in the period 2066–2090, might be the decline in the thickness of the rivers ice and increase in the discharge from May to June in Siberia [46]. This event can be led by redundant warming around Siberia in the period 2066–2090. The authors of [47] predicted that the mean temperature would increase in Siberia by the end of the century. The Qazvin Plateau is severely affected by the Siberian winds. Thus, the highest precipitation projections for the period 2066–2090 might be describable.
4.4. Estimation of Irrigation Water Requirement (IR)
Our calculated irrigation water requirement (IR) was a function of actual evapotranspiration and effective precipitation. The evapotranspiration in this study was partly derived from the maximum and minimum temperatures. Therefore, the higher IR for winter wheat and barley by the approach of the end of the century was reasonable, since the maximum and minimum temperatures of the attributed months were predicted to increase and the precipitation was predicted to decrease by approaching the end of the century. Moreover, the slight decrease in the IR of fodder maize in August and September of all periods follows the same regulation. It was predicted that the maximum and minimum temperatures will decrease in September and the precipitation will increase in August and September of each period. Evapotranspiration in arid and semi-arid areas is expected to increase, which can increase the requirement for agricultural irrigation [16]. The irrigation water requirement was shown to be enhanced by an increase in temperature and evapotranspiration [48].
4.5. Estimation of Yield
The crop yield was predicted to decrease under both scenarios in all periods, except for fodder maize in periods 2066–2090 (rcp2.6) and 2016–2040 (rcp8.5). Overall, the projected reduction in the crop yield can be linked to the predicted increase in the maximum and minimum temperatures, as well as the decrease in the precipitation. Meanwhile, the predicted slight increase in the yield of fodder maize in the two mentioned periods might partly be attributed to the increase in the precipitation and to the decrease in the maximum and minimum temperatures in September and October. Precipitation and temperature are two important factors affecting crop evapotranspiration, which can indirectly affect the yield. High and abnormal evapotranspiration rates derived from climate warming can impose serious water stress on a crop, which might lead to a significant reduction in the yield. In agreement with this study, it was forecasted that the low amount of precipitation and high temperature will decrease the yield of winter wheat in the Qazvin Plateau as the end of the century approaches [28]. The dryland cereals yield in three semi-arid provinces of Iran was also negatively affected by the low amounts of precipitation [49]. Scenario rcp8.5 (1370 ppm CO2) was shown to have a more negative effect on the crops yield compared to scenario rcp2.6 (490 ppm CO2). The crop yield model used in this study did not consider the future CO2 fertilization effect on the yield. Otherwise, the CO2 fertilization may have possibly alleviated the negative impact of water stress on the yield. Especially in C4 plants like maize, which are capable of assimilating higher amounts of atmospheric CO2, the CO2 fertilization effect can significantly compensate reduction in the yield. It would be interesting and important to consider the CO2 fertilization effect in future studies using more advanced crop models.
5. Conclusions
The present study investigated the impact of climate change on the three strategic crops of the semi-arid Qazvin Plateau, Iran. The coupling of a modern climatic model with the classical irrigation water requirement and yield models was shown to be successful and efficient. The CanESM2 climatic model was appropriate for the prediction of the temperature and precipitation of the semi-arid Qazvin Plateau. Moreover, scenarios rcp2.6 and rcp8.5 were the most efficient ones for the prediction of the temperature and precipitation of the region. The models of the present research can be used to study climate change impacts on agroecosystems of other semi-arid regions of the globe.
In general, the irrigation water requirement of winter wheat, barley, and fodder maize will increase as the end of the century approaches. This will lead to noticeable reductions in the yield and can endanger the food security in the region as well as the country. Therefore, significant attention has to be paid to the water resources management of the Qazvin Plateau. In addition, the use of drought-tolerant cultivars can be a good strategy to deal with the predicted future climatic conditions.
Author Contributions
Conceptualization, B.M., M.N., and M.E.; methodology, B.M., M.N., and M.E.; software, B.M., M.N., and M.E.; validation, B.M., M.N., and M.E.; formal analysis, B.M., M.N., and M.E.; investigation, B.M., M.N., and M.E.; resources, B.M., M.N., and M.E.; data curation, B.M., M.N., and M.E.; writing—original draft preparation, M.N.; writing—review and editing, B.M., M.N., and M.E.; visualization, B.M., M.N., and M.E.; supervision, B.M., M.N., and M.E.; project administration, B.M.; funding acquisition, B.M., M.N., and M.E. All authors have read and agreed to the published version of the manuscript.
Funding
This research received no external funding.
Acknowledgments
The authors are thankful to the staff of the Qazvin Meteorological Department for providing the data. The editor and two anonymous reviewers of the manuscript are also acknowledged for their very useful comments.
Conflicts of Interest
The authors declare no conflict of interest.
References
- OECD. The Climate Challenge: Achieving Zero Emissions. 2013. Available online: http://www.oecd.org/env/the-climatechallenge-achieving-zero-emissions.htm (accessed on 20 February 2020).
- IPCC. Climate Change: Impacts, Adaptation and Vulnerability; Cambridge University Press: New York, NY, USA, 2007. [Google Scholar]
- Van Vuuren, D.P.; Meinshause, M.; Plattner, G.K.; Joos, F.; Strassmann, K.M.; Smith, S.J.; Reilly, J.M. Temperature increase of 21st century mitigation scenarios. Proc. Natl. Acad. Sci. USA 2008, 105, 15258–15262. [Google Scholar] [CrossRef]
- Thomas, R.K.; Zhang, R.; Horowitz, L.W. Prospects for a prolonged slowdown in global warming in the early 21st century. Nat. Communities 2016, 7, 1–12. [Google Scholar]
- Mirgol, B.; Nazari, M. Possible Scenarios of Winter Wheat Yield Reduction of Dryland Qazvin Province, Iran, Based on Prediction of Temperature and Precipitation Till the End of the Century. Climate 2018, 6, 78. [Google Scholar] [CrossRef]
- Majhi, S.; Pattnayak, K.C.; Pattnayak, R. Projections of rainfall and surface temperature over Nabarangpur district using multiple CMIP5 models in RCP 4.5 and 8.5 scenarios. Int. J. Appl. Res. 2016, 2, 399–405. [Google Scholar]
- Nozawa, T.; Nagashima, T.; Shiogama, H.; Crooks, S.A. Detecting natural influence on surface air temperature change in the early twentieth century. Geophys. Res. Lett. 2005, 32, L20719. [Google Scholar] [CrossRef]
- Santer, B.D.; Taylor, K.E.; Wigley, T.M.; Johns, T.C.; Jones, P.D.; Karoly, D.J.; Mitchell, J.F.B.; Oort, A.H.; Penner, J.E.; Ramaswamy, V.; et al. A search for human influences on the thermal structure of the atmosphere. Nature 1996, 382, 39–46. [Google Scholar] [CrossRef]
- IPCC. Climate change. In The fifth Assessment Report (AR5) of the United Nations Intergovernmental Panel Science Basis of Climate Change; IPCC: Geneva, Switzerland, 2014. [Google Scholar]
- Zurqani, H.A.; Mikhailova, E.A.; Post, C.J.; Schlautman, M.A.; Elhawej, A.R. A Review of Libyan Soil Databases for Use within an Ecosystem Services Framework. Land 2019, 8, 82. [Google Scholar] [CrossRef]
- Hunt, A.; Watkiss, P. Climate change impacts and adaptation in cities: A review of the literature. Climate Change 2010, 104, 13–49. [Google Scholar] [CrossRef]
- Saad, A.M.A.; Shari_, N.M.; Gairola, S. Nature and causes of land degradation and desertification in Libya: Need for sustainable land management. Afr. J. Biotechnol. 2011, 10, 13680–13687. [Google Scholar]
- Osborne, C.P.; Chuine, I.; Viner, D.; Woodward, F.I. Olive phenology as a sensitive indicator of future climatic warming in the Mediterranean. Plant Cell Environ. 2000, 23, 701–720. [Google Scholar] [CrossRef]
- Pereira, L.S.; De Melo-Abreu, J.P. Vulnerability of rainfed and irrigated agri-culture to climate change. In Climate Changes and Natural Resources: Impact and Water Challenge; Eulisse, E., Ceccato, L., Eds.; Università Ca’Foscari diVenezia and Civilitá dell’Aqua: Venice, Italy, 2009; pp. 39–64. [Google Scholar]
- Quiroga, S.; Iglesias, A. A comparison of the climate risks of cereal, citrus, grapevine and olive production in Spain. Agric. Syst. 2009, 101, 91–100. [Google Scholar] [CrossRef]
- Djaman, K.; O’Neill, M.; Owen, C.K.; Smeal, D.; Koudahe, K.; West, M.; Allen, S.; Lombard, K.; Irmak, S. Crop Evapotranspiration, Irrigation Water Requirement and Water Productivity of Maize from Meteorological Data under Semiarid Climate. Water 2018, 10, 405. [Google Scholar] [CrossRef]
- Ko, J.; Piccinni, G.; Steglich, E. Using EPIC model to manage irrigated cotton and maize. Agric. Water Manag. 2009, 96, 1323–1331. [Google Scholar] [CrossRef]
- Leskovar, D.I.; Agehara, S.; Yoo, K.; Pascual-Seva, N. Crop coefficient-based deficit irrigation and planting density for onion: Growth, yield and bulb quality. HortScience 2012, 47, 31–37. [Google Scholar] [CrossRef]
- Djaman, K.; Irmak, S. Actual crop evapotranspiration and alfalfa and grass reference crop coefficients of maize under full and limited irrigation and rainfed conditions. J. Irrig. Drain. Eng. 2013, 139, 433–446. [Google Scholar] [CrossRef]
- Ghamarnia, H.; Jafarizade, M.; Meri, E.; Gobadei, M.A. Lysimetric determination of Coriandrum sativum L. water requirement and single and dual crop coefficients in a semiarid climate. J. Irrig. Drain. Eng. 2013, 139, 447–455. [Google Scholar] [CrossRef]
- Allen, R.G.; Jensen, M.E.; Wright, J.L.; Burman, R.D. Operational estimates of reference evapotranspiration. Agron. J. 1989, 81, 650–662. [Google Scholar] [CrossRef]
- White, R.P.; Nackoney, J. Drylands, People, and Ecosystem Goods and Services: AWeb-Based Geospatial Analysis. 2003. Available online: http://pdf.wri.org/drylands.pdf (accessed on 17 June 2018).
- LADA. Guidelines for Land Use System Mapping; Technical Report; FAO: Rome, Italy, 2008. [Google Scholar]
- Wang, X.; Cai, D.; Wu, H.; Hoogmoed, W.B.; Oenema, O. Effects of variation in rainfall on rainfed crop yields and water use in dryland farming areas in China. Arid Land Res. Manag. 2016, 30, 1–24. [Google Scholar] [CrossRef]
- Andreadis, K.M.; Lettenmaier, D.P. Trends in 20th century drought over the continental United States. Geophys. Res. Lett. 2006, 33, L10403. [Google Scholar] [CrossRef]
- UNEP. Sourcebook ofAlternative Technologies for FreshwaterAugmentation inWestAsia. 2000. Available online: http://www.unep.or.jp (accessed on 15 June 2018).
- Gan, T.Y. Reducing vulnerability of water resources of Canadian Prairies to potential droughts and possible climate warming. Water Resour. Manag. 2000, 14, 111–135. [Google Scholar] [CrossRef]
- Abbaspour, K.C.; Faramarzi, M.; Ghasemi, S.S.; Yang, H. Assessing the impact of climate change on water resources in Iran. Water Resour Res. 2009, 45, 1–16. [Google Scholar] [CrossRef]
- Saboohi, R.; Soltani, S.; Khodagholi, M. Trend analysis of temperature parameters in Iran. Theor. Appl. Climatol. 2012, 109, 529–547. [Google Scholar] [CrossRef]
- Kousari, M.R.; Ahani, H.; Hendi-zadeh, R. Temporal and spatial trend detection of maximum air temperature in Iran during 1960–2005. Glob Planet Chang 2013, 111, 97–110. [Google Scholar] [CrossRef]
- Dinpashoh, Y.; Jhajharia, D.; Fakheri-Fard, A.; Singh, V.P.; Kahya, E. Trends in reference crop evapotranspiration over Iran. J. Hydrol. 2011, 399, 422–433. [Google Scholar] [CrossRef]
- Foltz, R.C. Iran’s water crisis: Cultural, political, and ethical dimensions. J. Agric. Environ. Ethics 2002, 15, 357–380. [Google Scholar] [CrossRef]
- Sayari, N.; Bannayan, M.; Alizadeh, A.; Farid, A.; Hessami Kermani, M.R.; Eyshi Rezaei, E. Climate change impact on legumes’ water production function in the northeast of Iran. J. Water Clim. Chang. 2015, 6, 374–385. [Google Scholar] [CrossRef]
- Wilby, R.L.; Dawson, C.W.; Barrow, E.M. SDSM—A decision support tool for the assessment of regional climate change impacts. Environ. Modell. Softw. 2002, 17, 147–159. [Google Scholar] [CrossRef]
- Gulden, K.U.; Nese, G. A Study on Multiple Linear Regression Analysis. Procedia Soc. Behav. Sci. 2013, 106, 234–240. [Google Scholar]
- Isaaks, E.H.; Serivastava, R.M. An Introduction to Applied Geostatistics; Oxford University Press: New York, NY, USA, 1989. [Google Scholar]
- Chai, T.; Draxler, R.R. Root mean square error (RMSE) or mean absolute error (MAE)? Arguments against avoiding RMSE in the literature. Geosci. Model Dev. 2014, 7, 1247–1250. [Google Scholar] [CrossRef]
- Nash, J.E.; Sutcliffe, J.V. River flow forecasting through conceptual models part I—A discussion of principles. J. Hydrol. 1970, 10, 282–290. [Google Scholar] [CrossRef]
- Gujarati, D.N.; Porter, D.C. Basic Econometrics, 5th ed.; Tata McGraw-Hill Education: New York, NY, USA, 2009; pp. 73–78. [Google Scholar]
- Hargreaves, G.H.; Samani, Z. Reference crop evapotranspiration from temperature. Appl. Eng. Agric. 1985, 1, 96–99. [Google Scholar] [CrossRef]
- Doll, P. Impact of climate change and variability on irrigation requirements: A global perspective. J. Clim. Chang. 2002, 54, 269–293. [Google Scholar] [CrossRef]
- Doorenbos, J.; Kassam, A.H. “Yield response to Water.” Irrigation and Drainage; Paper No. 33; Food and Agricultural Organization: Rome, Italy, 1979. [Google Scholar]
- Najarchi, M.; Kaveh, F.; Babazadeh, H.; Manshouri, M. Determination of the yield response factor for field crop deficit irrigation. Afr. J. Agric. Res. 2011, 6, 3700–3705. [Google Scholar]
- Vallam, P.; Qin, X.S. Projecting future precipitation and temperature at sites with diverse climate through multiple statistical downscaling schemes. Theor. Appl. Climatol. 2018, 1134, 669–688. [Google Scholar] [CrossRef]
- Mekonnen, D.F.; Disse, M. Analyzing the future climate change of Upper Blue Nile River Basin (UBNRB) using statistical down scaling techniques. Hydrol. Earth Syst. Sci. 2016, 22, 2391–2408. [Google Scholar] [CrossRef]
- Costard, F.; Gautier, E.; Brunstein, D.; Hammadi, J.; Fedorov, A.; Yang, D.; Dupeyrat, L. Impact of the global warming on the fluvial thermal erosion over the Lena River in Central Siberia. Geophys. Res. Lett. 2007, 34, L14501. [Google Scholar] [CrossRef]
- Shiklomanov, N.I.; Streletskiy, D.A.; Swales, T.B.; Kokorev, V.A. Climate change and stability of urban infrastructure in Russian permafrost regions: Prognostic assessment based on GCM climate projections. Geogr. Rev. 2017, 107, 125–142. [Google Scholar] [CrossRef]
- Tanasijevic, L.; Todorovic, M.; Pereira, L.S.; Pizzigalli, C.; Lionello, P. Impacts of climate change on olive crop evapotranspiration andirrigation requirements in the Mediterranean region. Agric. Water Manag. 2014, 144, 54–68. [Google Scholar] [CrossRef]
- Bannayan, M.; Lotfabadi, S.S.; Sanjani, S.; Mohamadian, A.; Aghaalikhani, M. Effects of precipitation and temperature on crop production variability in northeast Iran. Int. J. Biometeorol. 2011, 55, 387–401. [Google Scholar] [CrossRef]
© 2020 by the authors. Licensee MDPI, Basel, Switzerland. This article is an open access article distributed under the terms and conditions of the Creative Commons Attribution (CC BY) license (http://creativecommons.org/licenses/by/4.0/).