Author Contributions
Conceptualization, B.M., M.N., and M.E.; methodology, B.M., M.N., and M.E.; software, B.M., M.N., and M.E.; validation, B.M., M.N., and M.E.; formal analysis, B.M., M.N., and M.E.; investigation, B.M., M.N., and M.E.; resources, B.M., M.N., and M.E.; data curation, B.M., M.N., and M.E.; writing—original draft preparation, M.N.; writing—review and editing, B.M., M.N., and M.E.; visualization, B.M., M.N., and M.E.; supervision, B.M., M.N., and M.E.; project administration, B.M.; funding acquisition, B.M., M.N., and M.E. All authors have read and agreed to the published version of the manuscript.
Figure 1.
Comparison of the mean monthly maximum temperature of periods 2016–2040, 2041–2065, and 2066–2090 under scenarios rcp2.6, rcp4.5, and rcp8.5 with the baseline period.
Figure 1.
Comparison of the mean monthly maximum temperature of periods 2016–2040, 2041–2065, and 2066–2090 under scenarios rcp2.6, rcp4.5, and rcp8.5 with the baseline period.
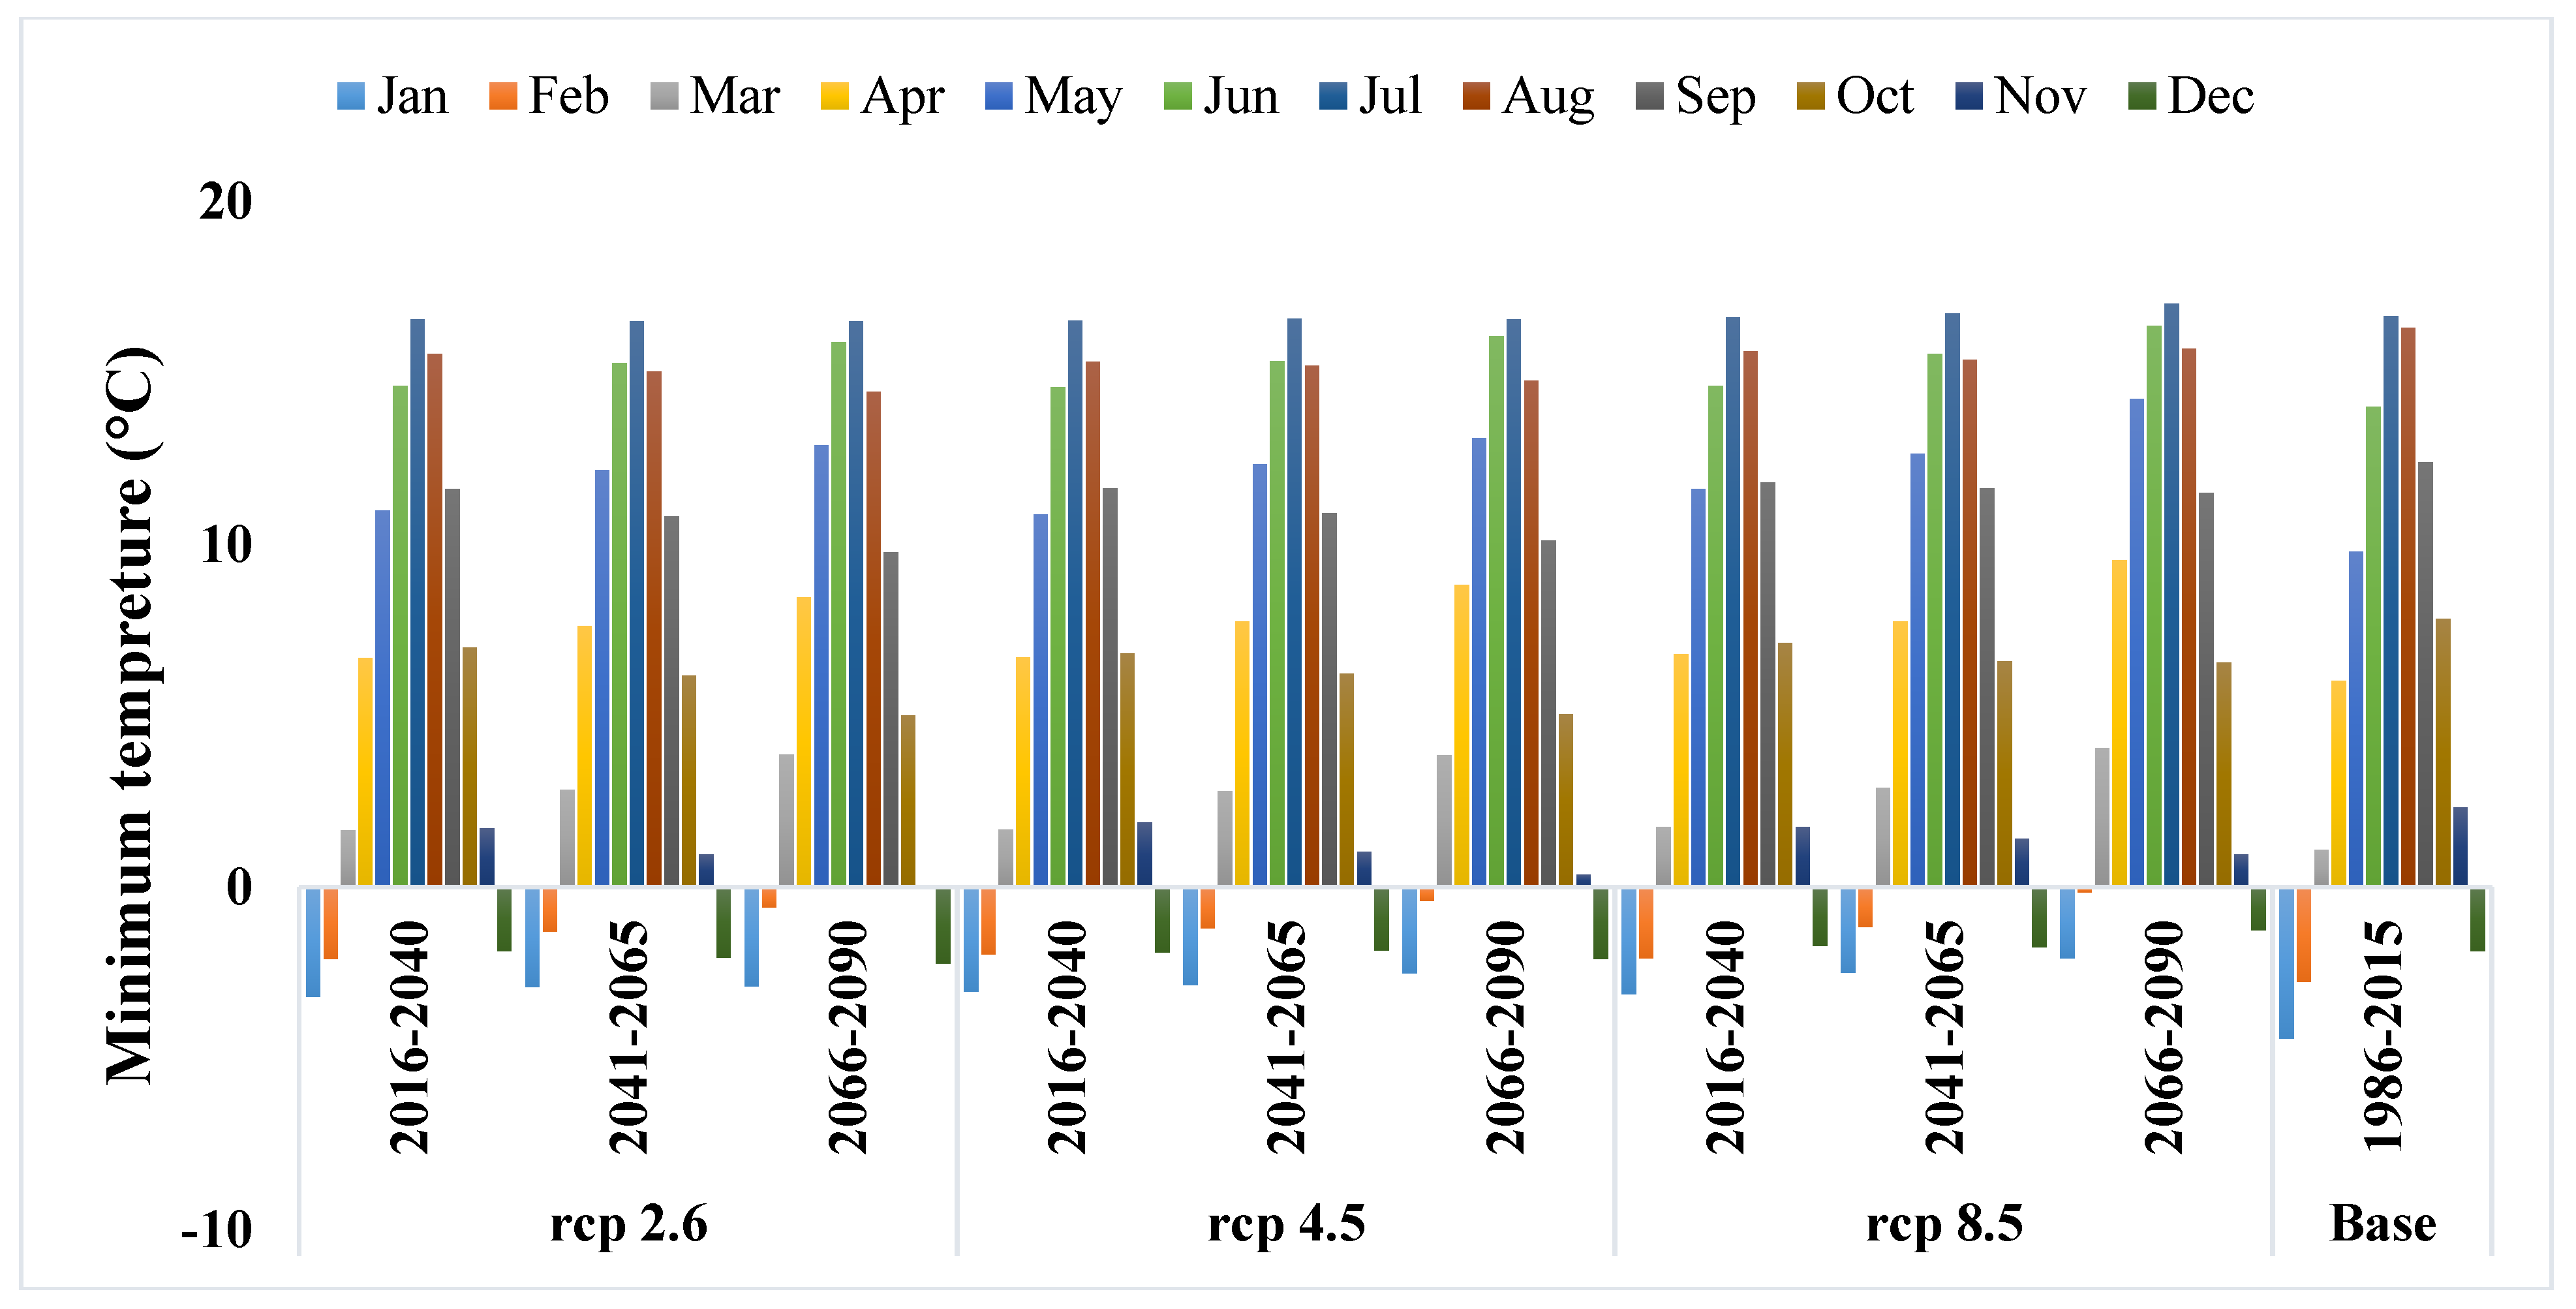
Figure 2.
Comparison of the mean monthly minimum temperature of periods 2016–2040, 2041–2065, and 2066–2090 under scenarios rcp2.6, rcp4.5, and rcp8.5 with the baseline period.
Figure 2.
Comparison of the mean monthly minimum temperature of periods 2016–2040, 2041–2065, and 2066–2090 under scenarios rcp2.6, rcp4.5, and rcp8.5 with the baseline period.
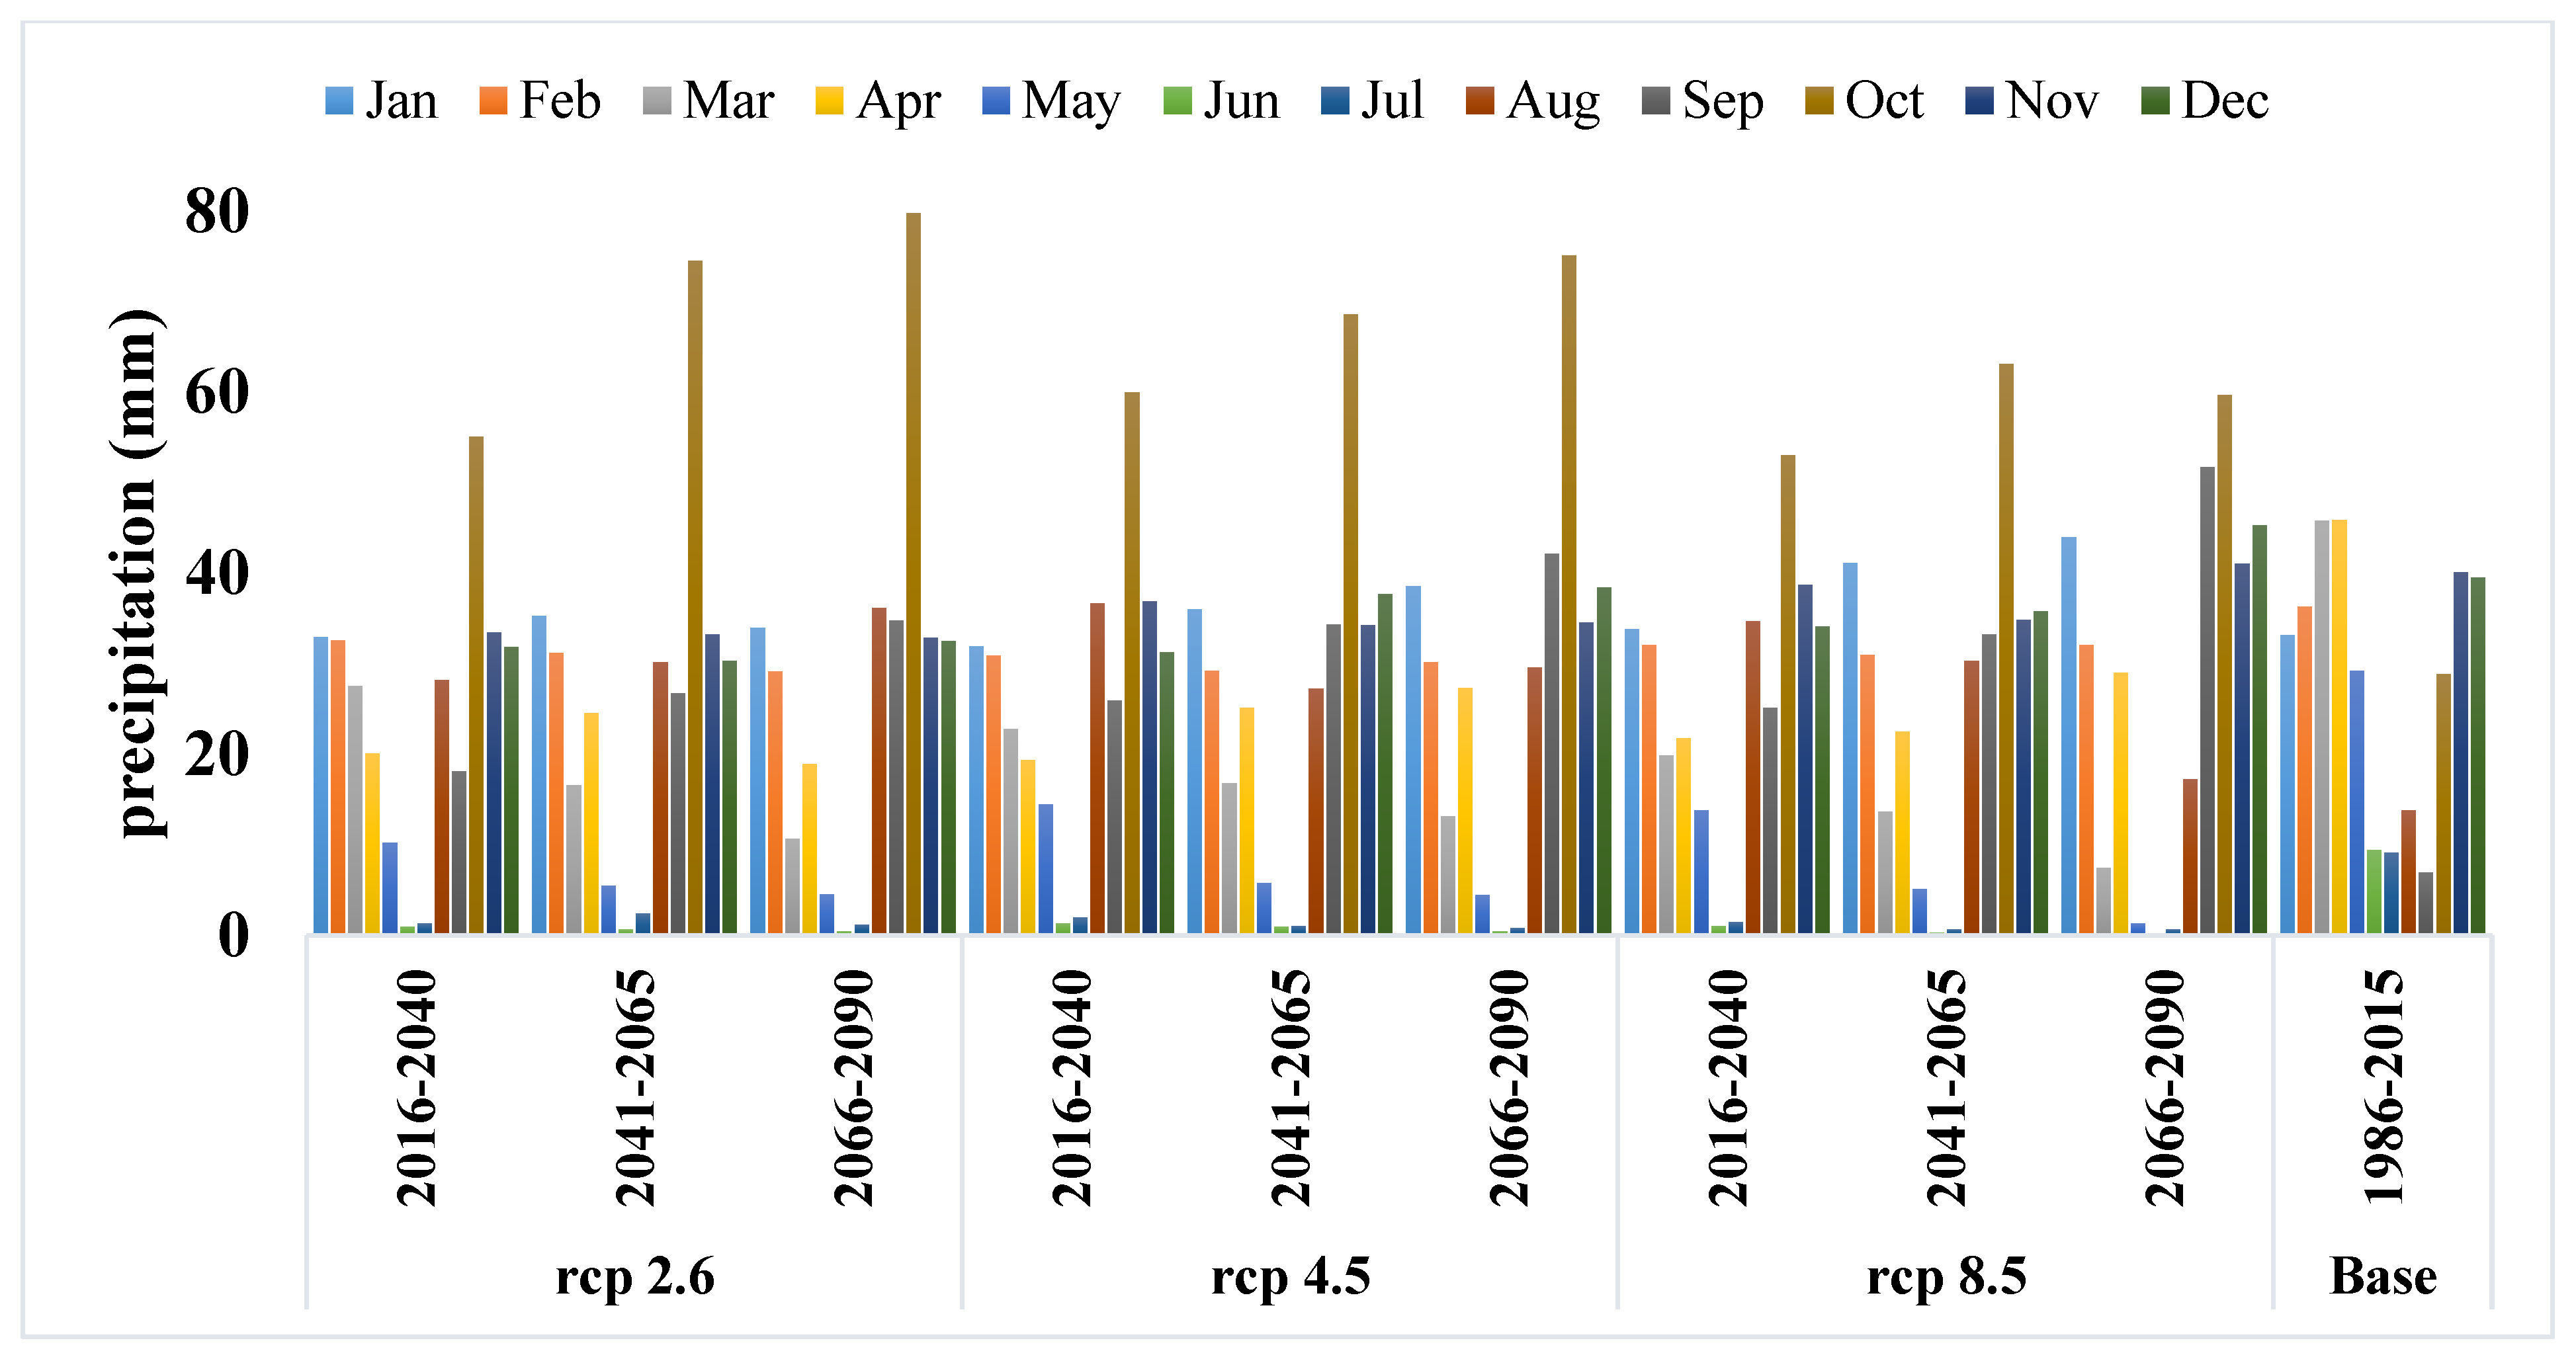
Figure 3.
Comparison of the monthly precipitation of periods 2016–2040, 2041–2065, and 2066–2090 under scenarios rcp2.6, rcp4.5, and rcp8.5 with the baseline period.
Figure 3.
Comparison of the monthly precipitation of periods 2016–2040, 2041–2065, and 2066–2090 under scenarios rcp2.6, rcp4.5, and rcp8.5 with the baseline period.
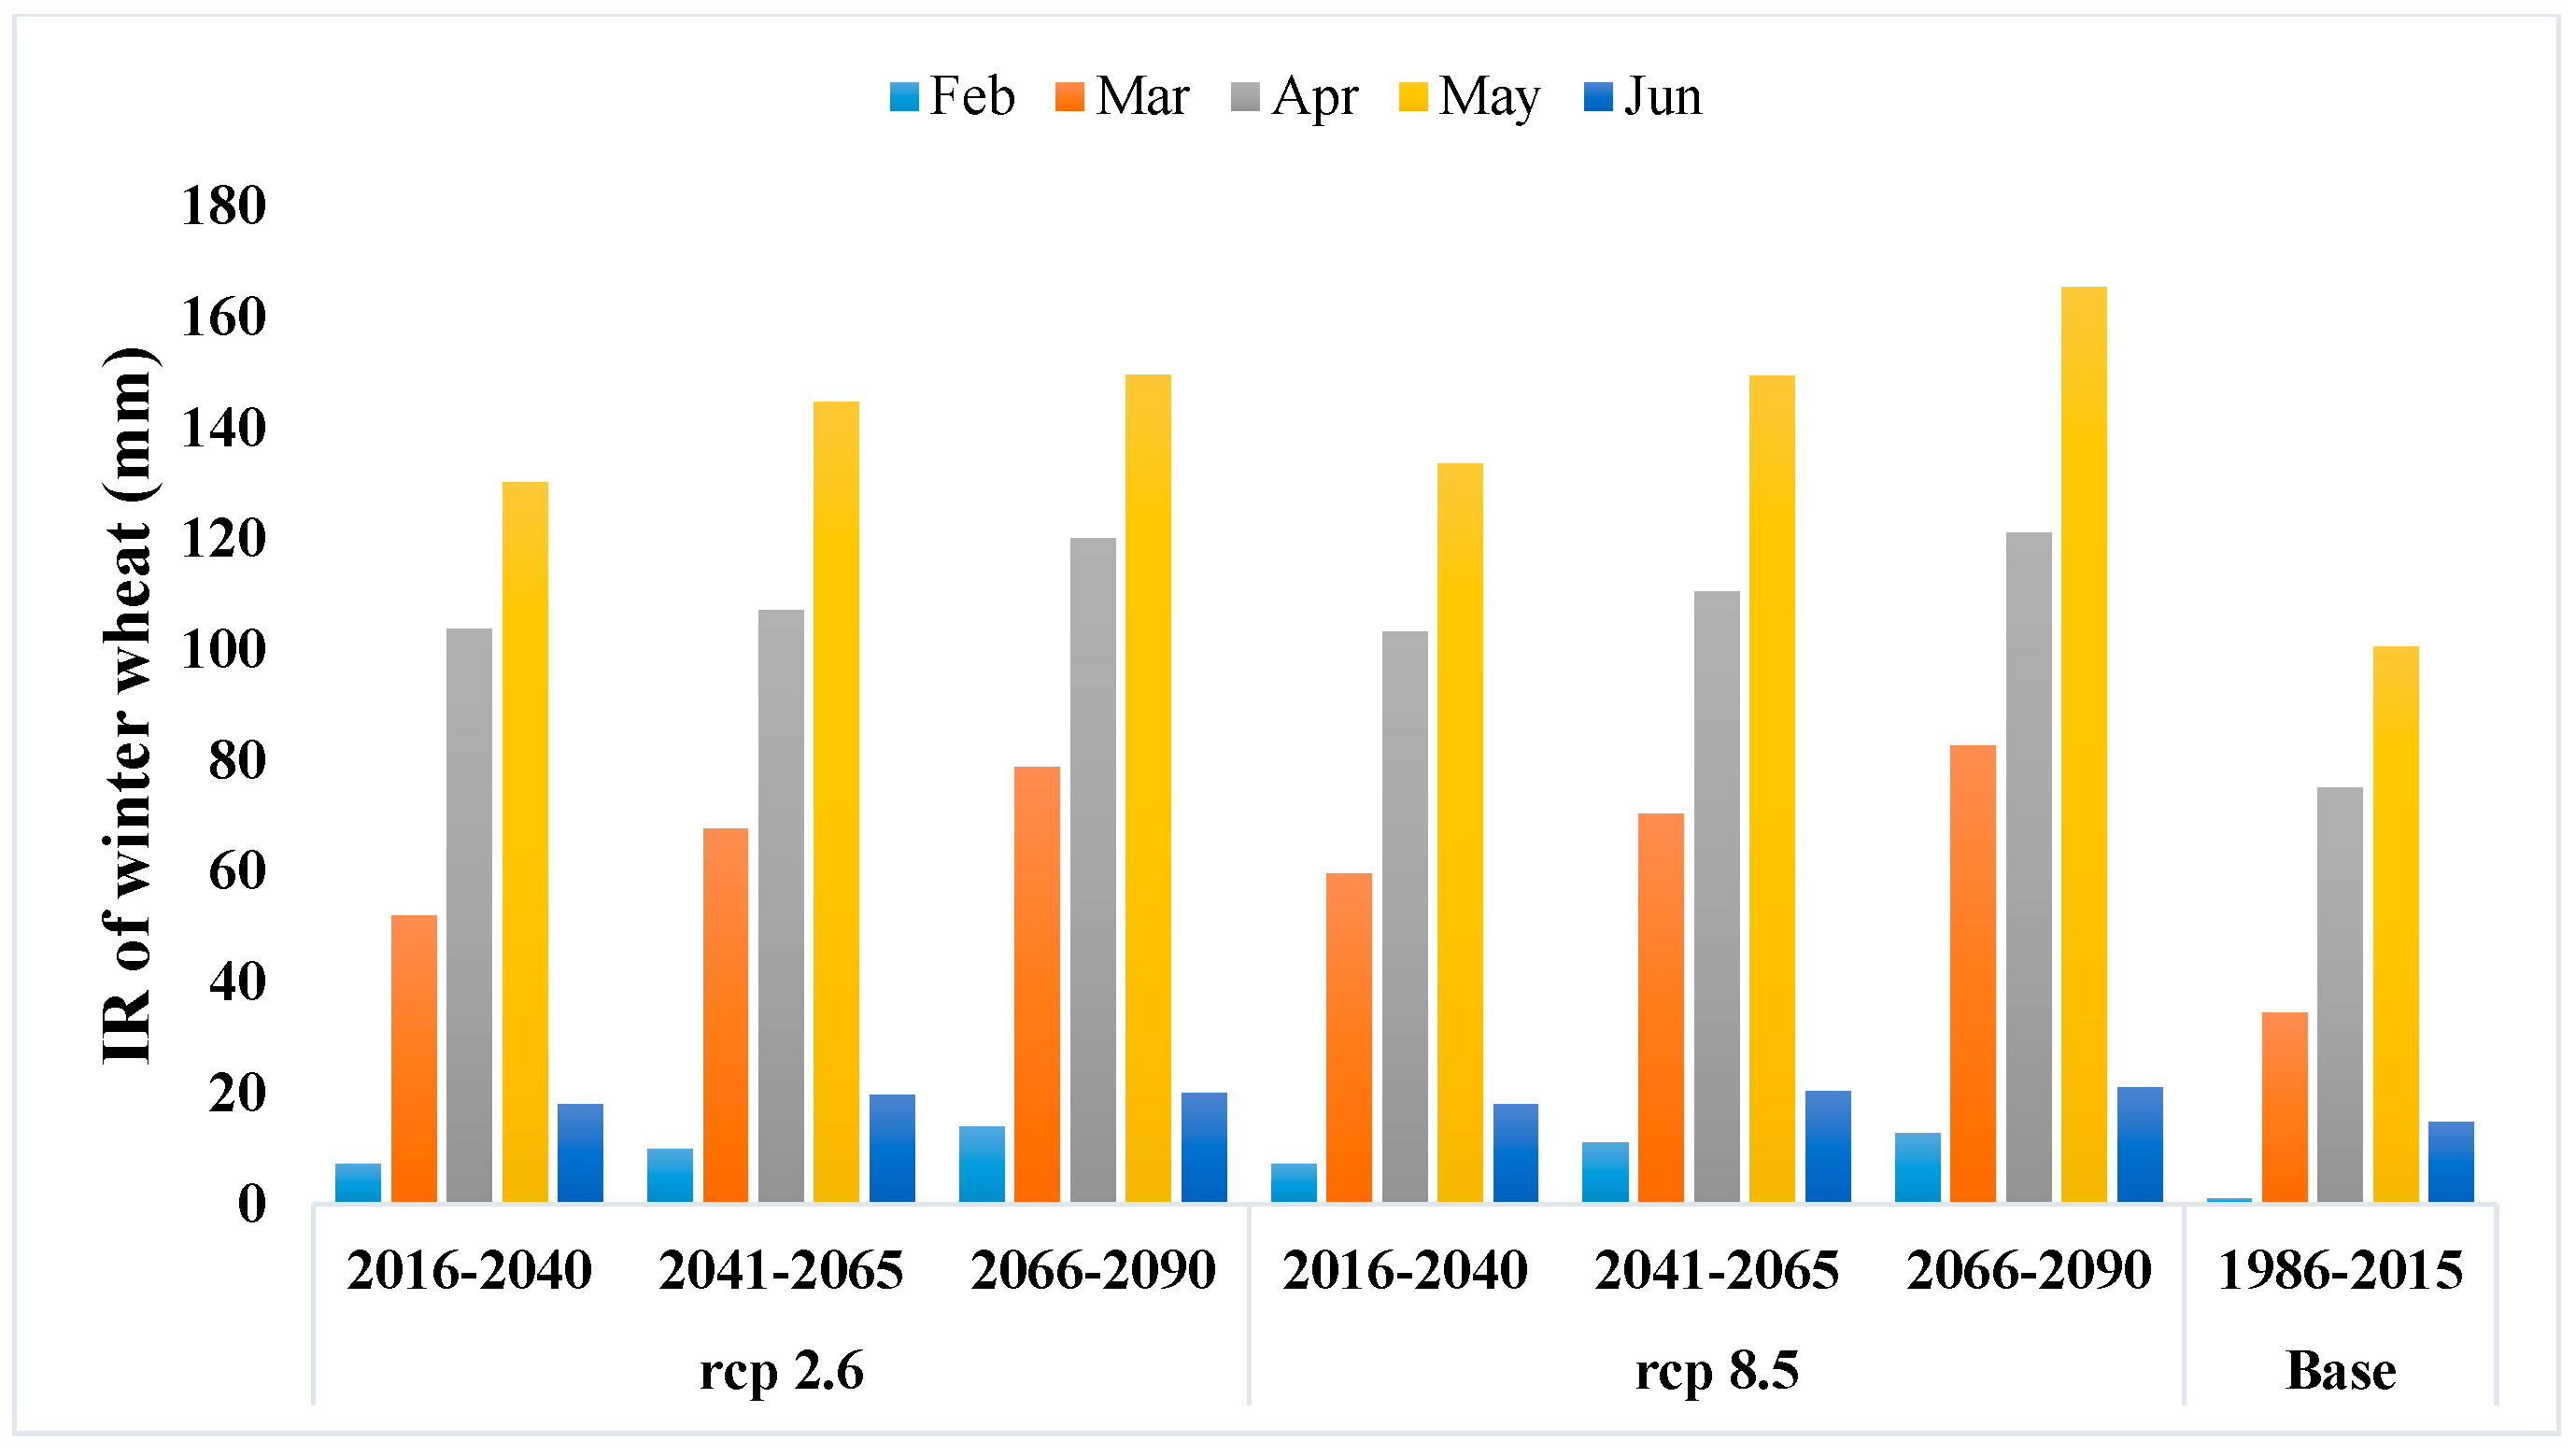
Figure 4.
Comparison of the irrigation water requirement (IR) of winter wheat under scenarios rcp2.6 and rcp8.5 for the periods 2016–2040, 2041–2065, and 2066–2090 with the baseline period.
Figure 4.
Comparison of the irrigation water requirement (IR) of winter wheat under scenarios rcp2.6 and rcp8.5 for the periods 2016–2040, 2041–2065, and 2066–2090 with the baseline period.
Figure 5.
Comparison of the irrigation water requirement (IR) of barley under scenarios rcp2.6 and rcp8.5 for periods 2016–2040, 2041–2065, and 2066–2090 versus the baseline period.
Figure 5.
Comparison of the irrigation water requirement (IR) of barley under scenarios rcp2.6 and rcp8.5 for periods 2016–2040, 2041–2065, and 2066–2090 versus the baseline period.
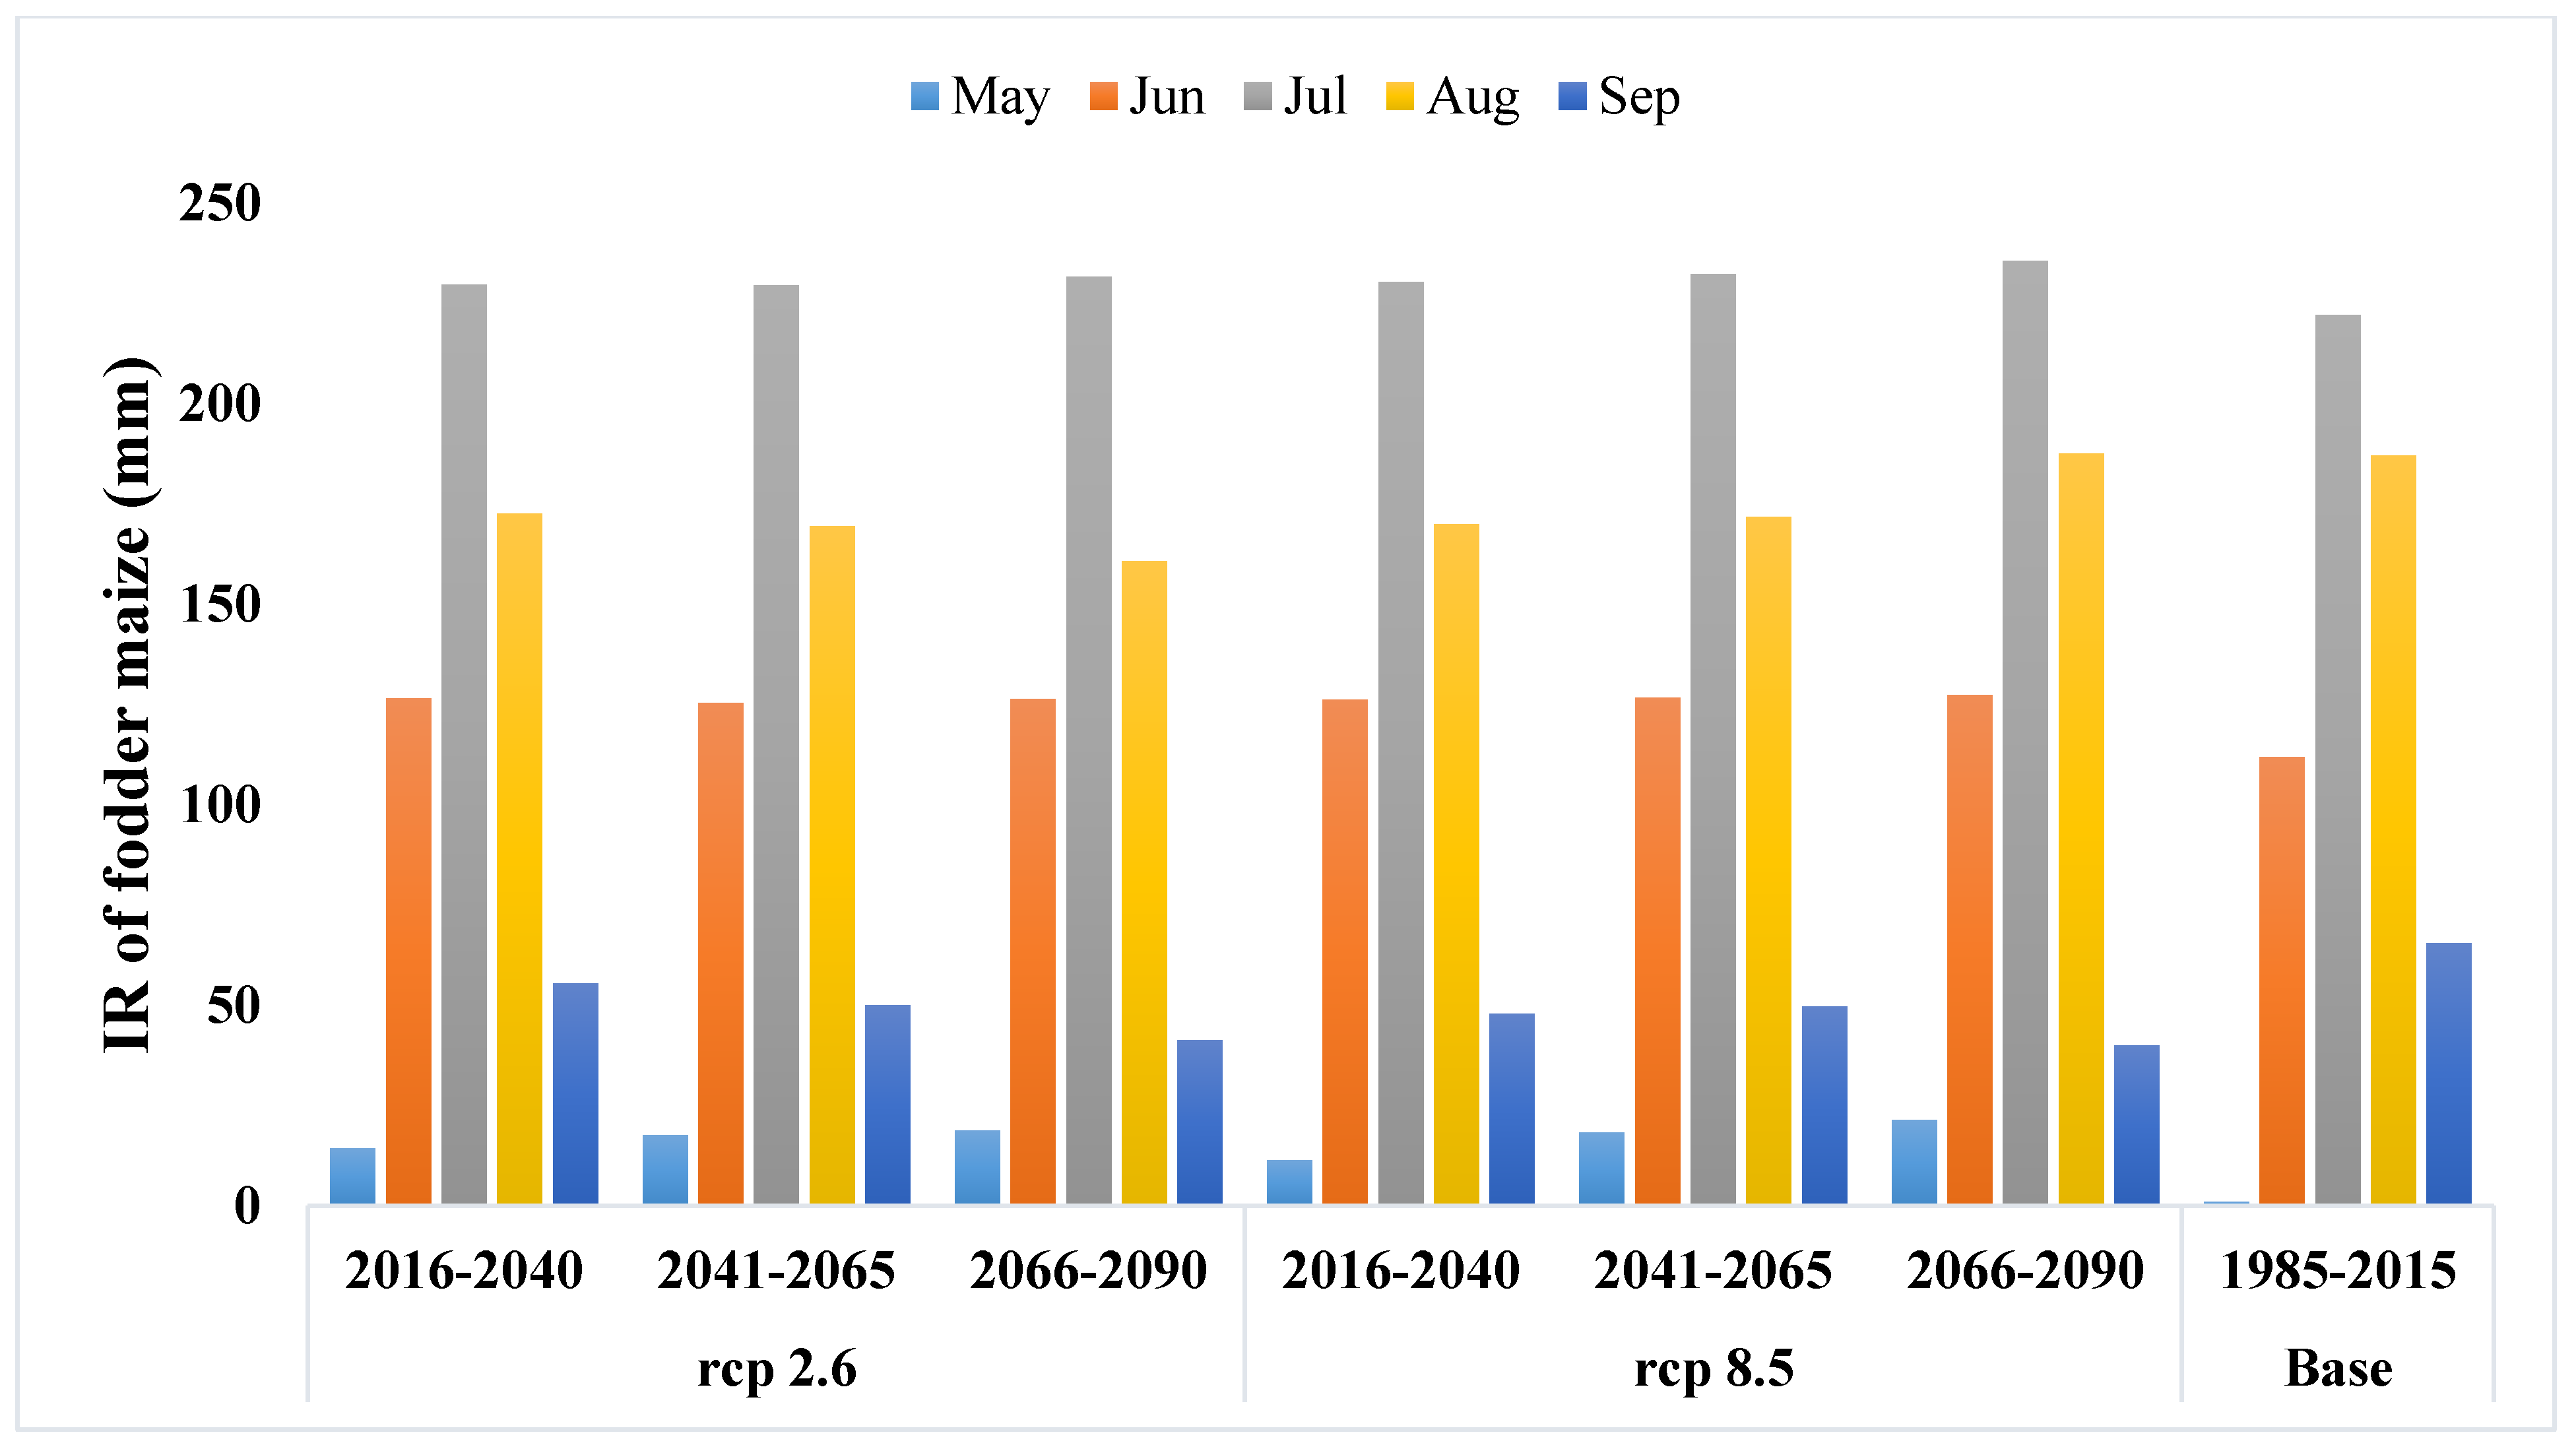
Figure 6.
Comparison of the irrigation water requirement (IR) of fodder maize under scenarios rcp2.6 and rcp8.5 for periods 2016–2040, 2041–2065, and 2066–2090 versus the baseline period.
Figure 6.
Comparison of the irrigation water requirement (IR) of fodder maize under scenarios rcp2.6 and rcp8.5 for periods 2016–2040, 2041–2065, and 2066–2090 versus the baseline period.
Table 1.
Coordinates of the meteorological stations of the study area.
Table 1.
Coordinates of the meteorological stations of the study area.
| Station | Latitude (°N) | Longitude (°E) | Altitude (m) |
|---|
| Qazvin | 36.27 | 49.99 | 1279 |
| Buin-Zahra | 35.77 | 50.06 | 1225 |
| Kohin | 36.37 | 49.66 | 1549 |
| Moalem-Kelaye | 36.45 | 50.48 | 1629 |
| Takestan | 36.07 | 49.70 | 1283 |
| Avaj | 35.57 | 49.22 | 2034 |
Table 2.
Properties of the applied scenarios authorized by the Intergovernmental Panel on Climate Change (IPCC) [
9].
Table 2.
Properties of the applied scenarios authorized by the Intergovernmental Panel on Climate Change (IPCC) [
9].
| Scenario | Properties |
|---|
| rcp2.6 | Radiative forcing will peak at 3 W m−2 and will reach to 2.6 W m−2 by the end of 2100; CO2 accumulation will reach 490 ppm by 2100. |
| rcp4.5 | Radiative forcing will reach 4.5 W m−2 by 2100; CO2 accumulation will reach 650 ppm by 2100 |
| rcp8.5 | Radiative forcing will reach 8.5 W m−2 by 2100; CO2 accumulation will reach 1370 ppm by 2100 |
Table 3.
Crop coefficients, growth period, and duration of growth stages for winter wheat, barley, and fodder maize in the Qazvin Plateau.
Table 3.
Crop coefficients, growth period, and duration of growth stages for winter wheat, barley, and fodder maize in the Qazvin Plateau.
| Crop | Growth Period | Crop Coefficient | Duration of Growth Stages (day) |
|---|
| Initial | Mid | End | Initial | Development | Mid | End | Total |
|---|
| Winter wheat | 13 October–10 June | 0.15 | 1.1 | 0.2 | 20 | 129 | 60 | 31 | 240 |
| Barley | 13 October–10 June | 0.15 | 1.1 | 0.15 | 20 | 139 | 50 | 31 | 240 |
| Fodder maize | 10 May–22 September | 0.15 | 1.15 | 0.5 | 20 | 36 | 45 | 35 | 136 |
Table 4.
Total cultivation area, maximum yield (Ym), and the coefficient of the reaction of crop yield to water stress (Ky) for winter wheat, barley, and fodder maize in the Qazvin Plateau (Najarchi et al., 2011).
Table 4.
Total cultivation area, maximum yield (Ym), and the coefficient of the reaction of crop yield to water stress (Ky) for winter wheat, barley, and fodder maize in the Qazvin Plateau (Najarchi et al., 2011).
| Crop | Total Cultivated Area (ha) | Ym (ton ha−1) | Ky |
|---|
| Winter wheat | 66000 | 6 | 1.2 |
| Barley | 36358 | 4.7 | 1.1 |
| Fodder maize | 28621 | 10 | 1.5 |
Table 5.
Performance of the model in the baseline period (1986–2015) using the statistical error criteria.
Table 5.
Performance of the model in the baseline period (1986–2015) using the statistical error criteria.
| Climatic Variables | Scenarios | R2 | RMSE | MAE | NS |
|---|
| Maximum temperature | rcp2.6 | 0.8580 | 0.0669 | 3.1606 | 0.8556 |
| rcp4.5 | 0.8508 | 0.0686 | 3.2444 | 0.8485 |
| rcp8.5 | 0.8583 | 0.0668 | 3.1721 | 0.8561 |
| Minimum temperature | rcp2.6 | 0.8497 | 0.0523 | 2.4113 | 0.8428 |
| rcp4.5 | 0.8476 | 0.0526 | 2.4291 | 0.8410 |
| rcp8.5 | 0.8456 | 0.0530 | 2.4250 | 0.8386 |
| Precipitation | rcp2.6 | 0.0004 | 0.0486 | 1.2565 | −0.4972 |
| rcp4.5 | 0.0016 | 0.0483 | 1.3081 | −0.4795 |
| rcp8.5 | 0.0018 | 0.0476 | 1.2754 | −0.4321 |
Table 6.
Change values of the irrigation water requirement (IR) of winter wheat under scenarios rcp2.6 and rcp8.5 for periods 2016–2040, 2041–2065, and 2066–2090 versus the baseline period.
Table 6.
Change values of the irrigation water requirement (IR) of winter wheat under scenarios rcp2.6 and rcp8.5 for periods 2016–2040, 2041–2065, and 2066–2090 versus the baseline period.
| Scenario | Periods | Feb | Mar | Apr | May | Jun | Total (%) |
|---|
| rcp2.6 | 2016–2040 vs. observed | 635 | 50.5 | 37.9 | 29.4 | 21.2 | 38 |
| rcp2.6 | 2041–2065 vs. observed | 895 | 96.1 | 42.4 | 43.8 | 32.9 | 55 |
| rcp2.6 | 2066–2090 vs. observed | 1300 | 127.9 | 59.7 | 48.7 | 34.9 | 69 |
| rcp8.5 | 2016–2040 vs. observed | 625 | 72.4 | 37.4 | 32.8 | 20.8 | 42 |
| rcp8.5 | 2041–2065 vs. observed | 1025 | 103.9 | 46.8 | 48.5 | 36.6 | 60 |
| rcp8.5 | 2066–2090 vs. observed | 1180 | 139.3 | 61.1 | 64.4 | 41.6 | 79 |
Table 7.
Change values of the irrigation water requirement (IR) of barley in the periods 2016–2040, 2041–2065, and 2066–2090 and under the scenarios rcp2.6 and rcp8.5 with the baseline period.
Table 7.
Change values of the irrigation water requirement (IR) of barley in the periods 2016–2040, 2041–2065, and 2066–2090 and under the scenarios rcp2.6 and rcp8.5 with the baseline period.
| Scenario | Periods | Feb | Mar | Apr | May | Jun | Total (%) |
|---|
| rcp2.6 | 2016–2040 vs. observed | 385 | 53.3 | 38.1 | 31 | 22.7 | 38 |
| rcp2.6 | 2041–2065 vs. observed | 645 | 101.3 | 42.5 | 46 | 35 | 55 |
| rcp2.6 | 2066–2090 vs. observed | 1035 | 135.1 | 60 | 50.6 | 36.9 | 70 |
| rcp8.5 | 2016–2040 vs. observed | 385 | 77.8 | 37.4 | 34.1 | 22.3 | 43 |
| rcp8.5 | 2041–2065 vs. observed | 770 | 109.9 | 47.2 | 50.7 | 39.1 | 61 |
| rcp8.5 | 2066–2090 vs. observed | 915 | 146.9 | 61.1 | 66.7 | 43.6 | 79 |
Table 8.
Change values of the irrigation water requirement (IR) of fodder maize under scenarios rcp2.6 and rcp8.5 for periods 2016–2040, 2041–2065, and 2066–2090 versus the baseline period.
Table 8.
Change values of the irrigation water requirement (IR) of fodder maize under scenarios rcp2.6 and rcp8.5 for periods 2016–2040, 2041–2065, and 2066–2090 versus the baseline period.
| Scenario | Periods | May | Jun | Jul | Aug | Sep | Total (%) |
|---|
| rcp2.6 | 2016–2040 vs. observed | 1335 | 13.1 | 3.4 | −7.7 | −15.3 | 1.8 |
| rcp2.6 | 2041–2065 vs. observed | 1665 | 12 | 3.3 | −9.3 | −23.5 | 0.7 |
| rcp2.6 | 2066–2090 vs. observed | 1780 | 12.9 | 4.3 | −14 | −36.8 | −1.4 |
| rcp8.5 | 2016–2040 vs. observed | 1043 | 12.9 | 3.7 | −9.1 | −27 | −0.2 |
| rcp8.5 | 2041–2065 vs. observed | 1728.5 | 13.2 | 4.6 | −8.1 | −24.2 | 1.9 |
| rcp8.5 | 2066–2090 vs. observed | 2041 | 13.8 | 6 | −0.2 | −39 | 4.1 |
Table 9.
Results of the change percentage of the crops under scenarios rcp2.6 and rcp8.5 in periods 2016–2040, 2041–2065, and 2066–2090 versus the baseline period in the Qazvin Plateau.
Table 9.
Results of the change percentage of the crops under scenarios rcp2.6 and rcp8.5 in periods 2016–2040, 2041–2065, and 2066–2090 versus the baseline period in the Qazvin Plateau.
| Scenario | | Winter Wheat | Barley | Fodder Maize |
|---|
| rcp2.6 | %(2016–2040) vs. obs | −58.24 | −48.48 | −3.20 |
| %(2041–2065) vs. obs | −75.10 | −65.78 | −1.47 |
| %(2066–2090) vs. obs | −89.86 | −80.72 | 1.99 |
| rcp8.5 | %(2016–2040) vs. obs | −62.86 | −53.21 | 0.18 |
| %(2041–2065) vs. obs | −80.69 | −71.57 | −3.22 |
| %(2066–2090) vs. obs | −99.02 | −89.92 | −6.70 |
Table 10.
Results of the actual yield of the crops under scenarios rcp2.6 and rcp8.5 for periods 2016–2040, 2041–2065, and 2066–2090 in the Qazvin Plateau.
Table 10.
Results of the actual yield of the crops under scenarios rcp2.6 and rcp8.5 for periods 2016–2040, 2041–2065, and 2066–2090 in the Qazvin Plateau.
| Scenario | | Winter Wheat (ton ha−1) | Barley (ton ha−1) | Fodder Maize (ton ha−1) |
|---|
| rcp2.6 | (2016–2040) | 2.51 | 2.42 | 9.68 |
| (2041–2065) | 1.49 | 1.61 | 9.85 |
| (2066–2090) | 0.61 | 0.91 | 10.20 |
| rcp8.5 | (2016–2040) | 2.23 | 2.20 | 10.02 |
| (2041–2065) | 1.16 | 1.34 | 9.68 |
| (2066–2090) | 0.06 | 0.47 | 9.33 |
Table 11.
Results of the total yield of the crops under the scenarios rcp2.6 and rcp8.5 for the periods 2016–2040, 2041–2065, and 2066–2090 versus the observed period in the Qazvin Plateau.
Table 11.
Results of the total yield of the crops under the scenarios rcp2.6 and rcp8.5 for the periods 2016–2040, 2041–2065, and 2066–2090 versus the observed period in the Qazvin Plateau.
| Scenario | | Winter Wheat (ton) | Barley (ton) | Maize (grass) (ton) |
|---|
| Observed | 2011 | 396,000 | 170,883 | 286,210 |
| rcp2.6 | (2016–2040) | 165,364 | 88,043 | 277,059 |
| (2041–2065) | 98,592 | 58,468 | 282,012 |
| (2066–2090) | 40,168 | 32,941 | 291,919 |
| rcp8.5 | (2016–2040) | 147,089 | 79,949 | 286,735 |
| (2041–2065) | 76,453 | 48,584 | 277,006 |
| (2066–2090) | 3883 | 17,220 | 267,046 |


