Abstract
We investigated the evolution of serum klotho (s-Kl) and FGF-23 during the first two years post-kidney transplantation (KT), considering the cold ischemia time (CIT), glomerular filtration rate (GFR) and graft subclinical inflammation (SCI). We undertook a prospective, cohort, multicenter study of consecutive patients between April 2018 and January 2021 (with follow-up at 24 months). Subgroups were analyzed according to the median CIT (<14 vs. ≥14 h), the median GFR (≤40 vs. >40 mL/min/1.73 m2) and the presence of SCI at month 3. A total of 147 patients were included. s-Kl and fibroblast growth factor-23 (FGF-23) levels were measured at baseline and at months 3, 12 and 24. Graft biopsies (n = 96) were performed at month 3. All patients had low s-Kl levels at month 3. Patients with CIT < 14 h exhibited a significant increase in s-Kl at month 24. In patients with CIT ≥ 14 h, s-Kl at month 3 fell and lower s-Kl levels were seen at month 24. Patients with a GFR > 40 had a lesser decrease in s-Kl at month 3. FGF-23 fell significantly at months 3 and 12 in both GFR groups, a reduction maintained during follow-up. There were significant inter-group differences in s-Kl from months 3 to 24. CIT, GFR at 3 months and SCI were significantly associated with s-KI at month 3. A reduction in s-Kl at month 3 post-KT could be explained by longer CIT and delayed graft function as well as by impaired graft function. Early SCI may regulate s-Kl increase post-KT.
1. Introduction
Abnormal mineral bone metabolism is universal in patients with chronic kidney disease (CKD). Serum klotho (s-Kl), resulting from the cleavage of membrane-bound klotho, is significantly reduced in CKD patients because the kidneys are the major source of klotho, the co-receptor of the phosphaturic hormone fibroblast growth factor-23 (FGF-23). s-Kl has extra-renal effects beyond mineral metabolism, including antioxidative and antifibrotic properties [1].
Kidney transplantation (KT) partially restores CKD-associated disorders. Indeed, the serum concentration of s-Kl increases significantly at 4–13 months after KT and FGF-23 is reduced after KT [2,3]. However, a sustained rise in s-Kl levels has not been conclusively proven post-KT, and there is a paucity of data assessing time-dependent changes of s-KI and FGF-23 beyond the first year after KT. In addition, information is lacking regarding the association of s-Kl and FGF-23 with clinical parameters inherent to KT, such as allograft function or cold ischemia time (CIT).
Early graft subclinical inflammation (SCI) is very prevalent post-KT, even with proper immunosuppression in low-immunological risk KT recipients. Klotho expression may be regulated by inflammatory cytokines [4] and s-Kl has been reported as an anti-inflammatory molecule [5,6]. However, there is a lack of information about the relationship between early SCI and s-Kl levels when protocol biopsies (PB) are routinely performed in these patients.
To our knowledge, only a few prospective studies have evaluated the changes in s-Kl and FGF-23 levels during the first year post-KT and no longitudinal studies beyond the first 12 months have assessed the relationship between these molecules and renal graft function [7,8,9]. We hypothesized that a more prolonged CIT, an impaired graft function or the presence of SCI could modify s-Kl and FGF-23 levels following KT.
The aim of this longitudinal study was to assess s-Kl and FGF-23 levels in incident deceased-donor KT patients during the first two years post-KT and to determine their relationship with CIT and allograft function.
2. Materials and Methods
2.1. Study Design
This was a prospective, cohort, multicenter study of consecutive patients, conducted between April 2018 and January 2021 in the Nephrology Department of the Regional University Hospital of Málaga. Patients of both sexes over 18 years of age who signed the informed consent for participation in the study were included. Those who received a double transplant (renal–pancreatic) were excluded. All patients were followed up for 24 months.
The study was undertaken in accordance with the standards of good clinical practice and the ethical concepts of the Declaration of Helsinki.
2.2. Data Collection
The clinical data were acquired by staff after reviewing the medical history. Graft function was estimated by the 2009 creatinine-based CKD-EPI formulae for estimated glomerular filtration rate (eGFR). The following analytical parameters were collected pre-KT and 3, 12 and 24 months post-KT: glycemia, HbA1c, total cholesterol, high-density lipoprotein (HDL) cholesterol, low-density lipoprotein (LDL) cholesterol, triglycerides, calcium, phosphate, fractional excretion phosphorus, parathyroid hormone and proteinuria. Other molecules, tumor necrosis factor (TNF) and tumor necrosis factor-like weak inducer of apoptosis (TWEAK) levels were also determined following the manufacturer’s instructions. Other data collected included cold ischemia time, acute rejection, induction therapy, delayed graft function (DGF), end-stage renal disease, post-transplantation diabetes mellitus, panel-reactive antibodies, donor and recipient ages, expanded criteria donor, gender, hemodialysis, body mass index, cardiovascular disease and immunosuppressants by intention to treat.
2.3. Measurements of Serum Klotho and FGF-23
Levels were measured just before KT and at 3, 12 and 24 months post-KT. Blood samples were collected, processed and frozen at −80 °C within 2 h of extraction. s-Kl levels were determined at the Nephrology and Hypertension Laboratory of the IIS-Fundación Jiménez Díaz (Madrid, Spain) using a specific ELISA kit for serum human klotho (ELISA, Immuno-Biological Labs, Fujioka-Shi, Japan) following the manufacturer’s instructions. The coefficient of variability (%CV) was 2.7–6.5% and the limit of detection was 6.15 pg/mL. Serum levels of FGF-23 were determined at the Immunology Laboratory of the Biometric Research Institute of Málaga, Regional University Hospital of Málaga, using a specific ELISA kit (ELISA, Kainos Laboratories, Tokyo, Japan) following the manufacturer’s instructions. This assay had an inter- and intra-assay coefficient of variation of 2.1 to 3.8% and 2.0 to 3.0%, respectively, and a low limit of detection of 3 pg/mL.
2.4. Histological Data
Protocol biopsies were performed at 3 months post-transplant in 97 KT recipients as an outpatient procedure and were carried out under ultrasound guidance using an 18 G spring-loaded biopsy needle. At least one core of tissue with a minimum of seven glomeruli and one artery were required for proper interpretation. Graft SCI included either the presence of borderline lesions defined as an interstitial inflammation score (i) and/or tubulitis score (t) of at least 1, but below the threshold for Banff 1A rejection (Banff i2, t2) [10], or a higher degree of graft inflammation according to the 2019 Banff classification [11]. Neither isolated inflammation (i1, t0) nor tubulitis (i0, t1) were included as SCI. Additionally, the chronic allograft histology score was obtained using a composite of chronic interstitial (ci), chronic tubular (ct), chronic glomerular (cg) plus chronic vascular (cv) (ci + ct + cg + cv), as well as using a composite of interstitial fibrosis and tubular atrophy (IFTA) score (ct + ci). IFTA was defined as the sum of ci + ct ≥ 2 [12,13]. Experienced transplant pathologists interpreted all biopsies and inflammatory and chronicity scores were all validated by a single pathologist (ML).
2.5. Statistical Analysis
A descriptive analysis of the results was undertaken, expressing the quantitative variables as the mean ± standard deviation for parametric data or median and interquartile range (IQR) for non-parametric data. Categorical variables were expressed as numbers and percentages. For univariate comparisons of numerical variables, the t-test and chi-square test were used. Correlations between biochemical parameters (s-Kl, FGF-23 and GFR) were performed by univariate regression. We performed multivariate linear regression analysis of factors associated with s-Kl at three months post-transplant. A repeated-measures ANOVA model was used to evaluate pre- and post-KT differences in the s-Kl levels and FGF-23 levels over time.
Statistical analysis was performed with SPSS Statistics V26.0 for Windows (IBM Corp., Armonk, NY, USA) and the significance was set at p < 0.05.
3. Results
We included 147 recipients who received a KT from April 2018 to January 2021. Most patients received either basiliximab (n = 51) or thymoglobulin (n = 73) as induction therapy; maintenance immunosuppression consisted of steroids, calcineurin inhibitors and mycophenolate mofetil (Table 1). DGF was defined as the need for dialysis during the first week after KT.

Table 1.
Baseline clinical data.
Overall, a non-significant numerical reduction in s-Kl levels at month 3 was observed in the whole cohort. Thereafter, KT recipients were divided into subgroups according to the median CIT (≤14 vs. >14 h) and the median GFR at month 3 post-KT (≤40 vs. >40 mL/min/1.73 m2). No significant differences were found between CIT or eGFR groups at month 3 in s-Kl or FGF-23 levels, but a higher phosphaturia level was seen in patients with GFR > 40 mL/min/1.73 m2, as expected (Table 2 and Table 3). Finally, a significant correlation between GFR and FGF-23 was observed at months 3 (r = −0.263; p = 0.05) and 24 (r = −0.431; p = 0.001). Likewise, there was a significant correlation between GFR and s-Kl at month 24 (r = 0.260; p = 0.011).
Table 2.
Characteristics of recipients at month 3 post-kidney transplantation according to the cold ischemia time <14 vs. ≥14 h.
Table 3.
Characteristics of recipients at month 3 post-kidney transplantation according to the allograft function (GFR in mL/min/1.73 m2).
Patients with CIT < 14 h were less likely to have DGF than those with CIT ≥ 14 h (24.3% vs. 47.1%, respectively; p = 0.004) and exhibited a significant increase over time in s-Kl at month 24. In patients with CIT ≥ 14 h, s-Kl at month 3 fell when compared to pre-KT values (Figure 1A). Among patients with CIT ≥ 14 h, s-Kl levels below median values (324 pg/mL, interquartile range 182–496 pg/mL) were more common than s-Kl levels above s-Kl median levels (63.9 vs. 36.1%, respectively; p = 0.029).
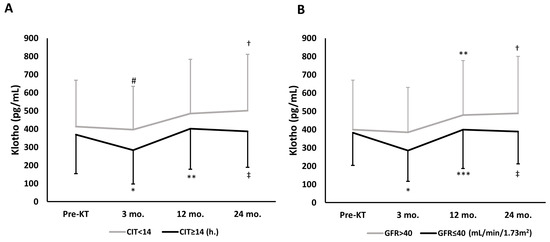
Figure 1.
Overall time-dependent changes of s-Kl during follow-up, assessed by repeated-measures ANOVA model, according to CIT or GFR at month 3. (A) According to CIT < 14 h; p = 0.009, and CIT ≥ 14 h; p < 0.001. Intragroup comparisons * p = 0.023 vs. pre-KT; ** p < 0.001 vs. 3 mo.; † p = 0.028 vs. 3 mo.; ‡ p = 0.001 vs. 3 mo. Intergroup comparisons (CIT < 14 vs. ≥14 h): # p = 0.052 vs. 3 mo. CIT ≥ 14 h. group. (B) According to GFR values at month 3. GFR > 40 mL/min/1.73 m2; p = 0.002, and GFR ≤ 40 mL/min/1.73 m2; p < 0.001. Intragroup comparisons: * p = 0.006 vs. pre-KT; ** p = 0.019 vs. 3 mo.; *** p = 0.001 vs. 3 mo.; † p = 0.001 vs. 3 mo.; ‡ p = 0.008 vs. 3 mo. Abbreviations: CIT, cold ischemia time; GFR, glomerular filtration rate; KT, kidney transplant; s-Kl, serum klotho levels.
In patients with a GFR ≤ 40 mL/min/1.73 m2 at month 3, s-Kl at month 3 fell when compared to pre-KT values. Interestingly, in patients with better graft function at month 3, s-Kl levels increased significantly and progressively at months 12 and 24, whereas in patients with a lower GFR, s-Kl levels increased at month 12, but no further at month 24 (Figure 1B).
Figure 2 displays the time-dependent changes of FGF-23 during follow-up. FGF-23 fell significantly at month 3 regardless of CIT, with levels remaining unchanged during follow-up (Figure 2A), while FGF-23 dropped significantly at months 3 and 12 in both GFR groups, though there were significant differences between the groups from months 3 to 24, and this reduction was maintained in all patients during follow-up (Figure 2B).
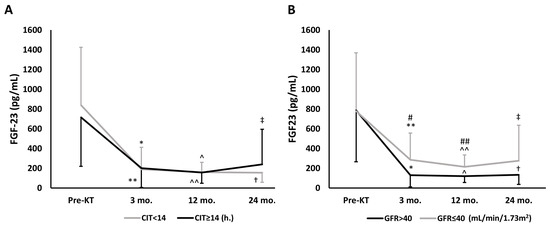
Figure 2.
Overall time-dependent changes of FGF-23 during follow-up, assessed by repeated-measures ANOVA model, according to CIT or GFR. (A) According to CIT. CIT < 14 h; p = 0.009, and CIT ≥ 14 h.; p < 0.001. Intragroup comparisons: * p < 0.001 vs. Pre-KT; ** p < 0.001 vs. Pre-KT; ^ p < 0.001 vs. Pre-KT; ^^ p < 0.001 vs. Pre-KT; † p < 0.001 vs. Pre-KT; ‡ p < 0.001 vs. Pre-KT. (B) According to GFR. GFR > 40 mL/min/1.73 m2; p < 0.001, and GFR ≤ 40 mL/min/1.73 m2; p < 0.001. Intragroup comparisons: * p < 0.001 vs. Pre-KT; ** p < 0.001 vs. Pre-KT; ^ p < 0.001 vs Pre-KT; ^^ p < 0.001 vs. Pre-KT; † p < 0.001 vs. Pre-KT; ‡ p = 0.002 vs. Pre-KT. Intergroup comparisons (GFR > 40 vs. GFR ≤ 40 mL/min/1.73 m2): # p = 0.018 vs. 3 mo.; ## p = 0.003 vs. 12 mo. Abbreviations: CIT, cold ischemia time; FGF-23, fibroblast growth factor-23; GFR, glomerular filtration rate; KT, kidney transplant.
Table 4 displays histological findings in protocol biopsies. Only 32 KT patients showed no SCI and borderline lesions were observed in 47.4% of the KT recipients. The other patients showed a higher degree of SCI. As expected, SCI patients presented significantly higher inflammation scores than KT recipients without inflammation despite similar tacrolimus levels in both groups. There were no statistically significant differences in s-Kl levels between SCI groups.
Table 4.
Banff scores in the baseline protocol biopsy at 3 months post-transplant.
Finally, CIT, baseline s-Kl and GFR and SCI at month 3 correlated with s-Kl at month 3 in the multiple linear regression analysis after adjusting for confounders (Table 5). When SCI was substituted by the presence of a relevant interstitial inflammation score (i ≥ 1) or tubulitis score (t ≥ 1), again a significantly positive correlation with s-Kl at month 3 was observed in the linear regression analysis adjusted for variable confounders (i ≥ 1, Beta = 81.790; 18.834–144.746 95% CI; p = 0.012 and t ≥ 1, Beta = 90.601; 31.746–149.457 95% CI; p = 0.003).
Table 5.
Multivariate linear regression analysis of factors associated with s-Kl at three months post-transplant.
4. Discussion
This study evaluated the time-dependent changes in biomarkers such as s-Kl and FGF-23 levels following KT. To our knowledge, this is the first prospective observational cohort study conducted in deceased-donor KT patients to determine changes in s-Kl and FGF-23 levels over the first two years post-KT and to assess their relationship with CIT, allograft function and SCI.
As hypothesized, s-Kl increased following KT, although notably only after month 3 post-KT. The s-Kl levels showed an initial reduction in the early post-KT period (month 3), which was significant in patients with lower GFR or longer CIT, followed by a gradual increase at 12 and 24 months post-KT, which was more pronounced in patients with better graft function or a shorter CIT. The explanation for this is likely multifactorial. Klotho is expressed mostly in distal renal tubules. Graft ischemia–reperfusion injury (IRI) downregulates klotho expression, which might be magnified by immunosuppressive load [7,14,15]. Thus, a transient decrease in s-Kl during the first three months is likely, as seen in our study. The fact that a higher proportion of DGF was observed in the CIT ≥ 14 h group and that CIT correlated with s-Kl levels during follow-up supports this argument.
Because most s-Kl is produced by the kidneys and correlations between GFR and s-Kl have already been documented, an increase in s-Kl levels after month 3 was not unexpected. In fact, s-Kl levels were numerically higher in the GFR > 40 mL/min/1.73 m2 group during follow-up as compared with those with a more reduced renal function. This is consistent with other observational studies and suggests that graft function could be a determinant for recovering circulating s-Kl levels after KT, although levels are still lower than in age-matched healthy controls. Two principal factors could be involved in s-Kl levels recovering after month 3: firstly, the restoration of klotho expression in the transplanted graft post-IRI, plus reduction of the immunosuppressive load; secondly, the increased production of s-Kl by the native non-functioning kidney and/or other extra-renal organs, which may occur during the improvement of graft function. Uremic substances decrease klotho expression through DNA methylation [16]. Thus, improvement in uremia after KT may lead to increased s-Kl production in the native kidney and other klotho-expressing organs. Alternatively, a higher phosphaturia level might induce tubular damage leading to lower klotho expression, as reported by [17]. Indeed, a significantly higher phosphaturia level was observed in the GFR ≤ 40 group due possibly to increased FGF-23 levels. The fact that a better graft function was associated with a higher recovery of s-Kl supports the hypothesis that the post-transplant s-Kl increase could be the result of a combination of a proper renal function after recovering from IRI plus improved klotho expression by the native kidney. Whether this can prolong long-term graft survival is currently undetermined.
Overall, FGF-23 levels declined at month 3 as graft function improved, independently of CIT, and remained reduced throughout the follow-up, as reported by [7]. Nevertheless, a more important drop in FGF-23 levels was evidenced in patients with better graft function. In fact, GFR correlated with FGF-23 levels at months 3 and 24. FGF-23 autoregulates its effect by inhibiting the expression of α-klotho. Thus, increased klotho expression would be expected after the fall in FGF-23 levels at month 3. Interestingly, s-Kl declined in this post-KT period. We speculate that IRI could lead to a state of acute reversible klotho deficiency during the first three months post-KT, even when FGF-23 levels decrease, regardless of CIT. Besides IRI, further risk factors for tubular damage, such as increased phosphaturia, may affect FGF-23 and klotho expression in distal tubules, as reported by [17]. In this line, hypophosphatemia was pronounced in our patients during the first three months after KT, possibly due to inadequate phosphaturia levels over this period from increased pre-KT FGF-23 levels. Indeed, a numerically higher phosphaturia level was observed in our patients with CIT ≥ 14 h. Longitudinal studies are needed to elucidate this concern.
SCI, including borderline lesions and a higher grade of graft inflammation, is very common post-transplantation (≈40–50%) when protocol biopsies are routinely used, even under proper immunosuppression [18,19]. Our results showed a significant positive association between SCI and s-Kl at month 3 post-KT in the multivariate regression analysis. A priori, this result represented a paradox because local and systemic inflammation may downregulate klotho expression through a NFκB-dependent mechanism [4]. However, it is plausible that the positive correlation found between SCI and s-Kl at month 3 post-KT may be an early compensatory response to graft inflammation and that s-Kl would act as an anti-inflammatory molecule. The fact that s-Kl is found to be remarkably high in major inflammatory diseases such as rheumatoid arthritis [20], alcoholism-associated inflammation [21] and sepsis [22] supports this argument. Thus, individual cytokines in the inflammatory environment (e.g., proinflammatory cytokines such as TNF-α) might exert a dual effect on soluble klotho, decreasing the transcription of the transmembrane molecule but increasing the shedding of soluble klotho by augmenting ADAM expression, a secretase that promotes the shedding of the soluble protein klotho [23,24]. Further studies assessing klotho expression in graft tissue samples obtained from protocol biopsies could help to address this hypothesis.
In conclusion, a reduction in s-Kl at month 3 post-KT could be explained by a longer CIT and delayed graft function as well as by impaired graft function. Given the potential negative effect of s-Kl deficiency on accelerated senescence and both graft and patient survival, efforts should be made to decrease CIT, optimize graft function and minimize SCI in the KT population.
Author Contributions
D.H. and T.V.-S. participated in research design, performance of the study, data analysis and writing of the paper. M.D.S.-N., P.R.-E. and V.L. participated in the performance of the study, data collection and data analysis. A.C., J.F.R.-E. and M.L., participated in the performance of the research and contributed analytical tools. A.T., A.O. and M.R. critically reviewed the manuscript and participated in data analysis. All authors contributed to the writing of the paper and approved the final version of the manuscript.
Funding
This study was funded by grants from the Instituto de Salud Carlos III, Madrid, Spain (PI17/02043; ICI21/00042; PI21/00251; REDinREN Network, RD16/0009/0006; RD16/0009/0031; RICORS2040 Network, RD21/0005/0012, RD21/0005/0008 and RD21/0005/0001), FEDER funds. MDSN was supported by MICINN Ramon y Cajal program RYC2018-024461-I.
Institutional Review Board Statement
The study was conducted according to the guidelines of the Declaration of Helsinki and approved by the Provincial Ethics and Clinical Research Committee of Málaga (CEI Provincial de Málaga) (Protocol Code:11/2017/PI13 and date of approval: 28 November 2017).
Informed Consent Statement
Informed consent was obtained from all subjects involved in the study.
Data Availability Statement
The data presented in this study are available on request from the corresponding author. In compliance with Spanish Organic Law 15/1999, the data are not publicly available.
Acknowledgments
We are grateful to the kidney transplant teams of the hospitals involved in the study and thank Ian Johnstone for help with English language editing.
Conflicts of Interest
The authors declare no conflict of interest.
References
- Hu, M.C.; Shi, M.; Zhang, J.; Addo, T.; Cho, H.J.; Barker, S.L.; Ravikumar, P.; Gillings, N.; Bian, A.; Sidhu, S.S.; et al. Renal Production, Uptake, and Handling of Circulating αKlotho. J. Am. Soc. Nephrol. 2016, 27, 79–90. [Google Scholar] [CrossRef] [PubMed]
- Thongprayoon, C.; Neyra, J.A.; Hansrivijit, P.; Medaura, J.; Leeaphorn, N.; Davis, P.W.; Kaewput, W.; Bathini, T.; Salim, S.A.; Chewcharat, A.; et al. Serum Klotho in Living Kidney Donors and Kidney Transplant Recipients: A Meta-Analysis. J. Clin. Med. 2020, 9, 1834. [Google Scholar] [CrossRef] [PubMed]
- Gupta, M.; Orozco, G.; Rao, M.; Gedaly, R.; Malluche, H.H.; Neyra, J.A. The Role of Alterations in Alpha-Klotho and FGF-23 in Kidney Transplantation and Kidney Donation. Front. Med. 2022, 9, 803016. [Google Scholar] [CrossRef] [PubMed]
- Moreno, J.A.; Izquierdo, M.C.; Sanchez-Niño, M.D.; Suárez-Alvarez, B.; Lopez-Larrea, C.; Jakubowski, A.; Blanco, J.; Ramirez, R.; Selgas, R.; Ruiz-Ortega, M.; et al. The inflammatory cytokines TWEAK and TNFα reduce renal klotho expression through NFκB. J. Am. Soc. Nephrol. 2011, 22, 1315–1325. [Google Scholar] [CrossRef] [PubMed]
- Nakanishi, K.; Nishida, M.; Harada, M.; Ohama, T.; Kawada, N.; Murakami, M.; Moriyama, T.; Yamauchi-Takihara, K. Klotho-related Molecules Upregulated by Smoking Habit in Apparently Healthy Men: A Cross-sectional Study. Sci. Rep. 2015, 5, 14230. [Google Scholar] [CrossRef]
- Maekawa, Y.; Ishikawa, K.; Yasuda, O.; Oguro, R.; Hanasaki, H.; Kida, I.; Takemura, Y.; Ohishi, M.; Katsuya, T.; Rakugi, H. Klotho suppresses TNF-alpha-induced expression of adhesion molecules in the endothelium and attenuates NF-kappaB activation. Endocrine 2009, 35, 341–346. [Google Scholar] [CrossRef]
- Tan, S.J.; Crosthwaite, A.; Langsford, D.; Obeysekere, V.; Ierino, F.L.; Roberts, M.A.; Hughes, P.D.; Hewitson, T.D.; Dwyer, K.M.; Toussaint, N.D. Mineral adaptations following kidney transplantation. Transpl. Int. 2017, 30, 463–473. [Google Scholar] [CrossRef]
- Ishida, H.; Nakamura, M.; Komaba, H.; Uehara, S.; Takiguchi, S.; Fukagawa, M. Post-kidney transplant soluble Klotho levels are determined by pretransplant soluble Klotho levels in both living donors and recipients. Clin. Exp. Nephrol. 2021, 25, 1367–1374. [Google Scholar] [CrossRef]
- Ferreira, A.C.; Mendes, M.; Silva, C.; Cotovio, P.; Aires, I.; Navarro, D.; Caeiro, F.; Ramos, R.; Salvador, R.; Correia, B.; et al. Improvement of Mineral and Bone Disorders After Renal Transplantation. Transplantation 2022, 106, e251–e261. [Google Scholar] [CrossRef]
- Kozakowski, N.; Herkner, H.; Eskandary, F.; Eder, M.; Winnicki, W.; Kläger, J.; Bond, G.; Kikic, Ž. An integrative approach for the assessment of peritubular capillaritis extent and score in low-grade microvascular inflammation-associations with transplant glomerulopathy and graft loss. Nephrol. Dial. Transpl. 2019, 34, 166–174. [Google Scholar] [CrossRef]
- Loupy, A.; Haas, M.; Solez, K.; Racusen, L.; Glotz, D.; Seron, D.; Nankivell, B.J.; Colvin, R.B.; Afrouzian, M.; Akalin, E.; et al. The Banff 2015 Kidney Meeting Report: Current Challenges in Rejection Classification and Prospects for Adopting Molecular Pathology. Am. J. Transpl. 2017, 17, 28–41. [Google Scholar] [CrossRef]
- Mehta, R.; Bhusal, S.; Randhawa, P.; Sood, P.; Cherukuri, A.; Wu, C.; Puttarajappa, C.; Hoffman, W.; Shah, N.; Mangiola, M.; et al. Short-term adverse effects of early subclinical allograft inflammation in kidney transplant recipients with a rapid steroid withdrawal protocol. Am. J. Transpl. 2018, 18, 1710–1717. [Google Scholar] [CrossRef] [PubMed]
- Rush, D.; Arlen, D.; Boucher, A.; Busque, S.; Cockfield, S.M.; Girardin, C.; Knoll, G.; Lachance, J.G.; Landsberg, D.; Shapiro, J.; et al. Lack of benefit of early protocol biopsies in renal transplant patients receiving TAC and MMF: A randomized study. Am. J. Transpl. 2007, 7, 2538–2545. [Google Scholar] [CrossRef] [PubMed]
- Castellano, G.; Intini, A.; Stasi, A.; Divella, C.; Gigante, M.; Pontrelli, P.; Franzin, R.; Accetturo, M.; Zito, A.; Fiorentino, M.; et al. Complement Modulation of Anti-Aging Factor Klotho in Ischemia/Reperfusion Injury and Delayed Graft Function. Am. J. Transpl. 2016, 16, 325–333. [Google Scholar] [CrossRef] [PubMed]
- Hu, M.C.; Shi, M.; Zhang, J.; Quiñones, H.; Kuro-o, M.; Moe, O.W. Klotho deficiency is an early biomarker of renal ischemia-reperfusion injury and its replacement is protective. Kidney Int. 2010, 78, 1240–1251. [Google Scholar] [CrossRef] [PubMed]
- Sun, C.Y.; Chang, S.C.; Wu, M.S. Suppression of Klotho expression by protein-bound uremic toxins is associated with increased DNA methyltransferase expression and DNA hypermethylation. Kidney Int. 2012, 81, 640–650. [Google Scholar] [CrossRef]
- Muñoz-Castañeda, J.R.; Herencia, C.; Pendón-Ruiz de Mier, M.V.; Rodriguez-Ortiz, M.E.; Diaz-Tocados, J.M.; Vergara, N.; Martínez-Moreno, J.M.; Salmerón, M.D.; Richards, W.G.; Felsenfeld, A.; et al. Differential regulation of renal Klotho and FGFR1 in normal and uremic rats. FASEB J. 2017, 31, 3858–3867. [Google Scholar] [CrossRef]
- Hernández, D.; Vázquez, T.; Alonso-Titos, J.; León, M.; Caballero, A.; Cobo, M.A.; Sola, E.; López, V.; Ruiz-Esteban, P.; Cruzado, J.M.; et al. Impact of HLA Mismatching on Early Subclinical Inflammation in Low-Immunological-Risk Kidney Transplant Recipients. J. Clin. Med. 2021, 10, 1934. [Google Scholar] [CrossRef]
- Mehta, R.B.; Tandukar, S.; Jorgensen, D.; Randhawa, P.; Sood, P.; Puttarajappa, C.; Zeevi, A.; Tevar, A.D.; Hariharan, S. Early subclinical tubulitis and interstitial inflammation in kidney transplantation have adverse clinical implications. Kidney Int. 2020, 98, 436–447. [Google Scholar] [CrossRef]
- Alvarez-Cienfuegos, A.; Cantero-Nieto, L.; Garcia-Gomez, J.A.; Robledo, G.; González-Gay, M.A.; Ortego-Centeno, N. FGF23-Klotho axis in patients with rheumatoid arthritis. Clin. Exp. Rheumatol. 2020, 38, 50–57. [Google Scholar]
- Martín-González, C.; Espelosín-Ortega, E.; Abreu-González, P.; Fernández-Rodríguez, C.; Vera-Delgado, V.E.; González-Navarrete, L.; García-Rodríguez, A.; Riera, A.M.; González-Reimers, E. Klotho Levels and Their Relationship with Inflammation and Survival among Alcoholic Patients. Biomolecules 2022, 12, 1151. [Google Scholar] [CrossRef] [PubMed]
- Abdelmalik, P.A.; Stevens, R.D.; Singh, S.; Skinner, J.; Carhuapoma, J.R.; Noel, S.; Johns, R.; Fuchs, R.J. Anti-aging factor, serum alpha-Klotho, as a marker of acute physiological stress, and a predictor of ICU mortality, in patients with septic shock. J. Crit. Care 2018, 44, 323–330. [Google Scholar] [CrossRef] [PubMed]
- Chen, C.D.; Podvin, S.; Gillespie, E.; Leeman, S.E.; Abraham, C.R. Insulin stimulates the cleavage and release of the extracellular domain of Klotho by ADAM10 and ADAM17. Proc. Natl. Acad. Sci. USA 2007, 104, 19796–19801. [Google Scholar] [CrossRef] [PubMed]
- Chen, C.D.; Tung, T.Y.; Liang, J.; Zeldich, E.; Tucker Zhou, T.B.; Turk, B.E.; Abraham, C.R. Identification of cleavage sites leading to the shed form of the anti-aging protein klotho. Biochemistry 2014, 53, 5579–5587. [Google Scholar] [CrossRef]
Disclaimer/Publisher’s Note: The statements, opinions and data contained in all publications are solely those of the individual author(s) and contributor(s) and not of MDPI and/or the editor(s). MDPI and/or the editor(s) disclaim responsibility for any injury to people or property resulting from any ideas, methods, instructions or products referred to in the content. |
© 2023 by the authors. Licensee MDPI, Basel, Switzerland. This article is an open access article distributed under the terms and conditions of the Creative Commons Attribution (CC BY) license (https://creativecommons.org/licenses/by/4.0/).