Abstract
The prevalence and risk factors of hemorrhagic transformation (HT) after acute ischemic stroke HT have not been adequately delineated. We performed a systematic review and meta-analysis to identify English-language prospective observational MEDLINE and EMBASE-listed reports of acute ischemic stroke with HT published from 1985–2017. Studies that used the ECASS-2 definitions of hemorrhagic transformation subtypes, hemorrhagic infarction (HI), and parenchymal hematoma (PH) were included. Patients treated with intravenous thrombolysis with tissue plasminogen activator (IV-tPA) were compared with those who did not receive thrombolysis. A total of 65 studies with 17,259 patients met inclusion criteria. Overall, HT prevalence was 27%; 32% in patients receiving IV-tPA vs. 20% in those without. Overall PH prevalence was 9%; 12% in IV-tPA treated patients vs. 5% in those without. HT was associated with a history of atrial fibrillation (OR 2.94) and use of anticoagulants (OR 2.47). HT patients had higher NIHSS (Hedge’s-G 0.96) and larger infarct volume (diffusion-weighted MRI, Hedge’s-G 0.8). In IV-tPA treated patients, PH correlated with antiplatelet (OR 3) and statin treatment (OR 4). HT (OR 3) and PH (OR 8) were associated with a poor outcome at 90-day (mRS 5–6). Hemorrhagic transformation is a frequent complication of acute ischemic stroke and is associated with poor outcome. Recognition of risk factors for HT and PH may reduce their incidence and severity.
1. Introduction
Hemorrhagic transformation (HT) occurs frequently in patients with acute ischemic stroke. While HT may be part of the natural disintegration process of the infarcted tissue [1], it is unclear to what extent it may exert its own deleterious effect independent of those attributed to the infarcted tissue [2].
There are two accepted classification schemes for HT assessment; one is based strictly on radiological criteria, while the second combines both clinical and radiological variables. The former was used as a safety end point for intravenous thrombolysis with tissue plasminogen activator (IV-tPA)-related HT in the European Cooperative Acute Stroke Trials (ECASS) [3,4,5]. The ECASS classification categories are no HT, HT into hemorrhagic infarction (HI), manifesting as small petechial hemorrhage along the margins of the infarct, and parenchymal hematoma (PH), manifesting as confluent hematoma. HI and PH are subdivided into type 1 and 2 for the milder and more severe forms, respectively (without HT, HI, PH, and PH2). Notably, PH2, the most severe form of HT, is classified as blood clots exceeding 30% of the infarct area with significant space-occupying effect. In cases of HT classed as ECASS-I, PH2 was associated with both neurological deterioration (OR 32.3) and increased 3-month mortality (OR 18) [4] compared with patients without PH2.
The second HT classification system is based on clinical presentation; (a) symptomatic vs. (b) asymptomatic. Unfortunately, different definitions of symptomatic HT have been adopted, introducing biases regarding prevalence, risk factors, and prognosis [5,6]. ECASS-III required concurrent hemorrhage on CT scan and neurological deterioration, with an increase of >4 points in the National Institutes of Health Stroke Score (NIHSS) to diagnose symptomatic HT [3]. Subdividing HT into symptomatic vs. asymptomatic is problematic because it is difficult to attribute neurological deterioration solely to HT. Furthermore, the effect of asymptomatic HT on outcome remains controversial [7,8].
We aimed to characterize the prevalence, risk factors, and prognosis of HT in patients with acute ischemic stroke by conducting a systematic review of studies that reported HT. As rates of HT are higher in patients treated with IV-tPA [9], we specifically investigated interactions between possible predictors of HT in IV-tPA treated and untreated subpopulations. Additionally, we examined rates of HT subtypes in patients of East-Asian ethnicity, since they are more prone to suffer from HT [8,10].
2. Materials and Methods
This study was registered with the International Prospective Register of Systematic Reviews; PROSPERO 2017 (Registration number CRD42017074806) and adheres to the PRISMA guidelines for preferred reporting in meta-analyses [11]. Two authors (A.H. and J.P.) identified potentially relevant studies and independently extracted data. For purposes of quality assurance, a third author (O.R.B.) extracted information from ten studies and validated the results.
2.1. Study Identification and Classification
An electronic search of the MEDLINE and EMBASE Ovid (Wolters Kluwer, Alphen aan den Rijn, The Netherlands) databases for English-language prospective observational studies published between January 1985 and May 2017 that reported rates of HT using the search terms “cerebral infarction/or brain isch*emia or stroke” and “h*emorrhagic transformation.” Studies were included if they recorded baseline and follow-up brain imaging (CT or MRI) demonstrating hemorrhagic transformation in an adult population and used the ECASS definition of HT; conference abstracts or letters to the editor, reviews, case series with fewer than 10 patients, and retrospective studies (Supplemental Material) were excluded.
2.2. Each Study Was Classified According to the Following Criteria
IV-tPA treatment—According to the study protocol, each study population was classified as either IV-tPA treated or untreated. In a study including both subpopulations, data was extracted for each subgroup separately. Data from mixed populations of IV-tPA treated and untreated patients that did not differentiate the two subpopulations were only used for the total population included in the global assessment of each factor. Similarly, data from patients who underwent any endovascular procedure was included in the global assessment of each factor and not included in the IV-tPA treated and untreated analysis.
Imaging timing and modality—To assess the effect of imaging modality on the frequency of HT, studies were categorized based on whether CT or MRI was used in repeat scan after admission. Studies that included both imaging modalities were excluded from this specific analysis. To assess HT frequency with respect to timing of repeat imaging, studies were divided into series where the repeat scan after the index event was performed within 72 h or after a longer interval.
Ethnicity—Studies published by an institution in an East-Asian country that included only the local population were designated as such and were compared to studies from non-East-Asian countries.
2.3. Data Extraction
For each study, demographic, clinical, and radiological data were extracted in accordance with PRISMA criteria [11]. Using predefined variables, two investigators (A.H. and J.P.) independently evaluated all studies and extracted the data. Data were collected by treatment (IV-tPA treated versus untreated patients) and according to the ECASS radiological classification (without HT, HI, PH, and PH2). In studies where results were given for a mixed population of IV-tPA treated and untreated patients, the available data were used only when calculating the effect of a certain variable on the total patient population. Supplemental Table S1 lists all studies included in the meta-analysis, and Supplemental Tables S3–S5 detail the specific studies used in each sub-analysis. For the sake of brevity, some of the studies used in the analysis may not be cited in the body of this paper.
2.4. Data Analysis
Two types of aggregate effect-size estimates, odd ratios (OR), and Hedges’ g (HG), were calculated using continuous and categorical data. Categorical data were used to create the contingency table of analysis for OR (measure of association), and continuous data (i.e., mean, standard deviation, and sample size) were used to generate HG, a measure of group differences. The standard practice for interpretation of HG, as per Cohen’s suggestions [12], is to stratify findings as a small effect (HG < 0.2), a medium effect (HG 0.2−0.8), or a large effect (HG > 0.8).
Categorical variables included imaging modality (CT, MRI) and repeat image time (≤72, >72 h), ethnicity (East Asian, non-East Asian), gender, previous medical condition (Yes/No), hypertension (HTN), diabetes mellitus (DM), atrial fibrillation (AF), hyperlipidemia, and history of alcohol consumption. Treatments prior to acute stroke included anticoagulation, antiplatelets, and statins. Functional outcome was measured at 90 days by modified Rankin score (mRS) of 0–1, 2−4, and 5–6.
Continuous variables included age, low density lipoprotein (LDL) cholesterol level, admission glucose level (AGL), systolic and diastolic blood pressure, NIHSS score, and infarct volume measured on diffusion-weighted MRI (DWI).
Neuroradiological markers, patient body temperature, and renal impairment data were analyzed qualitatively.
For each variable, three group comparisons were made: HT vs. no HT, PH vs. no PH, and PH vs. HI. Data analysis was performed for IV-tPA-treated and untreated patients separately whenever possible.
Statistical analyses were carried out using the Comprehensive Meta-analysis software (Verson 2.0, Biostat, Englewood, NJ, USA) [13] including the random effect model and analysis of continuous and categorical data to report the aggregate prevalence estimate and the association markers with 95% confidence intervals (CI) for all variables. We examined for the presence of between-studies heterogeneity in the results by relying on the magnitude of the I-square statistics [14].
2.5. Assessment of the Risk of Bias
Two reviewers (A.H. and J.P.) independently assessed the risk of bias for individual studies according to widely accepted tools [15], noting methodology for participant selection, HT outcomes, blinding, loss to follow-up, methods for controlling confounding, and declaration of conflicts of interest.
3. Results
A total of 2087 studies were identified; 65 studies (seven randomized clinical trials and 58 observational studies) enrolling a total of 17,259 patients met selection criteria and were included in this analysis (Figure 1). The characteristics of all included studies are summarized in Supplementary Tables S1 and S2.
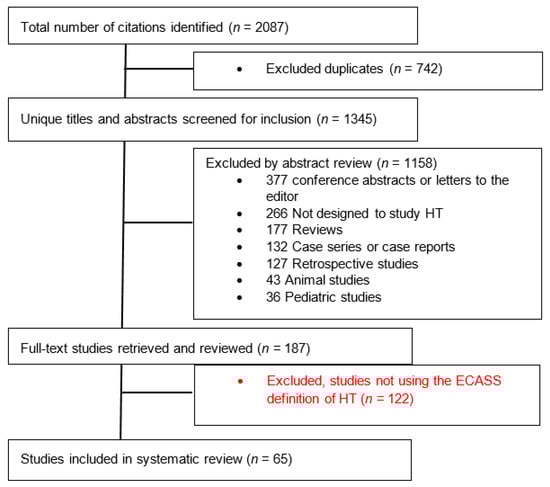
Figure 1.
Flow diagram of the study selection process. HT—Hemorrhagic Transformation; ECASS—European Cooperative Acute Stroke Study.
3.1. Hemorrhagic Transformation
The aggregated rates of HT are summarized in Table 1. Overall prevalence of HT was 27% (95% CI 23–30%). Patients treated with IV-tPA had HT prevalence of 32% (95% CI 27–37) in contrast to 20% (95% CI 14–27) in the untreated group (OD 1.9; CI 1.7–2.1, p < 0.001). More importantly, IV-tPA treated patients, compared with IV-tPA untreated patients, had significantly higher rates of both PH (12% versus 5%, OD 2.8, CI 2.3–3.4, p < 0.001) and PH2 (5% versus 3%, OD 2.1, CI 1.4–3.2, p < 0.0001). A more pronounced effect from IV-tPA treatment was observed in East-Asian patients for both PH (15% versus 4%, OD 2.3, CI 1.3–4.2, p = 0.004) and PH2 (9% versus 2%, OD 12.5, CI 5.8–26.7, p < 0.0001).

Table 1.
Prevalence (%) of hemorrhagic transformation.
Similar rates of PH were diagnosed using either CT or MRI (9% for both). In contrast, higher rates of HI were diagnosed using MRI (20% versus 15%).
Table S3 details which studies were included in each analysis.
3.2. Demographics
Age—Overall, 15 studies including 3480 patients were included in analysis of patient age [16,17,18,19,20,21,22,23,24,25,26,27,28,29,30] (Table 2). Between group comparison showed that for the full sample, patients with HT were significantly older than those without HT (HG 0.13, CI 0.05–0.2) and patients with PH were older compared to patients without PH (HG 0.22, CI 0.09–0.34). In the IV-tPA analysis, treated patients with PH were significantly older than those without PH (HG 0.27, CI 0.04–0.5); however, there was no significant difference for untreated patients with vs. without PH (HG 0.12, CI −0.52–0.76).
Table 2.
Patient Group Differences based on risk factors; effect size (95% CI); heterogeneity magnitude I2.
Male sex was provided in 18 studies including 5809 patients; 3312 (57%) were male [7,17,19,21,22,23,24,25,26,28,29,30,31,32,33,34,35,36] (Table 2). In the overall population male sex was not associated with a higher frequency of HT; however, it was associated with PH (OR 1.5, CI 1.07–2.11).
3.3. Baseline Comorbidities
Details regarding underlying chronic HTN were provided in 14 studies including 4743 patients; 2732 (58%) had chronic HTN [7,21,23,25,27,29,33,35,36,37,38,39,40,41] AH VERIFY (Table 2). While chronic HTN was not associated with HT in the full sample (OR 1.2, CI 0.9–1.7), it was associated with PH in IV-tPA treated patients (OR 1.51, CI 1.1–2.07).
The frequency of DM was given in 21 studies including 7037 patients; 1657 (24%) had DM [7,16,18,19,21,22,23,24,25,26,27,28,29,31,33,35,36,39,41,42,43] (Table 2). There was a tendency towards an association of DM with HT that did not reach significance (OR 1.23, CI 0.97–1.56); however, DM was more strongly associated with PH compared with HI (OR 1.66, 1.05–2.61) in a mixed population of IV-tPA treated and untreated patients.
Details regarding hyperlipidemia were given in 10 studies including 2619 patients (positive in 630, 24%) [19,21,22,26,27,32,35,39,41,42] (Table 2). The presence of hyperlipidemia was negatively associated with HT in IV-tPA untreated patients (OR 0.53, CI 0.31–0.91).
LDL levels upon admission were available in five studies including 2055 patients [20,23,36,39,43] (Table 2). HT patients had lower LDL levels compared with patients without HT (HG −0.3, CI −0.12– −0.48); however, a similar association was not found with PH.
Details regarding alcohol abuse was provided in four studies including 2289 patients, of whom 284 (12%) had a history of abuse [27,33,36,43] (Table 2). There was no association with either HT (OR 1.32, 0.92–1.88) nor PH (OR 1.02, 0.5–2.08) in a mixed population of IV-tPA treated and untreated patients in this sample.
3.4. Chronic Treatment
Information regarding chronic anticoagulation treatment was provided in four studies including 2470 patients, of whom 126 (5.1%) were under treatment [20,26,36,43] (Table 2). In the overall population anticoagulation was clearly associated with HT (OR 2.47, CI 1.64–3.72).
Details regarding chronic antiplatelet therapy were provided in eight studies including 4464 patients, of whom 1312 (29%) were under treatment [19,20,25,26,28,36,43,44] (Table 2). Antiplatelet treatment was associated with PH in the overall population (OR 2.25, CI 1.26–4.02) and to a larger extent in IV-tPA treated patients (OR 3.15, CI 1.39–7.17).
The frequency of chronic statin treatment was given in six studies including 2734 patients; 420 of them (15%) were under treatment [23,26,28,36,43,45] (Table 2). Statin treatment tended to be associated with PH in the overall population (OR 2.15, CI 0.98–4.76) and significantly associated with PH in IV-tPA treated patients (OR 3.58, CI 1.41–9.05), with the caveat that only two studies were included in the IV-tPA subanalysis.
3.5. Clinical Data upon ER Admission
Potential association with systolic and diastolic BP, body temperature, and glucose levels was examined (Table 3).
Table 3.
Patient data upon admission.
Data for systolic BP upon admission were available from 12 studies including 2582 patients [16,17,18,21,22,24,26,32,35,39,42,43]. Systolic pressure was higher in patients with PH versus those without in the overall population (HG 0.22, CI 0–0.45) and more specifically in IV-tPA treated patients (HG 0.34, CI 0.11–0.57).
Details regarding diastolic BP upon admission were also provided in 12 studies including 2631 patients [16,17,18,21,22,24,26,32,35,39,42,43]. No between-group differences were found for diastolic BP on any comparison made. One study [42] found that greater diastolic BP variability was associated with higher rates of HT, independent of mean values.
Information regarding glucose level upon admission was given in 13 studies including 3845 patients [16,17,18,21,22,23,24,26,35,36,39,42,43]. Between-group comparisons showed higher glucose levels in HT patients compared to those without HT (HG 0.19, CI 0.09–0.29) and in PH patients compared with patients without PH (HG 0.31, CI 0.15–0.48). In a comparison of the two HT subtypes, PH patients had higher glucose levels than HI patients (HG 0.42, CI 0.16–0.67).
An association between body temperature and HT by ECASS classification was found in four studies; however, we were not able to aggregate the data for meta-analysis. One study [27] found that a higher body temperature in the first day post-stroke was associated with HT (OR 7.3, CI 2.4–22.6) in non-IV-tPA treated patients. One randomized clinical trial [46] compared outcomes with therapeutic hypothermia in patients who had a middle cerebral artery (MCA) clot recanalized by stent thrombectomy and/or IV-tPA, and found lower rates of HT in (14% versus 39%, p = 0.016) and less cerebral edema (no cerebral edema in 17% with treatment versus 54% without, p = 0.001). Two studies of patients with MCA occlusion treated with IV-tPA [40,47] examining the association of PH with increased body temperature found a trend that almost reached statistical significance [47] in the larger cohort but was not significant in the second study [40].
3.6. Stroke Mechanism
Overall rates of HT were substantially different in comparisons of cases with different proposed etiologies.
The prevalence of AF was assessed in 15 studies including 4982 patients, with AF in 1176 (24%) [7,16,19,20,22,24,25,27,29,31,32,33,36,39,41] (Table 2). There was an association between AF and both HT (OR 2.86, 1.86–4. 37) and PH (OR 2.25, 1.47–3.44).
Lacunar etiology was associated with extremely low rates of HT in seven studies [8,24,33,48,49,50,51]. AH VERIFY.
3.7. Stroke Severity
Stroke severity was assessed by both NIHSS score and DWI volume upon admission. Admission NIHSS was available in six studies including 1202 patients [19,20,23,24,30,31]. HT patients had remarkably higher admission NIHSS compared with patients without HT in general (HG 0.96, CI 0.48–1.45), and in the subpopulation of IV-tPA treated patients in particular (HG 0.93, CI 0.36–1.51). Similarly, PH patients had higher admission NIHSS than non-PH patients (HG 0.45, CI 0.22–0.69).
The DWI ischemic volume was available in five studies including 656 patients [16,20,23,24,31]. DWI ischemic volumes were larger on MRI studies performed on the first day of ictus in HT compared with non-HT patients (HG 0.83, CI 0.1–1.76). The aggregated data did not allow further subgroup analysis; however, one study [23] found that the severity of hypoperfusion on MRI perfusion studies is more predictive of HT than DWI volume. Similarly, three CT perfusion studies [41,52,53] found a direct strong correlation between hypoperfusion and HT.
Several radiological and laboratory biomarkers suggesting blood–brain barrier (BBB) disruption were reported in selected studies. Unfortunately, there were not sufficient data for any marker to enable meta-analysis. Neuroimaging signs of BBB disruption found on dual-energy CT studies performed following stent thrombosis found a strong association with HT (OR 4.5, 1.2–16.4) [54] and parenchymal enhancement on postcontrast T1-weighted MRI following IV-tPA were predictive and localized subsequent HT in one study [55]. Laboratory biomarkers suggesting BBB disruption in IV-tPA treated patients were found to be strong independent predictors of PH in multivariate analysis, including the neutrophil-to-lymphocyte ratio (OR 8.5, CI 2.7–26.9 for a ratio >10.6) [37], baseline matrix-metalloproteinase-9 (OR 9.6, CI 1.3–70.3) [56], and platelet-derived growth factor C (PDGFC), where a level >175 predicted PH with 90% sensitivity [47].
3.8. Outcomes
The 90-day mRS was available in four studies that included 1838 patients. Among them, 388 patients (21%) had an mRS of 5–6 at 90 days [7,25,31,57] (Table 4). This high mRS was associated with HT (OR 2.16, 1.7–2.75), and even more strongly associated with PH (OR 5.4, CI 3.2–9.1) in the overall group. When the association with a poor outcome was analyzed the subgroup of IV-tPA treated patients, there was a clear association with HT (OR 2.22, CI 1.7–2.92) and a stronger association with PH (6.25, CI 3.2–12.3). Conversely, in those who did not receive IV-tPA, neither HT nor PH were associated with a poor outcome. In contrast, based on data from three studies including 1197 patients, a 90-day mRS of 0–1 found in 434 patients (36%) [7,31,58] was less frequent in those with HT (OR 0.45, CI 0.28–0.71) and even less likely in those with PH (OR 0.35, CI 0.15–0.86).
Table 4.
Follow-up of patients with hemorrhagic transformation.
4. Discussion
Aggregated data in this meta-analysis revealed that IV-tPA-treated patients had higher rates of HT (32% versus 20%), PH (12% versus 5%), and PH2 (5% versus 3%) compared to those who did not undergo thrombolysis (p < 0.001 for all conditions). This finding is in agreement with a meta-analysis of individual patient of data from nine random control trials that found that IV-tPA significantly increased the odds of PH2 (OR 5.55, 95% CI 4.01–7.70, p < 0.0001) (6.8% versus 1.3%) [9]. Interestingly, IV-tPA-associated HT was more pronounced in the East-Asian patients, who showed higher rates of IV-tPA associated PH and PH2 compared to non-East-Asians (15% versus 12% and 9% versus 5%, respectively). This increased tendency of East-Asian populations to show higher rates of HT in response to IV-tPA treatment was also reflected in two randomized control trials in Japan and China [8,10], which showed higher rates of severe HT in the regular versus reduced IV-tPA dosage. Moreover, a large observational study found that a low-dose alteplase strategy was comparable to the standard-dose treatment in terms of effectiveness and safety [59].
Similar to previously reported literature [60], our results show that both CT and MRI have similar rates of PH in general and PH2 in particular, thus, allowing us to aggregate patients with PH seen on different imaging modalities without introducing a significant bias.
Understanding the underlying pathophysiological processes that lead to HT may give a plausible explanation to the different variables found to be associated with HT in general and with PH in particular. These processes include ischemia-induced metabolic changes, which, together with an inflammatory response [61] lead to BBB disruption [62]. BBB disruption, along with impairment of cerebral vasculature autoregulatory control, predisposes to blood extravasation when the ischemic tissue is eventually reperfused [63], resulting in HT [64]. Moreover, Matrix metalloproteinase (MMP) expression is related to blood–brain barrier disruption after cerebral ischemia in both IV-tPA treated and untreated ischemic stroke patients [65,66]. In addition, previous systematic reviews performed separately on IV-tPA treated and untreated patient populations, found a clear association between the size of the ischemic territory and prevalence of HT [67].
Among IV-tPA treated patients, PH patients were significantly older than patients without PH (HG 0.27, CI 0.04–0.5) However, this was not found in untreated IV-tPA patients (HG 0.12, CI −0.52–0.76). This difference may be because elderly patients could be more readily susceptible to BBB permeability under ischemia [68] and have a higher burden of cerebral microbleeds (CMBs) [69,70]. A systematic review found that in IV-tPA treated patients, the presence of CMBs increases the risk of symptomatic HT [71].
Male gender was not found to be associated with HT in general, but was associated with PH (OR 1.5, CI 1.07–2.11). One possible explanation could be the independently higher burden of cerebral microbleeds (CMBs) in men (OR 1.7, CI 1.3–2.3) [71].
Chronic hypertension was associated with PH only in the IV-tPA treated patients (OR 1.51, CI 1.1–2–07), possibly due to longstanding hypertension-induced vasculopathic changes such as Charcot microaneurysms and CMBs [72].
DM tended to be associated with HT (OR 1.23, CI 0.97–1.56) and was significantly associated with having PH rather than HI (OR 1.66, 1.05–2.61). Again, it may be attributed to higher burden of small vessel disease (SVD) in diabetic patients. Alternatively, higher glucose levels in diabetic patients may be associated with enhanced bleeding [73]. We found higher acquired generalized lipodystrophy (AGL) in comparisons of HT versus non-HT patients (HG 0.19, CI 0.09–0.3), and PH versus non-PH patients (HG 0.31, CI 0.15–0.48). In an adjusted meta-analysis of studies of IV-tPA-treated patients, higher AGL was associated with more symptomatic intracranial hemorrhage [73]. One possible mechanism is increased BBB disruption [74], which increases blood extravasation into the infarcted brain parenchyma.
Hyperlipidemia was negatively associated with HT in IV-tPA untreated patients. This seemingly protective effect was strong when both LDL level (HG −0.66, CI −0.29–1) and history of dyslipidemia (OR 0.53, CI 0.31–0.93) were examined separately. As seen with the known negative association between spontaneous intracerebral hemorrhage (ICH) and LDL level [75], it is unclear whether LDL itself plays a protective role or whether it is, instead, a biomarker for other mechanisms. A previous study found a body-mass index (BMI) >25 has an independent protective effect against HT (OR 0.39, 0.17–0.87) [76]. This paradoxical effect of obesity has been attributed to previous reports on higher levels of multiple coagulation factors [77] and a suboptimal response to antiplatelet medications [78,79] in obese patients.
Chronic medications play a significant role in the pathophysiology of HT [80]. The finding that previous treatment with anticoagulation increased risk for HT in general and PH in particular seems natural. Interestingly, chronic antiplatelet use was not associated with HT (OR 1, CI 0.83–1.23) but was associated with PH (OR 2.25, CI 1.26–4). We suggest that once bleeding occurs within the brain parenchyma, the ongoing disruption of platelet function facilitates the bleeding process. We presume the ongoing effect of antiplatelet treatment is further intensified in IV-tPA-treated patients, where there was a higher risk of PH (OR 3.15, CI 1.4–7.2). Our findings are in agreement with a large systematic review including 108,588 patients [81], which found that patients receiving long-term antiplatelet medications were associated with greater risks of developing symptomatic intracranial hemorrhage after IV-tPA. Surprisingly, a similar association was found for pretreatment with statins with PH in IV-tPA-treated patients (OR 3.58, CI 1.4–9). Our findings on this point are in contrast with previous large cohorts that did not show independently increased rates of symptomatic HT in IV-tPA-treated patients with a history of statin treatment [82,83]. Statin treated patients may have long-standing atherosclerosis-inducted arteriopathy that could be prone to bleeding. Unfortunately, our inability to adjust for individualized patient data hampers additional investigation of this finding.
Emergency room information is essential for HT risk assessment. Among IV-tPA-related patients, the HT group had higher systolic blood pressure (BP) values compared with those without HT (HG 0.34, CI 0.11–0.57). These differences were not found in patients who did not undergo thrombolysis. The association between higher systolic BP values and symptomatic HT was reported previously [84]. The underlying pathophysiology may include higher perfusion to vessels that lack autoregulation in the setting of IV-tPA. The role of BP in the acute management of patients without IV-tPA treatment deserves further investigation. We found qualitatively that higher temperature increases HT. Animal models have shown that hyperthermia increases BBB permeability, and consequently brain edema, in addition to increasing the fibrinolytic activity of IV-TPA [85].
Stroke severity, as assessed by the NIHSS, showed the highest degree of association with HT (HG 0.96, CI 0.48–1.45), but its association with PH was weaker (HG 0.45, CI 0.22–0.69). Similar findings were found for associations for ischemic volume DWI with HT (HG 0.76, CI 0.02–1.5) and with PH (HG 0.35, CI 0.07–0.62) suggesting that other predictors may play a significant role in PH occurrence.
Stroke mechanism impacts the rate of HT. AF was associated with HT and PH while large vessel atherosclerosis (LVA) was not. This finding is in agreement with a previous meta-analysis of IV-tPA treated patients [86]. The association for AF with PH could be attributed to higher rates of pretreatment with anticoagulation and a larger infarcted territory [87]. However, after adjustment for infarct size, several studies have shown the independent role of a cardioembolic mechanism for HT [57,82,88], and an even higher association with PH [36]. Perhaps the brain parenchyma in patients with LVA has been exposed to ongoing ischemia, leading to collateral flow buildup, and, therefore, is less subject to HT in contrast to abrupt occlusion and possibly recanalization, as seen in cardioembolic etiology.
In regard to functional outcome, PH was strongly associated with a poor outcome (mRS 5–6) in IV-tPA-treated patients (OR 6.25, CI 3.2–12.3), but not in patients who had no IV thrombolysis. Perhaps the pathophysiological mechanisms underlying PH differ between IV-tPA-treated and untreated patients; HT in the non-IV-tPA treated patients is a more natural process of disintegration of the ischemic tissue and takes place in a more gradual way. One large (n = 954 patients) observational study on IV-tPA treated [7] patients highlighted the independent deleterious effect of HT on prognosis.
Our work has several limitations. First, since we lack individual patient data, we can only show the aggregate of the available data and cannot adjust it for possible confounders. Second, HT was assessed in different timeframes and using different imaging modalities, thereby introducing a possible bias. Third, we did not assess the risk of bias for each of the studies included using the Newcastle–Ottawa assessment scale. This was an intentional choice to enable us to include studies from many international locations and that enrolled patients of diverse ethnicities. However, our work also has several possible strengths. It uses unified criteria to assess HT, it is up to date with the current literature and is of large scale, thereby minimizing the risk of bias. We hope this may allow the clinician to determine the likelihood of this event based on an individual patient’s pre-stroke historical characteristics and initial clinical, laboratory, and imaging evaluations in the emergency department.
5. Conclusions
Hemorrhagic transformation is a frequent complication of acute ischemic stroke and is associated with poor outcome. Recognition of risk factors for HT and PH may reduce their incidence and severity.
Prospective studies to further characterize these variables in a longitudinal manner are warranted.
Supplementary Materials
The following supporting information can be downloaded at https://www.mdpi.com/article/10.3390/jcm11051162/s1.
Author Contributions
Conceptualization, O.R.B. and A.H.; methodology, O.R.B.; software, A.A.S. and A.H.; validation, O.R.B., A.H. and J.P.; formal analysis, A.A.S., A.G.G. and A.H.; investigation, A.H. and J.P.; resources, O.R.B. and A.H.; data curation, O.R.B., J.P. and A.H.; writing—original draft preparation, A.H.; writing—review and editing, A.H., J.P., T.S.F. and O.R.B.; visualization, A.H.; supervision, O.R.B.; project administration, A.H.; funding acquisition, A.H., T.S.F. and O.R.B. All authors have read and agreed to the published version of the manuscript.
Funding
This research received no external funding.
Institutional Review Board Statement
Institutional Review Board approval was not required for this systematic review of previously published studies.
Informed Consent Statement
Not applicable.
Data Availability Statement
Questions regarding the data underlying this study should be directed to the corresponding author.
Conflicts of Interest
The authors declare no conflict of interest.
References
- Fisher, M.; Adams, R.D. Observations on brain embolism with special reference to the mechanism of hemorrhagic infarction. J. Neuropathol. Exp. Neurol. 1951, 10, 92–94. [Google Scholar]
- Pessin, M.S.; Teal, P.A.; Caplan, L.R. Hemorrhagic infarction: Guilt by association? AJNR Am. J. Neuroradiol. 1991, 12, 1123–1126. [Google Scholar]
- Hacke, W.; Kaste, M.; Bluhmki, E.; Brozman, M.; Dávalos, A.; Guidetti, D.; Larrue, V.; Lees, K.R.; Medeghri, Z.; Machnig, T.; et al. Thrombolysis with alteplase 3 to 4.5 hours after acute ischemic stroke. N. Engl. J. Med. 2008, 359, 1317–1329. [Google Scholar] [CrossRef] [Green Version]
- Hacke, W.; Kaste, M.; Fieschi, C.; Toni, D.; Lesaffre, E.; von Kummer, R.; Boysen, G.; Bluhmki, E.; Höxter, G.; Mahagne, M.H.; et al. Intravenous thrombolysis with recombinant tissue plasminogen activator for acute hemispheric stroke. The European Cooperative Acute Stroke Study (ECASS). JAMA 1995, 274, 1017–1025. [Google Scholar] [CrossRef]
- Hacke, W.; Kaste, M.; Fieschi, C.; von Kummer, R.; Davalos, A.; Meier, D.; Larrue, V.; Bluhmki, E.; Davis, S.; Donnan, G.; et al. Randomised double-blind placebo-controlled trial of thrombolytic therapy with intravenous alteplase in acute ischaemic stroke (ECASS II). Second European-Australasian Acute Stroke Study Investigators. Lancet 1998, 352, 1245–1251. [Google Scholar] [CrossRef]
- Brott, T.; Broderick, J.; Kothari, R.; Barsan, W.; Tomsick, T.; Sauerbeck, L.; Spilker, J.; Duldner, J.; Khoury, J. Early hemorrhage growth in patients with intracerebral hemorrhage. Stroke 1997, 28, 1–5. [Google Scholar] [CrossRef]
- Dzialowski, I.; Pexman, J.H.; Barber, P.A.; Demchuk, A.M.; Buchan, A.M.; Hill, M.D. Asymptomatic hemorrhage after thrombolysis may not be benign: Prognosis by hemorrhage type in the Canadian alteplase for stroke effectiveness study registry. Stroke 2007, 38, 75–79. [Google Scholar] [CrossRef] [Green Version]
- Jia, W.; Liao, X.; Pan, Y.; Wang, Y.; Cui, T.; Zhou, L.; Wang, Y. Thrombolytic-related asymptomatic hemorrhagic transformation does not deteriorate clinical outcome: Data from TIMS in China. PLoS ONE 2015, 10, e0142381. [Google Scholar] [CrossRef]
- Emberson, J.; Lees, K.R.; Lyden, P.; Blackwell, L.; Albers, G.; Bluhmki, E.; Brott, T.; Cohen, G.; Davis, S.; Donnan, G.; et al. Effect of treatment delay, age, and stroke severity on the effects of intravenous thrombolysis with alteplase for acute ischaemic stroke: A meta-analysis of individual patient data from randomised trials. Lancet 2014, 384, 1929–1935. [Google Scholar] [CrossRef] [Green Version]
- Yamaguchi, T.; Mori, E.; Minematsu, K.; Nakagawara, J.; Hashi, K.; Saito, I.; Shinohara, Y. Alteplase at 0.6 mg/kg for acute ischemic stroke within 3 hours of onset: Japan Alteplase Clinical Trial (J-ACT). Stroke 2006, 37, 1810–1815. [Google Scholar] [CrossRef] [Green Version]
- Moher, D.; Liberati, A.; Tetzlaff, J.; Altman, D.G. Preferred reporting items for systematic reviews and meta-analyses: The PRISMA statement. J. Clin. Epidemiol 2009, 62, 1006–1012. [Google Scholar] [CrossRef]
- Cohen, J. Statistical Power Analysis for the Behavioral Sciences; Erlbaum Associates: Hillsdale, NJ, USA, 1988. [Google Scholar]
- Pierce, C.A. Review of comprehensive meta-analysis (version 2.2.027). Organizational. Res. Meth. 2008, 11, 188–191. [Google Scholar] [CrossRef]
- Higgins, J.P.; Thompson, S.G.; Deeks, J.J.; Altman, D.G. Measuring inconsistency in meta-analyses. Brit. Med. J. BMJ 2003, 327, 557–560. [Google Scholar] [CrossRef] [Green Version]
- Sanderson, S.; Tatt, I.D.; Higgins, J.P. Tools for assessing quality and susceptibility to bias in observational studies in epidemiology: A systematic review and annotated bibliography. Int. J. Epidemiol. 2007, 36, 666–676. [Google Scholar] [CrossRef] [Green Version]
- Butcher, K.; Christensen, S.; Parsons, M.; De Silva, D.A.; Ebinger, M.; Levi, C.; Jeerakathil, T.; Campbell, B.C.; Barber, P.A.; Bladin, C.; et al. Postthrombolysis blood pressure elevation is associated with hemorrhagic transformation. Stroke 2010, 41, 72–77. [Google Scholar] [CrossRef] [Green Version]
- Castellanos, M.; Leira, R.; Serena, J.; Blanco, M.; Pedraza, S.; Castillo, J.; Dávalos, A. Plasma cellular-fibronectin concentration predicts hemorrhagic transformation after thrombolytic therapy in acute ischemic stroke. Stroke 2004, 35, 1671–1676. [Google Scholar] [CrossRef] [Green Version]
- Celik, Y.; Utku, U.; Asil, T.; Balci, K. Factors affecting haemorrhagic transformation in middle cerebral artery infarctions. J. Clin. Neurosci. 2004, 11, 656–658. [Google Scholar] [CrossRef]
- Chen, X.; Wang, Y.; Fu, M.; Lei, H.; Cheng, Q.; Zhang, X. Plasma immunoproteasome predicts early hemorrhagic transformation in acute ischemic stroke patients. J. Stroke Cerebrovasc. Dis. 2017, 26, 49–56. [Google Scholar] [CrossRef]
- El-Khawas, H.M.; El-Rakawy, M.H.; Zakaria, M.F.; Tantawy, W.H.; Raafat, M.A.; Fouad, M.M. Predictive factors of hemorrhagic transformation in acute ischemic stroke. Egypt. J. Neurol. Psychiatry Neurosurg. 2012, 49, 181–189. [Google Scholar]
- Hernandez-Guillamon, M.; Garcia-Bonilla, L.; Solé, M.; Sosti, V.; Parés, M.; Campos, M.; Ortega-Aznar, A.; Domínguez, C.; Rubiera, M.; Ribó, M.; et al. Plasma VAP-1/SSAO activity predicts intracranial hemorrhages and adverse neurological outcome after tissue plasminogen activator treatment in stroke. Stroke 2010, 41, 1528–1535. [Google Scholar] [CrossRef] [Green Version]
- Jickling, G.C.; Ander, B.P.; Stamova, B.; Zhan, X.; Liu, D.; Rothstein, L.; Verro, P.; Khoury, J.; Jauch, E.C.; Pancioli, A.M.; et al. RNA in blood is altered prior to hemorrhagic transformation in ischemic stroke. Ann. Neurol. 2013, 74, 232–240. [Google Scholar] [CrossRef] [Green Version]
- Kim, J.H.; Bang, O.Y.; Liebeskind, D.S.; Ovbiagele, B.; Kim, G.M.; Chung, C.S.; Lee, K.H.; Saver, J.L. Impact of baseline tissue status (diffusion-weighted imaging lesion) versus perfusion status (severity of hypoperfusion) on hemorrhagic transformation. Stroke 2010, 41, e135–e142. [Google Scholar] [CrossRef]
- Kimura, K.; Iguchi, Y.; Shibazaki, K.; Aoki, J.; Terasawa, Y. Hemorrhagic transformation of ischemic brain tissue after t-PA thrombolysis as detected by MRI may be asymptomatic, but impair neurological recovery. J. Neurol. Sci. 2008, 272, 136–142. [Google Scholar] [CrossRef]
- Larrue, V.; von Kummer, R.; del Zoppo, G.; Bluhmki, E. Hemorrhagic transformation in acute ischemic stroke. Potential contributing factors in the European Cooperative Acute Stroke Study. Stroke 1997, 28, 957–960. [Google Scholar] [CrossRef]
- Lee, J.G.; Lee, K.B.; Jang, I.M.; Roh, H.; Ahn, M.Y.; Woo, H.Y.; Hwang, H.W. Low glomerular filtration rate increases hemorrhagic transformation in acute ischemic stroke. Cerebrovasc. Dis. 2013, 35, 53–59. [Google Scholar] [CrossRef]
- Leira, R.; Sobrino, T.; Blanco, M.; Campos, F.; Rodríguez-Yáñez, M.; Castellanos, M.; Moldes, O.; Millán, M.; Dávalos, A.; Castillo, J. A higher body temperature is associated with haemorrhagic transformation in patients with acute stroke untreated with recombinant tissue-type plasminogen activator (rtPA). Clin. Sci. 2012, 122, 113–119. [Google Scholar] [CrossRef] [Green Version]
- Prodan, C.I.; Stoner, J.A.; Cowan, L.D.; Dale, G.L. Lower coated-platelet levels are associated with early hemorrhagic transformation in patients with non-lacunar brain infarction. J. Thromb. Haemost. 2010, 8, 1185–1190. [Google Scholar] [CrossRef]
- Rodríguez-Yáñez, M.; Castellanos, M.; Blanco, M.; Millán, M.; Nombela, F.; Sobrino, T.; Lizasoain, I.; Leira, R.; Serena, J.; Dávalos, A.; et al. Micro- and macroalbuminuria predict hemorrhagic transformation in acute ischemic stroke. Neurology 2006, 67, 1172–1177. [Google Scholar] [CrossRef]
- Shi, Z.S.; Duckwiler, G.R.; Jahan, R.; Tateshima, S.; Gonzalez, N.R.; Szeder, V.; Saver, J.L.; Kim, D.; Ali, L.K.; Starkman, S.; et al. Mechanical thrombectomy for acute ischemic stroke with cerebral microbleeds. J. Neurointerv. Surg. 2016, 8, 563–567. [Google Scholar] [CrossRef] [Green Version]
- Campbell, B.C.; Christensen, S.; Butcher, K.S.; Gordon, I.; Parsons, M.W.; Desmond, P.M.; Barber, P.A.; Levi, C.R.; Bladin, C.F.; De Silva, D.A.; et al. Regional very low cerebral blood volume predicts hemorrhagic transformation better than diffusion-weighted imaging volume and thresholded apparent diffusion coefficient in acute ischemic stroke. Stroke 2010, 41, 82–88. [Google Scholar] [CrossRef] [Green Version]
- Castro, P.; Azevedo, E.; Serrador, J.; Rocha, I.; Sorond, F. Hemorrhagic transformation and cerebral edema in acute ischemic stroke: Link to cerebral autoregulation. J. Neurol. Sci. 2017, 372, 256–261. [Google Scholar] [CrossRef] [Green Version]
- Choi, K.H.; Park, M.S.; Kim, J.T.; Nam, T.S.; Choi, S.M.; Kim, B.C.; Kim, M.K.; Cho, K.H. The serum ferritin level is an important predictor of hemorrhagic transformation in acute ischaemic stroke. Eur. J. Neurol. 2012, 19, 570–577. [Google Scholar] [CrossRef]
- Gioia, L.C.; Kate, M.; Sivakumar, L.; Hussain, D.; Kalashyan, H.; Buck, B.; Bussiere, M.; Jeerakathil, T.; Shuaib, A.; Emery, D.; et al. Early rivaroxaban use after cardioembolic stroke may not result in hemorrhagic transformation: A prospective magnetic resonance imaging study. Stroke 2016, 47, 1917–1919. [Google Scholar] [CrossRef]
- Molina, C.A.; Montaner, J.; Abilleira, S.; Ibarra, B.; Romero, F.; Arenillas, J.F.; Alvarez-Sabín, J. Timing of spontaneous recanalization and risk of hemorrhagic transformation in acute cardioembolic stroke. Stroke 2001, 32, 1079–1084. [Google Scholar] [CrossRef]
- Paciaroni, M.; Agnelli, G.; Corea, F.; Ageno, W.; Alberti, A.; Lanari, A.; Caso, V.; Micheli, S.; Bertolani, L.; Venti, M.; et al. Early hemorrhagic transformation of brain infarction: Rate, predictive factors, and influence on clinical outcome: Results of a prospective multicenter study. Stroke 2008, 39, 2249–2256. [Google Scholar] [CrossRef] [Green Version]
- Guo, Z.; Yu, S.; Xiao, L.; Chen, X.; Ye, R.; Zheng, P.; Dai, Q.; Sun, W.; Zhou, C.; Wang, S.; et al. Dynamic change of neutrophil to lymphocyte ratio and hemorrhagic transformation after thrombolysis in stroke. J. Neuroinflamm. 2016, 13, 199. [Google Scholar] [CrossRef] [Green Version]
- Mendioroz, M.; Fernández-Cadenas, I.; Alvarez-Sabín, J.; Rosell, A.; Quiroga, D.; Cuadrado, E.; Delgado, P.; Rubiera, M.; Ribó, M.; Molina, C.; et al. Endogenous activated protein C predicts hemorrhagic transformation and mortality after tissue plasminogen activator treatment in stroke patients. Cerebrovasc. Dis. 2009, 28, 143–150. [Google Scholar] [CrossRef]
- Öcek, L.; Güner, D.; Uludağ, İ.F.; Tiftikçioğlu, B.; Zorlu, Y. Risk factors for hemorrhagic transformation in patients with acute middle cerebral artery infarction. Noro Psikiyatr. Ars. 2015, 52, 342–345. [Google Scholar] [CrossRef]
- Sobrino, T.; Millán, M.; Castellanos, M.; Blanco, M.; Brea, D.; Dorado, L.; Rodríguez-González, R.; Rodríguez-Yáñez, M.; Serena, J.; Leira, R.; et al. Association of growth factors with arterial recanalization and clinical outcome in patients with ischemic stroke treated with tPA. J. Thromb. Haemost. 2010, 8, 1567–1574. [Google Scholar] [CrossRef]
- Yassi, N.; Parsons, M.W.; Christensen, S.; Sharma, G.; Bivard, A.; Donnan, G.A.; Levi, C.R.; Desmond, P.M.; Davis, S.M.; Campbell, B.C. Prediction of poststroke hemorrhagic transformation using computed tomography perfusion. Stroke 2013, 44, 3039–3043. [Google Scholar] [CrossRef] [Green Version]
- Ko, Y.; Park, J.H.; Yang, M.H.; Ko, S.B.; Han, M.K.; Oh, C.W.; Lee, J.; Lee, J.; Bae, H.J. The significance of blood pressure variability for the development of hemorrhagic transformation in acute ischemic stroke. Stroke 2010, 41, 2512–2518. [Google Scholar] [CrossRef] [Green Version]
- Wei, C.C.; Zhang, S.T.; Wang, Y.H.; Liu, J.F.; Li, J.; Yuan, R.Z.; Tan, G.; Zhang, S.H.; Liu, M. Association between leukoaraiosis and hemorrhagic transformation after cardioembolic stroke due to atrial fibrillation and/or rheumatic heart disease. J. Neurol. Sci. 2017, 378, 94–99. [Google Scholar] [CrossRef]
- Purrucker, J.C.; Wolf, M.; Haas, K.; Rizos, T.; Khan, S.; Dziewas, R.; Kleinschnitz, C.; Binder, A.; Gröschel, K.; Hennerici, M.G.; et al. Safety of endovascular thrombectomy in patients receiving non-nitamin K antagonist oral anticoagulants. Stroke 2016, 47, 1127–1130. [Google Scholar] [CrossRef] [Green Version]
- Heo, J.H.; Song, D.; Nam, H.S.; Kim, E.Y.; Kim, Y.D.; Lee, K.Y.; Lee, K.J.; Yoo, J.; Kim, Y.N.; Lee, B.C.; et al. Effect and safety of rosuvastatin in acute ischemic stroke. J. Stroke 2016, 18, 87–95. [Google Scholar] [CrossRef] [Green Version]
- Hong, J.M.; Lee, J.S.; Song, H.J.; Jeong, H.S.; Choi, H.A.; Lee, K. Therapeutic hypothermia after recanalization in patients with acute ischemic stroke. Stroke 2014, 45, 134–140. [Google Scholar] [CrossRef] [Green Version]
- Rodríguez-González, R.; Blanco, M.; Rodríguez-Yáñez, M.; Moldes, O.; Castillo, J.; Sobrino, T. Platelet derived growth factor-CC isoform is associated with hemorrhagic transformation in ischemic stroke patients treated with tissue plasminogen activator. Atherosclerosis 2013, 226, 165–171. [Google Scholar] [CrossRef]
- Bas, D.F.; Ozdemir, A.O.; Colak, E.; Kebapci, N. Higher insulin resistance level is associated with worse clinical response in acute ischemic stroke patients treated with intravenous thrombolysis. Transl. Stroke Res. 2016, 7, 167–171. [Google Scholar] [CrossRef]
- Liu, C.; Dong, Z.; Xu, L.; Khursheed, A.; Dong, L.; Liu, Z.; Yang, J.; Liu, J. MR image features predicting hemorrhagic transformation in acute cerebral infarction: A multimodal study. Neuroradiology 2015, 57, 1145–1152. [Google Scholar] [CrossRef]
- Maeshima, S.; Okamoto, S.; Okazaki, H.; Mizuno, S.; Asano, N.; Tsunoda, T.; Maeda, H.; Masaki, M.; Sonoda, S. Hemorrhagic transformation in patients with cerebral infarction referred to a rehabilitation hospital. Interv. Neurol. 2016, 4, 69–74. [Google Scholar] [CrossRef] [Green Version]
- Millan, M.; Sobrino, T.; Castellanos, M.; Nombela, F.; Arenillas, J.F.; Riva, E.; Cristobo, I.; García, M.M.; Vivancos, J.; Serena, J.; et al. Increased body iron stores are associated with poor outcome after thrombolytic treatment in acute stroke. Stroke 2007, 38, 90–95. [Google Scholar] [CrossRef] [Green Version]
- Bivard, A.; Cheng, X.; Lin, L.T.; Levi, C.; Spratt, N.; Kleinig, T.; O’Brien, B.; Butcher, K.; Lou, M.; Zhang, J.F.; et al. Global white matter hypoperfusion on CT predicts larger infarcts and hemorrhagic transformation after acute ischemia. CNS Neurosci. Ther. 2016, 22, 238–243. [Google Scholar] [CrossRef] [Green Version]
- Jain, A.R.; Jain, M.; Kanthala, A.R.; Damania, D.; Stead, L.G.; Wang, H.Z.; Jahromi, B.S. Association of CT perfusion parameters with hemorrhagic transformation in acute ischemic stroke. AJNR Am. J. Neuroradiol. 2013, 34, 1895–1900. [Google Scholar] [CrossRef] [Green Version]
- Renú, A.; Amaro, S.; Laredo, C.; Román, L.S.; Llull, L.; Lopez, A.; Urra, X.; Blasco, J.; Oleaga, L.; Chamorro, Á. Relevance of blood-brain barrier disruption after endovascular treatment of ischemic stroke: Dual-energy computed tomographic study. Stroke 2015, 46, 673–679. [Google Scholar] [CrossRef] [Green Version]
- Hjort, N.; Wu, O.; Ashkanian, M.; Sølling, C.; Mouridsen, K.; Christensen, S.; Gyldensted, C.; Andersen, G.; Østergaard, L. MRI detection of early blood-brain barrier disruption: Parenchymal enhancement predicts focal hemorrhagic transformation after thrombolysis. Stroke 2008, 39, 1025–1028. [Google Scholar] [CrossRef] [Green Version]
- Montaner, J.; Fernández-Cadenas, I.; Molina, C.A.; Monasterio, J.; Arenillas, J.F.; Ribó, M.; Quintana, M.; Chacón, P.; Andreu, A.L.; Alvarez-Sabín, J. Safety profile of tissue plasminogen activator treatment among stroke patients carrying a common polymorphism (C-1562T) in the promoter region of the matrix metalloproteinase-9 gene. Stroke 2003, 34, 2851–2855. [Google Scholar] [CrossRef] [Green Version]
- Larrue, V.; von Kummer, R.R.; Müller, A.; Bluhmki, E. Risk factors for severe hemorrhagic transformation in ischemic stroke patients treated with recombinant tissue plasminogen activator: A secondary analysis of the European-Australasian Acute Stroke Study (ECASS II). Stroke 2001, 32, 438–441. [Google Scholar] [CrossRef] [Green Version]
- Thomalla, G.; Sobesky, J.; Köhrmann, M.; Fiebach, J.B.; Fiehler, J.; Zaro Weber, O.; Kruetzelmann, A.; Kucinski, T.; Rosenkranz, M.; Röther, J.; et al. Two tales: Hemorrhagic transformation but not parenchymal hemorrhage after thrombolysis is related to severity and duration of ischemia: MRI study of acute stroke patients treated with intravenous tissue plasminogen activator within 6 hours. Stroke 2007, 38, 313–318. [Google Scholar] [CrossRef] [Green Version]
- Anderson, C.S.; Robinson, T.; Lindley, R.I.; Arima, H.; Lavados, P.M.; Lee, T.H.; Broderick, J.P.; Chen, X.; Chen, G.; Sharma, V.K.; et al. Low-dose versus standard-dose intravenous alteplase in acute ischemic stroke. N. Engl. J. Med. 2016, 374, 2313–2323. [Google Scholar] [CrossRef]
- Renou, P.; Sibon, I.; Tourdias, T.; Rouanet, F.; Rosso, C.; Galanaud, D.; Drier, A.; Coudert, M.; Deltour, S.; Crozier, S.; et al. Reliability of the ECASS radiological classification of postthrombolysis brain haemorrhage: A comparison of CT and three MRI sequences. Cerebrovasc. Dis. 2010, 29, 597–604. [Google Scholar] [CrossRef]
- Janardhan, V.; Qureshi, A.I. Mechanisms of ischemic brain injury. Curr. Cardiol. Rep. 2004, 6, 117–123. [Google Scholar] [CrossRef]
- Warach, S.; Latour, L.L. Evidence of reperfusion injury, exacerbated by thrombolytic therapy, in human focal brain ischemia using a novel imaging marker of early blood-brain barrier disruption. Stroke 2004, 35 (Suppl. 1), 2659–2661. [Google Scholar] [CrossRef] [Green Version]
- Khatri, R.; McKinney, A.M.; Swenson, B.; Janardhan, V. Blood-brain barrier, reperfusion injury, and hemorrhagic transformation in acute ischemic stroke. Neurology 2012, 79 (Suppl. 1), S52–S57. [Google Scholar] [CrossRef] [Green Version]
- Sussman, E.S.; Connolly, E.S., Jr. Hemorrhagic transformation: A review of the rate of hemorrhage in the major clinical trials of acute ischemic stroke. Front. Neurol. 2013, 4, 69. [Google Scholar] [CrossRef] [Green Version]
- Montaner, J.; Alvarez-Sabín, J.; Molina, C.A.; Anglés, A.; Abilleira, S.; Arenillas, J.; Monasterio, J. Matrix metalloproteinase expression is related to hemorrhagic transformation after cardioembolic stroke. Stroke 2001, 32, 2762–2767. [Google Scholar] [CrossRef] [Green Version]
- Montaner, J.; Molina, C.A.; Monasterio, J.; Abilleira, S.; Arenillas, J.F.; Ribó, M.; Quintana, M.; Alvarez-Sabín, J. Matrix metalloproteinase-9 pretreatment level predicts intracranial hemorrhagic complications after thrombolysis in human stroke. Circulation 2003, 107, 598–603. [Google Scholar] [CrossRef] [Green Version]
- Lindley, R.I.; Wardlaw, J.M.; Sandercock, P.A.; Rimdusid, P.; Lewis, S.C.; Signorini, D.F.; Ricci, S. Frequency and risk factors for spontaneous hemorrhagic transformation of cerebral infarction. J. Stroke Cerebrovasc. Dis. 2004, 13, 235–246. [Google Scholar] [CrossRef]
- Kaur, J.; Tuor, U.I.; Zhao, Z.; Barber, P.A. Quantitative MRI reveals the elderly ischemic brain is susceptible to increased early blood-brain barrier permeability following tissue plasminogen activator related to claudin 5 and occludin disassembly. J. Cereb. Blood Flow Metab. 2011, 31, 1874–1885. [Google Scholar] [CrossRef]
- Graff-Radford, J.; Simino, J.; Kantarci, K.; Mosley, T.H., Jr.; Griswold, M.E.; Windham, B.G.; Sharrett, A.R.; Albert, M.S.; Gottesman, R.F.; Jack, C.R., Jr.; et al. Neuroimaging correlates of cerebral microbleeds: The ARIC study (Atherosclerosis Risk in Communities). Stroke 2017, 48, 2964–2972. [Google Scholar] [CrossRef]
- Shoamanesh, A.; Kwok, C.S.; Lim, P.A.; Benavente, O.R. Postthrombolysis intracranial hemorrhage risk of cerebral microbleeds in acute stroke patients: A systematic review and meta-analysis. Int. J. Stroke 2013, 8, 348–356. [Google Scholar] [CrossRef] [Green Version]
- Shoamanesh, A.; Pearce, L.A.; Bazan, C.; Catanese, L.; McClure, L.A.; Sharma, M.; Marti-Fabregas, J.; Anderson, D.C.; Kase, C.S.; Hart, R.G.; et al. Microbleeds in the secondary prevention of small subcortical strokes trial: Stroke, mortality, and treatment interactions. Ann. Neurol. 2017, 82, 196–207. [Google Scholar] [CrossRef]
- Werring, D.J. Cerebral Microbleeds: Pathophysiology to Clinical Practice; Cambridge University Press: Cambridge, UK, 2011. [Google Scholar]
- Desilles, J.P.; Meseguer, E.; Labreuche, J.; Lapergue, B.; Sirimarco, G.; Gonzalez-Valcarcel, J.; Lavallée, P.; Cabrejo, L.; Guidoux, C.; Klein, I.; et al. Diabetes mellitus, admission glucose, and outcomes after stroke thrombolysis: A registry and systematic review. Stroke 2013, 44, 1915–1923. [Google Scholar] [CrossRef]
- Kamada, H.; Yu, F.; Nito, C.; Chan, P.H. Influence of hyperglycemia on oxidative stress and matrix metalloproteinase-9 activation after focal cerebral ischemia/reperfusion in rats: Relation to blood-brain barrier dysfunction. Stroke 2007, 38, 1044–1049. [Google Scholar] [CrossRef]
- Wang, X.; Dong, Y.; Qi, X.; Huang, C.; Hou, L. Cholesterol levels and risk of hemorrhagic stroke: A systematic review and meta-analysis. Stroke 2013, 44, 1833–1839. [Google Scholar] [CrossRef] [Green Version]
- Kim, C.K.; Ryu, W.S.; Kim, B.J.; Lee, S.H. Paradoxical effect of obesity on hemorrhagic transformation after acute ischemic stroke. BMC Neurol. 2013, 13, 123. [Google Scholar] [CrossRef] [Green Version]
- Cushman, M.; Yanez, D.; Psaty, B.M.; Fried, L.P.; Heiss, G.; Lee, M.; Polak, J.F.; Savage, P.J.; Tracy, R.P. Association of fibrinogen and coagulation factors VII and VIII with cardiovascular risk factors in the elderly: The Cardiovascular Health Study. Cardiovascular Health Study Investigators. Am. J. Epidemiol. 1996, 143, 665–676. [Google Scholar] [CrossRef] [Green Version]
- Cuisset, T.; Frere, C.; Quilici, J.; Morange, P.E.; Camoin, L.; Bali, L.; Lambert, M.; Juhan-Vague, I.; Alessi, M.C.; Bonnet, J.L. Relationship between aspirin and clopidogrel responses in acute coronary syndrome and clinical predictors of non response. Thromb. Res. 2009, 123, 597–603. [Google Scholar] [CrossRef]
- Sibbing, D.; von Beckerath, O.; Schömig, A.; Kastrati, A.; von Beckerath, N. Impact of body mass index on platelet aggregation after administration of a high loading dose of 600 mg of clopidogrel before percutaneous coronary intervention. Am. J. Cardiol. 2007, 100, 203–205. [Google Scholar] [CrossRef]
- Álvarez-Sabín, J.; Maisterra, O.; Santamarina, E.; Kase, C.S. Factors influencing haemorrhagic transformation in ischaemic stroke. Lancet Neurol. 2013, 12, 689–705. [Google Scholar] [CrossRef]
- Luo, S.; Zhuang, M.; Zeng, W.; Tao, J. Intravenous thrombolysis for acute ischemic stroke in patients receiving antiplatelet therapy: A systematic review and meta-analysis of 19 studies. J. Am. Heart Assoc. 2016, 5, e003242. [Google Scholar] [CrossRef] [Green Version]
- Cappellari, M.; Bovi, P.; Moretto, G.; Zini, A.; Nencini, P.; Sessa, M.; Furlan, M.; Pezzini, A.; Orlandi, G.; Paciaroni, M.; et al. The THRombolysis and STatins (THRaST) study. Neurology 2013, 80, 655–661. [Google Scholar] [CrossRef] [Green Version]
- Tsivgoulis, G.; Kadlecová, P.; Kobayashi, A.; Czlonkowska, A.; Brozman, M.; Švigelj, V.; Csiba, L.; Kõrv, J.; Demarin, V.; Vilionskis, A.; et al. Safety of statin pretreatment in intravenous thrombolysis for acute ischemic stroke. Stroke 2015, 46, 2681–2684. [Google Scholar] [CrossRef] [Green Version]
- Ahmed, N.; Wahlgren, N.; Brainin, M.; Castillo, J.; Ford, G.A.; Kaste, M.; Lees, K.R.; Toni, D. Relationship of blood pressure, antihypertensive therapy, and outcome in ischemic stroke treated with intravenous thrombolysis: Retrospective analysis from Safe Implementation of Thrombolysis in Stroke-International Stroke Thrombolysis Register (SITS-ISTR). Stroke 2009, 40, 2442–2449. [Google Scholar] [CrossRef] [Green Version]
- Noor, R.; Wang, C.X.; Shuaib, A. Hyperthermia masks the neuroprotective effects of tissue plaminogen activator. Stroke 2005, 36, 665–669. [Google Scholar] [CrossRef]
- Whiteley, W.N.; Slot, K.B.; Fernandes, P.; Sandercock, P.; Wardlaw, J. Risk factors for intracranial hemorrhage in acute ischemic stroke patients treated with recombinant tissue plasminogen activator: A systematic review and meta-analysis of 55 studies. Stroke 2012, 43, 2904–2909. [Google Scholar] [CrossRef]
- Tu, H.T.; Campbell, B.C.; Christensen, S.; Desmond, P.M.; De Silva, D.A.; Parsons, M.W.; Churilov, L.; Lansberg, M.G.; Mlynash, M.; Olivot, J.M.; et al. Worse stroke outcome in atrial fibrillation is explained by more severe hypoperfusion, infarct growth, and hemorrhagic transformation. Int. J. Stroke 2015, 10, 534–540. [Google Scholar] [CrossRef]
- Kalinin, M.N.; Khasanova, D.R.; Ibatullin, M.M. The hemorrhagic transformation index score: A prediction tool in middle cerebral artery ischemic stroke. BMC Neurol. 2017, 17, 177. [Google Scholar] [CrossRef] [Green Version]
Publisher’s Note: MDPI stays neutral with regard to jurisdictional claims in published maps and institutional affiliations. |
© 2022 by the authors. Licensee MDPI, Basel, Switzerland. This article is an open access article distributed under the terms and conditions of the Creative Commons Attribution (CC BY) license (https://creativecommons.org/licenses/by/4.0/).