
Limbic Responses to Aversive Visual Stimuli during the Acute and Recovery Phase of Takotsubo Syndrome

 , , , , and
Abstract
:1. Introduction
2. Patients and Methods
3. Results
3.1. Clinical Characteristics
3.2. Group Comparisons
4. Discussion
5. Conclusions
Author Contributions
Funding
Institutional Review Board Statement
Informed Consent Statement
Data Availability Statement
Conflicts of Interest
References
- Jabri, A.; Kalra, A.; Kumar, A.; Alameh, A.; Adroja, S.; Bashir, H.; Nowacki, A.S.; Shah, R.; Khubber, S.; Kanaa, N.A.; et al. Incidence of Stress Cardiomyopathy During the Coronavirus Disease 2019 Pandemic. JAMA Netw. Open 2020, 3, e2014780. [Google Scholar] [CrossRef]
- Dichtl, W.; Tuovinen, N.; Barbieri, F.; Adukauskaite, A.; Senoner, T.; Rubatscher, A.; Hintringer, F.; Siedentopf, C.; Bauer, A.; Gizewski, E.R.; et al. Functional neuroimaging in the acute phase of Takotsubo syndrome: Volumetric and functional changes of the right insular cortex. Clin. Res. Cardiol. 2020, 109, 1107–1113. [Google Scholar] [CrossRef] [PubMed] [Green Version]
- Templin, C.; Hanggi, J.; Klein, C.; Topka, M.S.; Hiestand, T.; Levinson, R.A.; Jurisic, S.; Luscher, T.F.; Ghadri, J.R.; Jancke, L. Altered limbic and autonomic processing supports brain-heart axis in Takotsubo syndrome. Eur. Heart J. 2019, 40, 1183–1187. [Google Scholar] [CrossRef] [PubMed]
- Klein, C.; Hiestand, T.; Ghadri, J.R.; Templin, C.; Jancke, L.; Hanggi, J. Takotsubo Syndrome-Predictable from brain imaging data. Sci. Rep. 2017, 7, 5434. [Google Scholar] [CrossRef] [PubMed] [Green Version]
- Silva, A.R.; Magalhaes, R.; Arantes, C.; Moreira, P.S.; Rodrigues, M.; Marques, P.; Marques, J.; Sousa, N.; Pereira, V.H. Brain functional connectivity is altered in patients with Takotsubo Syndrome. Sci. Rep. 2019, 9, 4187. [Google Scholar] [CrossRef] [Green Version]
- Hiestand, T.; Hanggi, J.; Klein, C.; Topka, M.S.; Jaguszewski, M.; Ghadri, J.R.; Luscher, T.F.; Jancke, L.; Templin, C. Takotsubo syndrome associated with structural brain alterations of the limbic system. J. Am. Coll. Cardiol. 2018, 71, 809–811. [Google Scholar] [CrossRef]
- Pereira, V.H.; Marques, P.; Magalhaes, R.; Portugues, J.; Calvo, L.; Cerqueira, J.J.; Sousa, N. Central autonomic nervous system response to autonomic challenges is altered in patients with a previous episode of Takotsubo cardiomyopathy. Eur. Heart J. Acute Cardiovasc. Care 2016, 5, 152–163. [Google Scholar] [CrossRef] [Green Version]
- Sabisz, A.; Treder, N.; Fijałkowska, M.; Sieminski, M.; Fijałkowska, J.; Naumczyk, P.; Nowak, R.; Jaguszewski, M.; Cwalina, N.; Gruchała, M.; et al. Brain resting state functional magnetic resonance imaging in patients with takotsubo cardiomyopathy an inseparable pair of brain and heart. Int. J. Cardiol. 2016, 224, 376–381. [Google Scholar] [CrossRef]
- Radfar, A.; Abohashem, S.; Osborne, M.T.; Wang, Y.; Dar, T.; Hassan, M.Z.O.; Ghoneem, A.; Naddaf, N.; Patrich, T.; Abbasi, T.; et al. Stress-associated neurobiological activity associates with the risk for and timing of subsequent Takotsubo syndrome. Eur. Heart J. 2021, 42, 1898–1908. [Google Scholar] [CrossRef]
- Suzuki, H.; Takanami, K.; Takase, K.; Shimokawa, H.; Yasuda, S. Reversible increase in stress-associated neurobiological activity in the acute phase of Takotsubo syndrome; a brain 18F-FDG-PET study. Int. J. Cardiol. 2021, 344, 31–33. [Google Scholar] [CrossRef]
- Gianaros, P.J.; Kraynak, T.E.; Kuan, D.C.; Gross, J.J.; McRae, K.; Hariri, A.R.; Manuck, S.B.; Rasero, J.; Verstynen, T.D. Affective brain patterns as multivariate neural correlates of cardiovascular disease risk. Soc. Cogn. Affect. Neurosci. 2020, 15, 1034–1045. [Google Scholar] [CrossRef] [PubMed]
- Cattaneo, M.M.; Pravatà, E.; Provenzi, M.; Moccetti, M.; Kaelin, A.; Sudano, I.; Biasucci, L.; Gallino, C.; Limoni, C.; Calanchini, C.; et al. Role of the central autonomic nervous system intrinsic functional organisation and psychosocial factors in primary microvascular angina and Takotsubo syndrome. Open Heart 2020, 7, e001315. [Google Scholar] [CrossRef] [PubMed]
- Klein, C.; Leipold, S.; Ghadri, J.R.; Jurisic, S.; Hiestand, T.; Hänggi, J.; Lüscher, T.F.; Jäncke, L.; Templin, C. Takotsubo syndrome: How the broken heart deals with negative emotions. Neuroimage Clin. 2020, 25, 102124. [Google Scholar] [CrossRef] [PubMed]
- Lang, P.J.; Bradley, M.M.; Cuthbert, B.N. International Affective Picture System (IAPS): Technical Manual and Affective Ratings; NIMH Center for the Study of Emotion and Attention: Bethesda, MD, USA; University of Florida: Gainesville, FL, USA, 1997. [Google Scholar]
- Lang, P.J.; Bradley, M.M.; Cuthbert, B.N. International Affective Picture System (IAPS): Affective Ratings of Pictures and Instruction Manual; Technical Report A-8; University of Florida: Gainesville, FL, USA, 2008. [Google Scholar]
- Cammann, V.L.; Scheitz, J.F.; von Rennenberg, R.; Jäncke, L.; Nolte, C.H.; Szawan, K.A.; Stengl, H.; Würdinger, M.; Endres, M.; Templin, C.; et al. Clinical correlates and prognostic impact of neurologic disorders in Takotsubo syndrome. Sci. Rep. 2021, 11, 23555. [Google Scholar] [CrossRef] [PubMed]
- Brazdil, V.; Kala, P.; Hudec, M.; Poloczek, M.; Kanovsky, J.; Stipal, R.; Jerabek, P.; Bocek, O.; Pail, M.; Brazdil, M. The role of central autonomic nervous system dysfunction in Takotsubo syndrome: A systematic review. Clin. Auton. Res. 2022, 32, 9–17. [Google Scholar] [CrossRef]
- Suzuki, H.; Yasuda, S.; Shimokawa, H. Brain-heart connection in Takotsubo syndrome before onset. Eur. Heart J. 2021, 42, 1909–1911. [Google Scholar] [CrossRef]
- Frey, A.; Homola, G.A.; Henneges, C.; Muhlbauer, L.; Sell, R.; Kraft, P.; Franke, M.; Morbach, C.; Vogt, M.; Mullges, W.; et al. Temporal changes in total and hippocampal brain volume and cognitive function in patients with chronic heart failure-the COGNITION.MATTERS-HF cohort study. Eur. Heart J. 2021, 42, 1569–1578. [Google Scholar] [CrossRef]
- Marafioti, V.; Turri, G.; Carbone, V.; Monaco, S. Association of prolonged QTc interval with Takotsubo cardiomyopathy: A neurocardiac syndrome inside the mystery of the insula of Reil. Clin. Cardiol. 2018, 41, 551–555. [Google Scholar] [CrossRef]
- Olson, I.R.; Plotzker, A.; Ezzyar, Y. The enigmatic temporal pole: A review of findings on social and emotional processing. Brain 2007, 130, 1718–1731. [Google Scholar] [CrossRef] [Green Version]
- Ghuman, A.S.; Brunet, N.M.; Li, Y.; Konecky, R.O.; Pyles, J.A.; Walls, S.A.; Destefino, V.; Wang, W.; Richardson, R.M. Dynamic encoding of face information in the human fusiform gyrus. Nat. Commun. 2014, 5, 5672. [Google Scholar] [CrossRef] [Green Version]
- Graff-Radford, J.; Williams, L.; Jones, D.T.; Benarroch, E.E. Caudate nucleus as a component of networks controlling behavior. Neurology 2017, 89, 2192–2197. [Google Scholar] [CrossRef] [PubMed]
- Laowattana, S.; Zeger, S.L.; Lima, J.A.; Goodman, S.N.; Wittstein, I.S.; Oppenheimer, S.M. Left insular stroke is associated with adverse cardiac outcome. Neurology 2006, 66, 477–483. [Google Scholar] [CrossRef] [PubMed]
- Pozzi, G.; D’Amario, D.; Princi, G.; Ciliberti, G.; Irano, A.; Simone, M.V.; Crea, F.; Galiuto, L. Pre-existing psychiatric morbidity Is strongly associated to Takotsubo syndrome: A case-control study. Front. Cardiovasc. Med. 2022, 12, 925459. [Google Scholar] [CrossRef] [PubMed]
- Ritchey, M.; Dolcos, F.; Eddington, K.M.; Strauman, T.J.; Cabeza, R. Neural correlates of emotional processing in depression: Changes with cognitive behavioral therapy and predictors of treatment response. J. Psychiatr. Res. 2011, 45, 577–587. [Google Scholar] [CrossRef]


| TTS (N = 19) | MI (N = 15) | HC (N = 15) | P (TTS vs. MI/TTS vs. HC) | |
|---|---|---|---|---|
| Age, years | 68.3 ± 8.1 | 64.9 ± 7.2 | 62.5 ± 10.2 | 0.037/0.11 |
| Heart rate, beats/min | 80.5 ± 12.4 | 69.8 ± 12.7 | 66.9 ± 7.2 | 0.009/<0.001 |
| Body mass index | 25.3 ± 4.0 | 25.3 ± 5.3 | 24.6 ± 2.7 | 0.484/0.285 |
| Serum creatinine, mg/dL | 0.77 ± 0.12 | 0.82 ± 0.15 | 0.95 ± 0.29 | 0.16/0.0108 |
| Troponin T, ng/L (peak) | 512.9 ± 472.8 | 4177.2 ± 4721.1 | 6.9 ± 2.3 | 0.001/<0.001 |
| NT-proBNP, ng/L (peak) | 3018 ± 3053 | 2049 ± 4040 | 195 ± 137 | 0.235/<0.001 |
| LVEF, % | 50.3 ± 14.8 | 49.9 ± 11.7 | 58.4 ± 4.4 | 0.475/0.026 |
| Medical history | ||||
| Arterial hypertension | 12 (63.2) | 10 (66.6) | 9 (60.0) | 0.419/0.428 |
| Diabetes mellitus | 2 (10.5) | 0 (0) | 0 (0) | - |
| Hyperlipidemia | 11 (57.9) | 11 (73.3) | 8 (53.3) | 0.182/0.399 |
| COPD | 1 (5.3) | 0 (0) | 0 (0) | - |
| Peripheral artery disease | 1 (5.3) | 0 (0) | 0 (0) | - |
| Group Contrast | Number of Voxels | MNI Coordinate | Region | T Value | p Value |
|---|---|---|---|---|---|
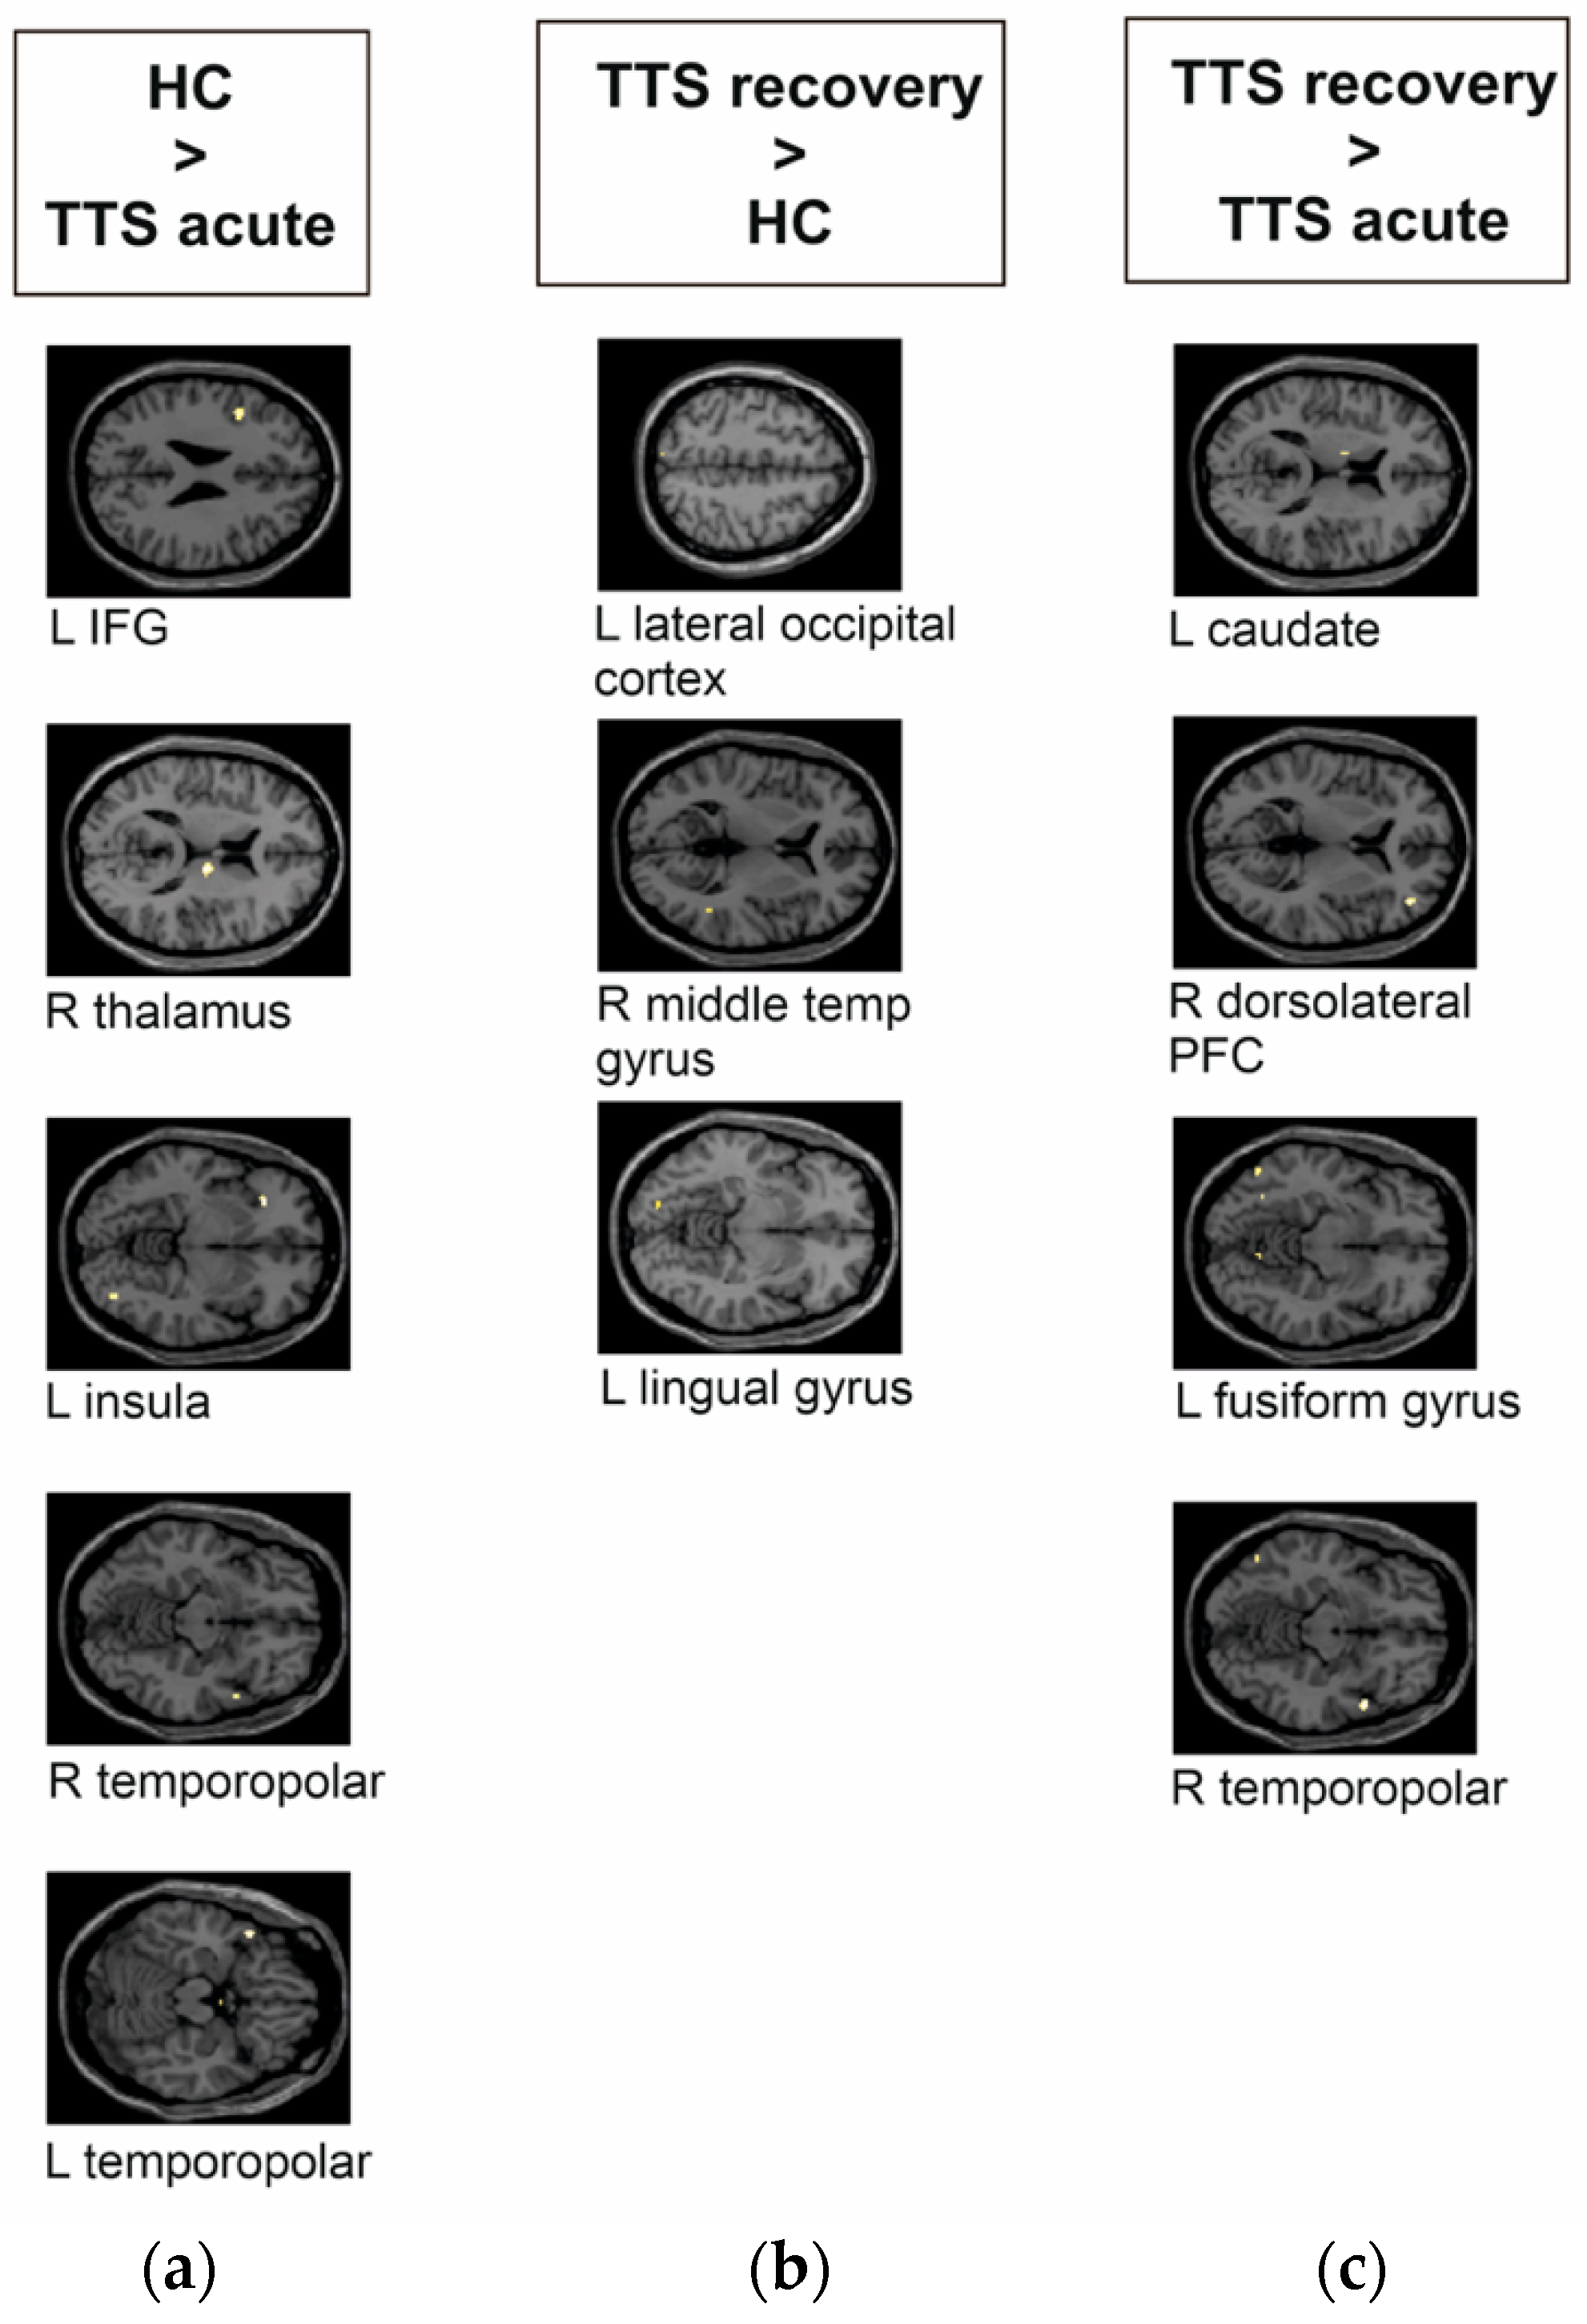
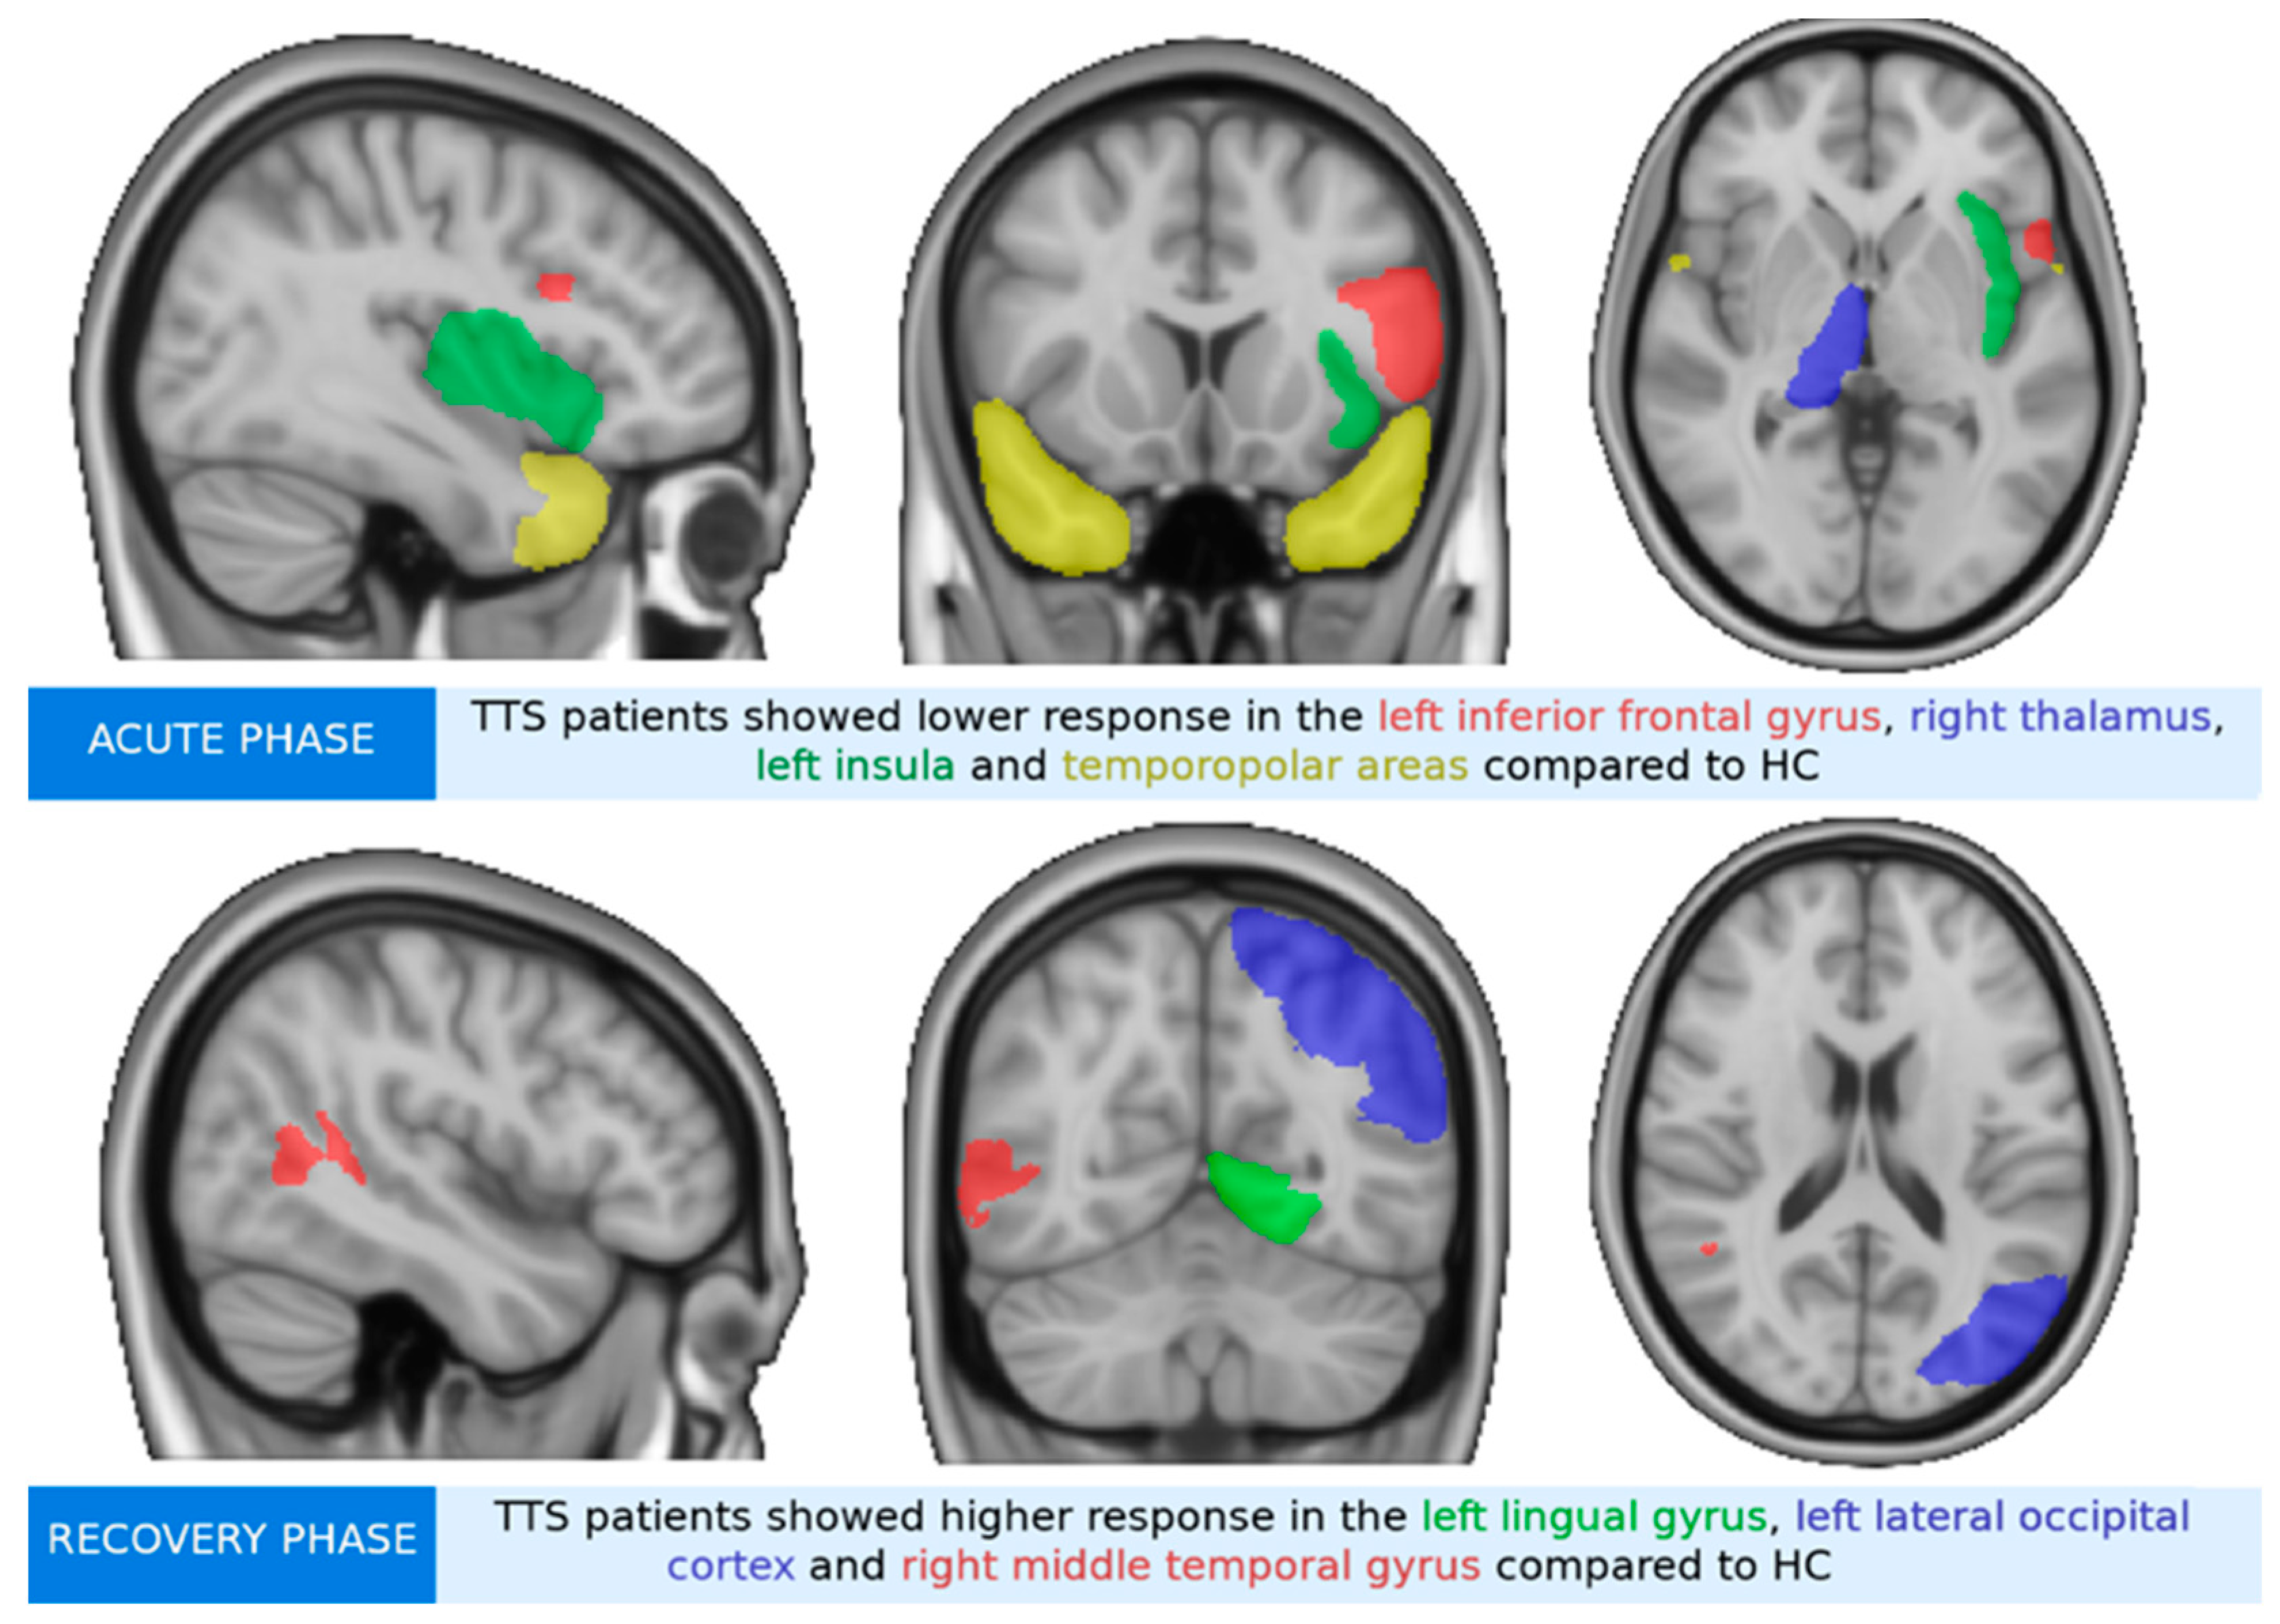
| TTS acute phase < HC | 40 | −42, 12, 26 | L IFG | 3.86 | 0.000 |
| 39 | 14, −12, 14 | R thalamus | 4.21 | 0.000 | |
| 26 | −28, 28, −6 | L insula | 4.15 | 0.000 | |
| 13 | −46, 18, −18 | L temporopolar | 4.19 | 0.000 | |
| 6 | 56, 10, −12 | R temporopolar | 3.62 | 0.001 | |
| TTS recovery phase > HC | 5 | −16, −84, −8 | L lingual gyrus | 3.67 | 0.001 |
| 5 | −8, −80, 52 | L lateral occipital cortex | 3.55 | 0.001 | |
| 2 | 46, −46, 6 | R middle temporal gyrus | 3.59 | 0.001 | |
| TTS recovery phase > TTS acute phase | 25 | 42, 44, 6 | R dorsolateral PFC | 4.24 | 0.000 |
| 19 | 56, 10, −12 | R temporopolar | 4.14 | 0.000 | |
| 9 | −12, −4, 14 | L caudate | 3.65 | 0.001 | |
| 8 | −52, −66, −10 | L fusiform gyrus | 3.67 | 0.001 |
| Group Contrast | Number of Voxels | MNI Coordinate | Region | T Value | p Value |
|---|---|---|---|---|---|
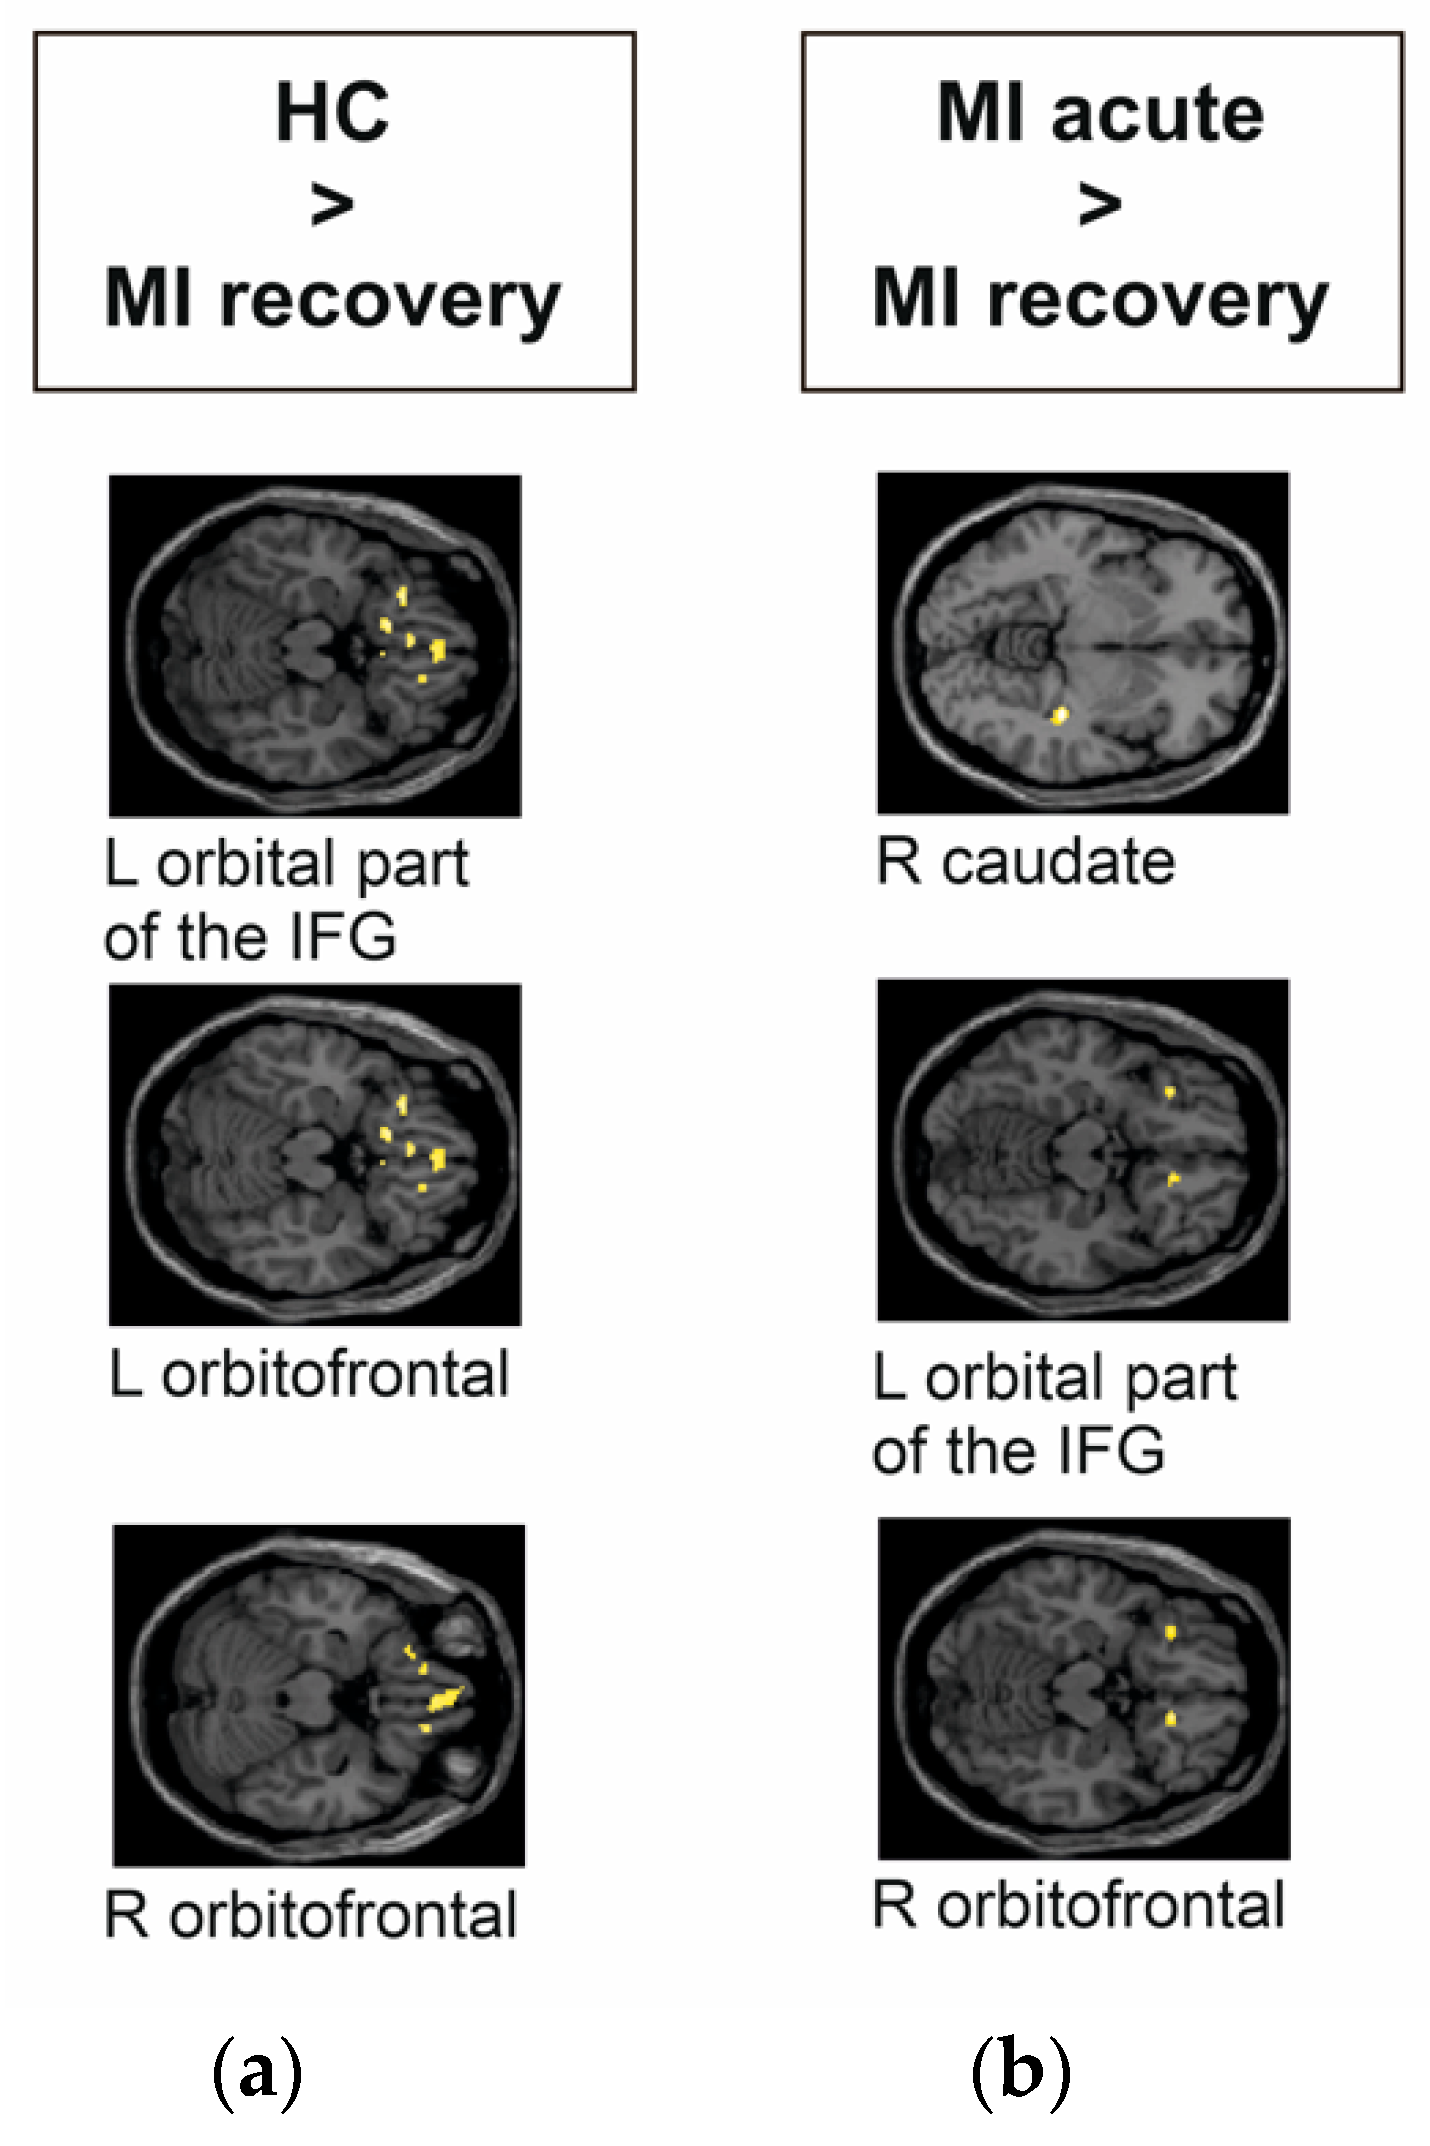
| HC > MI recovery phase | 122 | 2, 44, −22 | R orbitofrontal | 3.82 | 0.000 |
| 55 | −26, 28, −18 | L orbital part of the IFG | 4.21 | 0.000 | |
| 33 | −26, 28, −18 | L orbitofrontal | 4.22 | 0.000 | |
| MI acute phase > MI recovery phase | 45 | 34, −30, −7 | R caudate | 5.50 | 0.000 |
| 45 | −30, 28, −14 | L orbital part of the IFG | 4.53 | 0.000 | |
| 29 | 14, 28, −16 | R orbitofrontal | 4.78 | 0.000 |
| Group Contrast | Number of Voxels | MNI Coordinate | Region | T Value | p Value |
|---|---|---|---|---|---|
| MI acute phase > TTS acute phase | 33 | 52, −52, 16 | R angular gyrus | 4.06 | 0.000 |
| 22 | 42, 24, 22 | R dorsolateral PFC | 3.97 | 0.000 | |
| 16 | −48, 22, 30 | L dorsolateral PFC | 3.82 | 0.000 | |
| 14 | −30, 28, −12 | L orbital part of the IFG | 4.13 | 0.000 | |
| TTS recovery phase > MI recovery phase | 168 | −12, 16, −18 | L orbitofrontal area | 5.06 | 0.000 |
| 86 | 40, 14, −30 | R temporopolar | 5.84 | 0.000 | |
| 51 | −32, 28, −14 | L orbital part of the IFG | 4.03 | 0.000 | |
| 30 | −46, 0, 0 | L insula | 4.07 | 0.000 | |
| 27 | 42, 0, 8 | R insula | 4.30 | 0.000 | |
| 13 | 32, 60, −10 | R anterior PFC | 4.13 | 0.000 | |
| 9 | 16, 28, −16 | R orbitofrontal area | 3.85 | 0.000 | |
| 6 | −14, −26, 8 | L thalamus | 3.76 | 0.000 |
Publisher’s Note: MDPI stays neutral with regard to jurisdictional claims in published maps and institutional affiliations. |
© 2022 by the authors. Licensee MDPI, Basel, Switzerland. This article is an open access article distributed under the terms and conditions of the Creative Commons Attribution (CC BY) license (https://creativecommons.org/licenses/by/4.0/).
Share and Cite
Steiger, R.; Tuovinen, N.; Adukauskaite, A.; Senoner, T.; Spitaler, P.; Bilgeri, V.; Dabkowska-Mika, A.; Siedentopf, C.; Bauer, A.; Gizewski, E.R.; et al. Limbic Responses to Aversive Visual Stimuli during the Acute and Recovery Phase of Takotsubo Syndrome. J. Clin. Med. 2022, 11, 4891. https://doi.org/10.3390/jcm11164891
Steiger R, Tuovinen N, Adukauskaite A, Senoner T, Spitaler P, Bilgeri V, Dabkowska-Mika A, Siedentopf C, Bauer A, Gizewski ER, et al. Limbic Responses to Aversive Visual Stimuli during the Acute and Recovery Phase of Takotsubo Syndrome. Journal of Clinical Medicine. 2022; 11(16):4891. https://doi.org/10.3390/jcm11164891
Chicago/Turabian StyleSteiger, Ruth, Noora Tuovinen, Agne Adukauskaite, Thomas Senoner, Philipp Spitaler, Valentin Bilgeri, Agnieszka Dabkowska-Mika, Christian Siedentopf, Axel Bauer, Elke Ruth Gizewski, and et al. 2022. "Limbic Responses to Aversive Visual Stimuli during the Acute and Recovery Phase of Takotsubo Syndrome" Journal of Clinical Medicine 11, no. 16: 4891. https://doi.org/10.3390/jcm11164891
APA StyleSteiger, R., Tuovinen, N., Adukauskaite, A., Senoner, T., Spitaler, P., Bilgeri, V., Dabkowska-Mika, A., Siedentopf, C., Bauer, A., Gizewski, E. R., Hofer, A., Barbieri, F., & Dichtl, W. (2022). Limbic Responses to Aversive Visual Stimuli during the Acute and Recovery Phase of Takotsubo Syndrome. Journal of Clinical Medicine, 11(16), 4891. https://doi.org/10.3390/jcm11164891