
Health-Related Quality of Life of Patients Treated with Biological Agents and New Small-Molecule Drugs for Moderate to Severe Crohn’s Disease: A Systematic Review


Abstract
:1. Introduction
2. Methods
2.1. Objective
2.2. The HRQoL Scales
2.3. Inclusion and Exclusion Criteria
2.4. Search Strategy
2.5. Data Extraction
2.6. Risk of Bias Assessment
2.7. Strategy for Data Synthesis
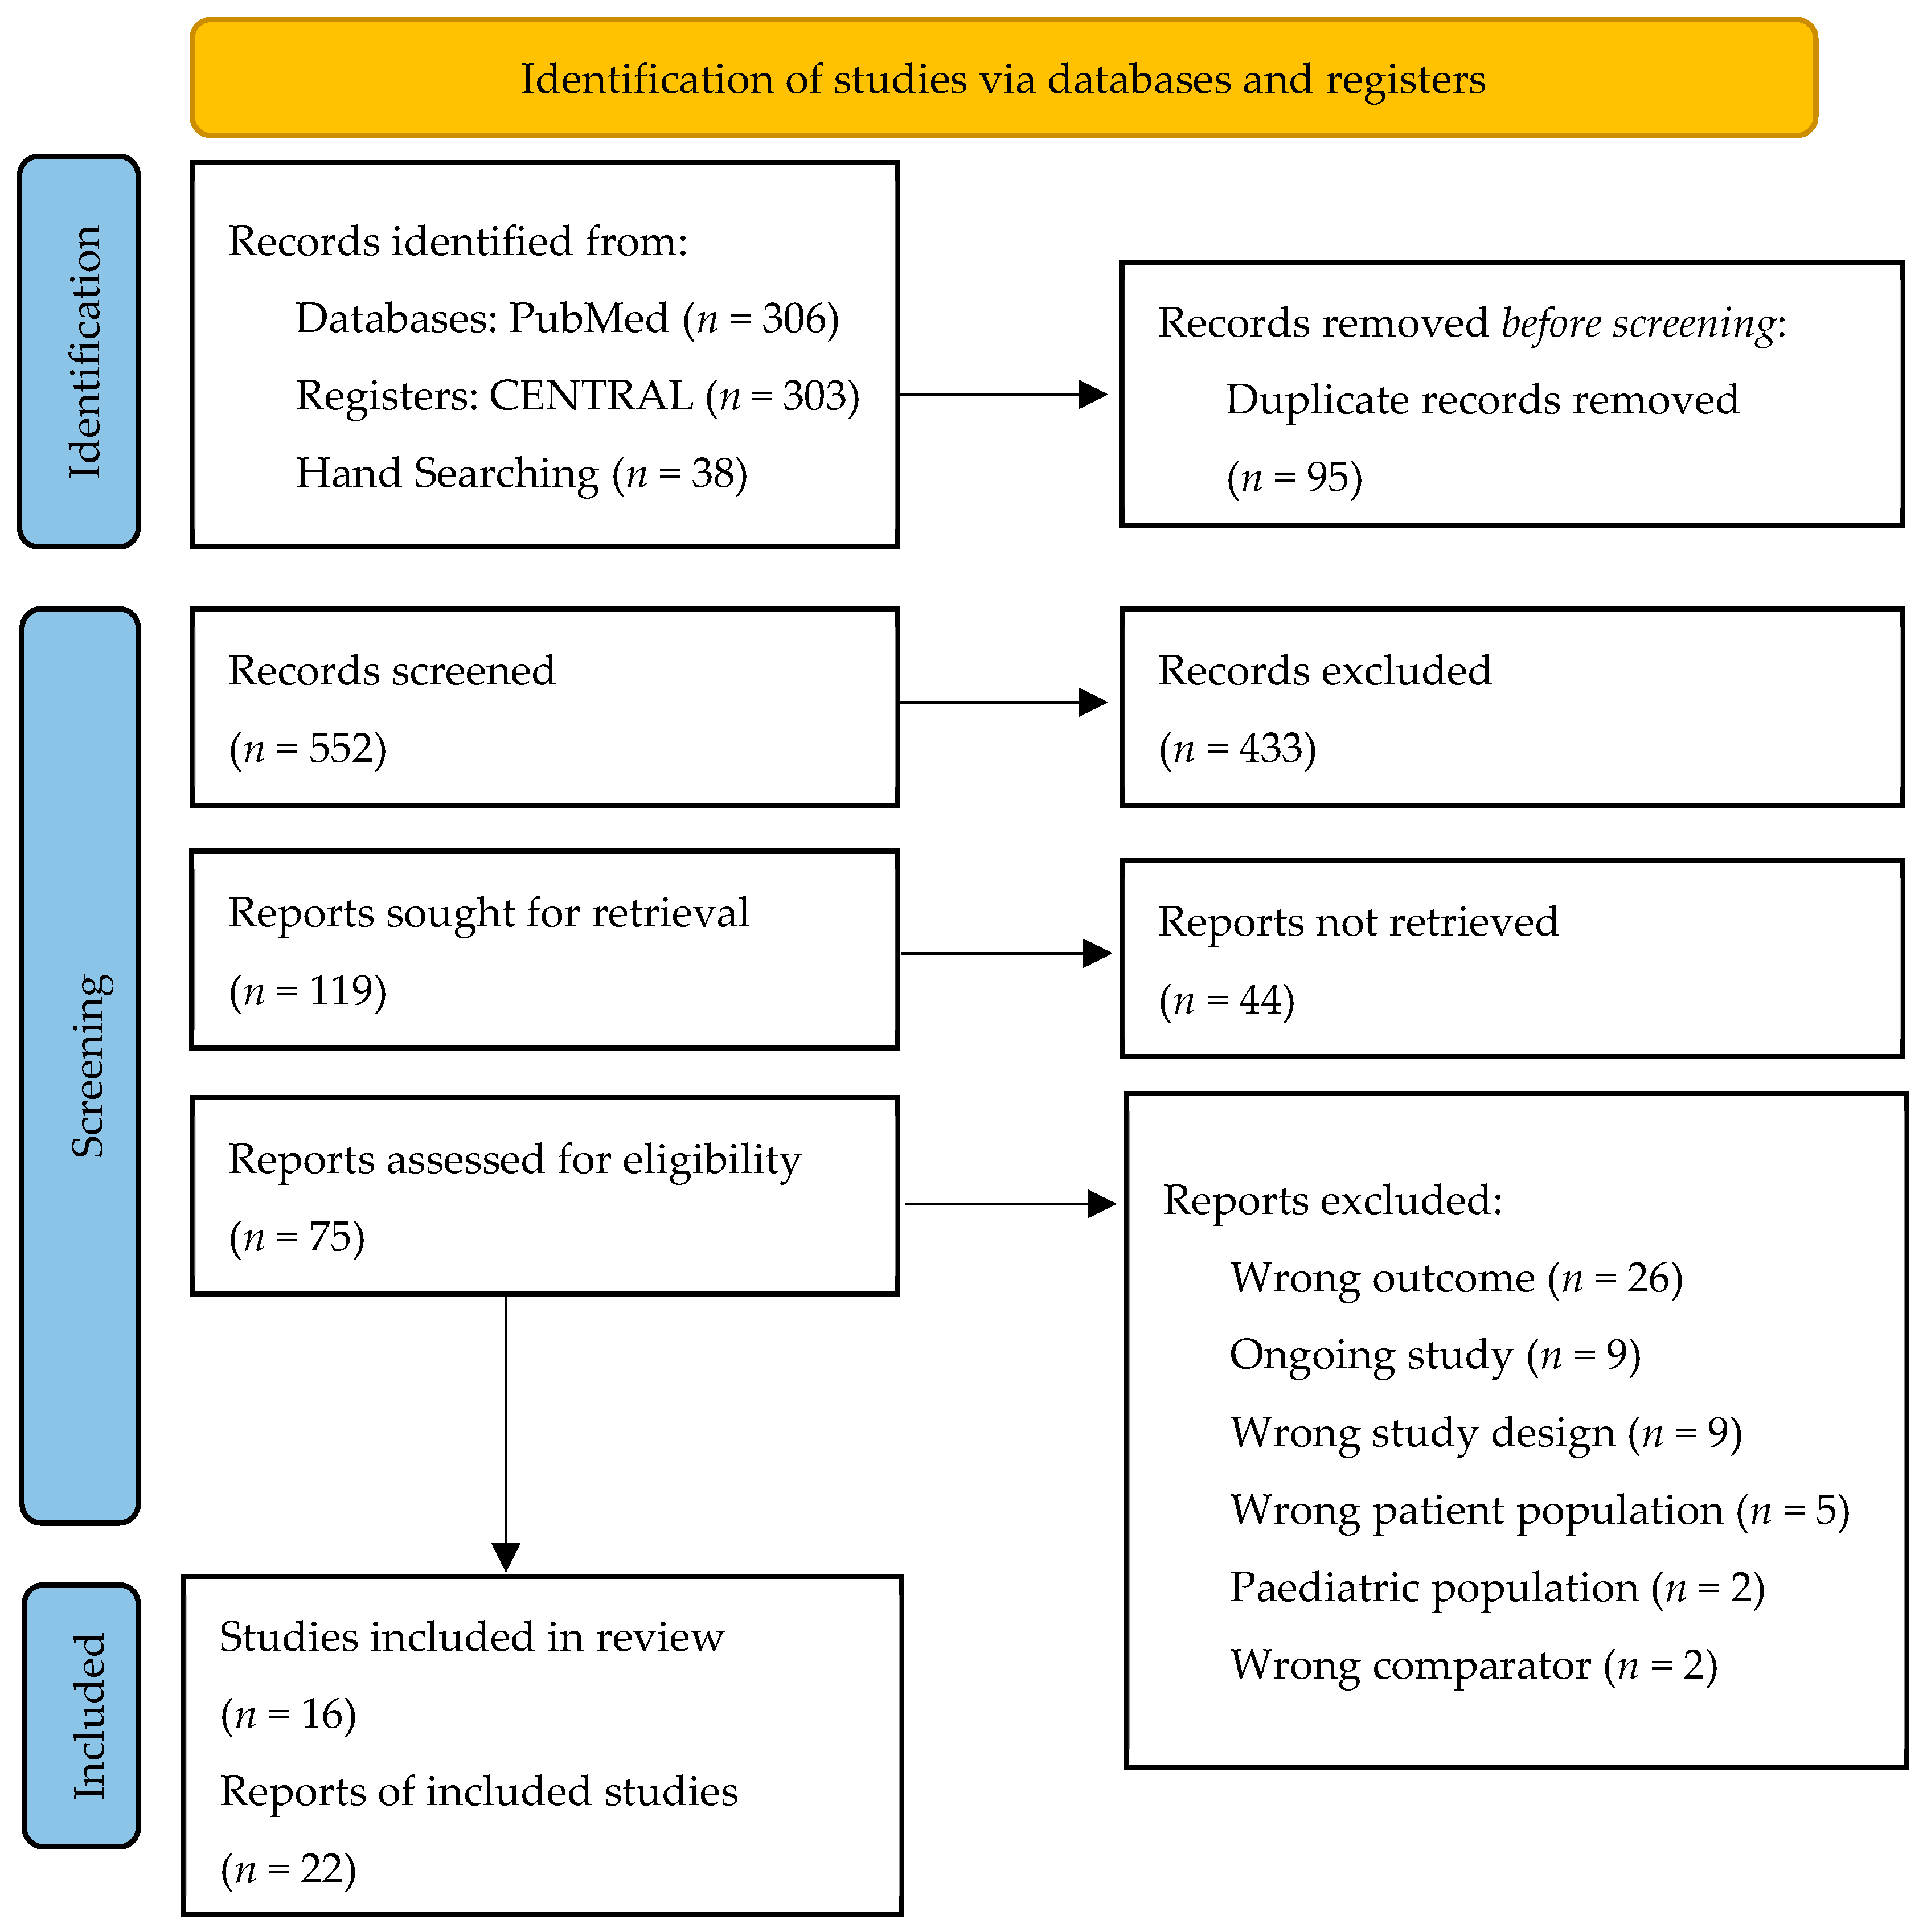
3. Results
3.1. Characteristics of the Included Studies
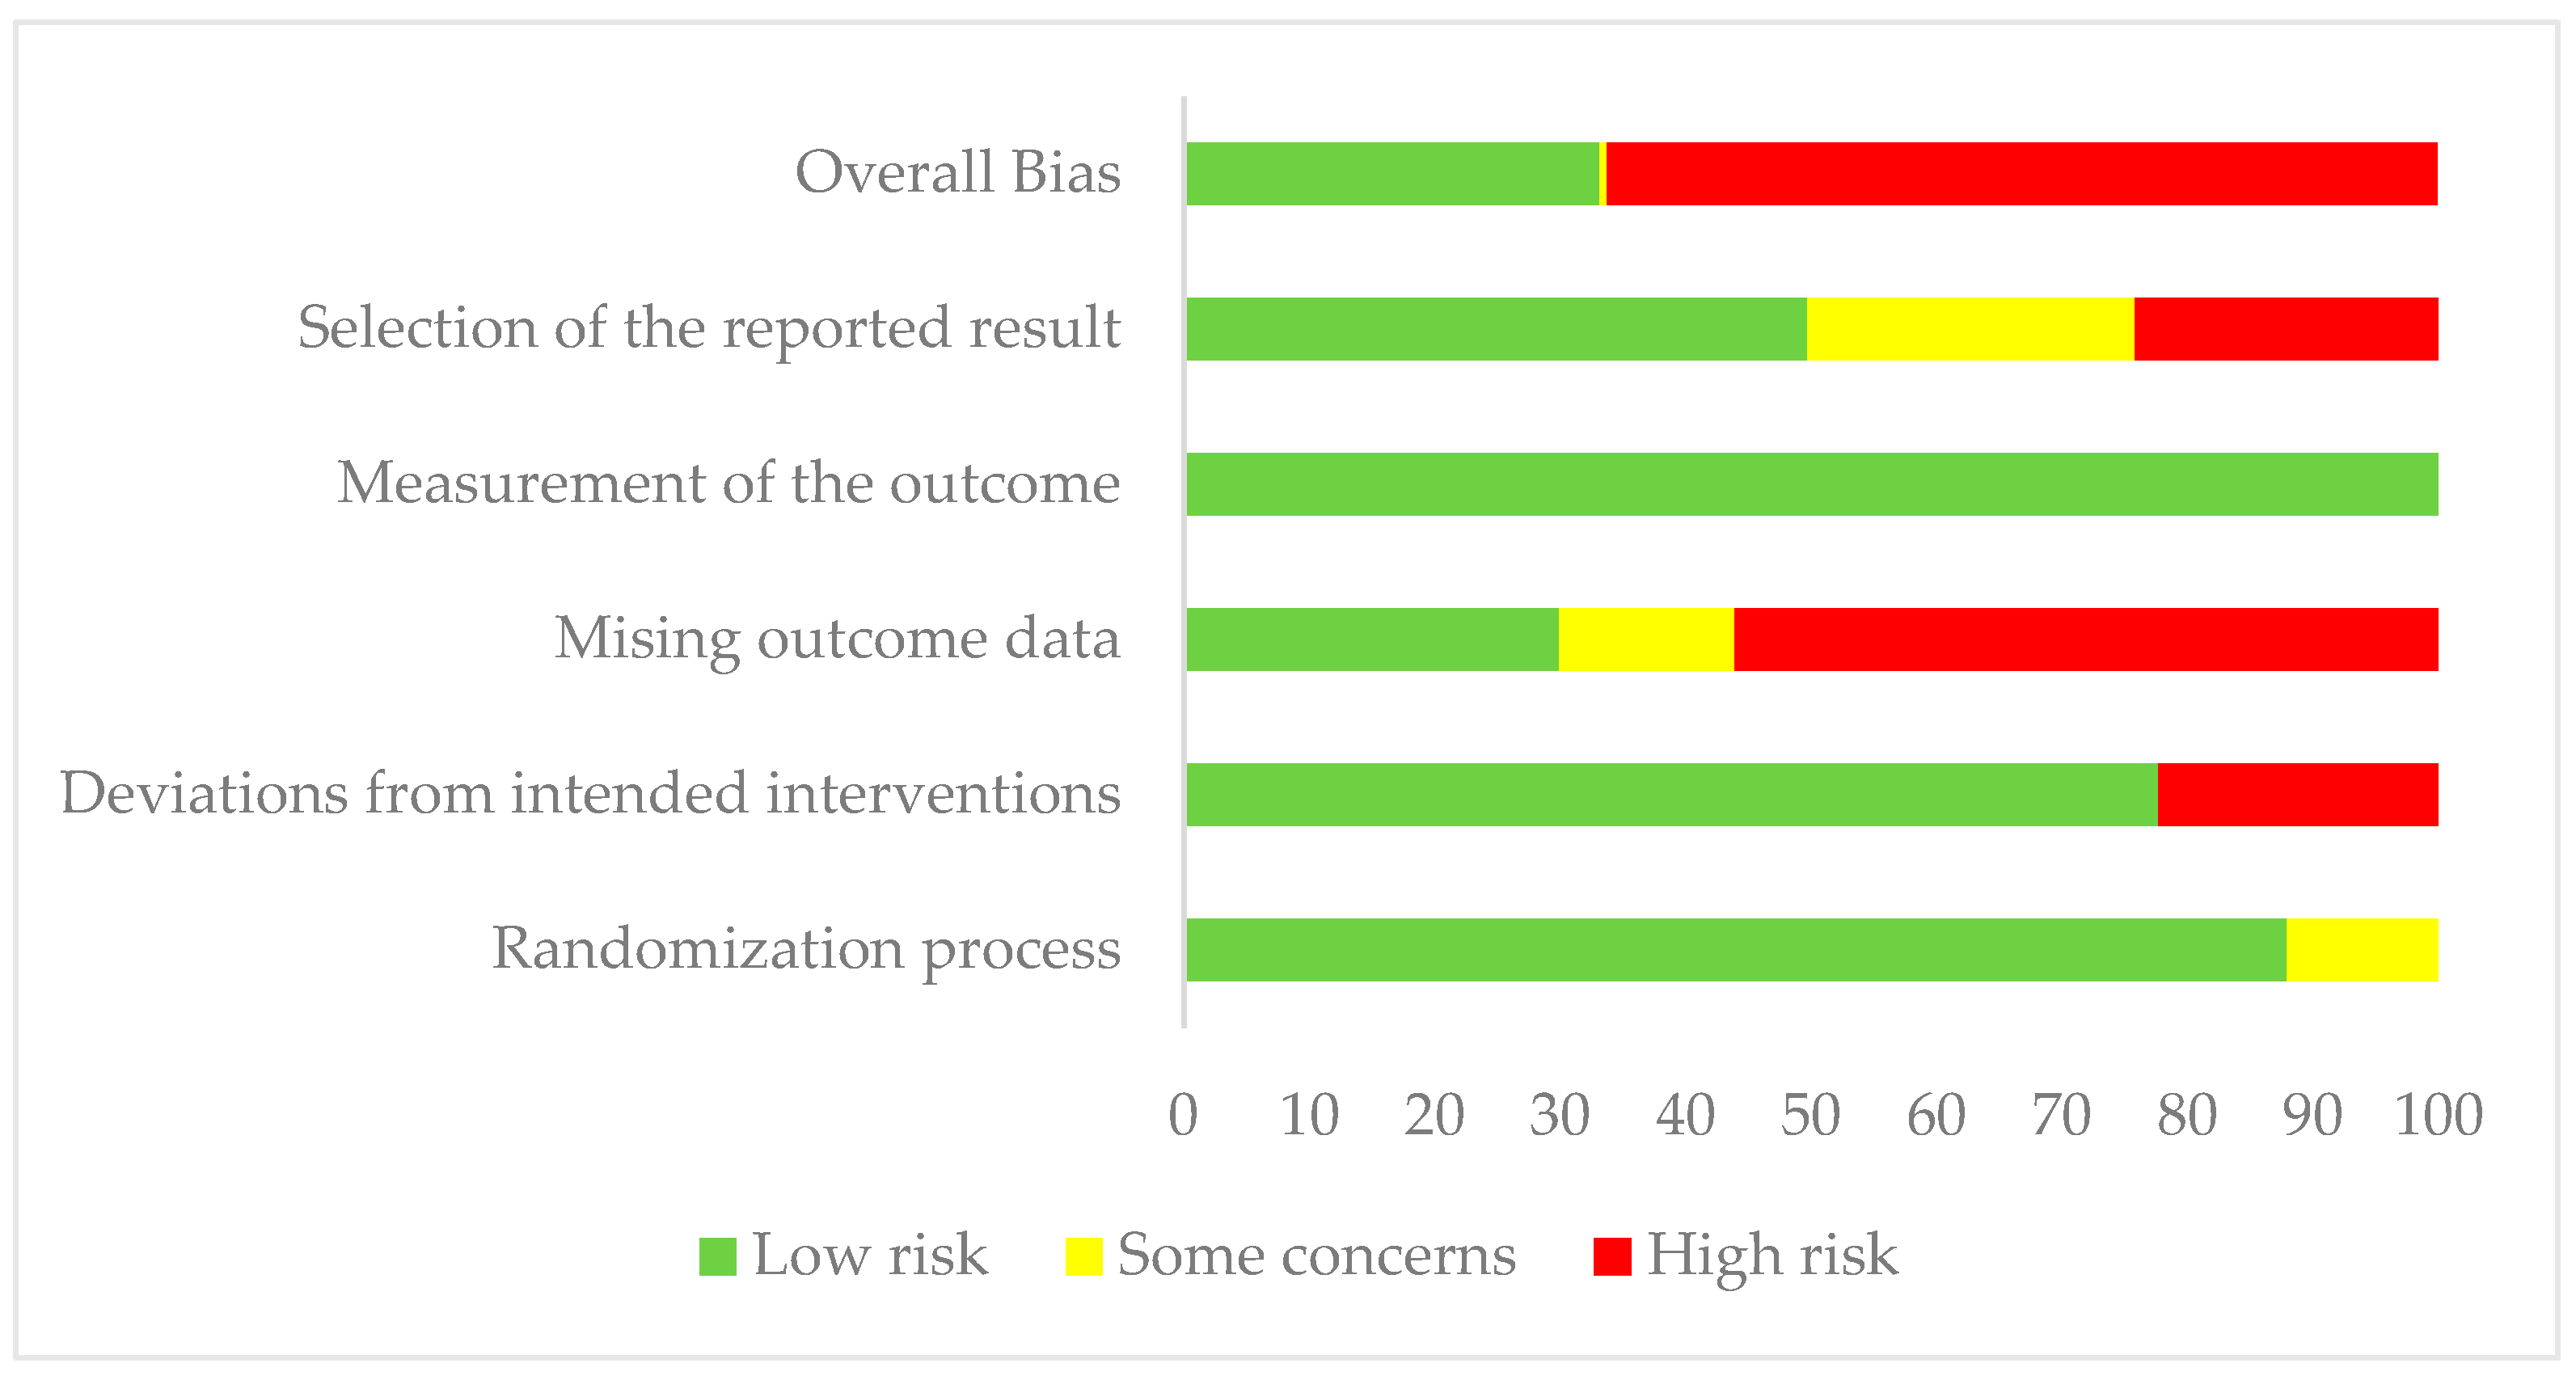
3.2. Risk of Bias
3.3. Effect of Interventions on HRQoL
3.3.1. Infliximab vs. Azathioprine
3.3.2. Infliximab vs. Placebo
3.3.3. Adalimumab vs. Placebo
3.3.4. Certolizumab Pegol vs. Placebo
3.3.5. Ustekinumab vs. Placebo
3.3.6. Natalizumab vs. Placebo
3.3.7. Filgotinib vs. Placebo
3.3.8. Upadacitinib vs. Placebo
3.3.9. Tofacitinib vs. Placebo
3.3.10. Apilimod Mesylate vs. Placebo
4. Discussion
5. Limitations
6. Conclusions
Supplementary Materials
Author Contributions
Funding
Institutional Review Board Statement
Informed Consent Statement
Data Availability Statement
Acknowledgments
Conflicts of Interest
Appendix A

| Population | Crohn Disease Crohn * |
|---|---|
| Intervention/Control |
|
| Outcome |
Quality of life “Health related quality of life” HRQOLQoLIBDQ “Inflammatory bowel disease questionnaire” SF-36 “36-item Short-Form Health Survey” |
Appendix A.1. PubMed (n = 306) 25 January 2022
Appendix A.2. CENTRAL
| Date Run: | 25 January 2022 04:24:08 | |
| Comment: | ||
| ID | Search | Hits |
| #1 | MeSH descriptor: [Crohn Disease] explode all trees | 1700 |
| #2 | (crohn*):ti,ab,kw | 5202 |
| #3 | (“36-item Short-Form Health Survey”):ti,ab,kw | 1418 |
| #4 | (“SF-36”):ti,ab,kw | 11,356 |
| #5 | (“SF-36v2”):ti,ab,kw | 447 |
| #6 | (“SF-36 v2”):ti,ab,kw | 93 |
| #7 | (“Inflammatory bowel disease questionnaire”):ti,ab,kw | 424 |
| #8 | (“IBDQ”):ti,ab,kw | 550 |
| #9 | (“Health related quality of life”):ti,ab,kw | 18,967 |
| #10 | (“HRQoL”):ti,ab,kw | 6295 |
| #11 | (“QoL”):ti,ab,kw | 22,738 |
| #12 | (“Quality of Life”):ti,ab,kw | 124,127 |
| #13 | MeSH descriptor: [Quality of Life] explode all trees | 27,298 |
| #14 | #1 OR #2 | 5202 |
| #15 | #3 OR #4 OR #5 OR #6 OR #7 OR #8 OR #9 OR #10 OR #11 OR #12 OR #13 | 131,938 |
| #16 | MeSH descriptor: [Janus Kinase Inhibitors] explode all trees | 76 |
| #17 | MeSH descriptor: [Infliximab] explode all trees | 776 |
| #18 | MeSH descriptor: [Tumor Necrosis Factor-alpha] explode all trees | 3196 |
| #19 | MeSH descriptor: [Adalimumab] explode all trees | 820 |
| #20 | MeSH descriptor: [Certolizumab Pegol] explode all trees | 184 |
| #21 | MeSH descriptor: [Antibodies, Monoclonal] explode all trees | 14,870 |
| #22 | MeSH descriptor: [Ustekinumab] explode all trees | 227 |
| #23 | MeSH descriptor: [Natalizumab] explode all trees | 90 |
| #24 | MeSH descriptor: [Integrin alpha4] explode all trees | 25 |
| #25 | (“jak inhibitor”):ti,ab,kw | 437 |
| #26 | (“anti alpha4”):ti,ab,kw | 4 |
| #27 | (“sphingosine 1 phosphate”):ti,ab,kw | 307 |
| #28 | (“etrasimod”):ti,ab,kw | 53 |
| #29 | (“ozanimod”):ti,ab,kw | 125 |
| #30 | (“ontamalimab”):ti,ab,kw | 5 |
| #31 | (“deucravacitinib”):ti,ab,kw | 11 |
| #32 | (“td 1473”):ti,ab,kw | 14 |
| #33 | (“upadacitinib”):ti,ab,kw | 423 |
| #34 | (“Filgotinib”):ti,ab,kw | 242 |
| #35 | (“spesolimab”):ti,ab,kw | 10 |
| #36 | (“guselkumab”):ti,ab,kw | 369 |
| #37 | (“brazikumab”):ti,ab,kw | 10 |
| #38 | (“mirikizumab”):ti,ab,kw | 100 |
| #39 | (“risankizumab”):ti,ab,kw | 159 |
| #40 | (“abrilumab”):ti,ab,kw | 7 |
| #41 | (“etrolizumab”):ti,ab,kw | 61 |
| #42 | (“Natalizumab”):ti,ab,kw | 433 |
| #43 | (“vedolizumab”):ti,ab,kw | 460 |
| #44 | (“Ustekinumab”):ti,ab,kw | 981 |
| #45 | (“Certolizumab Pegol”):ti,ab,kw | 667 |
| #46 | (“Adalimumab”):ti,ab,kw | 3532 |
| #47 | (“Infliximab”):ti,ab,kw | 2501 |
| #48 | (“tnf-alpha inhibitor”):ti,ab,kw | 55 |
| #49 | MeSH descriptor: [Interleukin-23] explode all trees | 100 |
| #50 | MeSH descriptor: [Interleukin-23 Subunit p19] explode all trees | 21 |
| #51 | MeSH descriptor: [Interleukin-12 Subunit p40] explode all trees | 19 |
| #52 | (“Infliximab-qbtx”):ti,ab,kw | 0 |
| #53 | #16 OR #17 OR #18 OR #19 OR #20 OR #21 OR #22 OR #23 OR #24 OR #25 OR #26 OR #27 OR #28 OR #29 OR #30 OR #31 OR #32 OR #33 OR #34 OR #35 OR #36 OR #37 OR #38 OR #39 OR #40 OR #41 OR #42 OR #43 OR #44 OR #45 OR #46 OR #47 OR #48 OR #49 OR #50 OR #51 OR #52 | 24,764 |
| #54 | #14 AND #15 AND #53 | 312 (303 trials) |
References
- Jawad, N.; Direkze, N.; Leedham, S.J. Inflammatory bowel disease and colon cancer. In Inflammation and Gastrointestinal Cancers; Springer: Berlin/Heidelberg, Germany, 2011; pp. 99–115. [Google Scholar]
- Keller, D.; Windsor, A.; Cohen, R.; Chand, M. Colorectal cancer in inflammatory bowel disease: Review of the evidence. Tech. Coloproctol. 2019, 23, 3–13. [Google Scholar] [CrossRef] [PubMed]
- Guraya, S.Y. Pattern, stage, and time of recurrent colorectal cancer after curative surgery. Clin. Colorectal Cancer 2019, 18, e223–e228. [Google Scholar] [CrossRef] [PubMed]
- Guraya, S.Y.; Murshid, K.R. Malignant duodenocolic fistula. Various therapeutic surgical modalities. Saudi Med. J. 2004, 25, 1111–1114. [Google Scholar] [PubMed]
- Casellas, F.; López-Vivancos, J.; Casado, A.; Malagelada, J.R. Factors affecting health related quality of life of patients with inflammatory bowel disease. Qual. Life Res. 2002, 11, 775–781. [Google Scholar] [CrossRef] [PubMed]
- Min Ho, P.Y.; Hu, W.; Lee, Y.Y.; Gao, C.; Tan, Y.Z.; Cheen, H.H.; Wee, H.L.; Lim, T.G.; Ong, W.C. Health-related quality of life of patients with inflammatory bowel disease in Singapore. Intest. Res. 2019, 17, 107–118. [Google Scholar] [CrossRef] [Green Version]
- Moradkhani, A.; Beckman, L.J.; Tabibian, J.H. Health-related quality of life in inflammatory bowel disease: Psychosocial, clinical, socioeconomic, and demographic predictors. J. Crohns. Colitis 2013, 7, 467–473. [Google Scholar] [CrossRef] [Green Version]
- Umanskiy, K.; Fichera, A. Health related quality of life in inflammatory bowel disease: The impact of surgical therapy. World J. Gastroenterol. 2010, 16, 5024–5034. [Google Scholar] [CrossRef]
- Guyatt, G.; Mitchell, A.; Irvine, E.J.; Singer, J.; Williams, N.; Goodacre, R.; Tompkins, C. A new measure of health status for clinical trials in inflammatory bowel disease. Gastroenterology 1989, 96, 804–810. [Google Scholar] [CrossRef]
- Irvine, E.; Zhou, Q.; Thompson, A. The Short Inflammatory Bowel Disease Questionnaire: A Quality of Life Instrument for Community Physicians Managing Inflammatory Bowel Disease. Am. J. Gastroenterol. 1996, 91, 1571–1578. [Google Scholar]
- Drossman, D.A.; Leserman, J.; Li, Z.; Mitchell, C.M.; Zagami, E.A.; Patrick, D.L. The rating form of IBD patient concerns: A new measure of health status. Psychosom. Med. 1991, 53, 701–712. [Google Scholar] [CrossRef]
- Bergner, M.; Bobbitt, R.A.; Carter, W.B.; Gilson, B.S. The Sickness Impact Profile: Development and final revision of a health status measure. Med. Care 1981, 19, 787–805. [Google Scholar] [CrossRef]
- Rutgeerts, P.; Feagan, B.G.; Lichtenstein, G.R.; Mayer, L.F.; Schreiber, S.; Colombel, J.F.; Rachmilewitz, D.; Wolf, D.C.; Olson, A.; Bao, W. Comparison of scheduled and episodic treatment strategies of infliximab in Crohn’s disease. Gastroenterology 2004, 126, 402–413. [Google Scholar] [CrossRef] [Green Version]
- Bouguen, G.; Levesque, B.G.; Feagan, B.G.; Kavanaugh, A.; Peyrin–Biroulet, L.; Colombel, J.F.; Hanauer, S.B.; Sandborn, W.J. Treat to target: A proposed new paradigm for the management of Crohn’s disease. Clin. Gastroenterol. Hepatol. 2015, 13, 1042–1050. [Google Scholar] [CrossRef] [PubMed] [Green Version]
- Turner, D.; Ricciuto, A.; Lewis, A.; D’Amico, F.; Dhaliwal, J.; Griffiths, A.M.; Bettenworth, D.; Sandborn, W.J.; Sands, B.E.; Reinisch, W.; et al. STRIDE-II: An Update on the Selecting Therapeutic Targets in Inflammatory Bowel Disease (STRIDE) Initiative of the International Organization for the Study of IBD (IOIBD): Determining Therapeutic Goals for Treat-to-Target strategies in IBD. Gastroenterology 2021, 160, 1570–1583. [Google Scholar] [CrossRef] [PubMed]
- Food and Drug Administration. Definition of Biological Products. Silver Spring: Food and Drug Administration. 2022. Available online: https://www.fda.gov/files/drugs/published/Biological-Product-Definitions.pdf (accessed on 25 January 2022).
- Gade, A.K.; Douthit, N.T.; Townsley, E. Medical Management of Crohn’s Disease. Cureus 2020, 12, e8351. [Google Scholar] [CrossRef] [PubMed]
- D’Amico, F.; Peyrin-Biroulet, L.; Danese, S.; Fiorino, G. New drugs in the pipeline for the treatment of inflammatory bowel diseases: What is coming? Curr. Opin. Pharm. 2020, 55, 141–150. [Google Scholar] [CrossRef]
- Vogelaar, L.; Spijker, A.V.; van der Woude, C.J. The impact of biologics on health-related quality of life in patients with inflammatory bowel disease. Clin. Exp. Gastroenterol. 2009, 2, 101–109. [Google Scholar] [CrossRef] [Green Version]
- Williet, N.; Sandborn, W.J.; Peyrin-Biroulet, L. Patient-reported outcomes as primary end points in clinical trials of inflammatory bowel disease. Clin. Gastroenterol. Hepatol. 2014, 12, 1246–1256.e1246. [Google Scholar] [CrossRef]
- Irvine, E.J.; Feagan, B.; Rochon, J.; Archambault, A.; Fedorak, R.N.; Groll, A.; Kinnear, D.; Saibil, F.; McDonald, J.W. Quality of life: A valid and reliable measure of therapeutic efficacy in the treatment of inflammatory bowel disease. Canadian Crohn’s Relapse Prevention Trial Study Group. Gastroenterology 1994, 106, 287–296. [Google Scholar] [CrossRef]
- Lefebvre, C.; Glanville, J.; Briscoe, S.; Featherstone, R.; Littlewood, A.; Marshall, C.; Metzendorf, M.-I.; Noel-Storr, A.; Paynter, R.; Rader, T.; et al. Chapter 4: Searching for and selecting studies. In Cochrane Handbook for Systematic Reviews of Interventions Version 6.3; Higgins, J.P.T., Thomas, J., Chandler, J., Cumpston, M., Li, T., Page, M.J., Welch, V.A., Eds.; Cochrane: Hoboken, NJ, USA, 2022; (updated February 2022); Available online: www.training.cochrane.org/handbook (accessed on 20 January 2022).
- Lefebvre, C.; Glanville, J.; Manheimer, E. Chapter 6: Searching for studies. In Cochrane Handbook for Systematic Reviews of Interventions Version 5.1; Higgins, J.P.T., Green, S., Eds.; Cochrane: Hoboken, NJ, USA, 2022; (updated March 2011); Available online: https://handbook-5-1.cochrane.org/chapter_6/6_4_11_1_the_cochrane_highly_sensitive_search_strategies_for.htm (accessed on 20 January 2022).
- Sterne, J.A.C.; Page, M.J.; Elbers, R.G.; Blencowe, N.S.; Boutron, I.; Cates, C.J.; Cheng, H.-Y.; Corbett, M.S.; Eldridge, S.M.; Hernán, M.A.; et al. RoB 2: A revised tool for assessing risk of bias in randomised trials. BMJ 2019, 366, l4898. [Google Scholar] [CrossRef] [Green Version]
- Page, M.J.; McKenzie, J.E.; Bossuyt, P.M.; Boutron, I.; Hoffmann, T.C.; Mulrow, C.D.; Shamseer, L.; Tetzlaff, J.M.; Akl, E.A.; Brennan, S.E.; et al. The PRISMA 2020 statement: An updated guideline for reporting systematic reviews. BMJ 2021, 372, n71. [Google Scholar] [CrossRef] [PubMed]
- Guraya, S.S.; AlAdraj, H.R.M.H.A.; Abdulla, M.J.A.E. Health Related Quality of Life of Patients Treated with Biological Agents and New Small-Molecule Drugs for Moderate to Severe Crohn’s Disease, a Systematic Review. PROSPERO 2022 CRD42022306394. Available online: https://www.crd.york.ac.uk/prospero/display_record.php?ID=CRD42022306394 (accessed on 25 February 2022).
- Hanauer, S.B.; Sandborn, W.J.; Rutgeerts, P.; Fedorak, R.N.; Lukas, M.; MacIntosh, D.; Panaccione, R.; Wolf, D.; Pollack, P. Human anti-tumor necrosis factor monoclonal antibody (adalimumab) in Crohn’s disease: The CLASSIC-I trial. Gastroenterology 2006, 130, 323–333. [Google Scholar] [CrossRef] [PubMed] [Green Version]
- Sandborn, W.J.; Hanauer, S.B.; Rutgeerts, P.; Fedorak, R.N.; Lukas, M.; MacIntosh, D.G.; Panaccione, R.; Wolf, D.; Kent, J.D.; Bittle, B.; et al. Adalimumab for maintenance treatment of Crohn’s disease: Results of the CLASSIC II trial. Gut 2007, 56, 1232–1239. [Google Scholar] [CrossRef] [PubMed] [Green Version]
- Sandborn, W.J.; Feagan, B.G.; Rutgeerts, P.; Hanauer, S.; Colombel, J.F.; Sands, B.E.; Lukas, M.; Fedorak, R.N.; Lee, S.; Bressler, B.; et al. Vedolizumab as induction and maintenance therapy for Crohn’s disease. N. Engl. J. Med. 2013, 369, 711–721. [Google Scholar] [CrossRef] [PubMed] [Green Version]
- Sands, B.E.; Peyrin-Biroulet, L.; Kierkus, J.; Higgins, P.D.R.; Fischer, M.; Jairath, V.; Hirai, F.; D’Haens, G.; Belin, R.M.; Miller, D.; et al. Efficacy and Safety of Mirikizumab in a Randomized Phase 2 Study of Patients with Crohn’s Disease. Gastroenterology 2022, 162, 495–508. [Google Scholar] [CrossRef]
- Colombel, J.F.; Sandborn, W.J.; Reinisch, W.; Mantzaris, G.J.; Kornbluth, A.; Rachmilewitz, D.; Lichtiger, S.; D’Haens, G.; Diamond, R.H.; Broussard, D.L.; et al. Infliximab, azathioprine, or combination therapy for Crohn’s disease. N. Engl. J. Med. 2010, 362, 1383–1395. [Google Scholar] [CrossRef] [Green Version]
- Targan, S.R.; Hanauer, S.B.; van Deventer, S.J.; Mayer, L.; Present, D.H.; Braakman, T.; DeWoody, K.L.; Schaible, T.F.; Rutgeerts, P.J. A short-term study of chimeric monoclonal antibody cA2 to tumor necrosis factor alpha for Crohn’s disease. Crohn’s Disease cA2 Study Group. N. Engl. J. Med. 1997, 337, 1029–1035. [Google Scholar] [CrossRef] [Green Version]
- Feagan, B.G.; Yan, S.; Bala, M.; Bao, W.; Lichtenstein, G.R. The effects of infliximab maintenance therapy on health-related quality of life. Am. J. Gastroenterol 2003, 98, 2232–2238. [Google Scholar] [CrossRef]
- Sandborn, W.J.; Feagan, B.G.; Stoinov, S.; Honiball, P.J.; Rutgeerts, P.; Mason, D.; Bloomfield, R.; Schreiber, S. Certolizumab pegol for the treatment of Crohn’s disease. N Engl. J. Med. 2007, 357, 228–238. [Google Scholar] [CrossRef] [Green Version]
- Feagan, B.G.; Coteur, G.; Tan, S.; Keininger, D.L.; Schreiber, S. Clinically meaningful improvement in health-related quality of life in a randomized controlled trial of certolizumab pegol maintenance therapy for Crohn’s disease. Am. J. Gastroenterol 2009, 104, 1976–1983. [Google Scholar] [CrossRef]
- Rutgeerts, P.; Schreiber, S.; Feagan, B.; Keininger, D.L.; O’Neil, L.; Fedorak, R.N. Certolizumab pegol, a monthly subcutaneously administered Fc-free anti-TNFalpha, improves health-related quality of life in patients with moderate to severe Crohn’s disease. Int. J. Colorectal. Dis. 2008, 23, 289–296. [Google Scholar] [CrossRef] [PubMed] [Green Version]
- Sands, B.E.; Han, C.; Gasink, C.; Jacobstein, D.; Szapary, P.; Gao, L.L.; Lang, Y.; Targan, S.; Sandborn, W.J.; Feagan, B.G. The Effects of Ustekinumab on Health-related Quality of Life in Patients with Moderate to Severe Crohn’s Disease. J. Crohns. Colitis 2018, 12, 883–895. [Google Scholar] [CrossRef] [PubMed]
- Dudley-Brown, S.; Nag, A.; Cullinan, C.; Ayers, M.; Hass, S.; Panjabi, S. Health-related quality-of-life evaluation of crohn disease patients after receiving natalizumab therapy. Gastroenterol. Nurs. 2009, 32, 327–339. [Google Scholar] [CrossRef] [PubMed]
- Feagan, B.G.; Sandborn, W.J.; Hass, S.; Niecko, T.; White, J. Health-related quality of life during natalizumab maintenance therapy for Crohn’s disease. Am. J. Gastroenterol. 2007, 102, 2737–2746. [Google Scholar] [CrossRef]
- Loftus, E.V.; Feagan, B.G.; Colombel, J.F.; Rubin, D.T.; Wu, E.Q.; Yu, A.P.; Pollack, P.F.; Chao, J.; Mulani, P. Effects of adalimumab maintenance therapy on health-related quality of life of patients with Crohn’s disease: Patient-reported outcomes of the CHARM trial. Am. J. Gastroenterol. 2008, 103, 3132–3141. [Google Scholar] [CrossRef]
- Vermeire, S.; Schreiber, S.; Petryka, R.; Kuehbacher, T.; Hebuterne, X.; Roblin, X.; Klopocka, M.; Goldis, A.; Wisniewska-Jarosinska, M.; Baranovsky, A.; et al. Clinical remission in patients with moderate-to-severe Crohn’s disease treated with filgotinib (the FITZROY study): Results from a phase 2, double-blind, randomised, placebo-controlled trial. Lancet 2017, 389, 266–275. [Google Scholar] [CrossRef]
- Peyrin-Biroulet, L.; Louis, E.; Loftus, E.V.; Lacerda, A.; Zhou, Q.; Sanchez Gonzalez, Y.; Ghosh, S. Quality of Life and Work Productivity Improvements with Upadacitinib: Phase 2b Evidence from Patients with Moderate to Severe Crohn’s Disease. Adv. Ther. 2021, 38, 2339–2352. [Google Scholar] [CrossRef]
- Euctr, H.R. A Randomized, Double-Blind, Placebo-Controlled, Parallel Group, Multi-Centre Study to Investigate the Safety and Efficacy of CP-690,550 for Induction Therapy in Subjects with Moderate to Severe Crohn’s Disease. 2014. Available online: https://trialsearch.who.int/Trial2.aspx?TrialID=EUCTR2011-001733-16-HR (accessed on 1 February 2022).
- Sands, B.E.; Jacobson, E.W.; Sylwestrowicz, T.; Younes, Z.; Dryden, G.; Fedorak, R.; Greenbloom, S. Randomized, double-blind, placebo-controlled trial of the oral interleukin-12/23 inhibitor apilimod mesylate for treatment of active Crohn’s disease. Inflamm. Bowel. Dis. 2010, 16, 1209–1218. [Google Scholar] [CrossRef]
- LeBlanc, K.; Mosli, M.H.; Parker, C.E.; MacDonald, J.K. The impact of biological interventions for ulcerative colitis on health-related quality of life. Cochrane Database Syst Rev. 2015, 37, Cd008655. [Google Scholar] [CrossRef]
- Schreiber, S.; Rutgeerts, P.; Fedorak, R.N.; Khaliq-Kareemi, M.; Kamm, M.A.; Boivin, M.; Bernstein, C.N.; Staun, M.; Thomsen, O.; Innes, A. A randomized, placebo-controlled trial of certolizumab pegol (CDP870) for treatment of Crohn’s disease. Gastroenterology 2005, 129, 807–818. [Google Scholar] [CrossRef]
- Schreiber, S.; Khaliq-Kareemi, M.; Lawrance, I.C.; Thomsen, O.; Hanauer, S.B.; McColm, J.; Bloomfield, R.; Sandborn, W.J. Maintenance therapy with certolizumab pegol for Crohn’s disease. N. Engl. J. Med. 2007, 357, 239–250. [Google Scholar] [CrossRef] [PubMed]
- Feagan, B.G.; Sandborn, W.J.; Gasink, C.; Jacobstein, D.; Lang, Y.; Friedman, J.R.; Blank, M.A.; Johanns, J.; Gao, L.L.; Miao, Y.; et al. Ustekinumab as Induction and Maintenance Therapy for Crohn’s Disease. N. Engl. J. Med. 2016, 375, 1946–1960. [Google Scholar] [CrossRef] [PubMed]
- Targan, S.R.; Feagan, B.G.; Fedorak, R.N.; Lashner, B.A.; Panaccione, R.; Present, D.H.; Spehlmann, M.E.; Rutgeerts, P.J.; Tulassay, Z.; Volfova, M.; et al. Natalizumab for the treatment of active Crohn’s disease: Results of the ENCORE Trial. Gastroenterology 2007, 132, 1672–1683. [Google Scholar] [CrossRef] [PubMed] [Green Version]
- Sandborn, W.J.; Feagan, B.G.; Loftus, E.V.; Peyrin-Biroulet, L.; Van Assche, G.; D’Haens, G.; Schreiber, S.; Colombel, J.F.; Lewis, J.D.; Ghosh, S.; et al. Efficacy and Safety of Upadacitinib in a Randomized Trial of Patients with Crohn’s Disease. Gastroenterology 2020, 158, 2123–2138.e2128. [Google Scholar] [CrossRef] [PubMed]
- Farrell, D.; Artom, M.; Czuber-Dochan, W.; Jelsness-Jørgensen, L.P.; Norton, C.; Savage, E. Interventions for fatigue in inflammatory bowel disease. Cochrane Database Syst Rev. 2020, 4, Cd012005. [Google Scholar] [CrossRef] [PubMed]
- Lefebvre, C.; Glanville, J.; Briscoe, S.; Littlewood, A.; Marshall, C.; Metzendorf, M.-I.; Noel-Storr, A.; Rader, T.; Shokraneh, F.; Thomas, J.; et al. Chapter 4: Searching for and selecting studies. In Cochrane Handbook for Systematic Reviews of Interventions Version 6.2; Higgins, J.P.T., Thomas, J., Chandler, J., Cumpston, M., Li, T., Page, M.J., Welch, V.A., Eds.; Cochrane: Hoboken, NJ, USA, 2022; (updated February 2021); Available online: https://training.cochrane.org/handbook/archive/v6.2 (accessed on 20 January 2022).
| Study ID | Experimental | No. of Participants | Group Favoured | Outcome | Weight | Risk of Bias | |||||
|---|---|---|---|---|---|---|---|---|---|---|---|
| D1 | D2 | D3 | D4 | D5 | O | ||||||
| SONIC [31] | Infliximab | 508 | Intervention | All HRQoL outcomes | 8 |  | | | | | |
| Targan et al. [32] | CA2 | 108 | Intervention | All HRQoL outcomes | 3 | | |  | | | |
| ACCENT I [33] | Infliximab | 573 | Intervention | All IBDQ outcomes | 5 |  | | | | | |
| All PCS and MCS outcomes | 10 | | | | | | | ||||
| CHARM [40] | Adalimumab | 499 | Intervention | All HRQoL outcomes | 15 | | | | | | |
| PRECiSE 1 [34] | Certolizumab pegol | 662 | Intervention | All HRQoL outcomes | 2 | | | | | | |
| PRECiSE 2 [35] | Certolizumab pegol | 428 | Intervention | All HRQoL outcomes | 7 | | | | | | |
| Rutgeerts et al. [36] | Certolizumab pegol | 292 | Intervention | All HRQoL outcomes | 5 | | | | | | |
| UNITI I and II [37] | Ustekinumab | 742 and 628 | Intervention | All IBDQ outcomes | 8 | | | | | | |
| All PCS and MCS outcomes | 16 | | | | | | | ||||
| IM UNITI [37] | Ustekinumab | 1281 | Intervention | All HRQoL outcomes | 18 | | | | | | |
| ENCORE [38] | Natalizumab | 509 | Intervention | All HRQoL outcomes | 3 | | | | | | |
| ENACT 2 [39] | Natalizumab | 339 | Intervention | All HRQoL outcomes | 24 | | | | | | |
| FITZROY [41] | Filgotinib | 174 | Intervention | All HRQoL outcomes | 1 | | | | | | |
| CELEST [42] | Upadacitinib | 220 | Intervention | All HRQoL outcomes | 20 | | | | | | |
| Tofacitinib [43] | Tofacitinib | 280 | Not reported | All HRQoL outcomes | 8 | | | | | | |
| Sands et al. [44] | Apilimod mesylate | 220 | Not significant | All HRQoL outcomes | 4 | | | | | | |
low risk, some concerns, high risk.| Study Id and Registration Number | Intervention and Comparator | Dosage and Frequency | Results for | Intervention | Azathioprine | p Value | Conclusion |
|---|---|---|---|---|---|---|---|
| SONIC [31] NCT00094458 | Infliximab (IV) and azathioprine (oral) | Infliximab 5mg/kg given at week 2,4,6 and then every 8 weeks OR azathioprine 2.5 mg/kg | Mean IBDQ at baseline | 126.7 (30.3) | 128 (29) | - | Non-inferiority trial favoured infliximab over azathioprine in improving HRQoL. |
| Change at week 2 | 27.2 (26.1) | 20.1 (24.3) | 0.007 | ||||
| Change at week 6 | 34.8 (31.8) | 28.3 (31.3) | 0.10 | ||||
| Change at week 10 | 37.8 (35.6) | 31.0 (31.7) | 0.10 | ||||
| Change at week 18 | 39.9 (34.2) | 30.3 (33.9) | 0.01 | ||||
| Change at week 26 | 39.9 (36.6) | 31.4 (35.4) | 0.05 | ||||
| Change at week 32 * | 55.8 (33.6) | 39.1 (32.9) | 0.001 | ||||
| Change at week 42 * | 51.4 (32.8) | 40.3 (32.1) | 0.04 | ||||
| Change at week 50 * | 51.6 (32.9) | 43.0 (33.4) | 0.09 |
| Study Id and Registration Number | Intervention | Dosage and Frequency | Results for | Intervention | Placebo | p Value | Conclusion |
|---|---|---|---|---|---|---|---|
| Targan et al. [32] NCT00269854 | Infliximab (IV) | 5 mg/kg single dose | Mean IBDQ at baseline | 122 (29) | 128 (29) | - | Infliximab significantly improved IBDQ in the short term. |
| Mean at week 4 | 168 (36) | 133 (28) | <0.001 | ||||
| 10 mg/kg single dose | Mean IBDQ at baseline | 116 (23) | 128 (29) | - | |||
| Mean at week 4 | 146 (41) | 133 (28) | 0.02 | ||||
| 15 mg/kg single dose | Mean IBDQ at baseline | 118 (28) | 128 (29) | - | |||
| Mean at week 4 | 149 (35) | 133 (28) | 0.03 | ||||
| ACCENT I [33] NCT00207662 | Infliximab (IV) | 5 mg/kg every 8 weeks | Mean IBDQ at baseline | 170 (26) | 170 (29) | - | Both doses of infliximab maintenance maintained a significant increase in mean IBDQ and PCS at all time points. Mean MCS difference was not significant except at week 50 in the 10 mg/kg dose. |
| Change at week 10 | 37.8 | 28.9 | <0.05 | ||||
| Change at week 30 | 27.1 | 14.0 | <0.05 | ||||
| Change at week 50 | 22.1 | 8.9 | <0.05 | ||||
| Mean PCS at baseline | NR | NR | - | ||||
| Change at week 10 | 8.6 | 4.9 | <0.001 | ||||
| Change at week 30 | 7.3 | 3.1 | <0.01 | ||||
| Change at week 50 | 6.1 | 2.5 | <0.05 | ||||
| Mean MCS at baseline | NR | NR | - | ||||
| Change at week 10 | 6.5 | 3.8 | ≥0.05 | ||||
| Change at week 30 | 4.6 | 2.9 | ≥0.05 | ||||
| Change at week 50 | 5.1 | 2.0 | ≥0.05 | ||||
| 10 mg/kg every 8 weeks | Mean IBDQ at baseline | 168 (31) | 170 (29) | - | |||
| Change at week 30 | 31.7 | 14 | <0.01 | ||||
| Change at week 50 | 30.2 | 8.9 | <0.001 | ||||
| Mean PCS at baseline | NR | NR | - | ||||
| Change at week 30 | 7.3 | 3.1 | <0.01 | ||||
| Change at week 50 | 7.2 | 2.5 | <0.01 | ||||
| Mean MCS at baseline | NR | NR | - | ||||
| Change at week 30 | 4.9 | 2.9 | ≥0.05 | ||||
| Change at week 50 | 5.8 | 2.0 | <0.05 | ||||
| CHARM [40] NCT00077779 | Adalimumab (SC) | 40 mg every other week | Mean IBDQ at baseline | NR | NR | - | Both doses of adalimumab maintained a significant increase in mean IBDQ at week 56. Adalimumab every other week maintained a significant increase in mean PCS. Increase in mean MCS reached significance at week 56 in the every other week group. Adalimumab weekly showed no significance in SF-36 outcomes compared to placebo. |
| Mean at week 56 | 176 | NR | <0.001 | ||||
| Mean PCS at baseline | 37.1 (7.9) | 36.8 (8.0) | - | ||||
| Mean at week 4 (OL) | 44.5 (7.8) | 44.3 (8.9) | - | ||||
| Mean at week 12 | 46.9 (8.6) | 44.5 (9.0) | <0.01 | ||||
| Mean at week 26 | 47.4 (9.2) | 44.7 (8.6) | <0.01 | ||||
| Mean at week 56 | 47.5 (8.5) | 45.3 (8.6) | <0.01 | ||||
| Mean MCS at baseline | 38.2 (11.0) | 38.6 (10.9) | - | ||||
| Mean at week 4 (OL) | 46.2 (10.4) | 47.4 (10.4) | - | ||||
| Mean at week 12 | 48.4 (10.7) | 46.2 (11.0) | NS | ||||
| Mean at week 26 | 48.2(10.6) | 45.8 (11.4) | NS | ||||
| Mean at week 56 | 48.7 (10.5) | 45.9 (11.2) | <0.05 | ||||
| PCS MCID ** at week 56 | 77 | 61 | <0.01 | ||||
| MSC MCID ** at week 56 | 67 | 54 | <0.05 | ||||
| 40 mg weekly | Mean IBDQ at baseline | NR | NR | - | |||
| Mean at week 56 | 171 | NR | <0.05 | ||||
| Mean PCS at baseline | 36.9 (9.6) | 36.8 (8.0) | - | ||||
| Mean at week 4 (OL) | 43.7 (8.4) | 44.3 (8.9) | - | ||||
| Mean at week 12 | 46.0 (8.6) | 44.5 (9.0) | NS | ||||
| Mean at week 26 | 46.1 (8.7) | 44.7 (8.6) | NS | ||||
| Mean at week 56 | 47.1 (9.4) | 45.3 (8.6) | NS | ||||
| Mean MCS at baseline | 36.3 (10.5) | 38.6 (10.9) | - | ||||
| Mean at week 4 (OL) | 45.7 (9.3) | 47.4 (10.4) | - | ||||
| Mean at week 12 | 46.1 (11.9) | 46.2 (11.0) | NS | ||||
| Mean at week 26 | 46.1 (11.8) | 45.8 (11.4) | NS | ||||
| Mean at week 56 | 46.5 (12.4) | 45.9 (11.2) | NS | ||||
| PRECiSE 1 [34] NCT00152490 | Certolizumab pegol (SC) | 400 mg every 4 weeks | Mean IBDQ at baseline | NR | NR | - | Certolizumab maintained significant increases in mean IBDQ, PCS and MCS after 26 weeks. |
| Change at week 26 | 26.4 (35.1) | 20.5 (33.1) | 0.03 | ||||
| IBDQ MCID * at week 26 | 42.0 | 33.0 | 0.01 | ||||
| PRECiSE 2 [35] NCT00152425 | Certolizumab pegol (SC) | 400 mg every 4 weeks | Mean IBDQ at baseline | NR | NR | - | |
| Mean at week 16 | 170.0 | 162 | 0.008 | ||||
| Mean at week 26 | 175.7 (29.94) | 167.9 (23.19) | <0.001 | ||||
| Mean PCS at baseline | NR | NR | - | ||||
| Mean at week 26 | 48.1 (8.17) | 46.4 (7.69) | 0.014 | ||||
| Mean MCS at baseline | NR | NR | - | ||||
| Mean at week 26 | 46.9 (11.53) | 45.2 (11.83) | 0.001 | ||||
| IBDQ MCID * at week 26 | 60.6 | 42.9 | <0.001 | ||||
| PCS MCID a at week 26 | 51.2 | 33.8 | <0.001 | ||||
| MCS MCID b at week 26 | 44.2 | 32.4 | 0.016 | ||||
| Rutgeerts et al. [36] | Certolizumab pegol (SC) | 100 mg every 4 weeks | Mean IBDQ at baseline | 132.2 (30.60) | 122.9 (26.60) | - | Induction with certolizumab (400 mg) significantly improved IBDQ. |
| Change at week 2 | 16.6 | 10.6 | NS | ||||
| 200 mg every 4 weeks | Mean IBDQ at baseline | 122.9 (27.07) | 122.9(26.60) | - | |||
| Change at week 2 | 21.8 | 10.6 | <0.05 | ||||
| 400 mg every 4 weeks | Mean IBDQ at baseline | 126.5(25.20) | 122.9(26.60) | - | |||
| Change at week 2 | 22.8 | 10.6 | <0.05 | ||||
| Change at week 10 | 32.2 | 18.6 | <0.05 | ||||
| Mean at week 12 | 156.4 (37.36) | 140.5 (35.88) | <0.05 | ||||
| IBDQ MCID * at week 2 | 52.8 | NR | NR | ||||
| IBDQ MCID * at week 12 | 66.7 | NR | NR | ||||
| UNITI I [37] NCT01369329 | Ustekinumab (IV) | 130 mg single infusion | Mean IBDQ at baseline | 119.5 (29.47) | 120.0 (29.27) | - | Both doses of induction ustekinumab significantly increased mean IBDQ in patients who previously failed treatment with TNF-alpha inhibitors. In this population, ustekinumab showed no significance in improving PCS. Only 6 mg/kg ustekinumab significantly improved MCS. |
| Change at week 8 | 18.1 (28.02) | 11.9 (26.51) | <0.05 | ||||
| Mean PCS at baseline | 37.8 (7.12) | 37.8 (7.12) | - | ||||
| Change at week 8 | 3.2 (6.43) | 2.6 (6.50) | NS | ||||
| Mean MCS at baseline | 37.3 (9.98) | 37.8 (10.64) | - | ||||
| Change at week 8 | 3.3 (9.41) | 2.2 (8.47) | NS | ||||
| IBDQ MCID * at week 8 | 46.9 | 36.5 | 0.019 | ||||
| PCS MCID ** at week 8 | 33.3 | 30 | NS | ||||
| MCS MCID ** at week 8 | 36.4 | 30 | NS | ||||
| 6 mg/kg single infusion | Mean IBDQ at baseline | 118.2 (26.64) | 120.0 (29.27) | - | |||
| Change at week 8 | 22.1(28.59) | 11.9 (26.51) | <0.001 | ||||
| Mean PCS at baseline | 37.2 (7.09) | 37.8 (7.12) | - | ||||
| Change at week 8 | 3.6 (6.75) | 2.6 (6.50) | NS | ||||
| Mean MCS at baseline | 36.4 (9.89) | 37.8 (10.64) | - | ||||
| Change at week 8 | 4.9(9.28) | 2.2 (8.47) | 0.006 | ||||
| IBDQ MCID * at week 8 | 54.8 | 36.5 | <0.001 | ||||
| PCS MCID ** at week 8 | 34.9 | 30 | NS | ||||
| MCS MCID ** at week 8 | 42.4 | 30 | 0.007 | ||||
| UNITI II [37] NCT01369342 | Ustekinumab (IV) | 130 mg single infusion | Mean IBDQ at baseline | 118.2 (30.99) | 122.7 (31.32) | - | Both doses of induction ustekinumab significantly increased mean IBDQ, PCS and MCS in patients who previously failed conventional treatment. Ustekinumab groups had a significantly higher proportion of patients achieving MCID. |
| Change at week 8 | 29.1 (33.82) | 29.1 (33.82) | <0.001 | ||||
| Mean PCS at baseline | 38.9 (7.62) | 39.7 (7.19) | - | ||||
| Change at week 8 | 5.1 (7.24) | 2.6 (5.88) | <0.010 | ||||
| Mean MCS at baseline | 37.2 (10.81) | 37.1 (10.75) | - | ||||
| Change at week 8 | 5.9 (10.55) | 3.3 (9.47) | <0.010 | ||||
| IBDQ MCID * at week 8 | 58.7 | 41.1 | <0.001 | ||||
| PCS MCID ** at week 8 | 44 | 31.2 | 0.009 | ||||
| MCS MCID ** at week 8 | 49.2 | 38.6 | 0.036 | ||||
| 6 mg/kg single infusion | Mean IBDQ at baseline | 122.8 (31.62) | 122.7 (31.32) | - | |||
| Change at week 8 | 35.3 (36.05) | 14.7 (26.96) | <0.001 | ||||
| Mean PCS at baseline | 38.9 (7.05) | 39.7 (7.19) | - | ||||
| Change at week 8 | 6.0 (7.70) | 2.6 (5.88) | <0.001 | ||||
| Mean MCS at baseline | 37.9 (11.15) | 37.1 (10.75) | - | ||||
| Change at week 8 | 6.8 (11.34) | 3.3 (9.47) | <0.001 | ||||
| IBDQ MCID * at week 8 | 68.1 | 41.1 | <0.001 | ||||
| PCS MCID ** at week 8 | 49.2 | 31.2 | <0.001 | ||||
| MCS MCID ** at week 8 | 51.3 | 38.6 | 0.014 | ||||
| IM UNITI [37] NCT01369355 | Ustekinumab (SC) | 90 mg every 12 weeks (q12w) | Mean IBDQ at baseline | 165.8 (32.82) | 163.6 (31.76) | - | By the end of the study, ustekinumab (q8w) maintained significant improvement across all outcomes. The q12w group maintained improvement in mean IBDQ and MCS. |
| Change at week 20 | −6.3 (37.04) | −12.8 (34.05) | 0.035 | ||||
| Change at week 44 | −8.9 (43.08) | −21.5 (39.26) | <0.001 | ||||
| Mean PCS at baseline | 47.1 (8.10) | 46.3 (8.21) | - | ||||
| Change at week 20 | −1.7 (7.18) | −1.7 (7.67) | NS | ||||
| Change at week 44 | −2.3 (9.31) | −3.6 (9.33) | NS | ||||
| Mean MCS at baseline | 46.4 (10.66) | 45.7 (10.89) | - | ||||
| Change at week 20 | −1.3 (11.53) | −2.7 (10.78) | NS | ||||
| Change at week 44 | −1.9 (12.68) | −4.4 (11.06) | <0.050 | ||||
| IBDQ MCID * at week 44 | 61.3 | 50.4 | NS | ||||
| PCS MCID ** at week 44 | 41.7 | 34.7 | NS | ||||
| MCS MCID ** at week 44 | 46.7 | 28.9 | 0.005 | ||||
| 90 mg every 8 weeks (q8w) | Mean IBDQ at baseline | 170.5 (29.33 | 163.6 (31.76) | - | |||
| Change at week 20 | −8.9 (31.46) | −12.8 (34.05) | NS | ||||
| Change at week 44 | −9.9 (34.83) | −21.5 (39.26) | <0.010 | ||||
| Mean PCS at baseline | 47.4 (7.52) | 46.3 (8.21) | - | ||||
| Change at week 20 | −0.6 (6.37) | −1.7 (7.67) | NS | ||||
| Change at week 44 | −0.9 (7.14) | −3.6 (9.33) | <0.010 | ||||
| Mean MCS at baseline | 47.3 (9.91) | 45.7 (10.89) | - | ||||
| Change at week 20 | −1.7 (9.01) | −2.7 (10.78) | NS | ||||
| Change at week 44 | −1.7 (9.76) | −4.4 (11.06) | <0.010 | ||||
| IBDQ MCID * at week 44 | 67.9 | 50.4 | 0.014 | ||||
| PCS MCID ** at week 44 | 52.1 | 34.7 | 0.008 | ||||
| MCS MCID ** at week 44 | 47.9 | 28.9 | 0.003 | ||||
| ENCORE [38] NCT00078611 | Natalizumab (IV) | 300 mg every 4 weeks | Mean IBDQ at baseline | 123.6 (31.06) | 122.5 (28.44) | - | Natalizumab induction significantly increased mean IBDQ and PCS but not MCS. |
| Change at week 12 | 26.7 (32.34) | 15.2 (28.92) | <0.001 | ||||
| Mean PCS at baseline | 34.7 (8.7) | 34.6 (8.4) | - | ||||
| Change at week 12 | 5.8 (8.2) | 2.7 (6.7) | <0.001 | ||||
| Mean MCS at baseline | 37.9 (10.8) | 4.9 (10.5) | - | ||||
| Change at week 12 | 4.9 (10.5) | 2.6 (9.6) | 0.052 | ||||
| ENACT-2 [39] NCT00032786 | Natalizumab (IV) | 300 mg every 4 weeks | Mean IBDQ at ENACT 1 baseline | 125 (30) | 121 (30) | - | By week 60, the natalizumab group had a higher mean and proportion of patients achieving MCID in all three outcomes. Increase in mean IBDQ and PCS was significant at all timepoints, while mean MCS reached significance at week 48. |
| Change at the end of ENACT-1 | 58.6 (30.0) | NG | - | ||||
| Change at week 24 | 51.6 (31.4) | 43.8 (35.0) | <0.01 | ||||
| Change at week 36 | 53.4 (32.9) | 39.4 (38.9) | <0.001 | ||||
| Change at week 48 | 52.3 (32.9) | 36.5 (39.6) | <0.001 | ||||
| Change at week 60 | 53.9 (33.6) | 35.5 (40.3) | <0.001 | ||||
| MCID * at the end of ENACT-1 | 93.2 | NG | - | ||||
| IBDQ MCID * at week 24 | 85.8 | 77.9 | NS | ||||
| IBDQ MCID * at week 36 | 87.5 | 70.5 | <0.01 | ||||
| IBDQ MCID * at week 48 | 86.7 | 65.1 | <0.001 | ||||
| IBDQ MCID * at week 60 | 86.7 | 65.1 | <0.001 | ||||
| Mean PCS at ENACT 1 baseline | 33 (8) | 34 (8) | - | ||||
| Change at the end of ENACT-1 | 12.5(8.5) | NG | - | ||||
| Change at week 24 | 12.5 (8.5) | 8.8 (8.9) | <0.01 | ||||
| Change at week 36 | 13.4 (9.4) | 7.6 (9.6) | <0.001 | ||||
| Change at week 48 | 12.9 (9.4) | 6.9 (9.2) | <0.001 | ||||
| Change at week 60 | 12.6 (9.4) | 6.8 (9.5) | <0.001 | ||||
| PCS MCID ** at the end of ENACT-1 | 78.5 | NG | - | ||||
| PCS MCID ** at week 24 | 79.1 | 63.0 | <0.05 | ||||
| PCS MCID ** at week 36 | 82.4 | 54.8 | <0.001 | ||||
| PCS MCID ** at week 48 | 77.9 | 53.4 | <0.001 | ||||
| PCS MCID ** at week 60 | 75.7 | 53.4 | <0.001 | ||||
| Mean MCS at ENACT 1 baseline | 39 (11) | 37 (11) | - | ||||
| Change at the end of ENACT-1 | 10.5 (10.5) | NG | - | ||||
| Change at week 24 | 8.6 (10.5) | 8.0 (11.0) | NS | ||||
| Change at week 36 | 8.3 (11.4) | 7.2 (11.0) | NS | ||||
| Change at week 48 | 8.9 (10.2) | 6.3 (12.1) | <0.01 | ||||
| Change at week 60 | 9.7 (10.5) | 6.8 (12.4) | <0.001 | ||||
| MCS MCID ** at the end of ENACT-1 | 68.7 | NG | - | ||||
| MCS MCID ** at week 24 | 59.7 | 62.6 | NS | ||||
| MCS MCID ** at week 36 | 61.0 | 53.0 | <0.05 | ||||
| MCS MCID ** at week 48 | 61.8 | 53.4 | <0.001 | ||||
| MCS MCID ** at week 60 | 64.7 | 52.6 | <0.001 | ||||
| FITZROY [41] NCT02048618 | Filgotinib (oral) | 200 mg once daily | Mean IBDQ at baseline | 123.0 (2.8) | 120.8 (3.6) | - | Filgotinib significantly improved mean IBDQ. |
| Change at week 10 | 33.8 (3.0) | 17.6 (5.1) | 0.0046 | ||||
| CELEST [42] NCT02365649 | Upadacitinib (oral) | 3 mg twice daily (BID) | IBDQ mean at baseline | 115.2 (27.5) | 118.0 (28.5) | - | Upadacitinib (6 mg and 24 mg BID) significantly increased mean IBDQ. By the end of the study, all doses had a higher proportion of patients achieving MCID in IBDQ compared to placebo. |
| Change at week 8 | 19 | 17 | NS | ||||
| Change at week 16 | 21 | 13 | NS | ||||
| IBDQ MCID * at week 8 | 41 | 38 | NS | ||||
| IBDQ MCID * at week 16 | 46 | 24 | ≤0.05 | ||||
| 6 mg twice daily (BID) | IBDQ mean at baseline | 113.7 (25.9) | 118.0 (28.5) | - | |||
| Change at week 8 | 35 | 17 | ≤0.05 | ||||
| Change at week 16 | 39 | 13 | ≤0.01 | ||||
| IBDQ MCID * at week 8 | 62 | 38 | ≤0.05 | ||||
| IBDQ MCID * at week 16 | 57 | 24 | ≤0.01 | ||||
| 12 mg twice daily (BID) | IBDQ mean at baseline | 115.2 (36.1) | 118.0 (28.5) | - | |||
| Change at week 8 | 25 | 17 | NS | ||||
| Change at week 16 | 27 | 13 | ≤0.1 | ||||
| IBDQ MCID * at week 8 | 58 | 38 | ≤0.1 | ||||
| IBDQ MCID * at week 16 | 50 | 24 | ≤0.05 | ||||
| 24 mg twice daily (BID) | IBDQ mean at baseline | 113.8 (36.0) | 118.0 (28.5) | - | |||
| Change at week 8 | 40 | 17 | ≤0.01 | ||||
| Change at week 16 | 41 | 13 | ≤0.01 | ||||
| IBDQ MCID * at week 8 | 53 | 38 | NS | ||||
| IBDQ MCID * at week 16 | 56 | 24 | ≤0.01 | ||||
| 24 mg once daily (QID) | IBDQ mean at baseline | 120.7 (36.3) | 118.0 (28.5) | - | |||
| Change at week 8 | 23 | 17 | NS | ||||
| Change at week 16 | 22 | 13 | NS | ||||
| IBDQ MCID * at week 8 | 57 | 38 | ≤0.1 | ||||
| IBDQ MCID * at week 16 | 49 | 24 | ≤0.05 | ||||
| Tofacitinib [43] NCT01393626 | Tofacitinib (oral) | 5 mg twice daily | Mean IBDQ at baseline | 117.89 (27.98) | 118.50 (28.48) | - | P-values were not reported; we cannot determine the significance of the results. |
| Change at week 8 | 41.20 (3.90) | 26.58 (3.76) | NR | ||||
| Mean PCS at baseline | 38.49 (6.78) | 37.12 (7.66) | - | ||||
| Change at week 8 | 8.07 (0.956) | 3.72 (0.927) | NR | ||||
| Mean MCS at baseline | 34.85 (11.68) | 36.50 (12.26) | - | ||||
| Change at week 8 | 7.88 (1.178) | 6.47 (1.143) | NR | ||||
| IBDQ MCID * at week 8 | 75 | 61.4 | NR | ||||
| 10 mg twice daily | Mean IBDQ at baseline | 113.67 (28.45) | 118.50(28.48) | - | |||
| Change at week 8 | 40.05 (3.90) | 26.58 (3.76) | NR | ||||
| Mean PCS at baseline | 35.28 (8.49) | 37.12 (7.66) | - | ||||
| Change at week 8 | 7.28 (0.967) | 3.72 (0.927) | NR | ||||
| Mean MCS at baseline | 35.84 (10.68) | 36.50 (12.26) | - | ||||
| Change at week 8 | 7.13 (1.180) | 6.47 (1.143) | NR | ||||
| IBDQ MCID * at week 8 | 76.5 | 61.4 | NR | ||||
| Sands et al. [44] NCT00138840 | Apilimod mesylate (oral) | 50 mg daily | Mean IBDQ at baseline | NR | NR | - | There were no significant differences between the intervention and placebo groups. |
| Change at day 29 | 17.0 | 18.7 | 0.76 | ||||
| Change at day 43 | 17.7 | 23.2 | 0.33 | ||||
| 100 mg daily | Mean IBDQ at baseline | NR | NR | - | |||
| Change at day 29 | 17.0 | 18.7 | 0.73 | ||||
| Change at day 43 | 19.5 | 23.2 | 0.48 |
Publisher’s Note: MDPI stays neutral with regard to jurisdictional claims in published maps and institutional affiliations. |
© 2022 by the authors. Licensee MDPI, Basel, Switzerland. This article is an open access article distributed under the terms and conditions of the Creative Commons Attribution (CC BY) license (https://creativecommons.org/licenses/by/4.0/).
Share and Cite
Aladraj, H.; Abdulla, M.; Guraya, S.Y.; Guraya, S.S. Health-Related Quality of Life of Patients Treated with Biological Agents and New Small-Molecule Drugs for Moderate to Severe Crohn’s Disease: A Systematic Review. J. Clin. Med. 2022, 11, 3743. https://doi.org/10.3390/jcm11133743
Aladraj H, Abdulla M, Guraya SY, Guraya SS. Health-Related Quality of Life of Patients Treated with Biological Agents and New Small-Molecule Drugs for Moderate to Severe Crohn’s Disease: A Systematic Review. Journal of Clinical Medicine. 2022; 11(13):3743. https://doi.org/10.3390/jcm11133743
Chicago/Turabian StyleAladraj, Hasan, Mohamed Abdulla, Salman Yousuf Guraya, and Shaista Salman Guraya. 2022. "Health-Related Quality of Life of Patients Treated with Biological Agents and New Small-Molecule Drugs for Moderate to Severe Crohn’s Disease: A Systematic Review" Journal of Clinical Medicine 11, no. 13: 3743. https://doi.org/10.3390/jcm11133743
APA StyleAladraj, H., Abdulla, M., Guraya, S. Y., & Guraya, S. S. (2022). Health-Related Quality of Life of Patients Treated with Biological Agents and New Small-Molecule Drugs for Moderate to Severe Crohn’s Disease: A Systematic Review. Journal of Clinical Medicine, 11(13), 3743. https://doi.org/10.3390/jcm11133743