
Transvaginal Ultrasound Combined with Strain-Ratio Elastography for the Concomitant Diagnosis of Uterine Fibroids and Adenomyosis: A Pilot Study

 ,
,
Abstract
:1. Introduction
2. Materials and Methods
2.1. Study Population and Division of Study Groups
2.2. Ethics
2.3. Ultrasound Examination
2.4. Strain Ratio Elastography Evaluation
2.5. Statistical Analysis
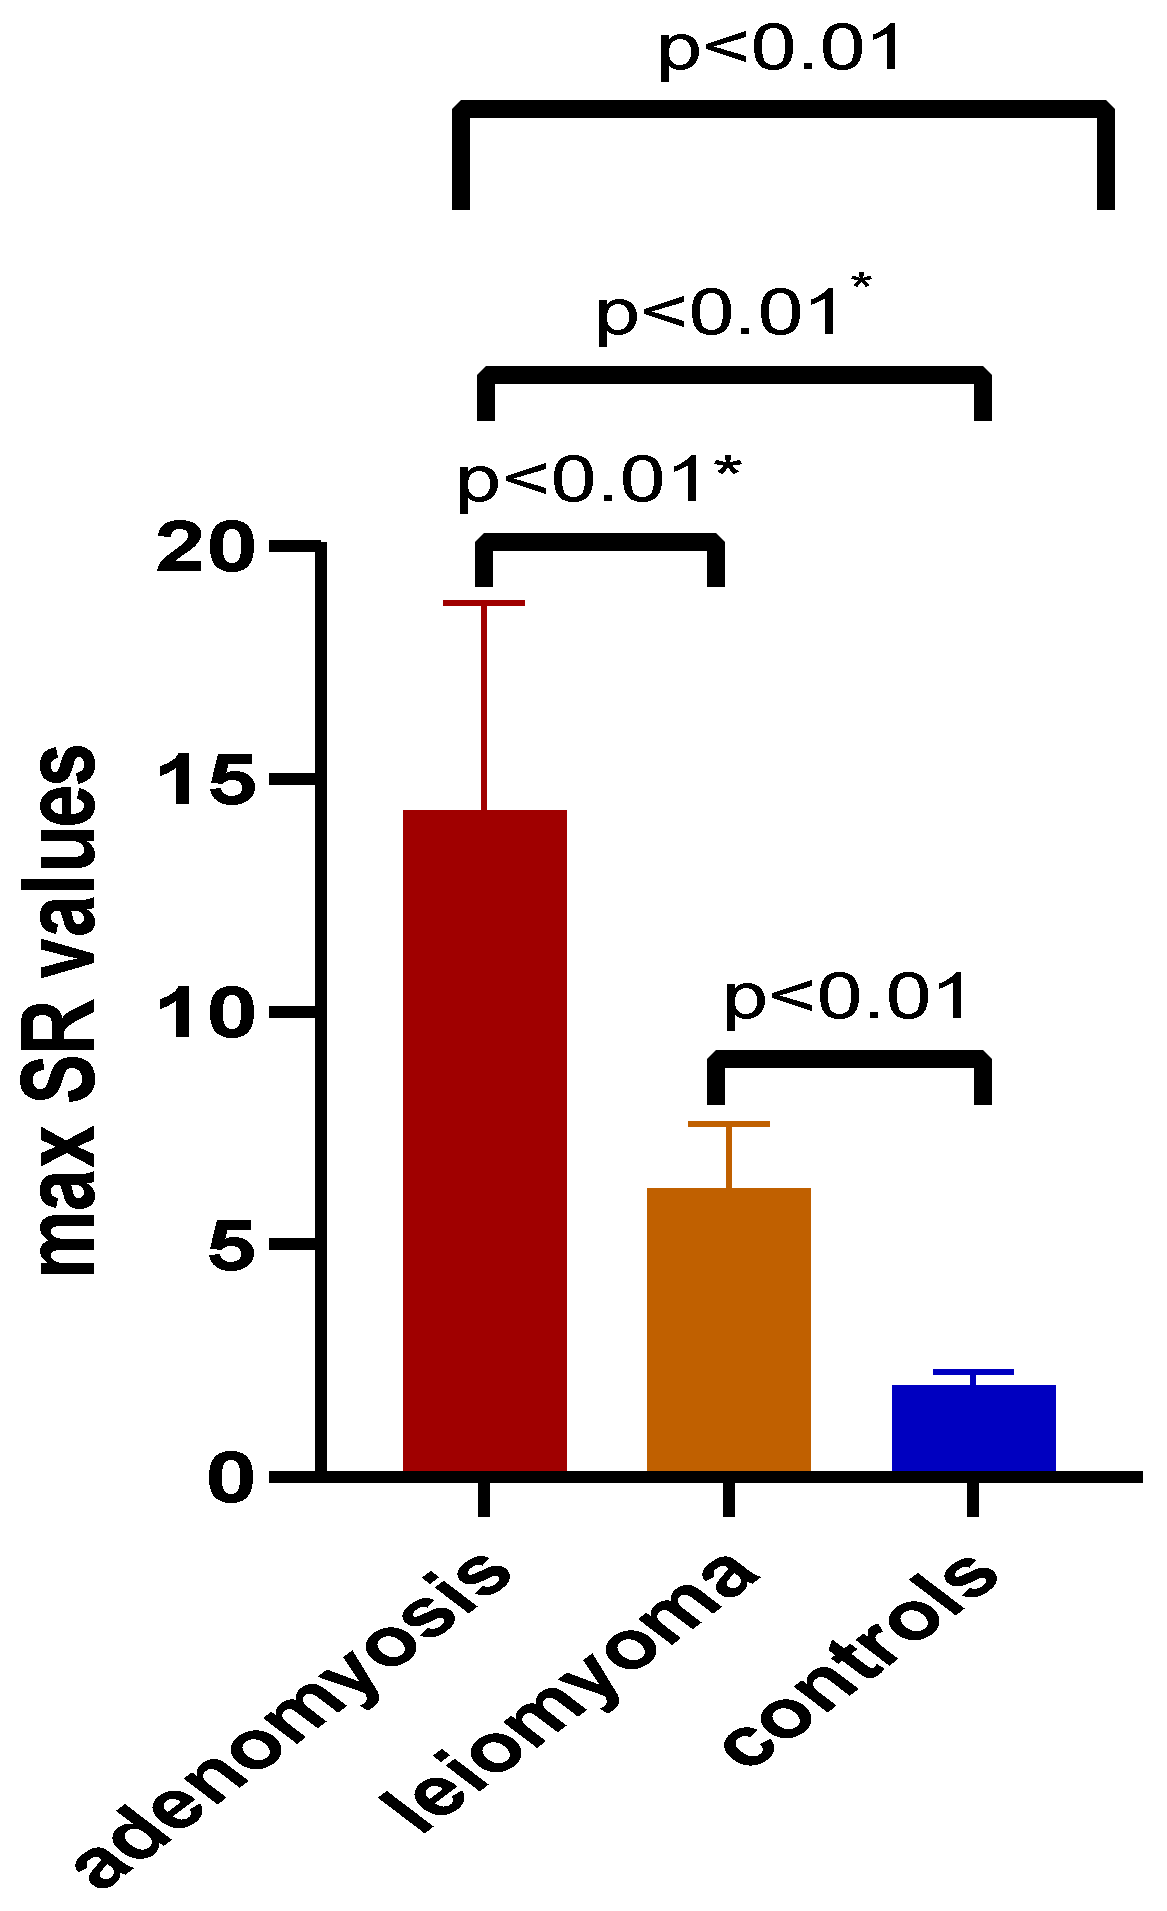
3. Results
4. Discussion
5. Conclusions
Author Contributions
Funding
Institutional Review Board Statement
Informed Consent Statement
Data Availability Statement
Acknowledgments
Conflicts of Interest
References
- Nougaret, S.; Cunha, T.M.; Benadla, N.; Neron, M.; Robbins, J.B. Benign Uterine Disease: The Added Role of Imaging. Obstet. Gynecol. Clin. N. Am. 2021, 48, 193–214. [Google Scholar] [CrossRef] [PubMed]
- Neis, K.J.; Zubke, W.; Fehr, M.; Römer, T.; Tamussino, K.; Nothacker, M. Hysterectomy for Benign Uterine Disease. Dtsch. Arztebl. Int. 2016, 113, 242–249. [Google Scholar] [CrossRef] [PubMed] [Green Version]
- Drayer, S.M.; Catherino, W.H. Prevalence, Morbidity, and Current Medical Management of Uterine Leiomyomas. Int. J. Gynecol. Obstet. 2015, 131, 117–122. [Google Scholar] [CrossRef] [PubMed]
- Stewart, E.A. Uterine Fibroids. Lancet 2001, 357, 293–298. [Google Scholar] [CrossRef]
- Baird, D.D.; Dunson, D.B.; Hill, M.C.; Cousins, D.; Schectman, J.M. High Cumulative Incidence of Uterine Leiomyoma in Black and White Women: Ultrasound Evidence. Am. J. Obs. Gynecol. 2003, 188, 100–107. [Google Scholar] [CrossRef]
- Cunningham, R.K.; Horrow, M.M.; Smith, R.J.; Springer, J. Adenomyosis: A Sonographic Diagnosis. RadioGraphics 2018, 38, 1576–1589. [Google Scholar] [CrossRef]
- Görgülü, F.F.; Okçu, N.T. Which Imaging Method Is Better for the Differentiation of Adenomyosis and Uterine Fibroids? J Gynecol. Obs. Hum. Reprod. 2021, 50, 102002. [Google Scholar] [CrossRef]
- Van den Bosch, T.; Van Schoubroeck, D. Ultrasound Diagnosis of Endometriosis and Adenomyosis: State of the Art. Best Pract. Res. Clin. Obstet. Gynaecol. 2018, 51, 16–24. [Google Scholar] [CrossRef]
- Frank, M.L.; Schäfer, S.D.; Möllers, M.; Falkenberg, M.K.; Braun, J.; Möllmann, U.; Strube, F.; Fruscalzo, A.; Amler, S.; Klockenbusch, W.; et al. Importance of Transvaginal Elastography in the Diagnosis of Uterine Fibroids and Adenomyosis. Ultraschall Med. 2016, 37, 373–378. [Google Scholar] [CrossRef]
- Tetikkurt, S.; Çelik, E.; Taş, H.; Cay, T.; Işik, S.; Usta, A.T. Coexistence of Adenomyosis, Adenocarcinoma, Endometrial and Myometrial Lesions in Resected Uterine Specimens. Mol. Clin. Oncol. 2018, 9, 231–237. [Google Scholar] [CrossRef] [Green Version]
- Vannuccini, S.; Petraglia, F. Recent Advances in Understanding and Managing Adenomyosis. F1000Research 2019, 8, F1000 Faculty Rev-283. [Google Scholar] [CrossRef] [Green Version]
- Taran, F.A.; Wallwiener, M.; Kabashi, D.; Rothmund, R.; Rall, K.; Kraemer, B.; Brucker, S.Y. Clinical Characteristics Indicating Adenomyosis at the Time of Hysterectomy: A Retrospective Study in 291 Patients. Arch. Gynecol. Obs. 2012, 285, 1571–1576. [Google Scholar] [CrossRef]
- Taran, F.A.; Weaver, A.L.; Coddington, C.C.; Stewart, E.A. Characteristics Indicating Adenomyosis Coexisting with Leiomyomas: A Case-Control Study. Hum. Reprod. 2010, 25, 1177–1182. [Google Scholar] [CrossRef] [Green Version]
- Boeer, B.; Wallwiener, M.; Rom, J.; Schoenfisch, B.; Brucker, S.Y.; Taran, F.A. Differences in the Clinical Phenotype of Adenomyosis and Leiomyomas: A Retrospective, Questionnaire-Based Study. Arch. Gynecol. Obs. 2014, 289, 1235–1239. [Google Scholar] [CrossRef]
- Van den Bosch, T.; Dueholm, M.; Leone, F.P.G.; Valentin, L.; Rasmussen, C.K.; Votino, A.; Schoubroeck, D.V.; Landolfo, C.; Installé, A.J.F.; Guerriero, S.; et al. Terms, Definitions and Measurements to Describe Sonographic Features of Myometrium and Uterine Masses: A Consensus Opinion from the Morphological Uterus Sonographic Assessment (MUSA) Group. Ultrasound Obstet. Gynecol. 2015, 46, 284–298. [Google Scholar] [CrossRef]
- Săsăran, V.; Turdean, S.; Gliga, M.; Ilyes, L.; Grama, O.; Muntean, M.; Pușcașiu, L. Value of Strain-Ratio Elastography in the Diagnosis and Differentiation of Uterine Fibroids and Adenomyosis. J. Pers. Med. 2021, 11, 824. [Google Scholar] [CrossRef]
- Dietrich, C.F.; Barr, R.G.; Farrokh, A.; Dighe, M.; Hocke, M.; Jenssen, C.; Dong, Y.; Saftoiu, A.; Havre, R.F. Strain Elastography—How To Do It? Ultrasound Int. Open 2017, 3, E137–E149. [Google Scholar] [CrossRef] [Green Version]
- Liu, X.; Ding, D.; Ren, Y.; Guo, S.-W. Transvaginal Elastosonography as an Imaging Technique for Diagnosing Adenomyosis. Reprod. Sci. 2018, 25, 498–514. [Google Scholar] [CrossRef]
- Zhang, M.; Wasnik, A.P.; Masch, W.R.; Rubin, J.M.; Carlos, R.C.; Quint, E.H.; Maturen, K.E. Transvaginal Ultrasound Shear Wave Elastography for the Evaluation of Benign Uterine Pathologies: A Prospective Pilot Study. J. Ultrasound Med. 2019, 38, 149–155. [Google Scholar] [CrossRef] [Green Version]
- Andres, M.P.; Borrelli, G.M.; Ribeiro, J.; Baracat, E.C.; Abrão, M.S.; Kho, R.M. Transvaginal Ultrasound for the Diagnosis of Adenomyosis: Systematic Review and Meta-Analysis. J. Minim. Invasive Gynecol. 2018, 25, 257–264. [Google Scholar] [CrossRef]
- Che, D.; Wei, H.; Yang, Z.; Zhang, Y.; Ma, S.; Zhou, X. Application of Transvaginal Sonographic Elastography to Distinguish Endometrial Cancer from Benign Masses. Am. J. Transl. Res. 2019, 11, 1049–1057. [Google Scholar] [PubMed]
- Parazzini, F.; Mais, V.; Cipriani, S.; Busacca, M.; Venturini, P. GISE Determinants of Adenomyosis in Women Who Underwent Hysterectomy for Benign Gynecological Conditions: Results from a Prospective Multicentric Study in Italy. Eur. J. Obs. Gynecol. Reprod. Biol. 2009, 143, 103–106. [Google Scholar] [CrossRef] [PubMed]
- Taran, F.A.; Stewart, E.A.; Brucker, S. Adenomyosis: Epidemiology, Risk Factors, Clinical Phenotype and Surgical and Interventional Alternatives to Hysterectomy. Geburtshilfe Frauenheilkd 2013, 73, 924–931. [Google Scholar] [CrossRef] [PubMed] [Green Version]
- Ozturk, A.; Grajo, J.R.; Dhyani, M.; Anthony, B.W.; Samir, A.E. Principles of ultrasound elastography. Abdom. Radiol. 2018, 43, 773–785. [Google Scholar] [CrossRef]
- Carlsen, J.; Ewertsen, C.; Sletting, S.; Vejborg, I.; Schäfer, F.K.W.; Cosgrove, D.; Bachmann Nielsen, M. Ultrasound Elastography in Breast Cancer Diagnosis. Ultraschall Med. 2015, 36, 550–562. [Google Scholar] [CrossRef]
- Dhyani, M.; Anvari, A.; Samir, A.E. Ultrasound Elastography: Liver. Abdom. Imaging 2015, 40, 698–708. [Google Scholar] [CrossRef]
- Gennisson, J.-L.; Deffieux, T.; Fink, M.; Tanter, M. Ultrasound Elastography: Principles and Techniques. Diagn. Interv. Imaging 2013, 94, 487–495. [Google Scholar] [CrossRef]
- He, H.-Y.; Chen, J.-L.; Ma, H.; Zhu, J.; Wu, D.-D.; Lv, X.-D. Value of Endobronchial Ultrasound Elastography in Diagnosis of Central Lung Lesions. Med. Sci. Monit. 2017, 23, 3269–3275. [Google Scholar] [CrossRef] [Green Version]
- Shao, J.; Shi, G.; Qi, Z.; Zheng, J.; Chen, S. Advancements in the Application of Ultrasound Elastography in the Cervix. Ultrasound Med. Biol. 2021, 47, 2048–2063. [Google Scholar] [CrossRef]
- Stoelinga, B.; Hehenkamp, W.J.K.; Brölmann, H.A.M.; Huirne, J.A.F. Real-Time Elastography for Assessment of Uterine Disorders. Ultrasound Obs. Gynecol. 2014, 43, 218–226. [Google Scholar] [CrossRef]
- Stoelinga, B.; Hehenkamp, W.J.K.; Nieuwenhuis, L.L.; Conijn, M.M.A.; van Waesberghe, J.H.T.M.; Brölmann, H.A.M.; Huirne, J.A.F. Accuracy and Reproducibility of Sonoelastography for the Assessment of Fibroids and Adenomyosis, with Magnetic Resonance Imaging as Reference Standard. Ultrasound Med. Biol. 2018, 44, 1654–1663. [Google Scholar] [CrossRef]
- Shwayder, J.; Sakhel, K. Imaging for Uterine Myomas and Adenomyosis. J. Minim. Invasive Gynecol. 2014, 21, 362–376. [Google Scholar] [CrossRef]
- Pongpunprut, S.; Panburana, P.; Wibulpolprasert, P.; Waiyaput, W.; Sroyraya, M.; Chansoon, T.; Sophonsritsuk, A. A Comparison of Shear Wave Elastography between Normal Myometrium, Uterine Fibroids, and Adenomyosis: A Cross-Sectional Study. Int. J. Fertil. Steril. 2022, 16, 49–54. [Google Scholar] [CrossRef]
- Hanafi, M. Ultrasound Diagnosis of Adenomyosis, Leiomyoma, or Combined with Histopathological Correlation. J. Hum. Reprod. Sci. 2013, 6, 189–193. [Google Scholar] [CrossRef]
- Meredith, S.M.; Sanchez-Ramos, L.; Kaunitz, A.M. Diagnostic Accuracy of Transvaginal Sonography for the Diagnosis of Adenomyosis: Systematic Review and Metaanalysis. Am. J. Obstet. Gynecol. 2009, 201, e1–e6. [Google Scholar] [CrossRef]
- Parazzini, F.; Vercellini, P.; Panazza, S.; Chatenoud, L.; Oldani, S.; Crosignani, P.G. Risk Factors for Adenomyosis. Hum. Reprod. 1997, 12, 1275–1279. [Google Scholar] [CrossRef] [Green Version]
- Levgur, M.; Abadi, M.A.; Tucker, A. Adenomyosis: Symptoms, Histology, and Pregnancy Terminations. Obstet. Gynecol. 2000, 95, 688–691. [Google Scholar] [CrossRef]
- Güzel, A.İ.; Akselim, B.; Erkılınç, S.; Kokanalı, K.; Tokmak, A.; Dolmuş, B.; Doğanay, M. Risk Factors for Adenomyosis, Leiomyoma and Concurrent Adenomyosis and Leiomyoma. J. Obstet. Gynaecol. Res. 2015, 41, 932–937. [Google Scholar] [CrossRef]
- Serdar, C.C.; Cihan, M.; Yücel, D.; Serdar, M.A. Sample Size, Power and Effect Size Revisited: Simplified and Practical Approaches in Pre-Clinical, Clinical and Laboratory Studies. Biochem. Med. 2021, 31, 010502. [Google Scholar] [CrossRef]

| Parameter | Study Group (n = 17) | Controls (n = 46) | p Value | |
|---|---|---|---|---|
| Age (mean ± SD) a | 47.12 ± 4.10 | 37.8 ± 7.76 | <0.01 | |
| BMI (mean ± SD) a | 25.31 ± 4.45 | 24.28 ± 3.25 | 0.39 | |
| Curettage history b | Positive (%) | 15.87 | 19.04 | 0.01, OR = 4.04 (95% CI: 1.20–12.97) |
| Negative (%) | 11.11 | 53.96 | ||
| C-section history b | Positive (%) | 4.76 | 19.04 | 0.48, OR = 0.60 (95% CI: 0.16–2.20) |
| Negative (%) | 22.22 | 53.96 | ||
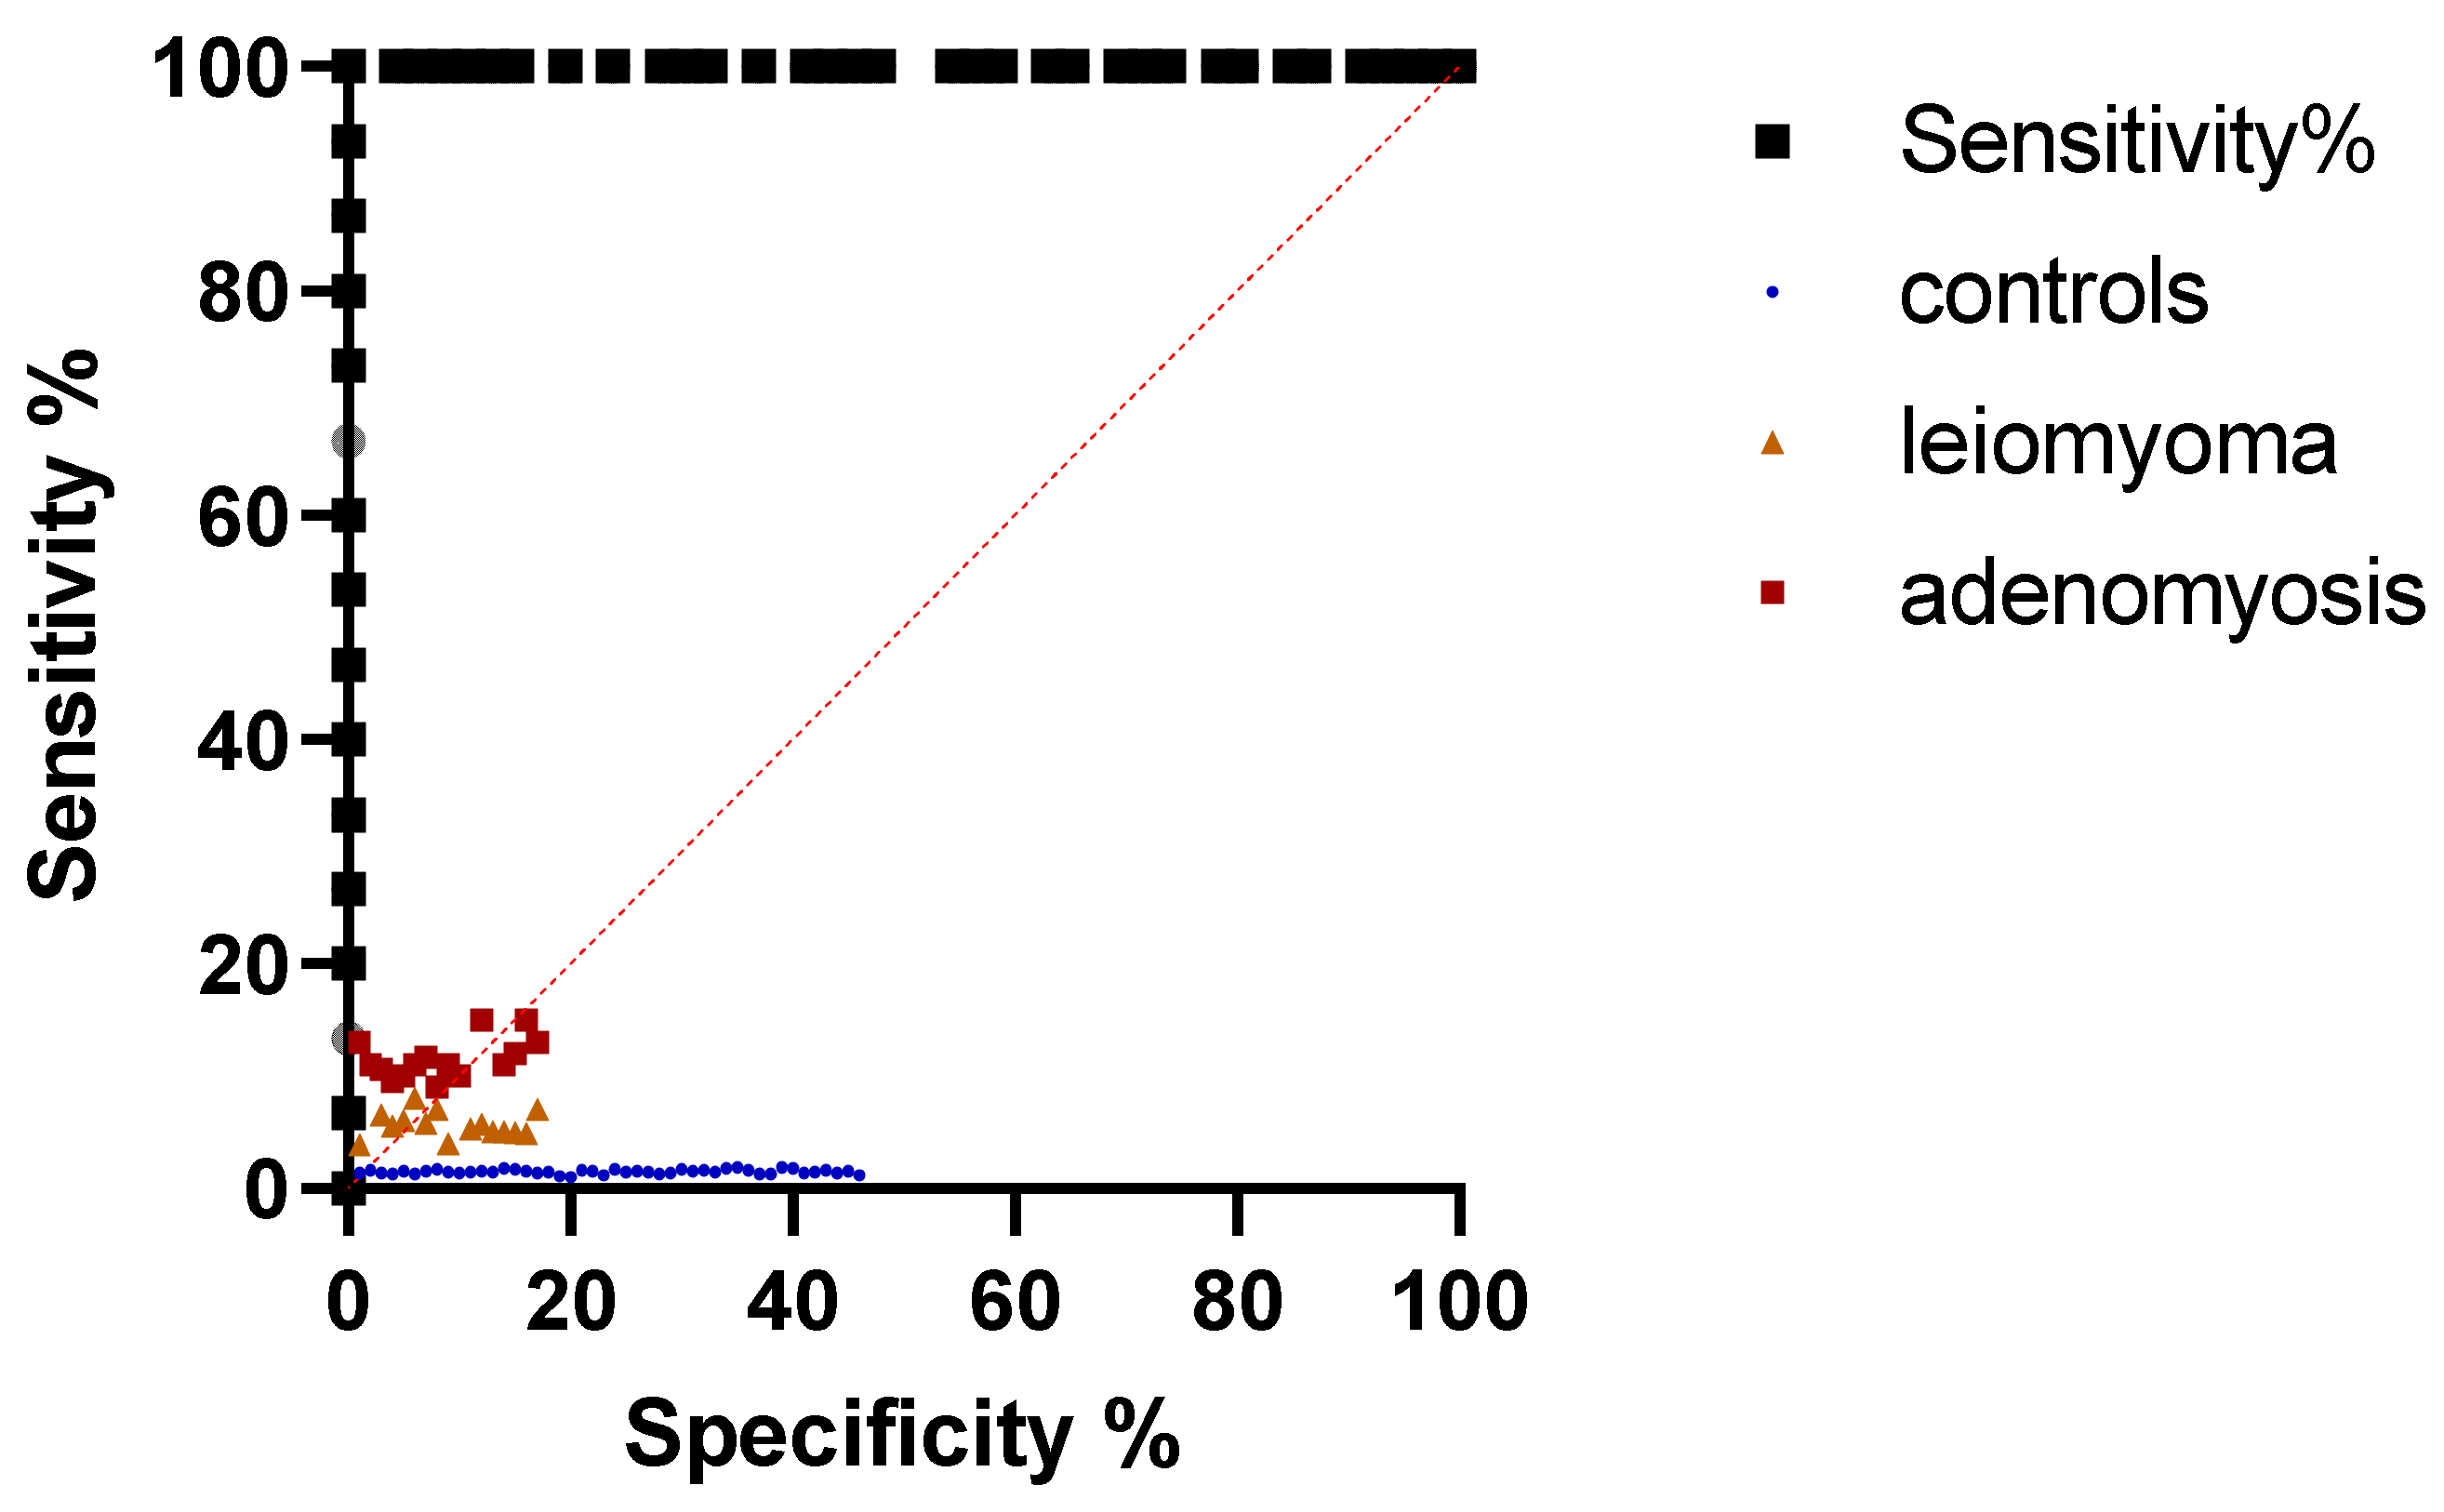
| Parameter | AUC (95% CI) | Cut Off | Sensitivity (95% CI) | Specificity (95% CI) | p Value |
|---|---|---|---|---|---|
| mean SR | 1.00 (1-1) | >5.42 | 100% (79.61–100%) | 100% (92.29–100%) | <0.001 |
| max SR | 1.00 (1-1) | >5.80 | 100% (79.61–100%) | 100% (92.29–100%) | <0.001 |
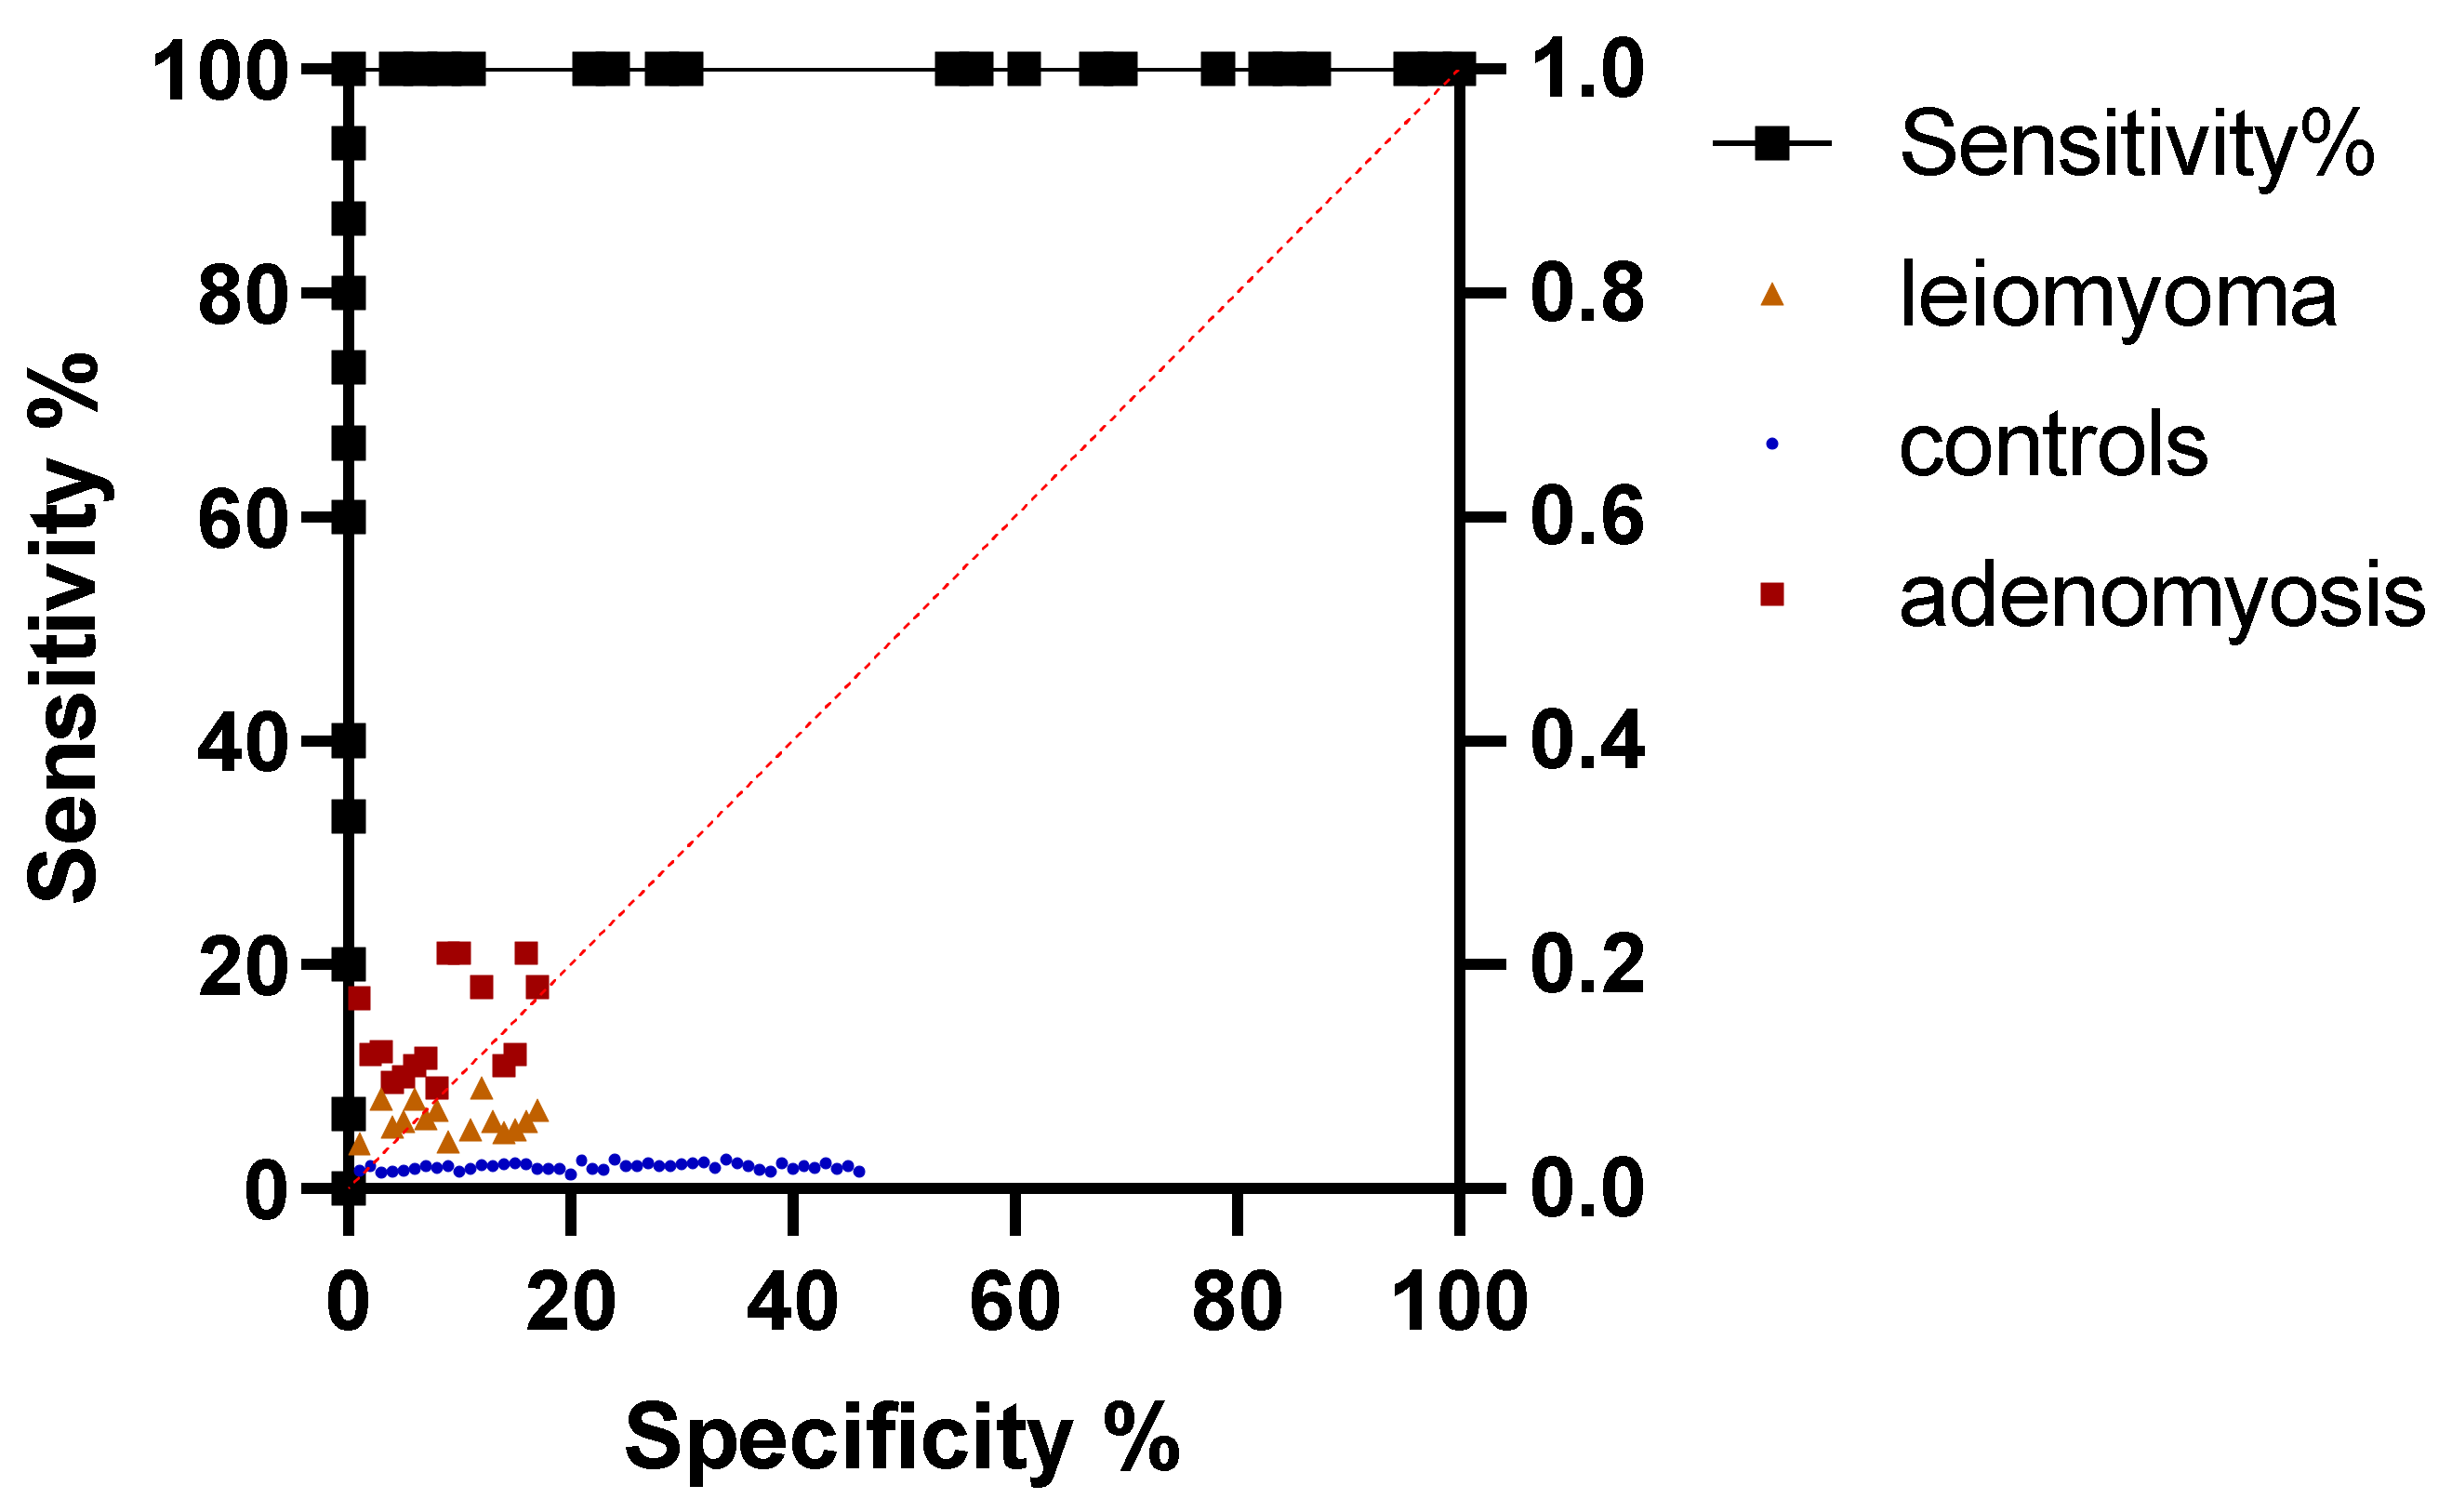
| Parameter | AUC (95% CI) | Cut Off | Sensitivity (95% CI) | Specificity (95% CI) | p Value |
|---|---|---|---|---|---|
| mean SR | 1.00 (1-1) | >2.85 | 100% (79.61–100%) | 100% (92.29–100%) | <0.001 |
| max SR | 1.00 (1-1) | >3.30 | 100% (79.61–100%) | 100% (92.29–100%) | <0.001 |
Publisher’s Note: MDPI stays neutral with regard to jurisdictional claims in published maps and institutional affiliations. |
© 2022 by the authors. Licensee MDPI, Basel, Switzerland. This article is an open access article distributed under the terms and conditions of the Creative Commons Attribution (CC BY) license (https://creativecommons.org/licenses/by/4.0/).
Share and Cite
Săsăran, V.; Turdean, S.; Mărginean, C.; Gliga, M.; Ilyes, L.; Grama, O.; Pușcașiu, L. Transvaginal Ultrasound Combined with Strain-Ratio Elastography for the Concomitant Diagnosis of Uterine Fibroids and Adenomyosis: A Pilot Study. J. Clin. Med. 2022, 11, 3757. https://doi.org/10.3390/jcm11133757
Săsăran V, Turdean S, Mărginean C, Gliga M, Ilyes L, Grama O, Pușcașiu L. Transvaginal Ultrasound Combined with Strain-Ratio Elastography for the Concomitant Diagnosis of Uterine Fibroids and Adenomyosis: A Pilot Study. Journal of Clinical Medicine. 2022; 11(13):3757. https://doi.org/10.3390/jcm11133757
Chicago/Turabian StyleSăsăran, Vlăduț, Sabin Turdean, Claudiu Mărginean, Marius Gliga, Levente Ilyes, Ovidiu Grama, and Lucian Pușcașiu. 2022. "Transvaginal Ultrasound Combined with Strain-Ratio Elastography for the Concomitant Diagnosis of Uterine Fibroids and Adenomyosis: A Pilot Study" Journal of Clinical Medicine 11, no. 13: 3757. https://doi.org/10.3390/jcm11133757
APA StyleSăsăran, V., Turdean, S., Mărginean, C., Gliga, M., Ilyes, L., Grama, O., & Pușcașiu, L. (2022). Transvaginal Ultrasound Combined with Strain-Ratio Elastography for the Concomitant Diagnosis of Uterine Fibroids and Adenomyosis: A Pilot Study. Journal of Clinical Medicine, 11(13), 3757. https://doi.org/10.3390/jcm11133757