
Numerical Investigation of Diffusioosmotic Flow in a Tapered Nanochannel


Abstract
:1. Introduction
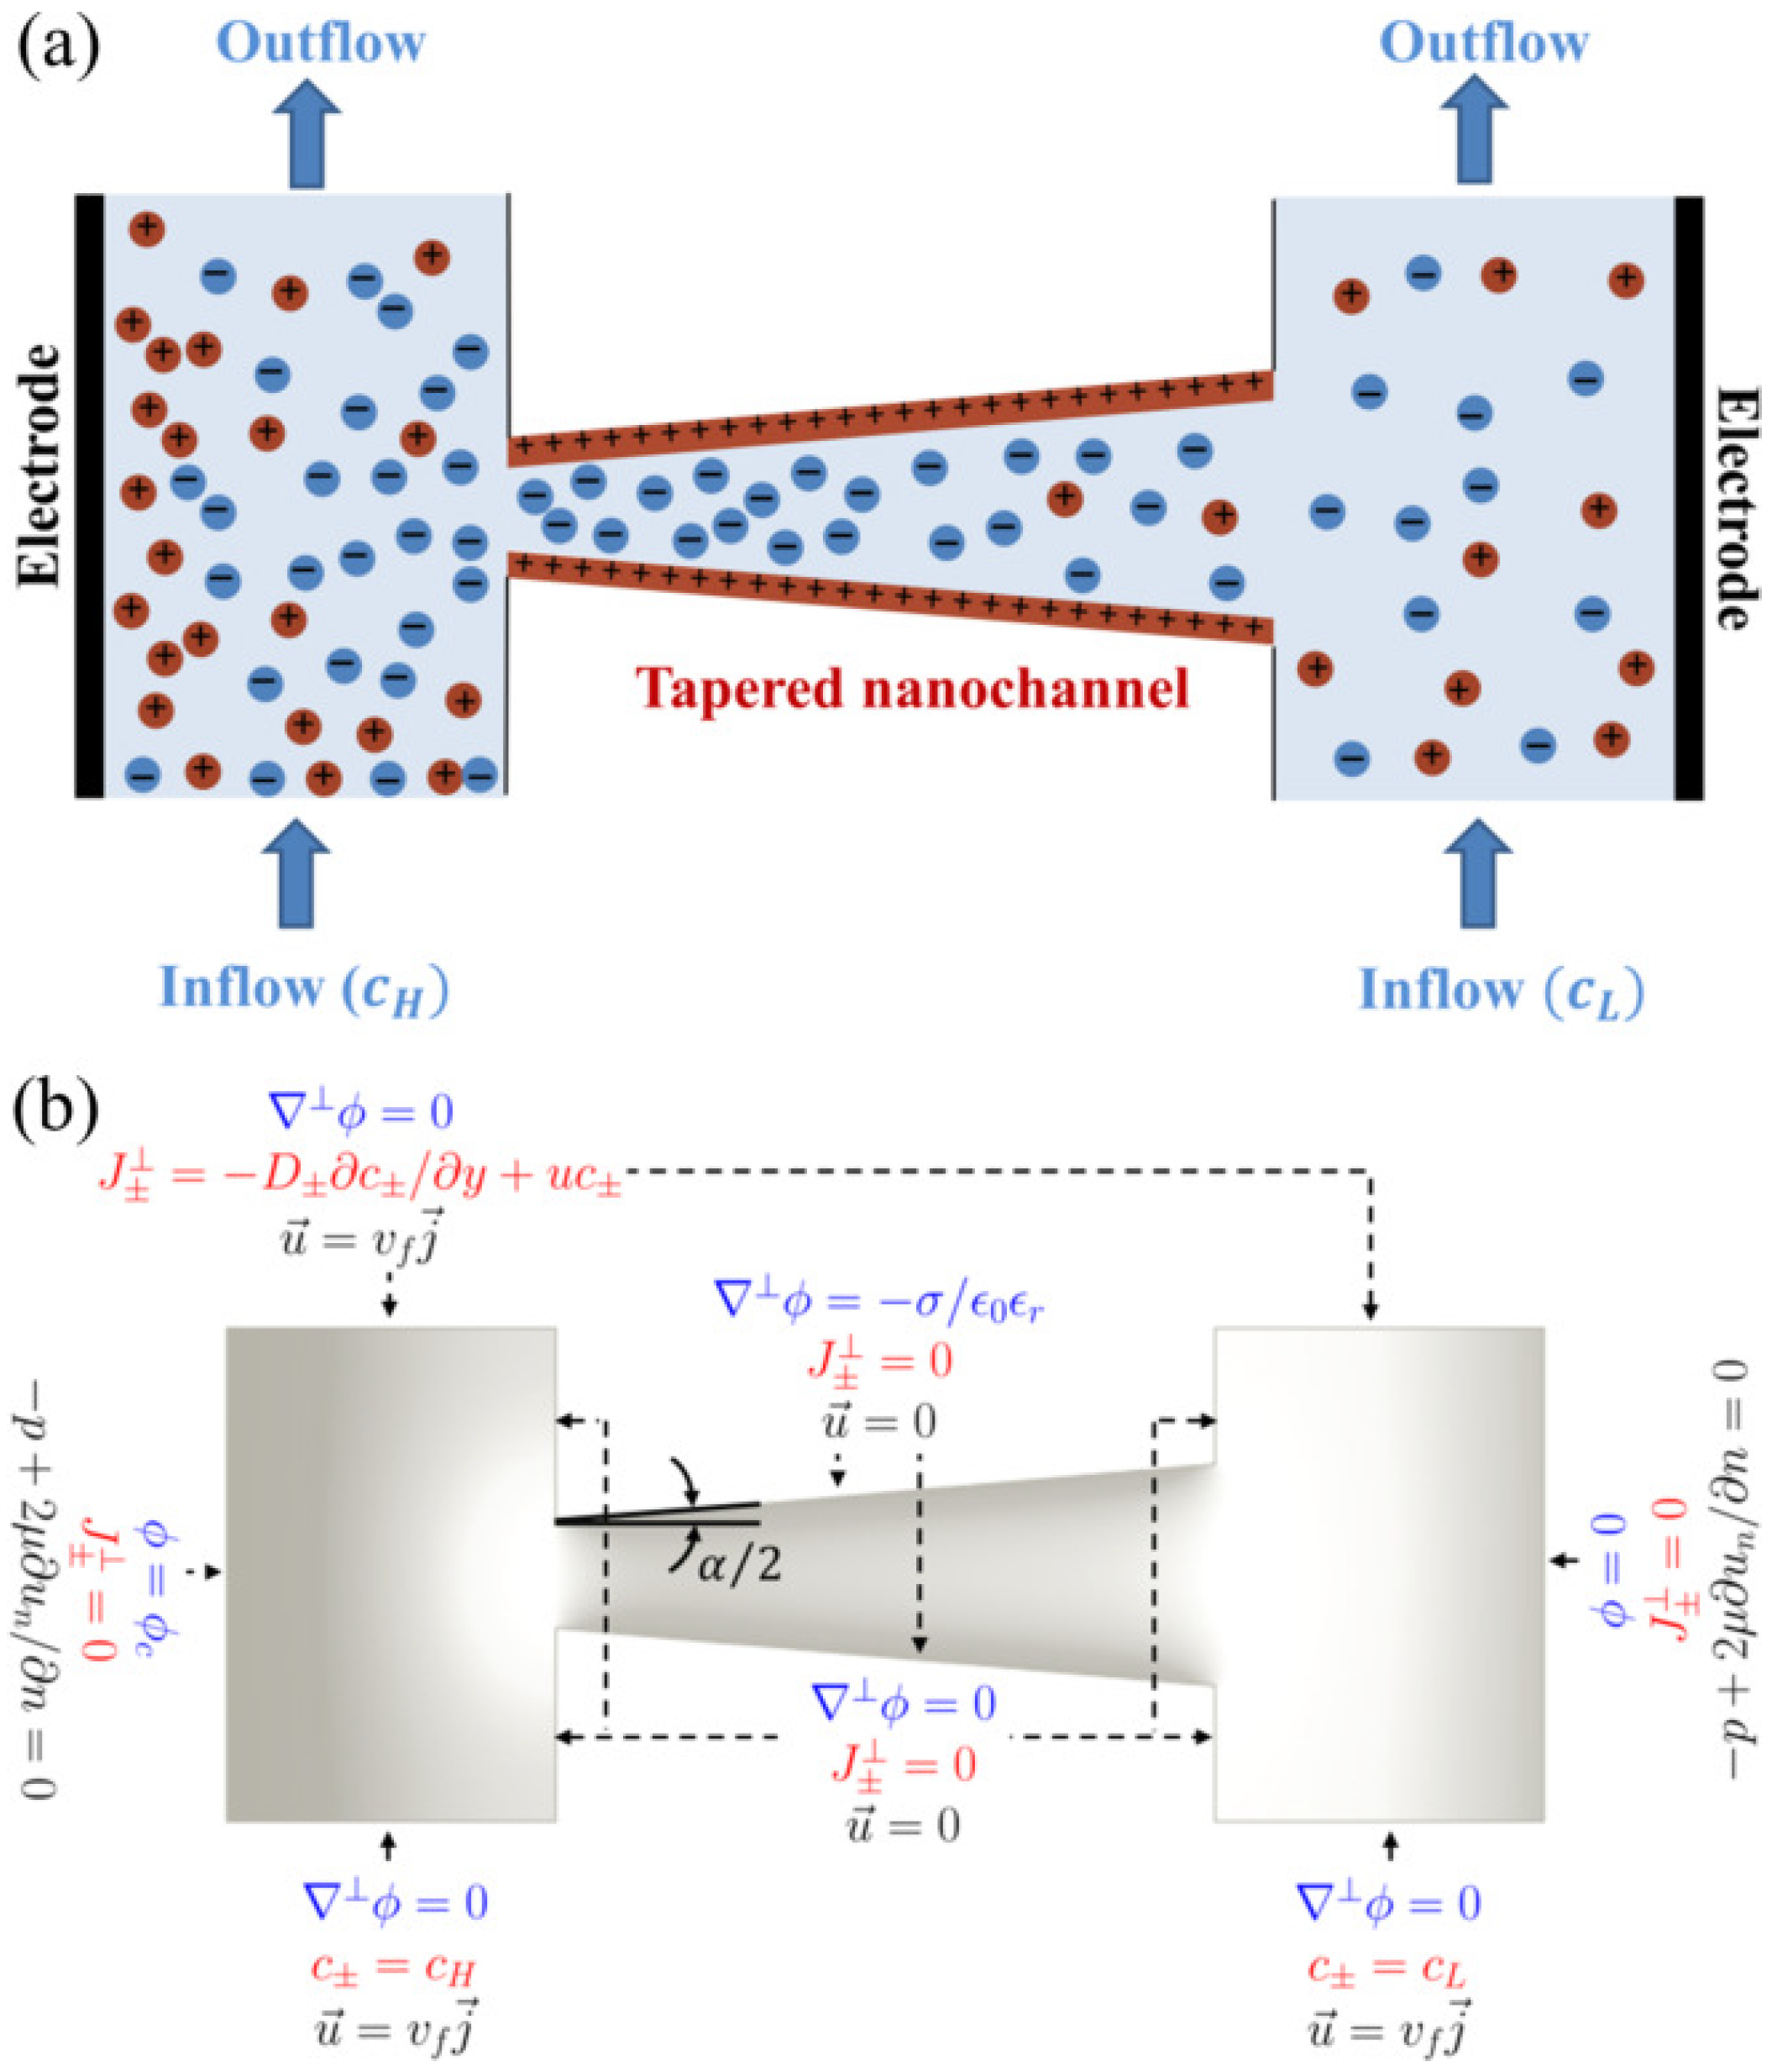
2. Numerical Model
2.1. The Governing Equations
2.2. Boundary Conditions
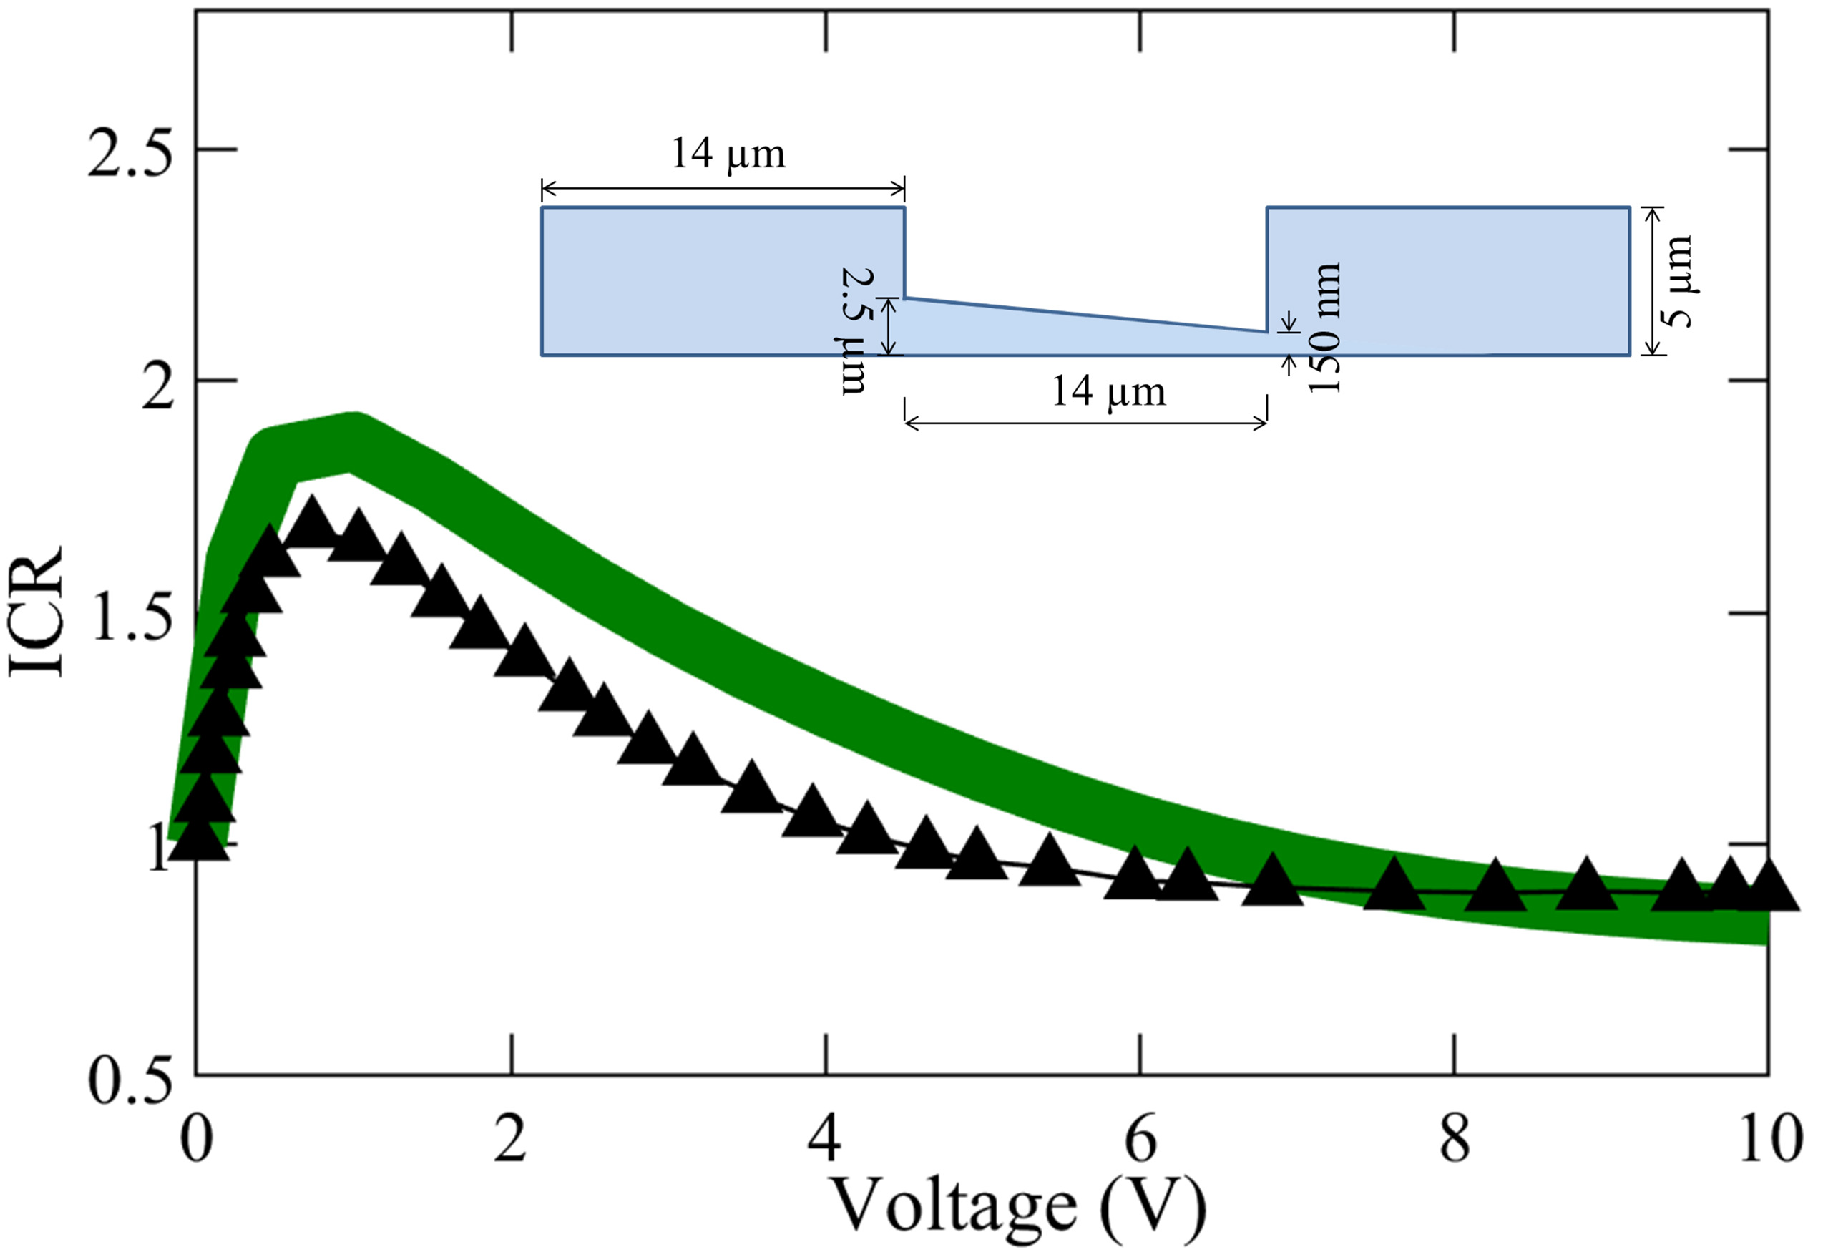
2.3. Numerical Methods and Validation
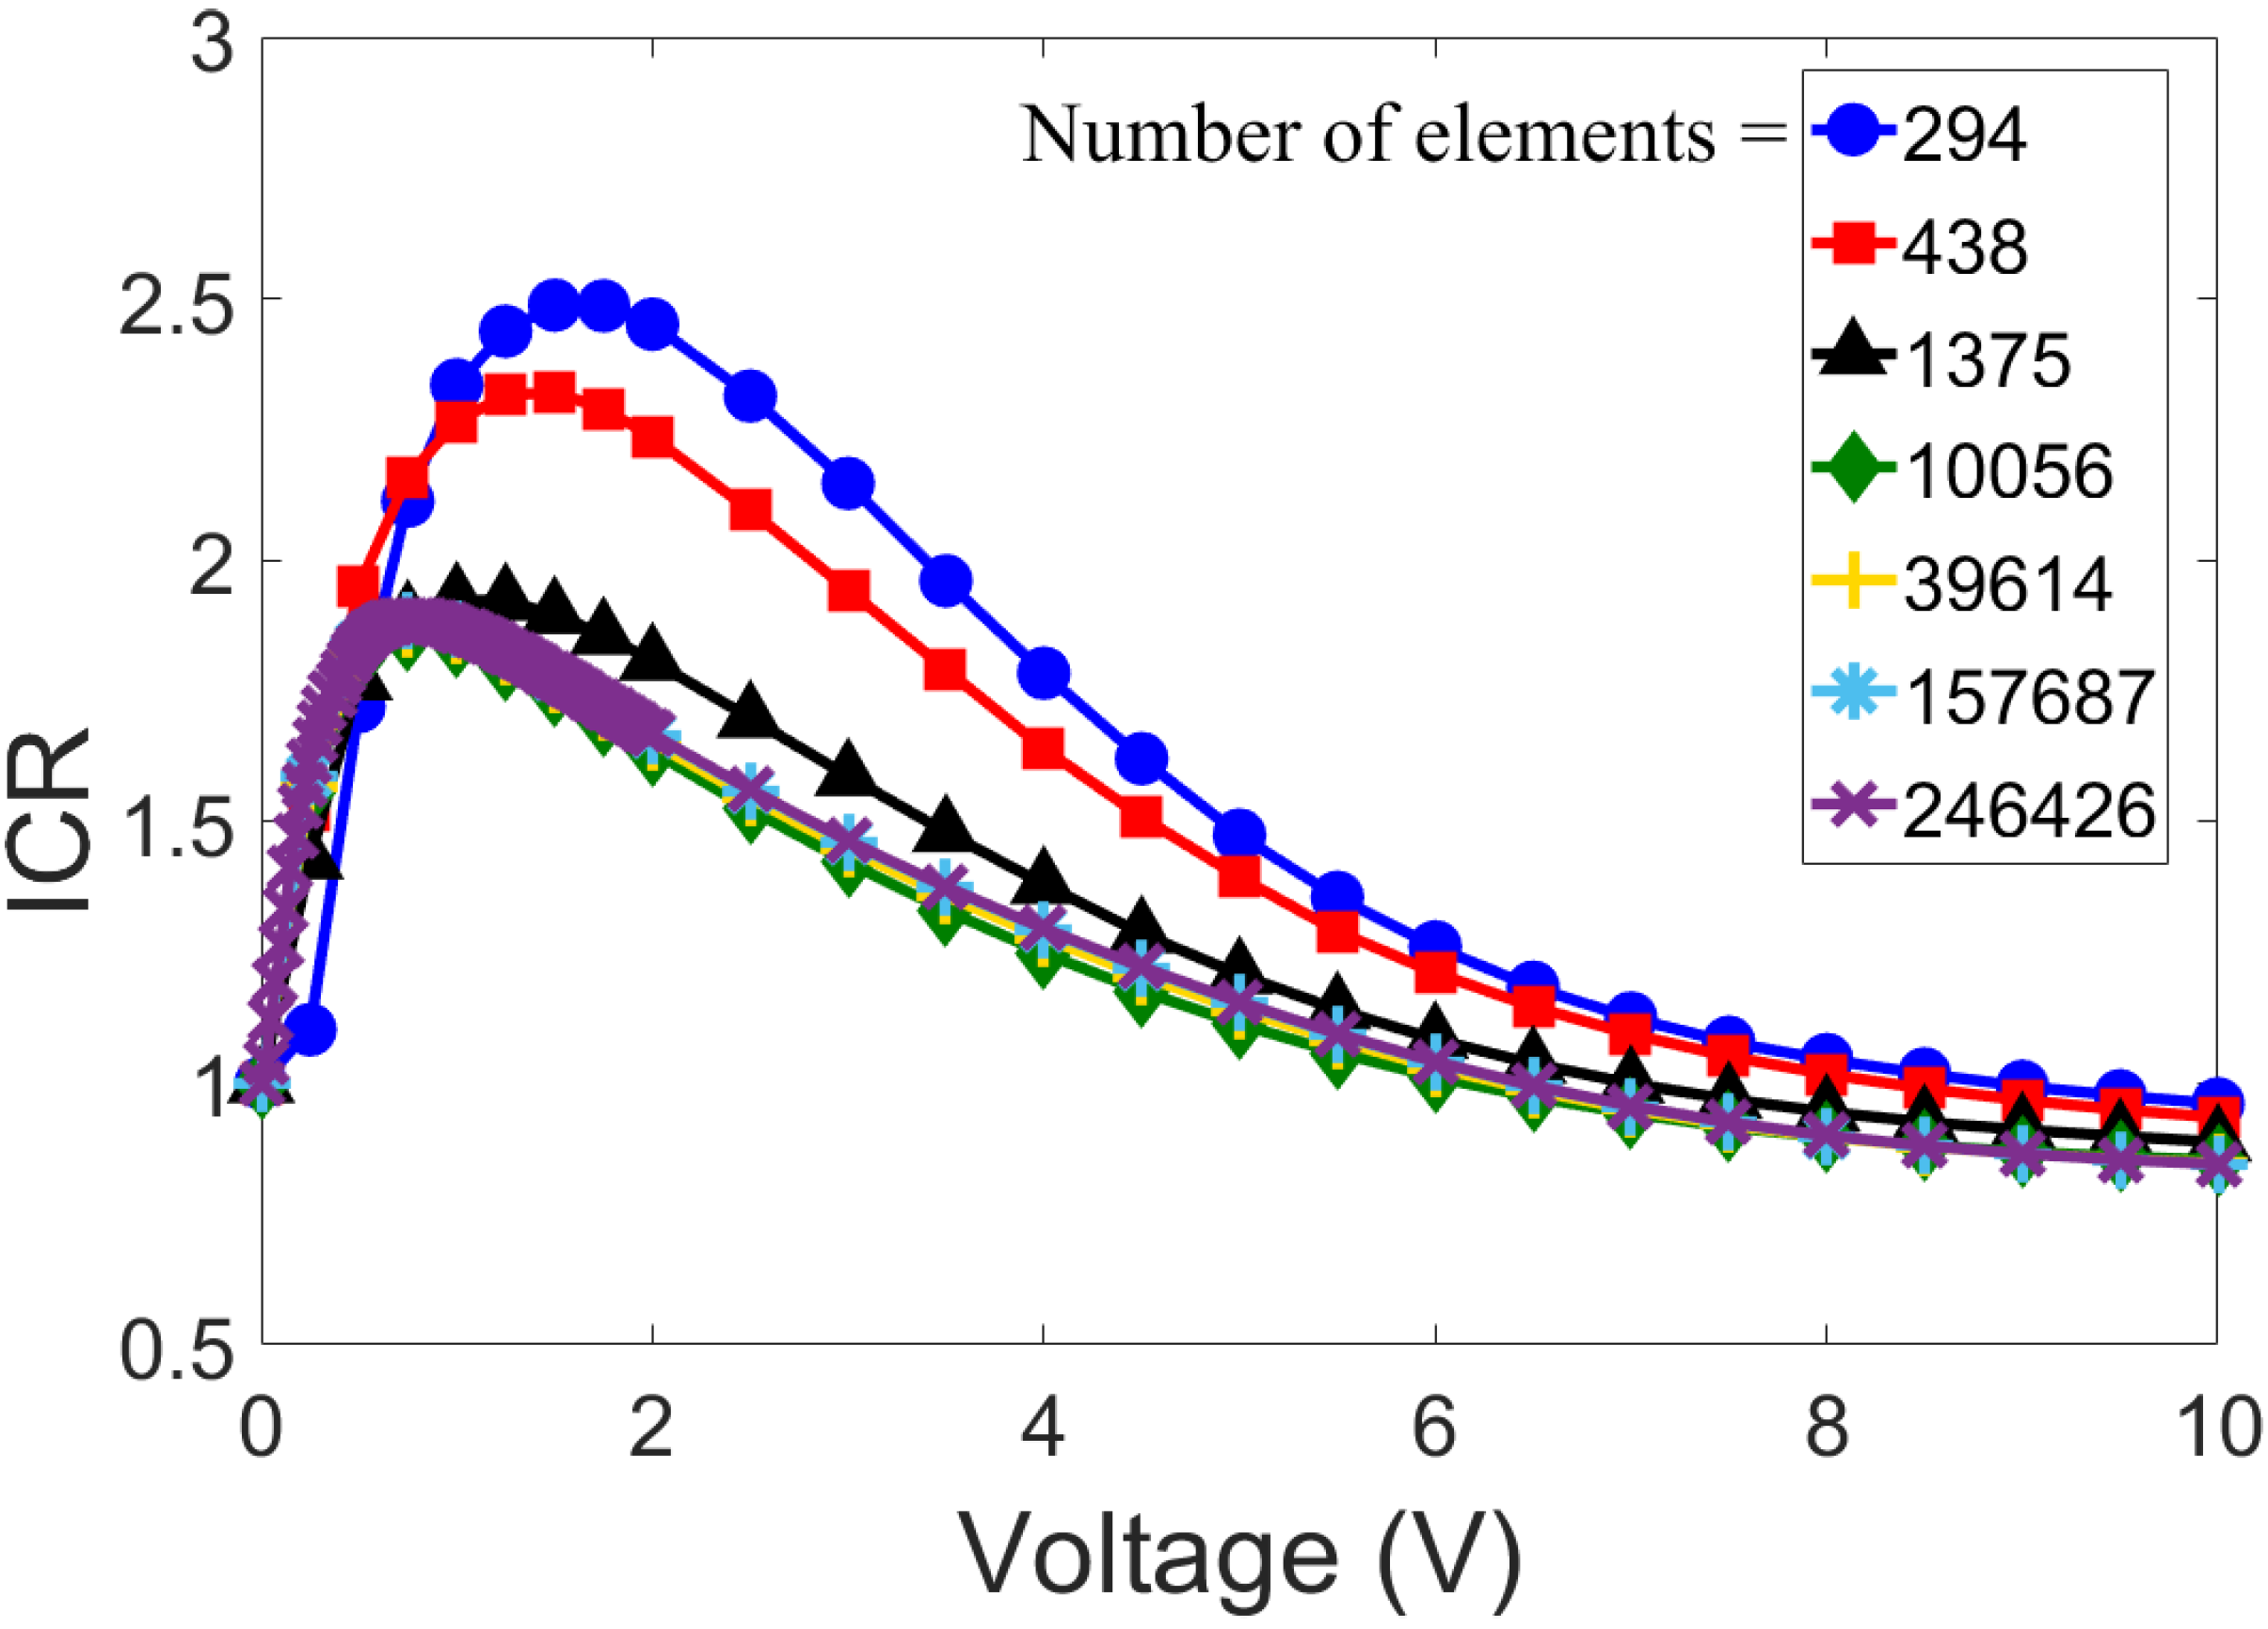
2.4. Mesh Independence Analysis
3. Results
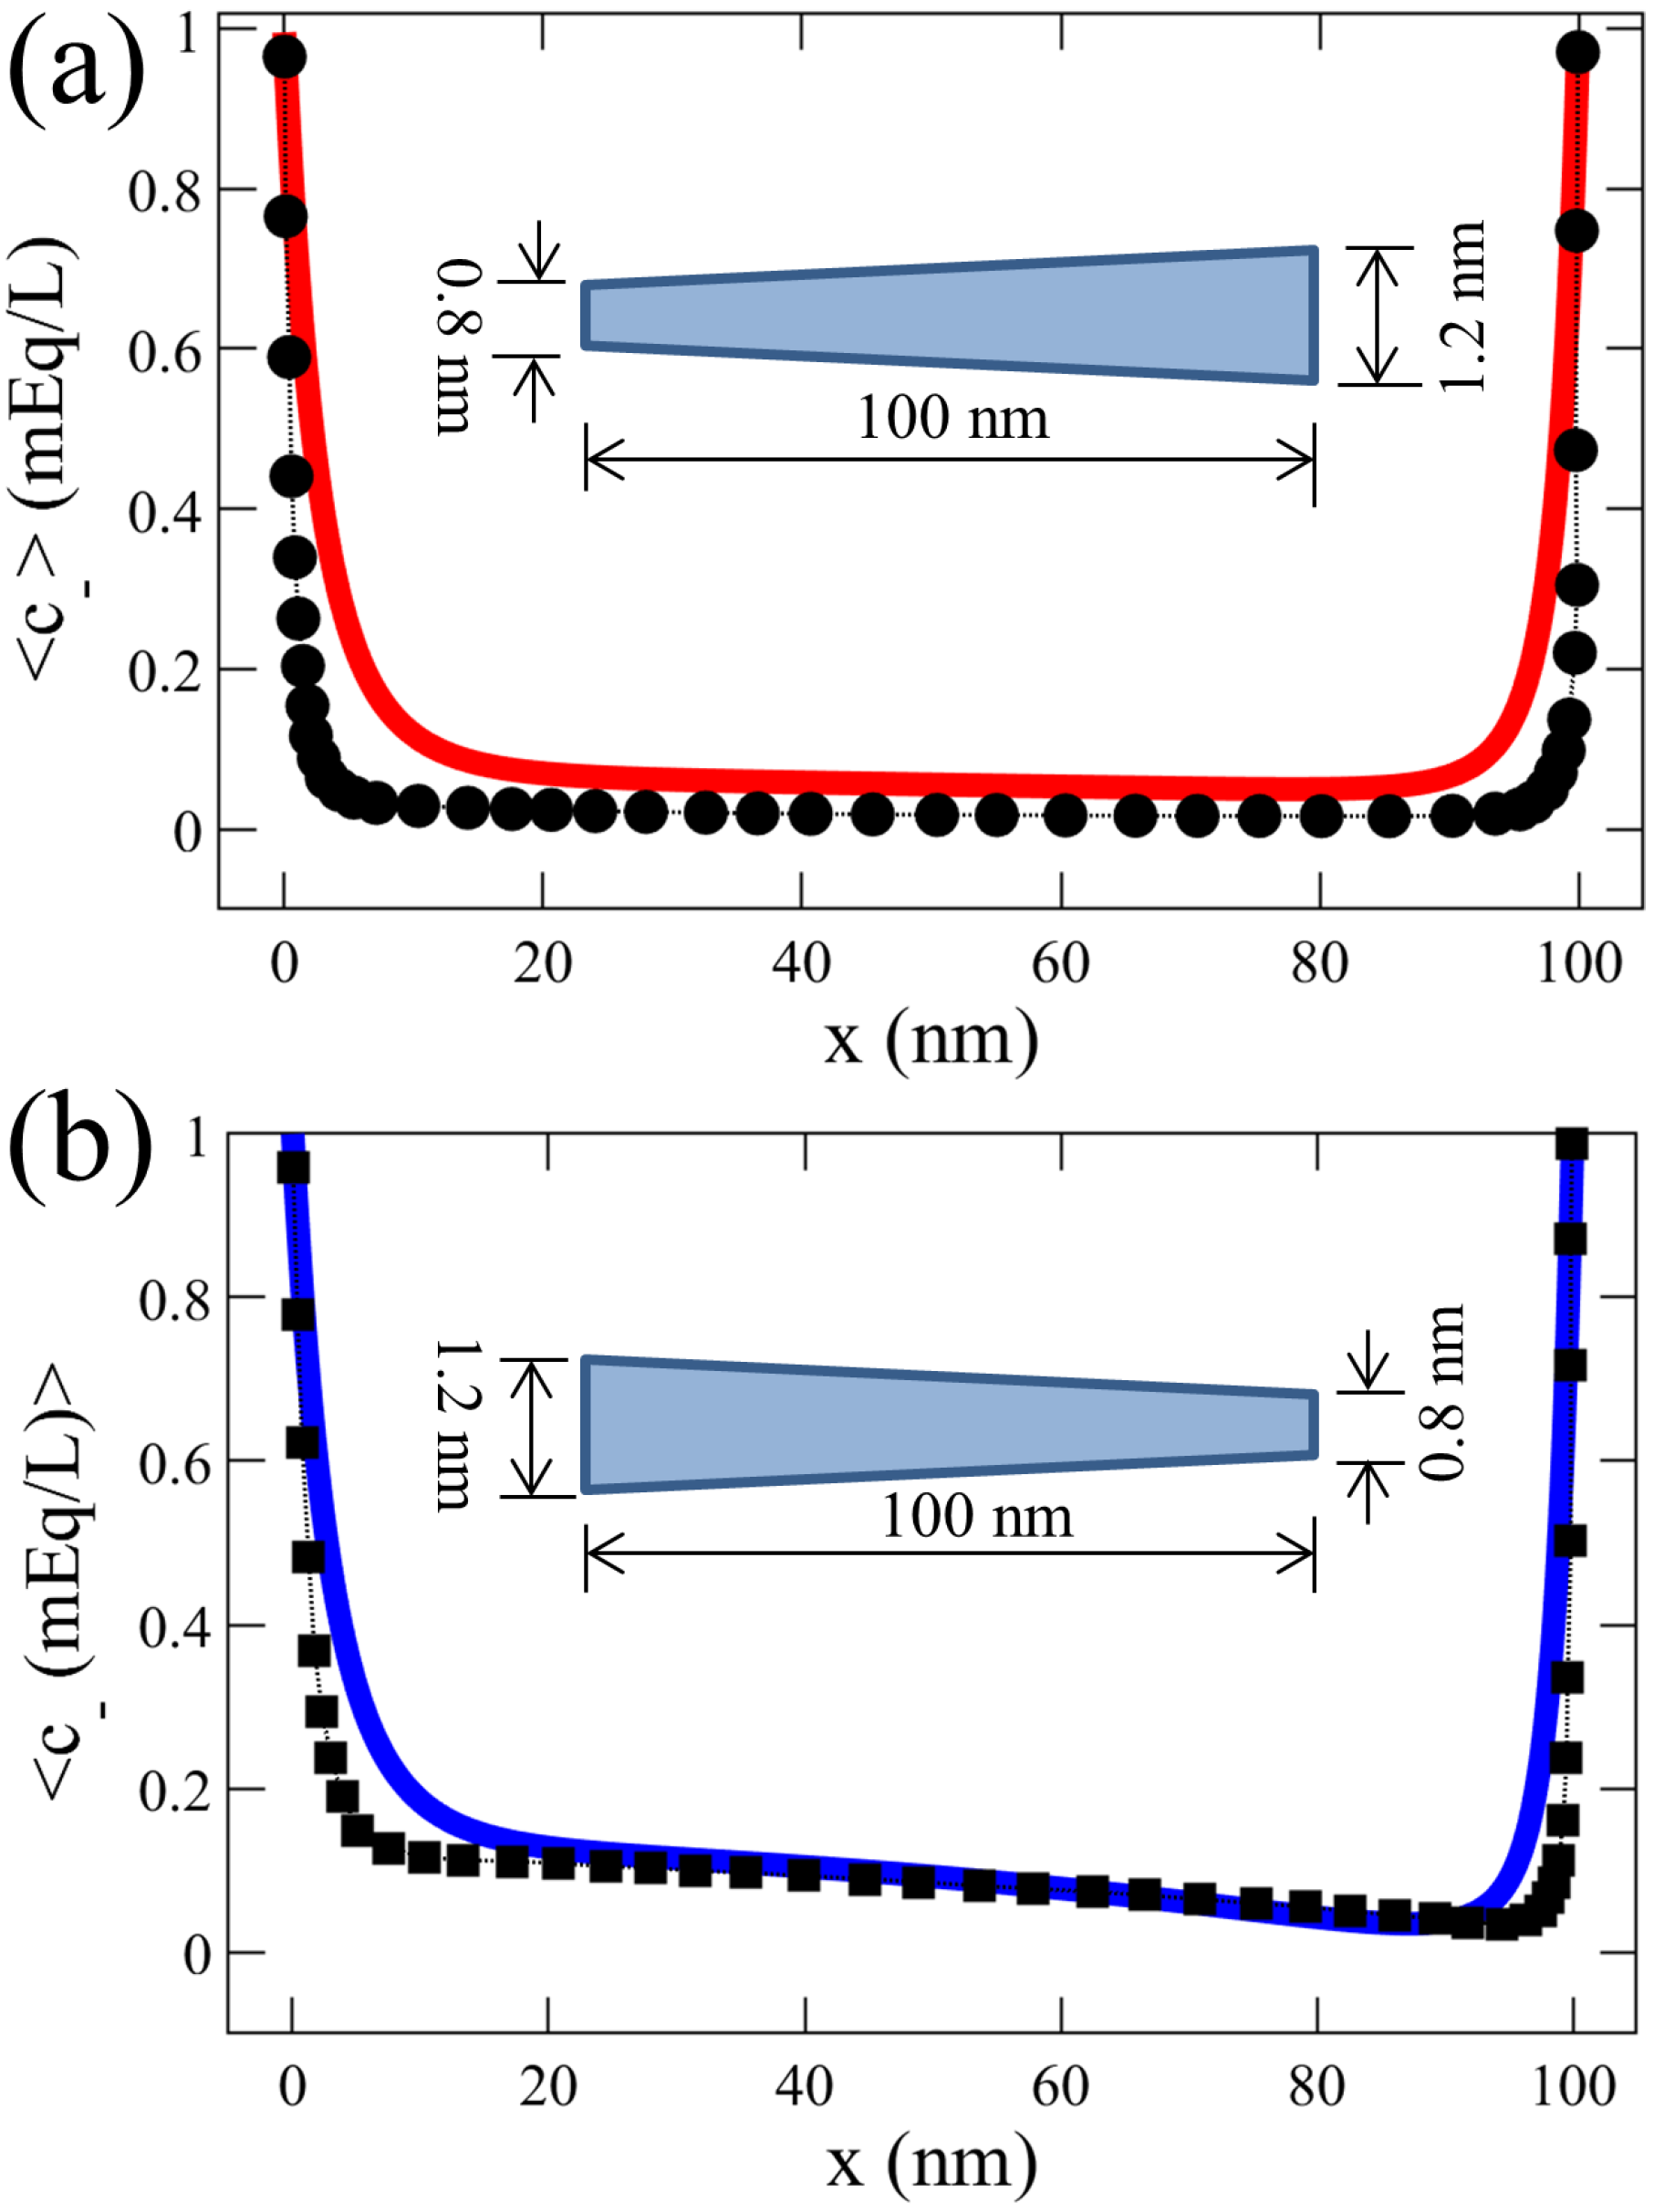
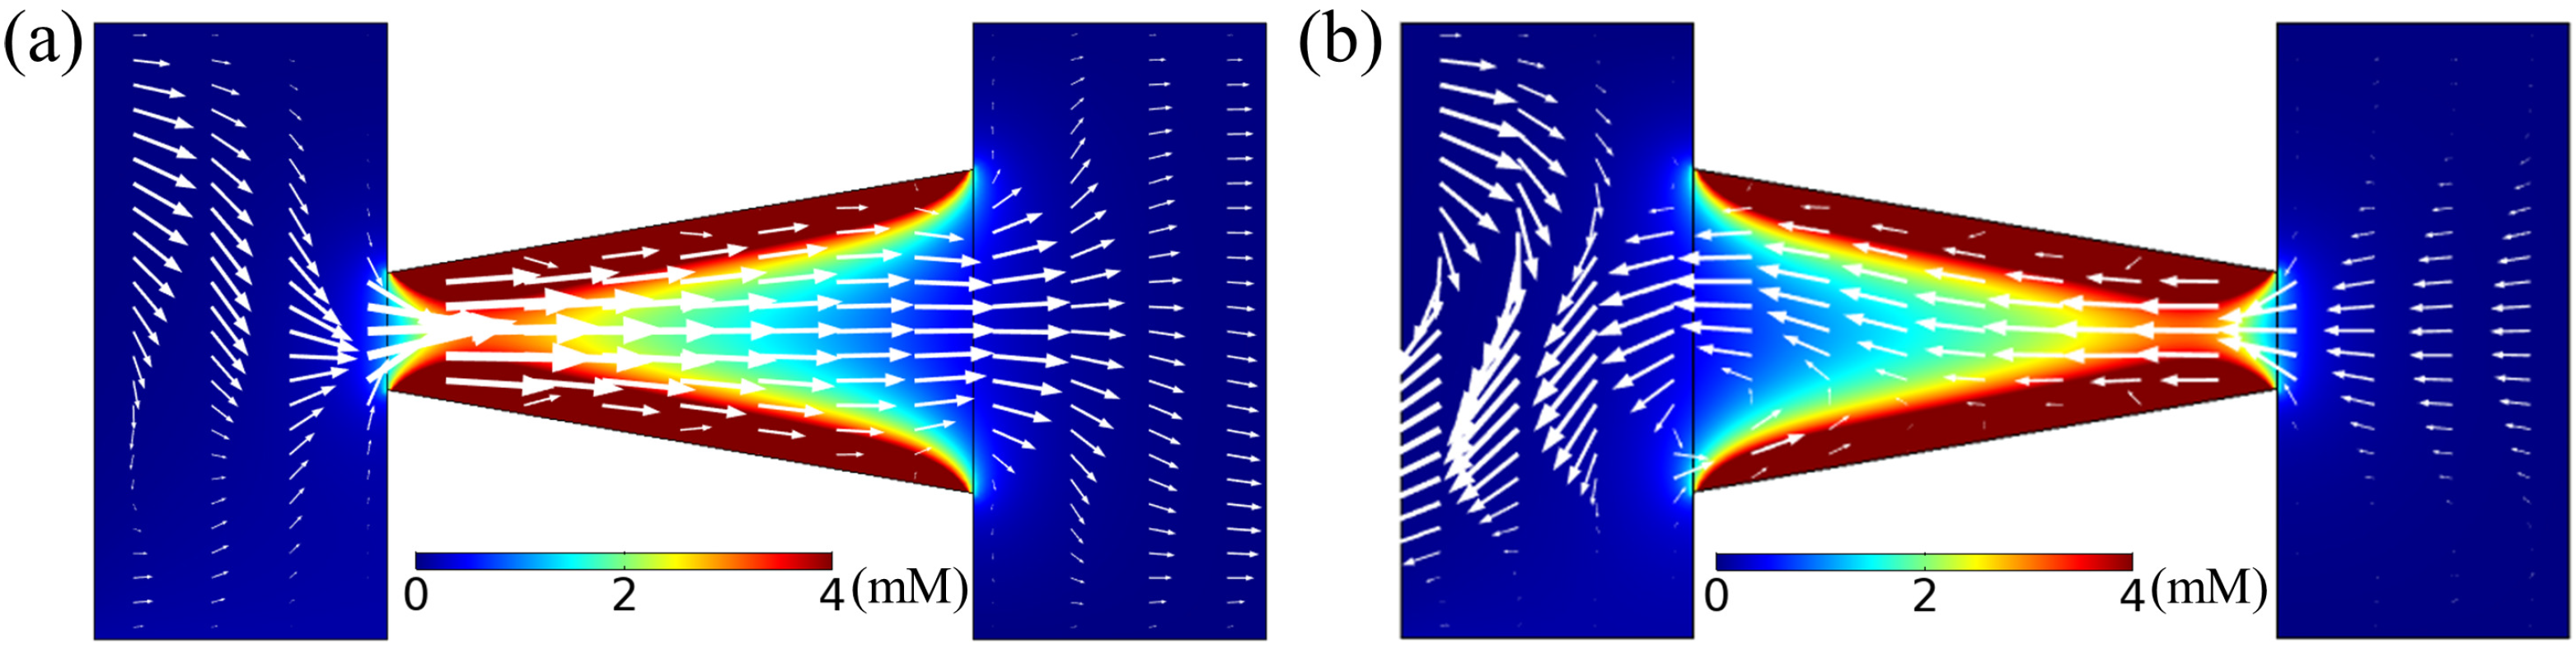
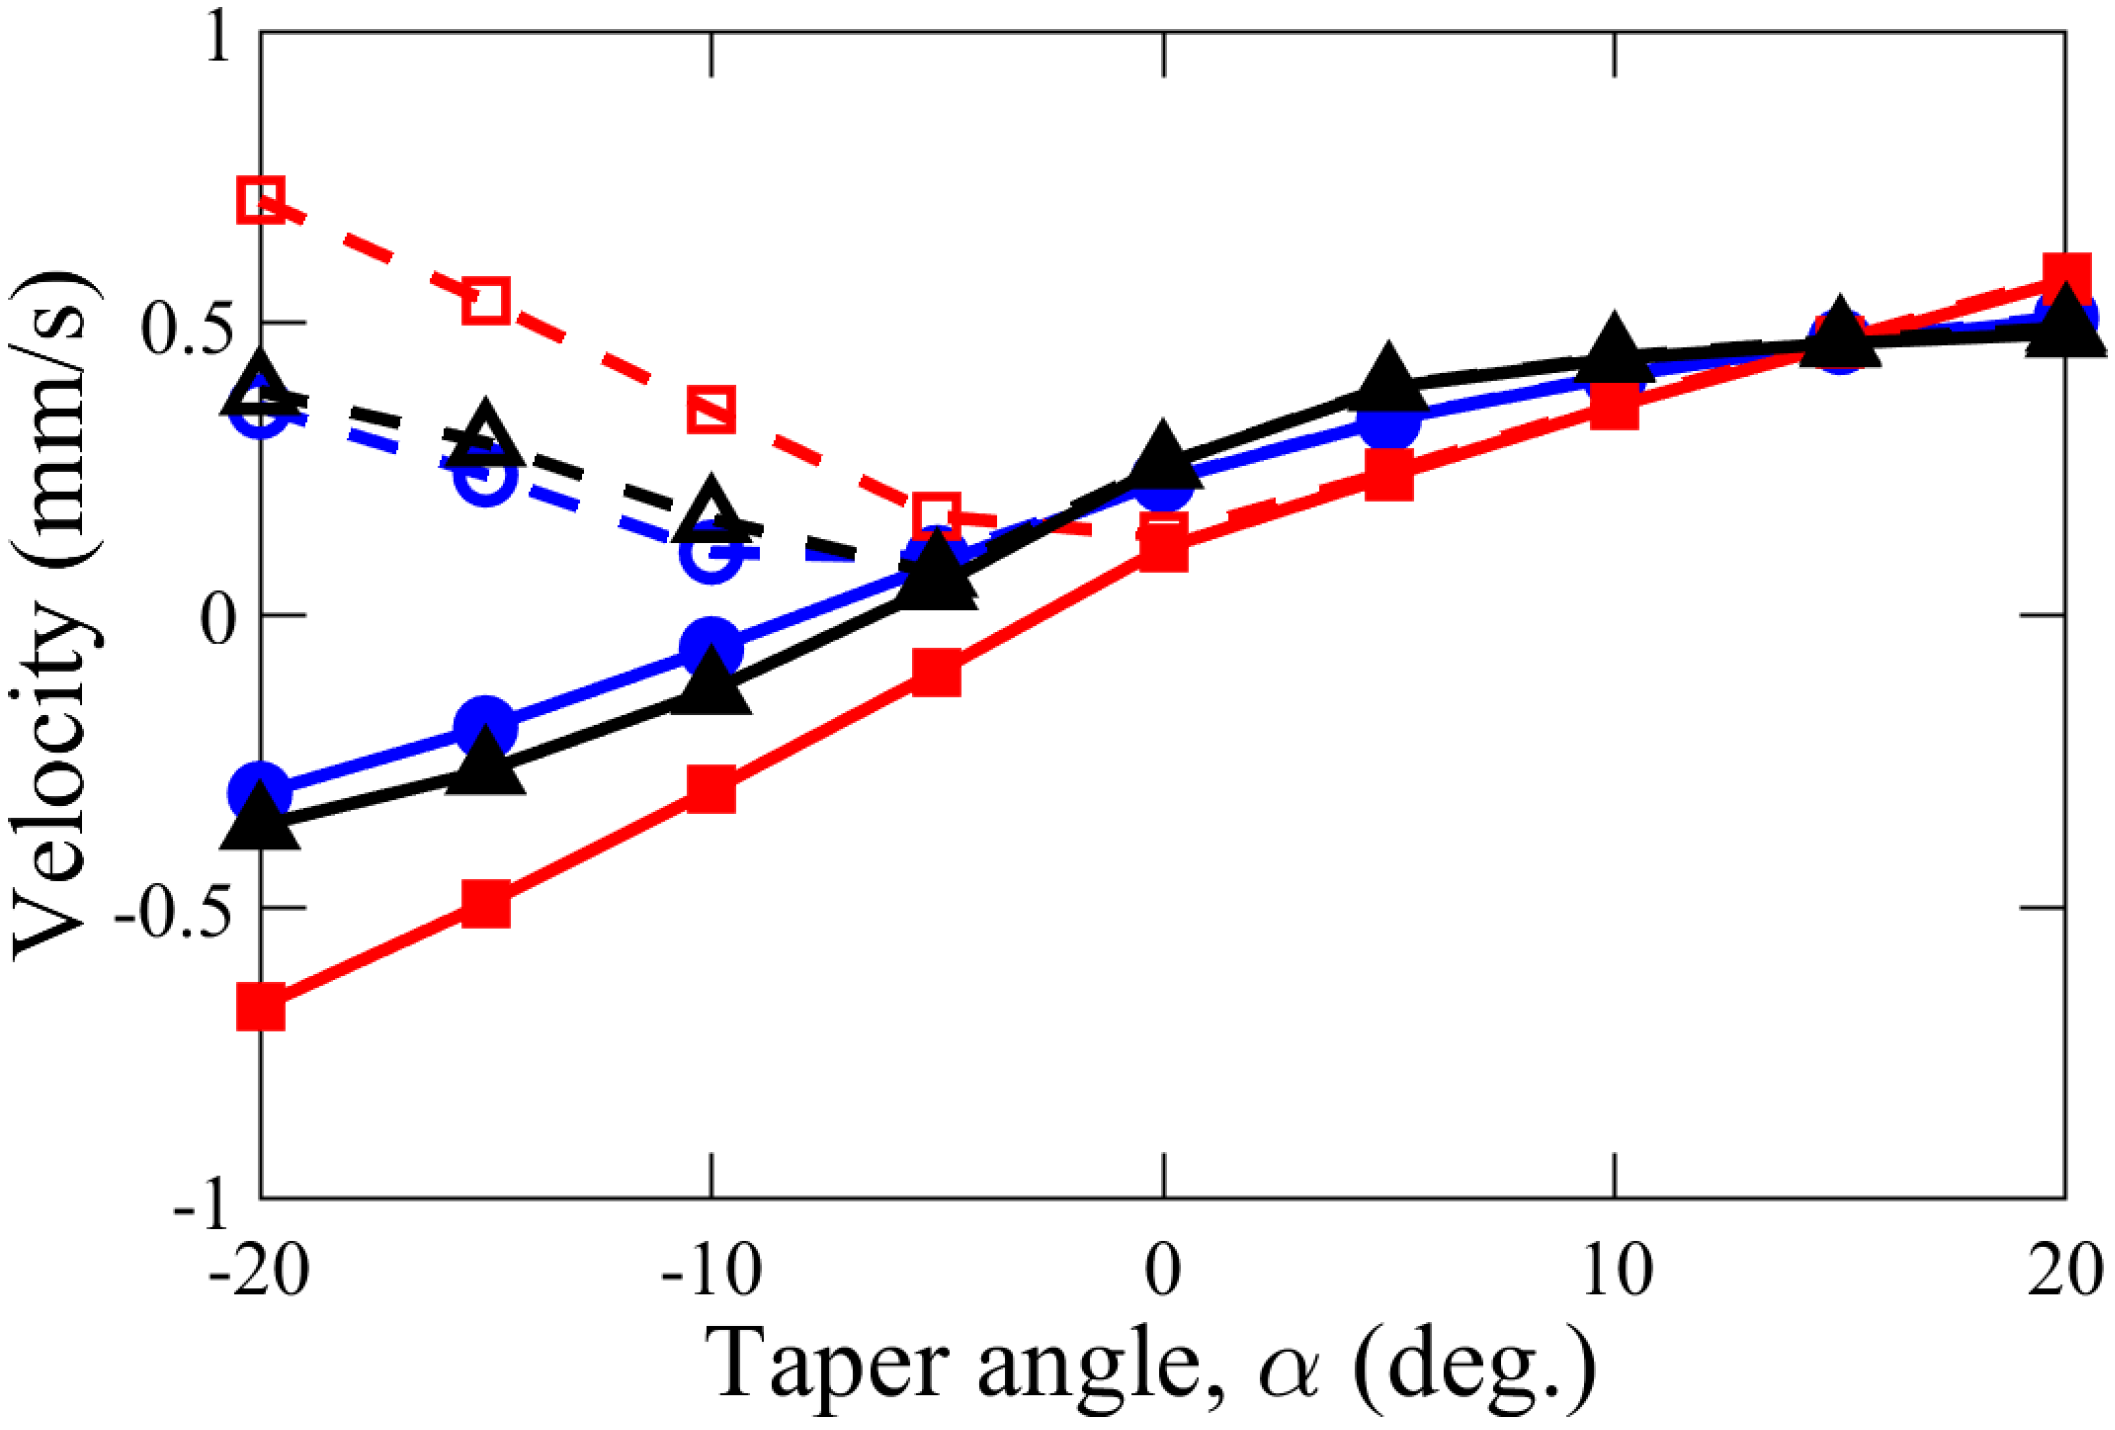
3.1. Impact of Cone Angle
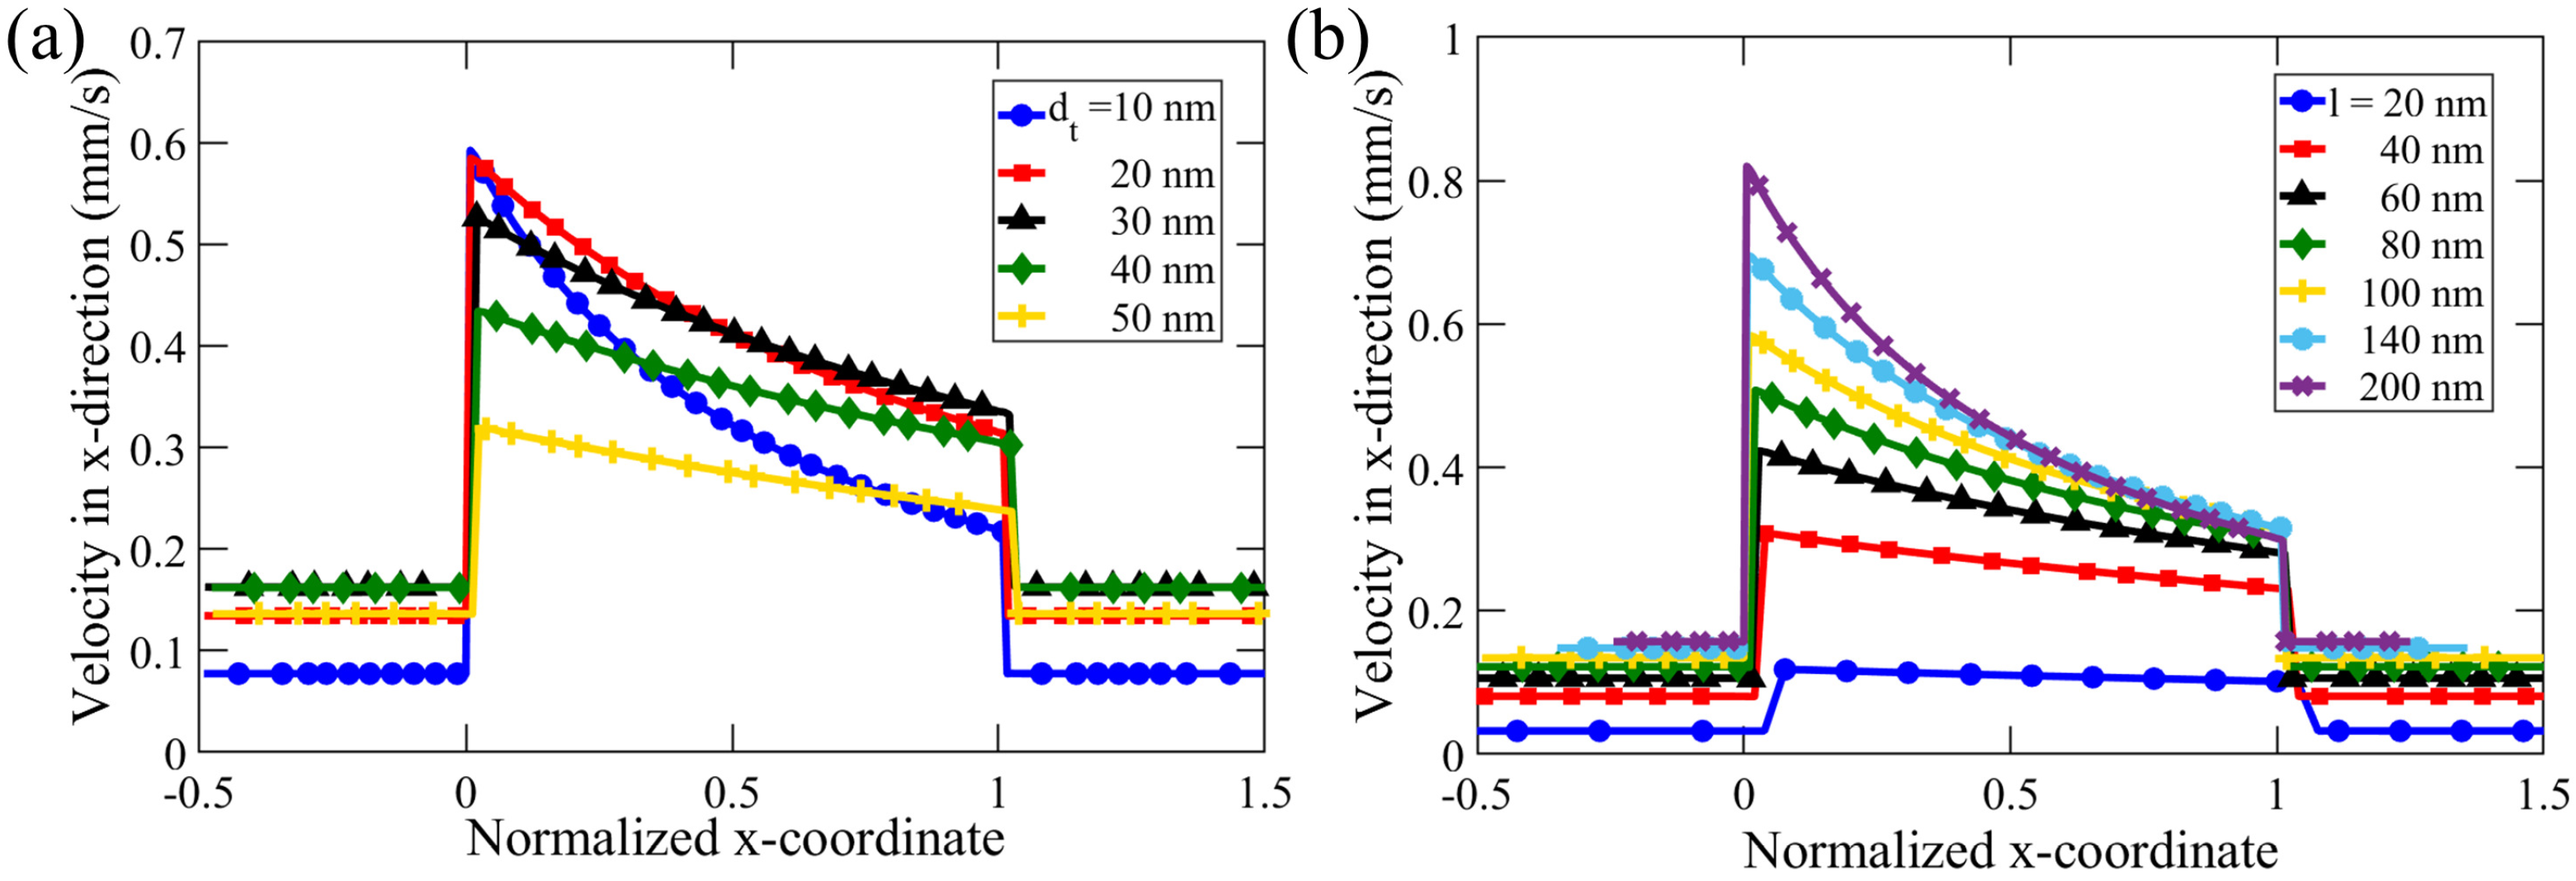
3.2. Effect of Tip Diameter and Nanochannel Length
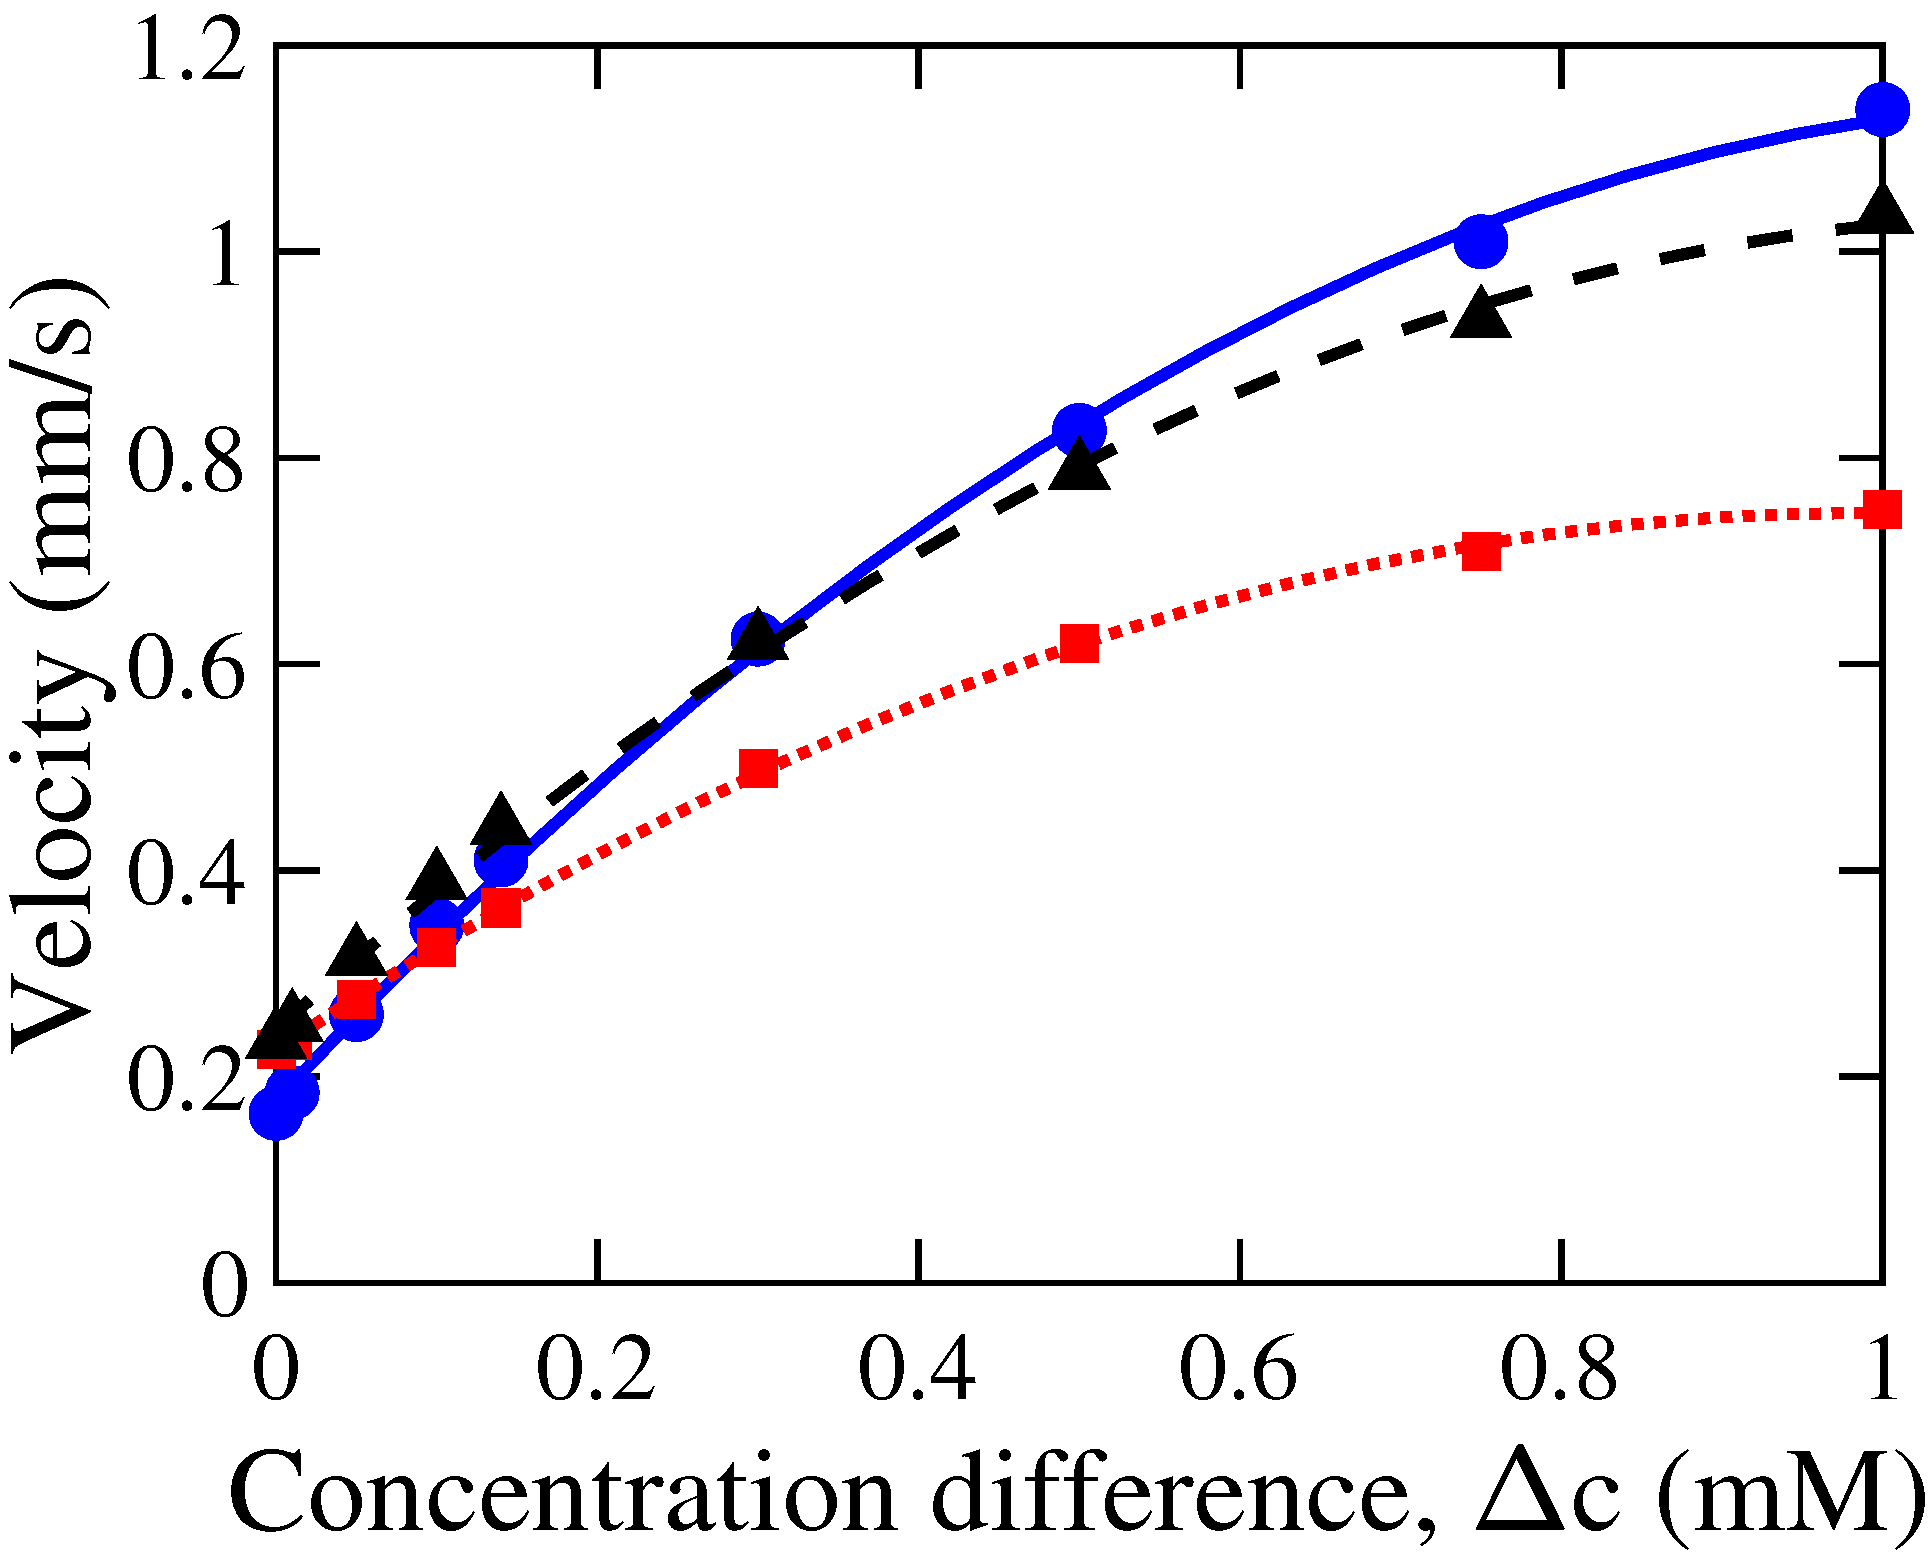
3.3. Influence of Concentration Difference
3.4. Effect of External Flow
4. Conclusions
Supplementary Materials
Author Contributions
Funding
Institutional Review Board Statement
Informed Consent Statement
Data Availability Statement
Conflicts of Interest
References
- Eijkel, J.C.T.; Berg, A.V.D. Nanofluidics: What is it and what can we expect from it? Microfluid. Nanofluidics 2005, 1, 249–267. [Google Scholar] [CrossRef]
- Daiguji, H. Ion transport in nanofluidic channels. Chem. Soc. Rev. 2010, 39, 901–911. [Google Scholar] [CrossRef] [PubMed]
- Kohonen, M.; Maeda, N.; Christenson, H. Kinetics of capillary condensation in a nanoscale pore. Phys. Rev. Lett. 1999, 82, 4667. [Google Scholar] [CrossRef]
- Schoch, R.B.; Han, J.; Renaud, P. Transport phenomena in nanofluidics. Rev. Mod. Phys. 2008, 80, 839–883. [Google Scholar] [CrossRef] [Green Version]
- Bao, G. Mechanics of biomolecules. J. Mech. Phys. Solids 2002, 50, 2237–2274. [Google Scholar] [CrossRef]
- Schlumpberger, S.; Lu, N.B.; Suss, M.; Bazant, M.Z. Scalable and Continuous Water Deionization by Shock Electrodialysis. Environ. Sci. Technol. Lett. 2015, 2, 367–372. [Google Scholar] [CrossRef]
- Park, S.; Jung, Y.; Son, S.Y.; Cho, I.; Cho, Y.; Lee, H.; Kim, H.y.; Kim, S.J. Capillarity ion concentration polarization as spontaneous desalting mechanism. Nat. Commun. 2016, 7, 1–9. [Google Scholar] [CrossRef]
- Mei, Y.; Tang, C.Y. Recent developments and future perspectives of reverse electrodialysis technology: A review. Desalination 2018, 425, 156–174. [Google Scholar] [CrossRef]
- Chanda, S.; Tsai, P.A. Numerical simulation of renewable power generation using reverse electrodialysis. Energy 2019, 176, 531–543. [Google Scholar] [CrossRef]
- Haywood, D.G.; Saha-Shah, A.; Baker, L.A.; Jacobson, S.C. Fundamental studies of nanofluidics: Nanopores, nanochannels, and nanopipets. Anal. Chem. 2015, 87, 172–187. [Google Scholar] [CrossRef] [Green Version]
- Kondylis, P.; Schlicksup, C.J.; Brunk, N.E.; Zhou, J.; Zlotnick, A.; Jacobson, S.C. Competition between normative and drug-induced virus self-assembly observed with single-particle methods. J. Am. Chem. Soc. 2018, 141, 1251–1260. [Google Scholar] [CrossRef] [PubMed]
- Morikawa, K.; Kazoe, Y.; Takagi, Y.; Tsuyama, Y.; Pihosh, Y.; Tsukahara, T.; Kitamori, T. Advanced Top-Down Fabrication for a Fused Silica Nanofluidic Device. Micromachines 2020, 11, 995. [Google Scholar] [CrossRef] [PubMed]
- Owen, S.C.; Shoichet, M.S. Design of three-dimensional biomimetic scaffolds. J. Biomed. Mater. Res. A 2010, 94A, 1321–1331. [Google Scholar] [CrossRef] [PubMed]
- Rupprecht, P.; Golé, L.; Rieu, J.P.; Vézy, C.; Ferrigno, R.; Mertani, H.C.; Riviere, C. A tapered channel microfluidic device for comprehensive cell adhesion analysis, using measurements of detachment kinetics and shear stress-dependent motion. Biomicrofluidics 2012, 6, 014107. [Google Scholar] [CrossRef] [Green Version]
- Marino, A.; Filippeschi, C.; Mattoli, V.; Mazzolai, B.; Ciofani, G. Biomimicry at the nanoscale: Current research and perspectives of two-photon polymerization. Nanoscale 2015, 7, 2841–2850. [Google Scholar] [CrossRef]
- Keh, H.J.; Wu, J.H. Electrokinetic Flow in Fine Capillaries Caused by Gradients of Electrolyte Concentration. Langmuir 2001, 17, 4216–4222. [Google Scholar] [CrossRef]
- Keh, H.J.; Ma, H.C. Diffusioosmosis of electrolyte solutions along a charged plane wall. Langmuir 2005, 21, 5461–5467. [Google Scholar] [CrossRef]
- Ma, H.B.; Wilson, C.; Borgmeyer, B.; Park, K.; Yu, Q.; Choi, S.U.S.; Tirumala, M. Effect of nanofluid on the heat transport capability in an oscillating heat pipe. Appl. Phys. Lett. 2006, 88, 143116. [Google Scholar] [CrossRef]
- Keh, H.J.; Hsu, L.Y. Diffusioosmosis of electrolyte solutions in fibrous porous media. Microfluid. Nanofluidics 2008, 5, 347–356. [Google Scholar] [CrossRef]
- Huang, D.M.; Cottin-Bizonne, C.; Ybert, C.; Bocquet, L. Massive Amplification of Surface-Induced Transport at Superhydrophobic Surfaces. Phys. Rev. Lett. 2008, 101, 064503. [Google Scholar] [CrossRef] [Green Version]
- White, H.S.; Bund, A. Ion Current Rectification at Nanopores in Glass Membranes. Langmuir 2008, 24, 2212–2218. [Google Scholar] [CrossRef] [PubMed]
- Jing, H.; Das, S. Theory of diffusioosmosis in a charged nanochannel. Phys. Chem. Chem. Phys. 2018, 20, 10204–10212. [Google Scholar] [CrossRef] [PubMed]
- Gupta, A.; Rallabandi, B.; Stone, H.A. Diffusiophoretic and diffusioosmotic velocities for mixtures of valence-asymmetric electrolytes. Phys. Rev. Fluids 2019, 4, 043702. [Google Scholar] [CrossRef]
- Keh, H.J.; Wei, Y.K. Osmosis through a fibrous medium caused by transverse electrolyte concentration gradients. Langmuir 2002, 18, 10475–10485. [Google Scholar] [CrossRef]
- Kim, K.S.; Ryoo, W.; Chun, M.S.; Chung, G.Y. Simulation of enhanced power generation by reverse electrodialysis stack module in serial configuration. Desalination 2013, 318, 79–87. [Google Scholar] [CrossRef]
- Choi, E.; Kwon, K.; Kim, D.; Park, J. Lab Chip. Lab Chip 2015, 15, 168–178. [Google Scholar] [CrossRef]
- Deng, D.; Aouad, W.; Braff, W.A.; Schlumpberger, S.; Suss, M.E.; Bazant, M.Z. Water purification by shock electrodialysis: Deionization, filtration, separation, and disinfection. Desalination 2015, 357, 77–83. [Google Scholar] [CrossRef] [Green Version]
- Chein, R.; Liu, B. Energy conversion from electrolyte concentration gradient using charged nano-pores. Int. J. Green Energy 2017, 13, 1400–1411. [Google Scholar] [CrossRef]
- Qian, S.; Das, B.; Luo, X. Diffusioosmotic flows in slit nanochannels. J. Colloid Interface Sci. 2007, 315, 721–730. [Google Scholar] [CrossRef]
- Liu, K.L.; Hsu, J.P.; Tseng, S. Capillary osmosis in a charged nanopore connecting two large reservoirs. Langmuir 2013, 29, 9598–9603. [Google Scholar] [CrossRef]
- Hoshyargar, V.; Nezameddin Ashrafizadeh, S.; Sadeghi, A. Diffusioosmotic flow in rectangular microchannels. Electrophoresis 2016, 37, 809–817. [Google Scholar] [CrossRef] [PubMed]
- Chanda, S.; Tsai, P.A. Competition between electroosmotic and chemiosmotic flow in charged nanofluidics. Phys. Fluids 2021, 33, 032008. [Google Scholar] [CrossRef]
- Chanda, S. Nanofluidic Transport Using Charge-Selective Interfaces. Ph.D. Thesis, University of Alberta, Edmonton, AB, Canada, 2020. [Google Scholar]
- Feldmann, D.; Maduar, S.R.; Santer, M.; Lomadze, N.; Vinogradova, O.I.; Santer, S. Manipulation of small particles at solid liquid interface: Light driven diffusioosmosis. Sci. Rep. 2016, 6, 36443. [Google Scholar]
- Kar, A.; Chiang, T.Y.; Ortiz Rivera, I.; Sen, A.; Velegol, D. Enhanced transport into and out of dead-end pores. ACS Nano 2015, 9, 746–753. [Google Scholar] [CrossRef] [PubMed]
- Shin, S.; Um, E.; Sabass, B.; Ault, J.T.; Rahimi, M.; Warren, P.B.; Stone, H.A. Size-dependent control of colloid transport via solute gradients in dead-end channels. Proc. Natl. Acad. Sci. USA 2016, 113, 257–261. [Google Scholar] [CrossRef] [Green Version]
- Shin, S.; Ault, J.T.; Feng, J.; Warren, P.B.; Stone, H.A. Low-Cost Zeta Potentiometry Using Solute Gradients. Adv. Mater. 2017, 29, 1701516. [Google Scholar] [CrossRef]
- Ault, J.T.; Shin, S.; Stone, H.A. Characterization of surface–solute interactions by diffusioosmosis. Soft Matter 2019, 15, 1582–1596. [Google Scholar] [CrossRef]
- Lan, W.J.; Edwards, M.A.; Luo, L.; Perera, R.T.; Wu, X.; Martin, C.R.; White, H.S. Voltage-rectified current and fluid flow in conical nanopores. Accounts Chem. Res. 2016, 49, 2605–2613. [Google Scholar] [CrossRef]
- Wang, D.; Wang, G. Dynamics of ion transport and electric double layer in single conical nanopores. J. Electroanal. Chem. 2016, 779, 39–46. [Google Scholar] [CrossRef]
- Gravelle, S.; Joly, L.; Ybert, C.; Bocquet, L. Large permeabilities of hourglass nanopores: From hydrodynamics to single file transport. J. Chem. Phys. 2014, 141, 18C526. [Google Scholar] [CrossRef] [Green Version]
- Zhang, H.; Hou, X.; Yang, Z.; Yan, D.; Li, L.; Tian, Y.; Wang, H.; Jiang, L. Bio-inspired Smart Single Asymmetric Hourglass Nanochannels for Continuous Shape and Ion Transport Control. Small 2015, 11, 786–791. [Google Scholar] [CrossRef] [PubMed]
- Guo, W.; Tian, Y.; Jiang, L. Asymmetric ion transport through ion-channel-mimetic solid-state nanopores. Accounts Chem. Res. 2013, 46, 2834–2846. [Google Scholar] [CrossRef] [PubMed]
- Zhang, H.; Tian, Y.; Jiang, L. Fundamental studies and practical applications of bio-inspired smart solid-state nanopores and nanochannels. Nano Today 2016, 11, 61–81. [Google Scholar] [CrossRef]
- Experton, J.; Wu, X.; Martin, C.R. From Ion Current to Electroosmotic Flow Rectification in Asymmetric Nanopore Membranes. Nanomaterials 2017, 7, 445. [Google Scholar] [CrossRef] [Green Version]
- Xu, T. Development of bipolar membrane-based processes. Desalination 2001, 140, 247–258. [Google Scholar] [CrossRef]
- Siwy, Z.S.; Howorka, S. Engineered voltage-responsive nanopores. Chem. Soc. Rev. 2010, 39, 1115–1132. [Google Scholar] [CrossRef]
- Wang, J.; Zhang, M.; Zhai, J.; Jiang, L. Theoretical simulation of the ion current rectification (ICR) in nano-pores based on the Poisson-Nernst-Planck (PNP) model. Phys. Chem. Chem. Phys. 2014, 16, 23–32. [Google Scholar] [CrossRef]
- Wei, C.; Bard, A.J.; Feldberg, S.W. Current Rectification at Quartz Nanopipet Electrodes. Anal. Chem. 1997, 69, 4627–4633. [Google Scholar] [CrossRef]
- Siwy, Z.; Heins, E.; Harrell, C.C.; Kohli, P.; Martin, C.R. Conical-Nanotube Ion-Current Rectifiers: The Role of Surface Charge. J. Am. Chem. Soc. 2004, 126, 10850–10851. [Google Scholar] [CrossRef]
- Siwy, Z.S. Ion-current rectification in nanopores and nanotubes with broken symmetry. Adv. Funct. Mater. 2006, 16, 735–746. [Google Scholar] [CrossRef]
- Gamble, T.; Decker, K.; Plett, T.S.; Pevarnik, M.; Pietschmann, J.F.; Vlassiouk, I.; Aksimentiev, A.; Siwy, Z.S. Rectification of Ion Current in Nanopores Depends on the Type of Monovalent Cations: Experiments and Modeling. J. Phys. Chem. C 2014, 118, 9809–9819. [Google Scholar] [CrossRef] [PubMed]
- Yan, Y.; Sheng, Q.; Wang, C.; Xue, J.; Chang, H.C. Energy Conversion Efficiency of Nano fluidic Batteries: Hydrodynamic Slip and Access Resistance. J. Phys. Chem. C 2013, 117, 8050–8061. [Google Scholar] [CrossRef]
- Rosentsvit, L.; Wang, W.; Schiffbauer, J.; Chang, H.C.; Yossifon, G. Ion current rectification in funnel-shaped nanochannels: Hysteresis and inversion effects. J. Chem. Phys. 2015, 143, 224706. [Google Scholar] [CrossRef]
- Ai, Y.; Zhang, M.; Joo, S.W.; Cheney, M.A.; Qian, S. Effects of Electroosmotic Flow on Ionic Current Rectification in Conical Nanopores. J. Phys. Chem. C 2010, 114, 3883–3890. [Google Scholar] [CrossRef]
- Qian, S.; Joo, S.W.; Ai, Y.; Cheney, M.A.; Hou, W. Effect of linear surface-charge non-uniformities on the electrokinetic ionic-current rectification in conical nanopores. J. Colloid Interface Sci. 2009, 329, 376–383. [Google Scholar] [CrossRef] [PubMed]
- Hsu, J.P.; Su, T.C.; Peng, P.H.; Hsu, S.C.; Zheng, M.J.; Yeh, L.H. Unraveling the anomalous surface-charge-dependent osmotic power using a single funnel-shaped nanochannel. ACS Nano 2019, 13, 13374–13381. [Google Scholar] [CrossRef] [PubMed]
- Alizadeh, A.; Hsu, W.L.; Daiguji, H.; Wang, M. Temperature-regulated surface charge manipulates ionic current rectification in tapered nanofluidic channel. Int. J. Mech. Sci. 2021, 210, 106754. [Google Scholar] [CrossRef]
- Pietschmann, J.F.; Wolfram, M.T.; Burger, M.; Trautmann, C.; Nguyen, G.; Pevarnik, M.; Bayer, V.; Siwy, Z. Rectification properties of conically shaped nanopores: Consequences of miniaturization. Phys. Chem. Chem. Phys. 2013, 15, 16917–16926. [Google Scholar] [CrossRef] [Green Version]
- Hsu, J.P.; Chu, Y.Y.; Lin, C.Y.; Tseng, S. Ion transport in a pH-regulated conical nanopore filled with a power-law fluid. J. Colloid Interface Sci. 2019, 537, 358–365. [Google Scholar] [CrossRef]
- Hsu, J.P.; Yang, S.T.; Lin, C.Y.; Tseng, S. Voltage-controlled ion transport and selectivity in a conical nanopore functionalized with pH-tunable polyelectrolyte brushes. J. Colloid Interface Sci. 2019, 537, 496–504. [Google Scholar] [CrossRef]
- Wu, Y.Y.; Chen, L.D.; Cai, X.H.; Zhao, Y.; Chen, M.; Pan, X.H.; Li, Y.Q. Smart pH-Modulated Two-Way Photoswitch Based on a Polymer-Modified Single Nanochannel. ACS Appl. Mater. Interfaces 2021, 13, 25241–25249. [Google Scholar] [CrossRef] [PubMed]
- Pandey, D.; Bhattacharyya, S. Influence of finite ion size and dielectric decrement on the ion current rectification in a single conical nanopore. Phys. Fluids 2021, 33, 062006. [Google Scholar] [CrossRef]
- Hsu, J.P.; Lin, T.W.; Lin, C.Y.; Tseng, S. Salt-Dependent Ion Current Rectification in Conical Nanopores: Impact of Salt Concentration and Cone Angle. J. Phys. Chem. C 2017, 121, 28139–28147. [Google Scholar] [CrossRef]
- Hsu, J.P.; Yang, S.T.; Lin, C.Y.; Tseng, S. Ionic Current Rectification in a Conical Nanopore: Influences of Electroosmotic Flow and Type of Salt. J. Phys. Chem. C 2017, 121, 4576–4582. [Google Scholar] [CrossRef]
- Moran, J.; Posner, J. Microswimmers with no moving parts. Phys. Today 2019, 72, 44–50. [Google Scholar] [CrossRef] [Green Version]
- Kim, D.K. Numerical study of power generation by reverse electrodialysis in ion-selective nanochannels. J. Mech. Sci. Technol. 2011, 25, 5–10. [Google Scholar] [CrossRef]
- Kang, B.D.; Kim, H.J.; Lee, M.G.; Kim, D.K. Numerical study on energy harvesting from concentration gradient by reverse electrodialysis in anodic alumina nanopores. Energy 2015, 86, 525–538. [Google Scholar] [CrossRef]
- Hunter, R.J. Foundations of Colloid Science, 2nd ed.; Oxford University Press: Oxford, UK, 2001. [Google Scholar]
- Probstein, R.F. Physicochemical Hydrodynamics: An Introduction; Butterworths Publishers: London, UK, 1989. [Google Scholar]
- Griffiths, D.J. Introduction to Electrodynamics, 4th ed.; Pearson: Boston, MA, USA, 2013. [Google Scholar]
- Cengel, Y.A.; Cimbala, J.M. Fluid Mechanics Fundamental and Applications, 4th ed.; McGraw-Hill Education: New York, NY, USA, 2017. [Google Scholar]
- Balannec, B.; Ghoufi, A.; Szymczyk, A. Nanofiltration performance of conical and hourglass nanopores. J. Membr. Sci. 2018, 552, 336–340. [Google Scholar] [CrossRef]
- Akram, J.; Akbar, N.S.; Maraj, E.N. A comparative study on the role of nanoparticle dispersion in electroosmosis regulated peristaltic flow of water. Alex. Eng. J. 2020, 59, 943–956. [Google Scholar] [CrossRef]
- Prieve, D.C. Migration of a colloidal particle in a gradient of electrolyte concentration. Adv. Colloid Interface Sci. 1982, 16, 321–335. [Google Scholar] [CrossRef]


Publisher’s Note: MDPI stays neutral with regard to jurisdictional claims in published maps and institutional affiliations. |
© 2022 by the authors. Licensee MDPI, Basel, Switzerland. This article is an open access article distributed under the terms and conditions of the Creative Commons Attribution (CC BY) license (https://creativecommons.org/licenses/by/4.0/).
Share and Cite
Chanda, S.; Tsai, P.A. Numerical Investigation of Diffusioosmotic Flow in a Tapered Nanochannel. Membranes 2022, 12, 481. https://doi.org/10.3390/membranes12050481
Chanda S, Tsai PA. Numerical Investigation of Diffusioosmotic Flow in a Tapered Nanochannel. Membranes. 2022; 12(5):481. https://doi.org/10.3390/membranes12050481
Chicago/Turabian StyleChanda, Sourayon, and Peichun Amy Tsai. 2022. "Numerical Investigation of Diffusioosmotic Flow in a Tapered Nanochannel" Membranes 12, no. 5: 481. https://doi.org/10.3390/membranes12050481
APA StyleChanda, S., & Tsai, P. A. (2022). Numerical Investigation of Diffusioosmotic Flow in a Tapered Nanochannel. Membranes, 12(5), 481. https://doi.org/10.3390/membranes12050481