
Impedance Spectroscopy Measurements of Ionomer Film Oxygen Transport Resistivity in Operating Low-Pt PEM Fuel Cell


Abstract
:1. Introduction
2. Materials and Methods
2.1. Electrochemical Evaluation
2.2. Impedance Model
2.3. Model Equations
3. Results and Discussion
4. Conclusions
Author Contributions
Funding
Institutional Review Board Statement
Informed Consent Statement
Data Availability Statement
Acknowledgments
Conflicts of Interest
Nomenclature
| b | ORR Tafel slope, V |
| Cdl | Double layer volumetric capacitance, F cm−3 |
| c | Oxygen molar concentration in the pore, mol cm−3 |
| cb | Oxygen molar concentration in the GDL, mol cm−3 |
| ch | Oxygen molar concentration in the channel, mol cm−3 |
| cN | Oxygen molar concentration in the ionomer (Nafion) film, mol cm−3 |
| cin | Reference (inlet) oxygen concentration, mol cm−3 |
| Db | Oxygen diffusion coefficient in the GDL, cm2 s−1 |
| Dp | Oxygen diffusion coefficient in the pore, cm2 s−1 |
| DN | Oxygen diffusion coefficient in the Nafion film, cm2 s−1 |
| F | Faraday constant, C mol−1 |
| h | Channel depth, cm |
| ORR volumetric exchange current density, A cm−3 | |
| j | Local proton current density along the pore, A cm−2 |
| j0 | Cell current density, A cm−2 |
| KH | Henry’s constant for oxygen solubility in the film, mol/mol |
| lt | Pore length (CCL thickness), cm |
| lN | Ionomer film thickness, cm |
| lb | GDL thickness, cm |
| NN | Oxygen flux in the ionomer film, mol cm−2s−1 |
| Rm | Radius of a Pt/C tube, cm |
| Rp | Pore radius, cm |
| Rp,k | Radius of k-th pore in the spectrum, cm |
| Ionomer film O2 transport resistivity, s cm−1 | |
| r | Radial coordinate, cm |
| v | Flow velocity in the cathode channel, cm s−1 |
| Volume fraction of pores with the k-th radius | |
| x | Coordinate along the pore, cm |
| z | Coordinate along the channel, cm |
| Zccl, n | CCL impedance in the n-th segment, Ohm cm2 |
| Zk, n | Pore impedance with k-th radius, Ohm cm2 |
| Zseg | Segment impedance, Ohm cm2 |
| Subscripts: | |
| 0 | Membrane/CCL interface |
| 1 | CCL/GDL interface |
| t | Catalyst layer |
| Superscripts: | |
| 0 | Steady-state value |
| 1 | Small-amplitude perturbation |
| Greek: | |
| η | ORR overpotential, positive by convention, V |
| σp | Ionomer film proton conductivity, S cm−1 |
| ω | Angular frequency of the AC signal, s−1 |
| Abbreviations: | |
| PEMFC | Proton exchange membrane fuel cell |
| CCL | Cathode catalyst layer |
| ORR | Oxygen reduction reaction |
| EIS | Electrochemical impedance spectroscopy |
| PSD | Pore size distribution |
| CCM | Catalyst coated membrane |
| GDL | Gas diffusion layer |
| MEA | Membrane electrode assembly |
| LF | Low frequency |
References
- Schoenbein, C.F. On the voltaic polarization of certain solid and fluid substances. Phil. Mag. 1839, 14, 43–45. [Google Scholar] [CrossRef]
- Ono, Y.; Mashio, T.; Takaichi, S.; Ohma, A.; Kanesaka, H.; Shinohara, K. The analysis of performance loss with low platinum loaded cathode catalyst layers. ECS Trans. 2010, 28, 69–78. [Google Scholar] [CrossRef]
- Greszler, T.A.; Caulk, D.; Sinha, P. The impact of platinum loading on oxygen transport resistance. J. Electrochem. Soc. 2012, 159, F831–F840. [Google Scholar] [CrossRef]
- Owejan, J.P.; Owejan, J.E.; Gu, W. Impact of platinum loading and catalyst layer structure on PEMFC performance. J. Electrochem. Soc. 2013, 160, F824–F833. [Google Scholar] [CrossRef]
- Weber, A.Z.; Kusoglu, A. Unexplained transport resistances for low-loaded fuel cell catalyst layers. J. Mater. Chem. A 2014, 2, 17207–17211. [Google Scholar] [CrossRef]
- Kongkanand, A.; Mathias, M.F. The priority and challenge of high-power performance of low platinum proton-exchange membrane fuel cells. Phys. Chem. Lett. 2016, 7, 1127–1137. [Google Scholar] [CrossRef]
- Kudo, K.; Jinnouchi, R.; Morimoto, Y. Humidity and temperature dependences of oxygen transport resistance of nafion thin film on platinum electrode. Electrochim. Acta 2016, 209, 682–690. [Google Scholar] [CrossRef]
- Freiberg, A.T.S.; Tucker, M.C.; Weber, A.Z. Polarization loss correction derived from hydrogen local-resistance measurement in low Pt-loaded polymer-electrolyte fuel cells. Electrochem. Comm. 2017, 79, 14–17. [Google Scholar] [CrossRef] [Green Version]
- Nonoyama, N.; Okazaki, S.; Weber, A.Z.; Ikogi, Y.; Yoshida, T. Analysis of oxygen-transport diffusion resistance in proton exchange membrane fuel cells. J. Electrochem. Soc. 2011, 158, B416–B423. [Google Scholar] [CrossRef]
- Choo, M.-J.; Oh, K.-H.; Park, J.-K.; Kim, H.-T. Analysis of oxygen transport in cathode catalyst layer of low-Pt-loaded fuel cells. ChemElectroChem 2015, 2, 382–388. [Google Scholar] [CrossRef]
- Muzaffar, T.; Kadyk, T.; Eikerling, M. Tipping water balance and the Pt loading effect in polymer electrolyte fuel cells: A model-based analysis. Sustain. Energy Fuels 2018, 2, 1189–1196. [Google Scholar] [CrossRef] [Green Version]
- Beuscher, U. Experimental method to determine the mass transport resistance of a polymer electrolyte fuel cell. J. Electrochem. Soc. 2006, 153, A1788–A1793. [Google Scholar] [CrossRef]
- Mashio, T.; Ohma, A.; Yamamoto, S.; Shinohara, K. Analysis of reactant gas transport in a catalyst layer. ECS Trans. 2007, 11, 529–540. [Google Scholar] [CrossRef]
- Baker, D.R.; Caulk, D.; Neyerlin, K.C.; Murphy, M.W. Measurement of oxygen transport resistance in PEM fuel cells by limiting current methods. J. Electrochem. Soc. 2009, 156, B991–B1003. [Google Scholar] [CrossRef]
- Reshetenko, T.; St-Pierre, J. Separation method for oxygen mass transport coefficient in gas and ionomer phases in PEMFC GDE. J. Electrochem. Soc. 2014, 161, F1089–F1100. [Google Scholar] [CrossRef]
- Tabe, Y.; Sakai, T.; Iiri, T.; Hayashi, T.; Chikahisa, T. Experimental evaluation of dominant transport resistances of oxygen in catalyst layers of PEFC. ECS Trans. 2017, 80, 205–214. [Google Scholar] [CrossRef]
- Kusoglu, A.; Weber, A.Z. New insights into perfluorinated sulfonic-acid ionomers. Chem. Rev. 2017, 117, 987–1104. [Google Scholar] [CrossRef]
- Page, K.A.; Kusoglu, A.; Stafford, C.M.; Kim, S.R.J.; Kline, R.J.; Weber, A.Z. Confinement-driven increase in ionomer thin-film modulus. Nano Lett. 2014, 14, 2299–2304. [Google Scholar] [CrossRef]
- Jinnouchi, R.; Kudo, K.; Kitano, N.; Morimoto, Y. Molecular dynamics simulations on O2 permeation through Nafion ionomer on Platinum surface. Electrochim. Acta 2016, 188, 767–776. [Google Scholar] [CrossRef]
- Iiri, T.; Tabe, Y.; Ckikahisa, T. Experimental analysis of oxygen transport resistance for different types of ionomer in PEFC catalyst. ECS Trans. 2018, 86, 141–150. [Google Scholar] [CrossRef]
- Jomori, S.; Komatsubara, K.; Nonoyama, N.; Kato, M.; Yoshida, T. An experimental study of the effects of ioperational history on activity changes in a PEMFC. J. Electrochem. Soc. 2013, 160, F1067–F1073. [Google Scholar] [CrossRef]
- Liu, H.; Epting, W.K.; Lister, S. Gas transport resistance in polymer electrolyte thin films on oxygen reduction reaction catalysts. Langmuir 2015, 31, 9853–9858. [Google Scholar] [CrossRef]
- Reshetenko, T.; Ben, B.L. Impact of a gas diffusion layer’s structural and textural properties on oxygen mass transport resistance in the cathode and performance of proton exchange membrane fuel cells. Electrochim. Acta 2021, 371, 137752. [Google Scholar] [CrossRef]
- Reshetenko, T.; Ben, B.L. Exploration of operating conditions on oxygen mass transport resistance and performance of PEM fuel cells: Effects of inlet gas humidification. Electrochem. Sci. Adv. 2021, e2100134. [Google Scholar] [CrossRef]
- Kulikovsky, A.; Reshetenko, T. Nafion film transport properties in a low-Pt PEM fuel cell: Impedance spectroscopy study. RSC Adv. 2019, 9, 38797–38806, Erratum in RSC Adv. 2021, 11, 6764–6765. [Google Scholar] [CrossRef] [Green Version]
- Reshetenko, T.V.; Bender, G.; Bethune, K.; Rocheleau, R. Systematic study of back pressure and anode stoichiometry effects on spatial PEMFC performance distribution. Electrochim. Acta 2011, 56, 8700–8710. [Google Scholar] [CrossRef]
- Reshetenko, T.V.; Bender, G.; Bethune, K.; Rocheleau, R. A segmented cell approach for studying the effects of serpentine ow field parameters on PEMFC current distribution. Electrochim. Acta 2012, 88, 571–579. [Google Scholar] [CrossRef]
- Liu, J.; Eikerling, M. Model of cathode catalyst layers for polymer electrolyte fuel cells: The role of porous structure and water accumulation. Electrochim. Acta 2008, 53, 4435–4446. [Google Scholar] [CrossRef]
- Yu, Z.; Carter, R.N.; Zhang, J. Measurements of pore size distribution, porosity, effective oxygen diffusivity, and tortuosity of PEM fuel cell electrodes. Fuel Cells 2012, 12, 557–565. [Google Scholar] [CrossRef]
- Zhou, J.; Putz, A.; Secanell, M. A mixed wettability pore size distribution based mathematical model for analyzing two-phase flow in porous electrodes. J. Electrochem. Soc. 2017, 164, F530–F539. [Google Scholar] [CrossRef] [Green Version]
- Yu, H.; Bonville, L.; Maric, R. Analysis of H2/Air polarization curves: The influence of low Pt loading and fabrication process. J. Electrochem Soc. 2018, 165, F272–F284. [Google Scholar] [CrossRef]
- Scipy Optimize Least Squares. 2018. Available online: https://docs.scipy.org/doc/scipy/reference/generated/scipy.optimize.least_squares.html (accessed on 1 January 2020).
- Schneider, I.A.; Freunberger, S.A.; Kramer, D.; Wokaun, A.; Scherer, G.G. Oscillations in gas channels. Part, I. The forgotten player in impedance spectroscopy in PEFCs. J. Electrochem. Soc. 2007, 154, B383–B388. [Google Scholar] [CrossRef]
- Springer, T.E.; Zawodzinski, T.A.; Wilson, M.S.; Gottesfeld, S. Characterization of polymer electrolyte fuel cells using AC impedance spectroscopy. J. Electrochem. Soc. 1996, 143, 587–599. [Google Scholar] [CrossRef]
- Kulikovsky, A. Impedance and resistivity of low-Pt cathode in a PEM fuel cell. J. Electrochem. Soc. 2021, 168, 044512. [Google Scholar] [CrossRef]
- Lopez-Haro, M.; Guétaz, L.; Printemps, T.; Morin, A.; Escribano, S.; Jouneau, P.-H.; Bayle-Guillemaud, P.; Chandezon, F.; Gebel, G. Three-dimensional analysis of Nafion layers in fuel cell electrodes. Nat. Comm. 2013, 5, 5229. [Google Scholar] [CrossRef]
- Cetinbas, F.C.; Wang, X.; Ahluwalia, R.K.; Kariuki, N.N.; Winarski, R.; Yang, Z.; Sharman, J.; Myers, D.J. Analysis and transport resistances of low-Platinum-loaded PEFC electrodes. J. Electrochem. Soc. 2017, 164, F1595–F1607. [Google Scholar] [CrossRef]
- Suzuki, T.; Okada, S.; Tsushima, S. Analysis of ionomer distribution and Pt/C agglomerate size in catalyst layers by two-stage ion-beam processing. J. Electrochem. Soc. 2020, 167, 124513. [Google Scholar] [CrossRef]
- Sethuraman, V.A.; Khan, S.; Jur, J.S.; Haug, A.T.; Weidner, J. Measuring oxygen, carbon monoxide and hydrogen sulfide diffusion coefficient and solubility in Nafion membranes. Electrochim. Acta 2009, 54, 6850–6860. [Google Scholar] [CrossRef] [Green Version]
- Novitski, D.; Holdcroft, S. Determination of O2 mass transport at the Pt/PFSA ionomer interface under reduced relative humidity. ACS Appl. Mater. Interfaces 2015, 7, 27314–27323. [Google Scholar] [CrossRef]
- Sambandam, S.; Parrondo, J.; Ramani, V. Estimation of electrode ionomer oxygen permeability and ionomer-phase oxygen transport resistance in polymer electrolyte fuel cells. Phys. Chem. Chem. Phys. 2013, 15, 14994–15002. [Google Scholar] [CrossRef]
- Takamura, Y.; Nakashima, E.; Yamada, H.; Tasaka, A.; Inaba, M. Effects of temperature and relative humidity on oxygen permeation in Nafion® and sulfonated poly(arylene ether sulfone). ECS Trans. 2008, 16, 881–889. [Google Scholar] [CrossRef]
- Ogumi, Z.; Takehara, Z.; Yoshizawa, S. Gas permeation in SPE method: I. Oxygen permeation through Nafion and Neosepta. J. Electrochem. Soc. 1984, 131, 769–773. [Google Scholar] [CrossRef]
- Ogumi, Z.; Kuroe, T.; Takehara, Z. Gas permeation in SPE method: II. Oxygen and hydrogen permeation through Nafion. J. Electrochem. Soc. 1985, 132, 2601–2605. [Google Scholar] [CrossRef]
- Sakai, T.; Takenaka, H.; Wakabayashi, N.; Kawami, Y.; Torikai, E. Gas permeation properties of solid polymer electrolyte (SPE) membranes. J. Electrochem. Soc. 1985, 132, 1328–1332. [Google Scholar] [CrossRef]
- Sakai, T.; Takenaka, H.; Torikai, E. Gas diffusion in the dried and hydrated Nafions. J. Electochem. Soc. 1986, 133, 88–92. [Google Scholar] [CrossRef]
- Broka, K.; Ekdunge, P. Oxygen and hydrogen permeation properties and water uptake of Nafion® 117 membrane and recast film for PEM fuel cell. J. Appl. Electrochem. 1997, 27, 117–123. [Google Scholar] [CrossRef]
- Oh, H.; Lee, Y.-I.; Lee, G.; Min, K.; Yi, J.-S. Experimental dissection of oxygen transport resistance in the components of a polymer electrolyte membrane fuel cell. J. Power Sources 2017, 345, 67–77. [Google Scholar] [CrossRef]
- Shen, S.; Cheng, X.; Wang, C.; Yan, X.; Ke, C.; Yin, J.; Zhang, J. Exploaration of significant influence of the operating conditions on the local O2 transport in proton exchange membrane fuel cells (PEMFCs). Phys. Chem. Chem. Phys. 2017, 19, 26221–26229. [Google Scholar] [CrossRef]
- Du, F.; Dao, T.A.; Peitl, P.V.J.; Bauer, A.; Preuss, K.; Bonastre, A.M.; Sharman, J.; Spikes, G.; Perchthaler, M.; Schmidt, T.J.; et al. effects of PEMFC operational history under dry/wet conditions on additional voltage losses due to ionomer migration. J. Electrochem. Soc. 2020, 167, 144513. [Google Scholar] [CrossRef]
- Caulk, D.A.; Baker, D.R. Heat and water transport in hydrophobic diffusion media of PEM fuel cells. J. Electrochem. Soc. 2010, 157, B1237–B1244. [Google Scholar] [CrossRef]
- Caulk, D.A.; Baker, D.R. Modeling two-phase water transport in hydrophobic diffusion media for PEM fuel cells. J. Electrochem. Soc. 2011, 158, B384–B393. [Google Scholar] [CrossRef]
- Owejan, J.P.; Trabold, T.A.; Mench, M.M. Oxygen transport resistance correlated to liquid water saturation in the gas diffusion layer of PEM fuel cells. Int. J. Heat Mass Transfer 2014, 71, 585–592. [Google Scholar] [CrossRef]
- Muirhead, D.; Banerjee, R.; George, M.G.; Ge, N.; Shrestha, P.; Liu, H.; Lee, J.; Bazylak, A. Liquid water saturation and oxygen transport resistance in polymer electrolyte membrane fuel cell gas diffusion layers. Electrochim. Acta 2018, 274, 250–263. [Google Scholar] [CrossRef] [Green Version]
- Muirhead, D.; Banerjee, R.; Lee, J.; George, M.G.; Ge, N.; Liu, H.; Chevalier, S.; Hinebaugh, J.; Han, K.; Bazylak, A. Simultaneous characterization of oxygen transport resistance and spatially resolved liquid water saturation at high-current density of polymer membrane fuel cells with varied cathode humidity. Int. J. Hydrogen Energy 2017, 42, 29472–29483. [Google Scholar] [CrossRef]
- Owejan, J.P.; Owejan, J.E.; Gu, W.; Trabold, T.A.; Tighe, T.W.; Mathias, M.F. Water transport mechanisms in PEMFC gas diffusion layer. J. Electrochem. Soc. 2010, 157, B1456–B1464. [Google Scholar] [CrossRef]


| Parameter | Value |
|---|---|
| Catalyst loading A/C, mgPt cm−2 | 0.1/0.1 |
| CCL thickness lt, cm | 3.0 × 10⁻⁴ |
| GDL thickness lb, cm | 230 × 10−4 |
| Ionomer film thickness lN, cm | 10.0 × 10⁻⁷ |
| Flow stoichiometry A/C | 2/4 |
| Relative humidity A/C | 100%/50% |
| Back pressure, kPa | 150 |
| Cell temperature, K | 353 |
| Parameter | 1 | 2 | 3 | 4 | 5 | 6 | 7 | 8 | 9 |
|---|---|---|---|---|---|---|---|---|---|
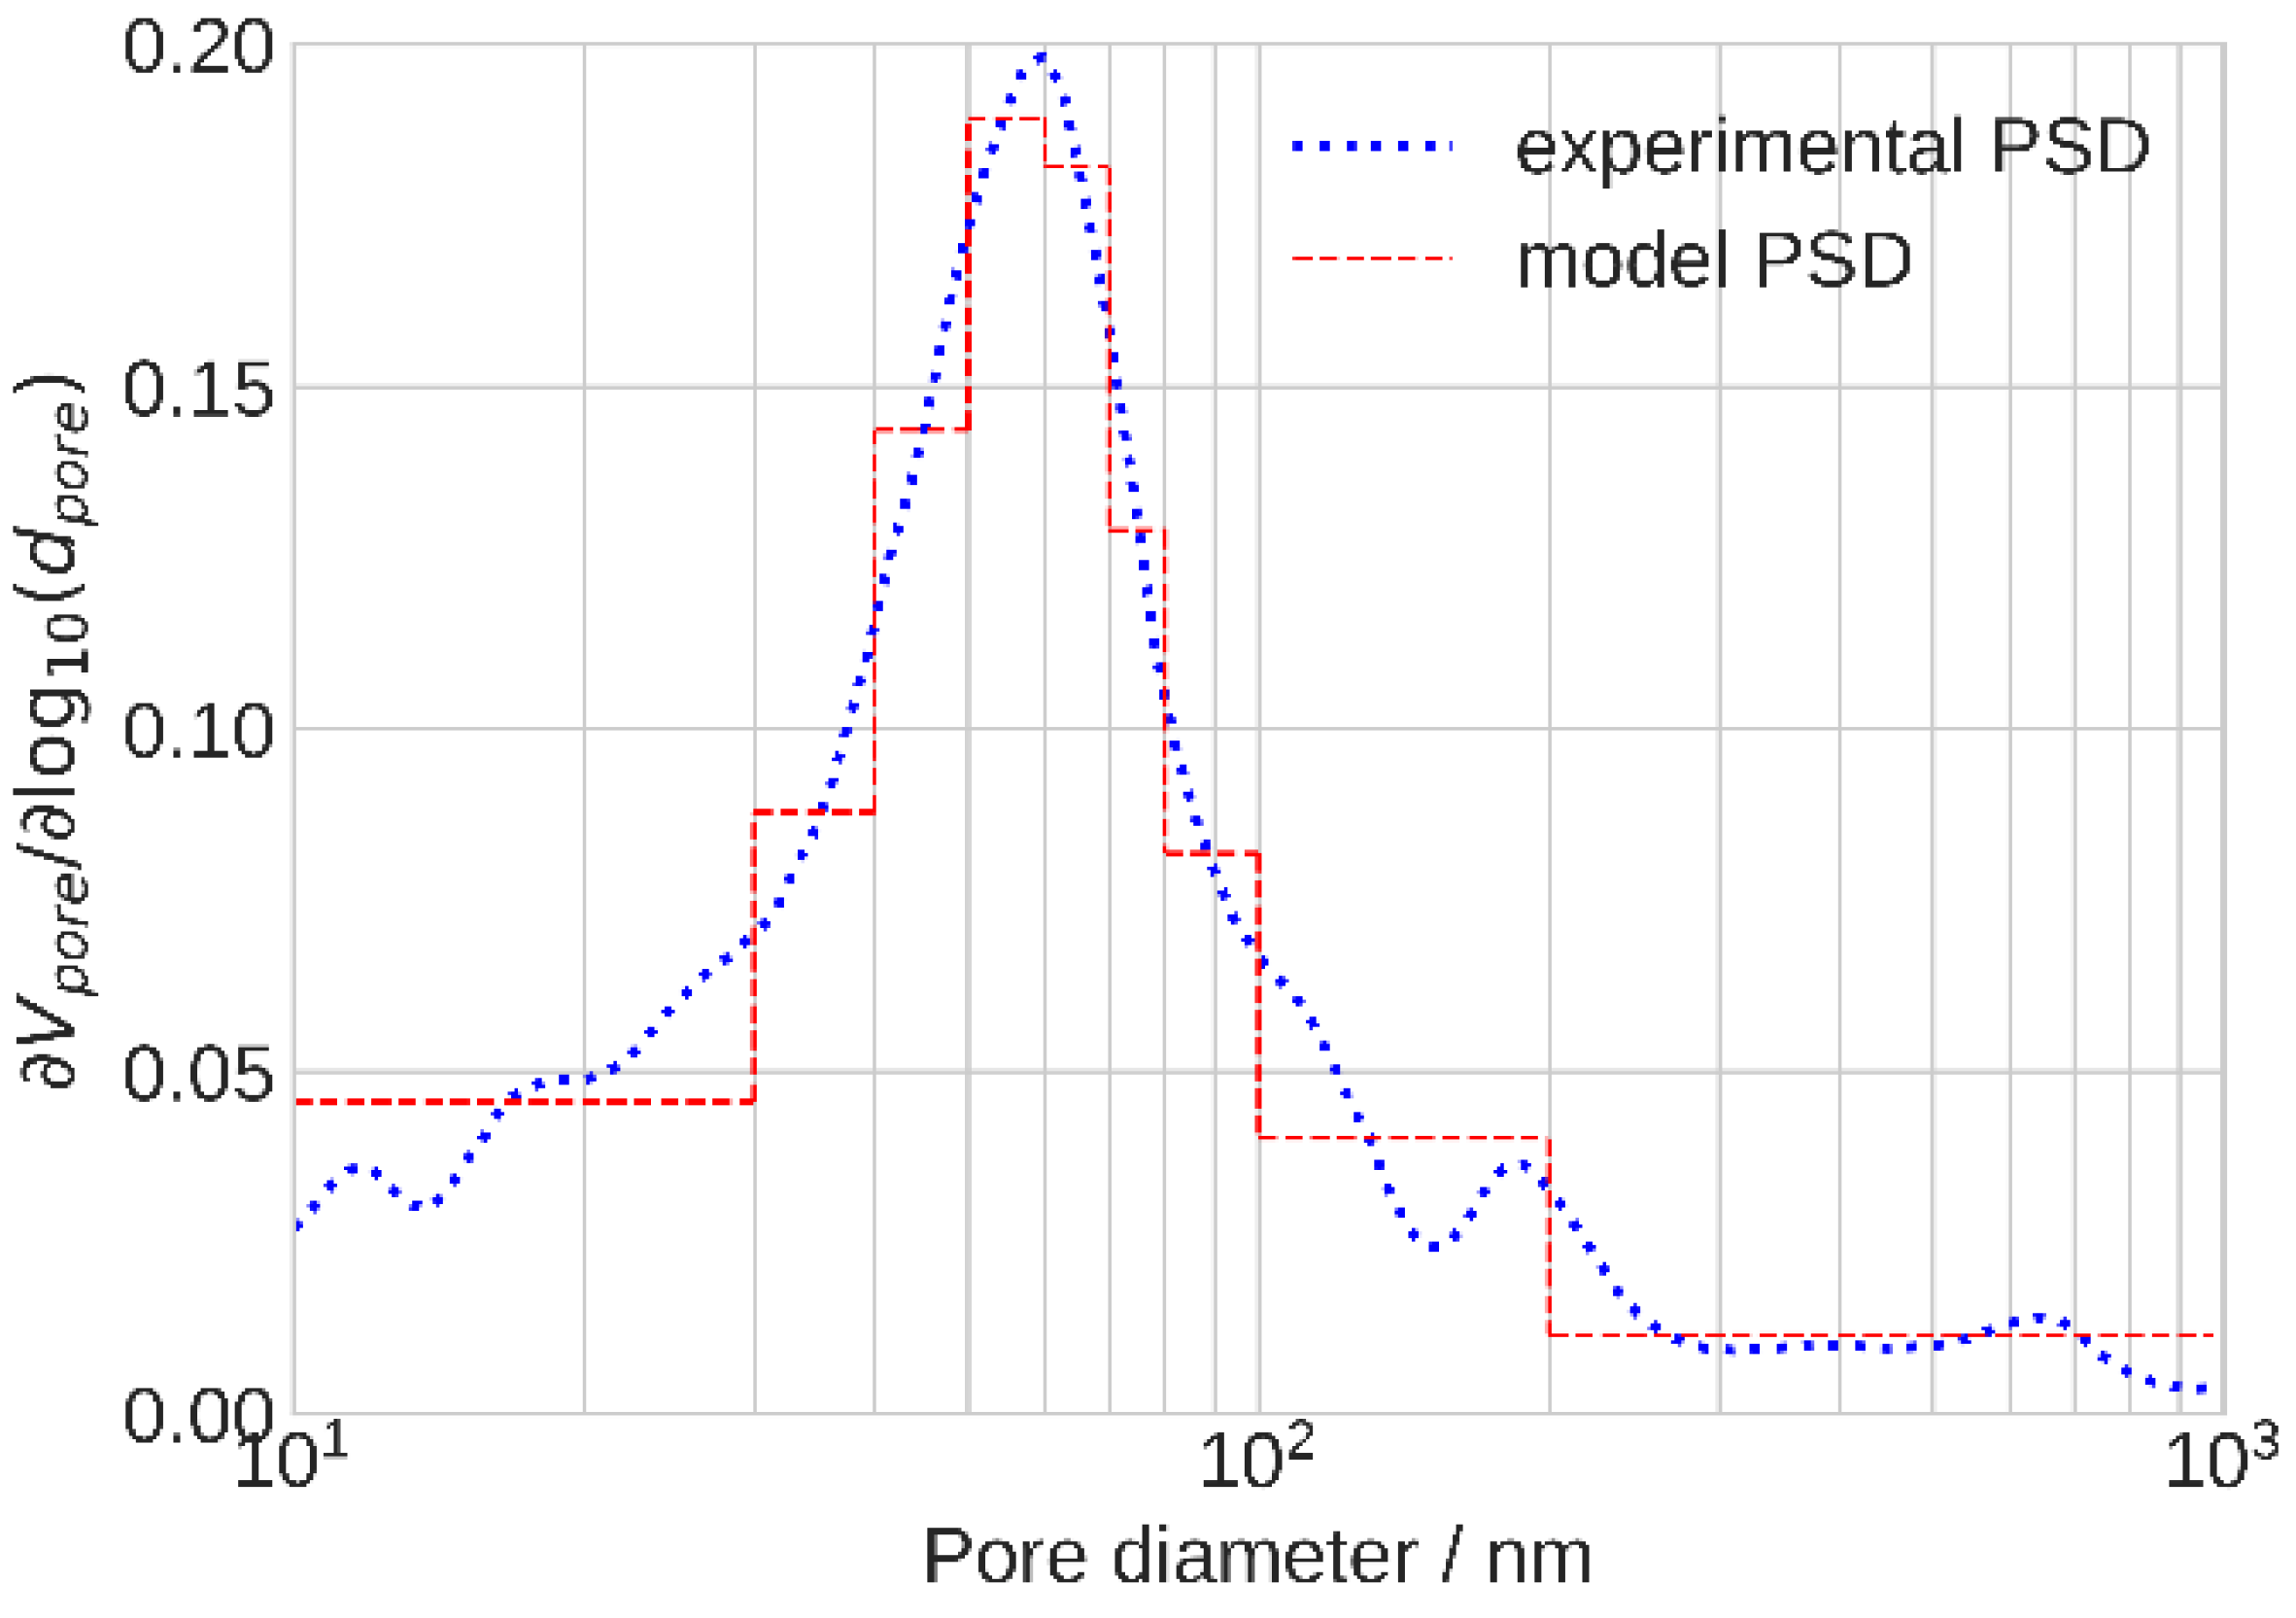
| Pore radius, nm | 16.5 | 35.4 | 45.0 | 54.3 | 65.1 | 75.1 | 88.8 | 130 | 152 |
| Pore volume fraction | 0.199 | 0.100 | 0.127 | 0.137 | 0.112 | 0.0685 | 0.0725 | 0.111 | 0.0727 |
Publisher’s Note: MDPI stays neutral with regard to jurisdictional claims in published maps and institutional affiliations. |
© 2021 by the authors. Licensee MDPI, Basel, Switzerland. This article is an open access article distributed under the terms and conditions of the Creative Commons Attribution (CC BY) license (https://creativecommons.org/licenses/by/4.0/).
Share and Cite
Reshetenko, T.V.; Kulikovsky, A. Impedance Spectroscopy Measurements of Ionomer Film Oxygen Transport Resistivity in Operating Low-Pt PEM Fuel Cell. Membranes 2021, 11, 985. https://doi.org/10.3390/membranes11120985
Reshetenko TV, Kulikovsky A. Impedance Spectroscopy Measurements of Ionomer Film Oxygen Transport Resistivity in Operating Low-Pt PEM Fuel Cell. Membranes. 2021; 11(12):985. https://doi.org/10.3390/membranes11120985
Chicago/Turabian StyleReshetenko, Tatyana V., and Andrei Kulikovsky. 2021. "Impedance Spectroscopy Measurements of Ionomer Film Oxygen Transport Resistivity in Operating Low-Pt PEM Fuel Cell" Membranes 11, no. 12: 985. https://doi.org/10.3390/membranes11120985
APA StyleReshetenko, T. V., & Kulikovsky, A. (2021). Impedance Spectroscopy Measurements of Ionomer Film Oxygen Transport Resistivity in Operating Low-Pt PEM Fuel Cell. Membranes, 11(12), 985. https://doi.org/10.3390/membranes11120985