Article

Cytotoxic, Antimicrobial, Antioxidant Properties and Effects on Cell Migration of Phenolic Compounds of Selected Transylvanian Medicinal Plants

1
Department of Laboratory Medicine, University of Pécs, Medical School, Ifjúság u. 13, 7624 Pécs, Hungary
2
János Szentágothai Research Center, University of Pécs, Ifjúság u. 20, 7624 Pécs, Hungary
3
Department of Pharmacognosy, Semmelweis University, Üllői út 26, 1085 Budapest, Hungary
4
Department of Pharmacognosy, University of Pécs, Faculty of Pharmacy, Rókus u. 2, 7624 Pécs, Hungary
*
Author to whom correspondence should be addressed.
Antioxidants 2020, 9(2), 166; https://doi.org/10.3390/antiox9020166
Submission received: 24 January 2020 / Revised: 13 February 2020 / Accepted: 15 February 2020 / Published: 18 February 2020
(This article belongs to the Special Issue Phenolic Profiling and Antioxidant Capacity in Plants)

Abstract

:
Medicinal plants are widely used in folk medicine but quite often their composition and biological effects are hardly known. Our study aimed to analyze the composition, cytotoxicity, antimicrobial, antioxidant activity and cellular migration effects of Anthyllis vulneraria, Fuchsia magellanica, Fuchsia triphylla and Lysimachia nummularia used in the Romanian ethnomedicine for wounds. Liquid chromatography with mass spectrometry (LC-MS/MS) was used to analyze 50% (v/v) ethanolic and aqueous extracts of the plants’ leaves. Antimicrobial activities were estimated with a standard microdilution method. The antioxidant properties were evaluated by validated chemical cell-free and biological cell-based assays. Cytotoxic effects were performed on mouse fibroblasts and human keratinocytes with a plate reader-based method assessing intracellular adenosine triphosphate (ATP), nucleic acid and protein contents and also by a flow cytometer-based assay detecting apoptotic–necrotic cell populations. Cell migration to cover cell-free areas was visualized by time-lapse phase-contrast microscopy using standard culture inserts. Fuchsia species showed the strongest cytotoxicity and the highest antioxidant and antimicrobial activity. However, their ethanolic extracts facilitated cell migration, most probably due to their various phenolic acid, flavonoid and anthocyanin derivatives. Our data might serve as a basis for further animal experiments to explore the complex action of Fuchsia species in wound healing assays.

1. Introduction

Nowadays, the investigation of natural extracts from medicinal plants has been increased due to their rich content of bioactive compounds such as polyphenols, vitamins and proteins, which are found in different parts of plants [1]. Phenolic compounds (flavonoids, phenolic acids, anthocyanins, tannins) are secondary metabolites, which play a crucial role in the pharmaceutical sciences, thanks to their extensive biological effects (antimicrobial, antioxidant, anticancer properties). These bioactive substances have diverse basic structures but possess an aromatic ring bearing one or more hydroxyl groups, which can be related to different biological impacts [2,3].
Medicinal plants are of primary importance in several regions of Transylvania, part of Romania. In our work, four plants were selected according to the previously described ethnomedicinal and phytochemical data. These medicinal plants are widely used in Transylvania, part of Romania. Another reason to select these herbs was that there are only a few scientific records in databases on them. The selected species are applied on wounds in traditional remedies in the country. Anthyllis vulneraria L. (common kidney-vetch, Leguminosae) is an annual, biennial or perennial plant that occurs in fields and meadows throughout Europe [4]. In Transylvania, the aerial part is used as an antiemetic drug [5], for swelling [6], wounds [7], kidney problems and diabetes as a tea [8] and as fodder [9]. In Lueta (local name: szipókavirág), it is used for wounds and stomach disorders as a tea (Nóra Papp, unpublished data). Its aerial part contains several bioactive compounds such as flavonoids, saponins [10,11], carotenoids, tannins and phenolic acids [12]. Lysimachia nummularia L. (creeping Jenny, Primulaceae) is an evergreen plant which lives mostly in ditches and wet grasslands, and in some places as a cultivated species throughout Europe [4]. In the Transylvanian ethnomedicine (local name: fillérfű, fillérlapi) the aerial part is used for toothache as a decoction [6], rheumatoid arthritis [13,14], wound and abscess as a fomentation [7,9,15,16], and pain of the legs as a fomentation and bath [17]. The leaves are rich in flavonoids [18] and triterpenoid saponins [19]. Fuchsia magellanica Lam. and Fuchsia triphylla L. (hardy fuchsia and lady’s eardrops, Onagraceae) are perennial cultivated plants all over in Europe, in addition, F. magellanica is locally naturalized, e.g., in Azores, Ireland, and Britain [4]. Fresh leaves of several Fuchsia varieties are ethnomedicinally applied on wounds [9], furuncles and skin inflammation as a fomentation [17,20]. Anthocyanins were detected in the flowers and berries of Fuchsia species [21,22], while in their leaves several flavonoids were present [23].
In our experiments, to get a comprehensive picture regarding the phenolic content, reversed-phase liquid chromatography coupled with tandem mass spectrometry (RP-LC-DAD-MS/MS) was used to tentatively characterize flavonoid and phenolic acid compounds. The main effects of the active constituents of the leaf extracts of selected plants in favor of wound healing are protection against microbial infection from the external environment, scavenging of free radicals with antioxidant effects and enhancing of cell migration, proliferation, angiogenesis and collagen production in the wounded area [24,25,26]. Therefore, the aim of the study was to test the antioxidant activity of the leaf extracts, where conventional total antioxidant capacity (TAC) chemical tests and cell-based antioxidant methods were applied. Besides that, we evaluated the antimicrobial properties by determination of the inhibitory effect of the leaf extracts against several Gram-positive and Gram-negative bacterial strains. The wound healing process means the interplay between various cell types, including neutrophils, macrophages, keratinocytes, fibroblasts, and endothelial cells [26,27]. For this reason, we applied fibroblast- and keratinocyte-based cellular models. To determine the nontoxic concentrations of the tested leaf extracts, we combined our previously published plate reader-based cell viability assay [28] with more sensitive flow cytometer-based fluorescence apoptotic–necrotic cell detection. Additionally, cell-based methods were performed by a time-lapse live imaging technique in order to measure the effects of the leaf extracts on the closure rate of standardized cell-free areas in a migration assay. These techniques enabled us to evaluate the biochemical properties of our plant extracts and to show their diverse biological effects on human keratinocyte and mouse fibroblast cell lines.

2. Materials and Methods

2.1. Reagents and Chemicals

Luminol (3-aminophthalhydrazide), 4-iodophenol, Trolox (6-hydroxy-2,5,7,8-tetramethylchroman-2-carboxylic acid), horseradish peroxidase (POD), Na2-fluorescein, AAPH (2,2′-azo-bis(2-amidinopropane) dihydrochloride), 2,2-Diphenyl-1-picrylhydrazyl (DPPH), potassium persulfate (K2S2O8), 2,2′-azino-bis(3-ethylbenzothiazoline-6-sulfonic acid) (ABTS), 2′,7′-dichlorofluorescein diacetate (DCFH-DA), dihydrorhodamine 123 (DHR123), quercetin, modified RPMI 1640 (supplemented with 165 mM MOPS, 100 mM glucose and 0.185 mM adenine), erythromycin, Dulbecco’s Modified Eagle Medium (DMEM), trypsin-EDTA, penicillin–streptomycin for cell culture, acetic acid and methanol of HPLC supergradient grade for LC-MS analyses, propidium iodide (PI), fluorescamine (Fluram) and 7-aminoactinomycin D (7AAD) were purchased from Sigma-Aldrich/Merck (Darmstadt, Germany). 3-(N-morpholino) propanesulfonic acid (MOPS) was from Serva Electrophoresis GmbH (Heidelberg, Germany). Ethanol (96% v/v, spectroscopic grade), glucose, adenine, agar-agar, and hydrogen peroxide (H2O2) were from Reanal Labor (Budapest, Hungary), while bioluminescent ATP Assay Kit CLSII and peroxide-free Triton X 100 (TX-100) were from Roche (Mannheim, Germany). Fetal bovine serum (FBS; Pan-Biotech, Aidenbach, Germany), and bovine serum albumin (BSA; Biosera, Nuaille, France) were used. Recombinant human platelet-derived growth factor-BB (PDGF-BB), phosphate-buffered saline (PBS, pH 7.4), Hanks’ Balanced Salt Solution (5.5 mM glucose) and Annexin V were from Thermo Fischer Scientific (Waltham, Massachusetts, USA). Highly purified water (<1.0 µS) was applied throughout the experiments. Plastic cell culture flasks and culture plates (96-well, 24-well and 6-well) were from TPP (Trasadingen, Switzerland), while standard 96-well plates were from Greiner Bio-One (Kremsmunster, Austria). For luminescence studies white 96-well optiplates were used (Perkin Elmer, Waltham, MA, USA).

2.2. Studied Plant Taxa and Plant Extraction

Voucher specimens of the selected four plants with unique codes were deposited at the Department of Pharmacognosy, University of Pécs, Pécs, Hungary. Fresh leaves of Anthyllis vulneraria (A. vulneraria, Voucher code: TR_7) and Lysimachia nummularia (L. nummularia, Voucher code: TR_15) were collected locally in Transylvania in July 2018, while Fuchsia magellanica (F. magellanica, Voucher code: TR_10) and Fuchsia triphylla leaves (F. triphylla, Voucher code: TR_9) were collected in June 2018 from the Botanical Garden of the University of Pécs, Pécs, Hungary.
Plant samples were dried at room temperature and stored in the dark. The plant extraction was performed according to the method of Lee et al. with some modifications [29].The aqueous and ethanolic extracts were obtained by extracting 3 g of leaf powder in 30 mL of 50% (v/v) ethanol or distilled water on an orbital shaker (Dual-Action Shaker KL2, Edmund Bühler GmbH, Bodelshausen, Germany) at room temperature overnight (200 rpm). The extracts were filtered through a 0.45 μm pore-size syringeless filter (Whatman Mini-UniPrep, Maidstone, United Kingdom), and further concentrated using a rotary vacuum evaporator (Rotavapor R-3, Buchi Labortechnik AG, Flawil, Switzerland). Amounts between 70–80 mg were obtained, which were dissolved in 1 mL of 50% (v/v) ethanol or distilled water. All prepared aqueous and ethanolic extracts were stored at −20 °C until the experiments were performed.

2.3. Analyses of Phenolic Compounds by HPLC with Diode-array Detector and Electrospray Ionization with MS

2.3.1. HPLC Conditions

The chromatographic separation was performed on an Agilent 1100 HPLC system equipped with a G1379A degasser, G1312A binary gradient pump, G1329A autosampler, G1316A column thermostat and G1315C diode array detector (DAD) (Agilent Technologies, Waldbronn, Germany). Samples were separated on a Zorbax SB-C18 (Agilent Technologies, Santa Clara, CA, USA) (150 mm length, 3.0 mm i.d., 3.5 μm particle diameter) column, maintained at 25 °C. The mobile phase was composed of 0.3% acetic acid in water (v/v) (A) and methanol (B). The following gradient program was applied, at a flow rate of 0.3 mL/min with the composition of the mobile phase changing from 5% B to 100% B in 30 min, maintaining 100% B for 5 min and returning to 5% B in 1 min. All aqueous solvents were filtered through MF-Millipore (Millipore, Billerica, MA, USA) (0.45 μm, mixed cellulose esters) membrane filters. Chromatograms were acquired at 280 nm. Injection volume was 5 μL. Prior to injection, all samples were filtered through Sartorius (Goettingen, Germany) Minisart RC15 (0.2 μm) syringe filters.

2.3.2. MS Conditions

Mass spectrometric analyses were performed with an Agilent 6410B triple quadrupole equipped with an electrospray ionization source (ESI) (Agilent Technologies, Palo Alto, CA, USA). ESI conditions were as follows: temperature: 350 °C, nebulizer pressure: 40 psi, N2 drying gas flow rate: 9 L/min, fragmentor voltage: 120 V, capillary voltage: 4000 V, collision energy was changed between 10 eV and 45 eV, depending on the analyzed structure. High purity nitrogen was used as collision gas. Full mass scan spectra were recorded in negative and for anthocyanins in positive ionization mode over the range of m/z 50–1000 Da (scan/s). The MassHunter B.01.03 software was used for data acquisition and qualitative analysis.

2.4. Determination of Minimum Inhibitory Concentration (MIC80) with Microdilution Method

All the bacterial strains were collected from Szeged Microbiology Collection (SZMC), Department of Microbiology, University of Szeged, Hungary, and from Pécs Microbiology Collection (PMC), Department of General and Environmental Microbiology, Institute of Biology, University of Pécs, Hungary. Tested strains were the followings: Bacillus subtilis (B. subtilis, SZMC strain: 0209), Escherichia coli (E. coli, PMC strain: 201), Staphylococcus aureus (S. aureus, ATCC strain: 29213), Streptococcus pyogenes (S. pyogenes, SZMC strain: 0119) and Pseudomonas aeruginosa (P. aeruginosa, PMC strain: 103).
The microdilution method was performed according to a previously published method with some modifications [30]. In brief, 100 µL of bacterial suspensions (105 CFU/mL) in modified RPMI 1640 and 100 µL of diluted aqueous or 50% (v/v) ethanolic leaf extracts in modified RPMI 1640 media were pipetted into each well of sterile 96-well plates. The sterile medium was considered as negative control, the inoculated RPMI 1640 without any treatment was taken as the bacterial growth control, while erythromycin was used as positive control. The final concentration of the ethanolic solvent for the dilution was restricted up to 1.0% v/v in the wells. The absorbance was measured at 595 nm on Multiskan EX 355 (Thermo Electron Corporation, Waltham, Massachusetts, USA) spectrophotometer, after 24 h incubation time at 30 °C. Absorbance values lower than 20% of the bacterial growth controls were considered as MIC80. Treatments were carried out with three technical replicates in five independent experiments.

2.5. Total Antioxidant Capacity (TAC) Assays

2.5.1. Oxygen Radical Absorbance Capacity (ORAC) Assay

The ORAC test was executed according to the method of Kőszegi et al. without modifications [31]. The method is based on fluorescence quenching of Na2-fluorescein oxidized by AAPH. The quenching is delayed by the antioxidants present in the standards/samples. Serial dilutions of Trolox were used as standard. Briefly, into each well of normal 96-well plates 150 µL of working fluorescein solution (400 nM dissolved in 75 mM potassium phosphate buffer, pH 7.5) and 25 µL of blank/standard/plant extract (aqueous/ethanolic) were pipetted and the plates were preincubated for 30 min at 37 °C in the dark. After automated injection of 25 µL of AAPH solution (400 mM dissolved in 75 mM potassium phosphate buffer, pH 7.5) the fluorescence intensities were measured in kinetic mode for 80 min at 37 °C, with excitation and emission wavelengths of 490 and 520 nm, respectively. For the fluorescence measurements, the plate reader (BioTek Synergy HT, Winooski, Vermont, USA) was thermostated at 37 °C. Five independent experiments were done with three technical replicates for each treatment.

2.5.2. Enhanced Chemiluminescence (ECL) Assay

The enhanced chemiluminescence method was performed following our previously published study without modifications [31]. The technique is based on the development of enhanced chemiluminescence (ECL) of luminol in the presence of peroxidase (POD), H2O2 and 4-iodophenol enhancer. The increase of the ECL signal is delayed, depending on the antioxidant capacity of the samples. Briefly, 70 µL of ECL detection reagent (0.15 M boric acid/NaOH, pH 9.6, supplemented with 0.45 mM luminol and 1.8 mM 4-iodophenol) and 200 µL POD enzyme solution (15 µU/mL) were premixed and kept on ice. Trolox dilutions were used as standard. Into each well of white optical 96-well plates 20 µL Trolox/blank/sample and 270 µL of POD-ECL reagent were added. The reaction was initiated by automated injection of 20 µL ice-cold H2O2 (1.5 mM, in 0.1% citric acid). The chemiluminescence signal was followed for 10 min, using a plate reader (Biotek Synergy HT) in kinetic analysis mode. Five independent experiments were done with three technical replicates for each treatment.

2.5.3. 2,2-Diphenyl-1-Picrylhydrazyl (DPPH) Radical Scavenging Assay

The method is based on the absorbance decrease of DPPH, which is a stable organic radical. The measurement was conducted following the protocol described elsewhere [32,33], with some modifications. Briefly, 50 µL of blank/standard/plant sample dilutions followed by 100 µL of 200 µM DPPH (dissolved in 96% ethanol) and 50 µL of acetate buffer (100 mM, pH 5.5) were pipetted into 96-well general microplates. The absorbance changes were measured at 517 nm by a Perkin Elmer EnSpire Multimode plate reader (Perkin Elmer, Waltham, MA, USA) after 60 min incubation in the dark, at room temperature. The results were compared to serial dilutions of Trolox standard solution. Five independent experiments were done with three technical replicates for each treatment.

2.5.4. Trolox Equivalent Antioxidant Capacity (TEAC) Assay

The technique is based on the generation of ABTS radical cation (ABTS•+) through the reaction between ABTS and potassium persulfate (K2S2O8). The method of Re et al. and Stratil et al. was adapted for the TEAC test with slight modification [34,35]. ABTS•+ was produced by reaction of ABTS stock solution (7 mM of ABTS dissolved in distilled water) with 2.45 mM K2S2O8 (final concentration) and diluted with PBS (pH 7.4) until the absorbance was 0.70 ± 0.005 at 734 nm. Then 20 μL aliquots of varying concentrations of the leaf extracts (50% ethanolic/aqueous) were allowed to react with 80 μL of ABTS•+ (7 mM) and the absorbance readings were recorded at 734 nm by the Perkin Elmer EnSpire Multimode plate reader after 20 min incubation in the dark, at room temperature. Trolox was used as standard. All measurements were carried out in five independent experiments with three technical replicates.

2.5.5. Calculation of Total Antioxidant Capacities (TAC)

For both the ORAC and ECL assays, the results were calculated as Trolox equivalents (TE). In the ORAC method the area under the fluorescence curve (AUC) of the blank was subtracted from that of the standard/sample (netAUC) and a calibration line was calculated for the netAUC of the Trolox standards. In the luminescence technique (ECL) the AUC of the emission curves vs. Trolox standards were used to calculate the calibration line. In both cases the samples’ TE values were obtained from the calibration curves which were then multiplied by the dilution factor and expressed as μM TE concentration. Finally, TAC was referred to 1 g of initial dry material for each plant sample.
For the DPPH and TEAC assays, the radical scavenging activity was expressed as IC50 (the concentration of the plant extract in µg/mL, required to scavenge 50% of DPPH or ABTS reactions), calculated by a linear regression curve made from the scavenging activities vs. amount of extracts of the samples. This means that the lower the IC50 value of the sample is, the higher antioxidant activity it possesses.
Radical scavenging activity of the leaf extracts in % of the blank was obtained using the following formula:
Radical   scavenging   activity   ( %   inhibition ) =   ( A 0 A 1 A 0 ) × 100
where A0 is the absorbance of the blank and A1 is the absorbance of the sample.

2.6. Cell Cultures

Mouse fibroblasts (3T3, ATCC: CRL-1658) were cultured in DMEM with high glucose (4500 mg/L), supplemented with 5% non-essential amino acids, 10% FBS, penicillin (100 U/mL) and streptomycin (100 µg/mL), while the human epidermal immortalized keratinocyte cell line (HaCaT) was kindly provided by the laboratory of Prof. Tamás Bíró (Department of Immunology, Faculty of Medicine, University of Debrecen, Hungary). HaCaT cells were cultured in DMEM with high glucose (4500 mg/L), supplemented with 10% FBS, penicillin (100 U/mL) and streptomycin (100 µg/mL) in 75 cm2 cell culture flasks at 37 °C in a humidified atmosphere containing 5% CO2. In both cases, after reaching 80% confluency, the cells were trypsinized and plated in 96-well/24-well/6-well sterile plastic plates.

2.7. Quantification of Intracellular ROS

Cellular oxidative stress due to the overproduction of reactive oxygen species (ROS) generated by AAPH was measured using the DCFH-DA and the DHR123 methods [36,37,38]. Trolox and quercetin were used as positive controls. The optimal conditions of DCFH-DA and DHR123 assays were as follows on 96-well culture plates: seeding density of 5 × 10⁴ cells/mL, cell culture incubation time for overnight. After washing with PBS co-incubation in Hanks’ (5.5 mM glucose) with 50 µM DCFH-DA or 10 µM DHR123 and plant extract/quercetin/Trolox on 3T3/HaCaT cell cultures for 1 h was performed. After removal of the treating medium and washing with PBS, 1 mM AAPH oxidant in Hanks’ glucose was added. The fluorescence intensity was recorded for 60 min on the Biotek microplate reader at 490/520 nm exc/em wavelengths at 37 °C. The radical scavenging activity was expressed as IC50 (the concentration of the plant sample (µg/mL), required to scavenge 50% of DCFH or DHR123 fluorescence), calculated by a linear regression analysis of the serial dilutions of the leaf extracts.
The radical scavenging activity was obtained using the following equation:
Radical   scavenging   activity   ( %   inhibition )   =   ( AUC 0 AUC 1 AUC 0 ) × 100
where AUC0 is the area under curve values of the blank and AUC1 is the area under curve values of the sample. Five independent experiments were done with four technical replicates for each treatment.

2.8. Plate Reader Cytotoxicity Test

A multiparametric viability assay with one-step extraction was carried out following our previously published study without modifications to investigate the potential toxicity of 50% (v/v) ethanolic and aqueous leaf extracts [28]. A. vulneraria in 500–2500 µg/mL concentrations (ethanolic extracts) and 4000–8000 µg/mL concentrations (aqueous extracts) were tested. F. magellanica and F. triphylla in 50–800 µg/mL concentrations (ethanolic extracts) and 120–1000 µg/mL concentrations (aqueous extracts) were examined. L. nummularia in 250–1500 µg/mL concentrations (ethanolic extracts) and 3000–7000 µg/mL concentrations (aqueous extracts) were investigated. The final concentration of the ethanolic solvent was restricted up to 1.5% v/v in the wells, which concentration does not affect the viability of the cells. Briefly, 3T3 and HaCaT cells were treated with various concentrations of the plant extracts for 24 h, after that ATP was measured from the cell lysates with the bioluminescence method. Nucleic acid content was analyzed with PI staining, while intracellular proteins were quantified after fluorescent derivatization with fluorescamine. All results were expressed as mean ± SD in percentage compared with data obtained for the controls (~100%). Five independent experiments were done with four technical replicates for each treatment and dose response curves were calculated from the measured data. The dose-response curves were obtained after DoseResp fitting by using the OriginLab Pro software (version 2016, OriginLab Corporation, Northampton, MA, USA).

2.9. Flow Cytometric Cytotoxicity Test

In the plate reader analysis, we could estimate the cytotoxicity in general, however, using flow cytometry it is possible to reveal the type of potential cell injury induced by the leaf extracts. For this sensitive method we used lower concentrations of the 50% (v/v) ethanolic extracts; A. vulneraria in 50, 100, 200 µg/mL, F. magellanica and F. triphylla in 2.5, 5, 10 µg/mL and L. nummularia in 10, 25, 50 µg/mL concentrations, which were presumably sub-cytotoxic based on the plate reader viability assay. Experiments were carried out in three technical replicates on a BD Canto II cytometer (Becton, Dickinson and Company, Franklin Lakes, NJ, USA). Apoptotic, necrotic and late apoptotic cells were measured using Annexin V and 7-aminoactinomycin D (7AAD) staining. Annexin V was conjugated with fluorescein isothiocyanate (FITC) or Pacific Blue (PB), 7AAD was measured on the PerCP channel. Annexin V single positivity marked the apoptotic cells, 7AAD labeled the necrotic cells, the double positive population meant the late apoptotic cells, while the double negative population was live. Since two labels were used in one sample, positivity was defined based on fluorescence minus one (FMO) controls—which were the single-stained ones. Compensation and analysis was carried out in FlowJo v.10 (FlowJo LLC., Ashland, OR, USA).

2.10. In Vitro “Wound Healing” Assay

The in vitro migration test was evaluated using culture inserts of 500 µm width (Ibidi GmbH, Gräfelfing, Germany). Briefly, an insert with 2 wells was placed in 24-well sterile culture plates, and then keratinocytes and fibroblasts were seeded into the 2 wells of the culture insert. After cell attachment and production of a monolayer, the culture insert was removed, and cells were incubated for 24 h with different sub-cytotoxic doses of 50% (v/v) ethanolic extracts. A. vulneraria in 50, 100, 200 µg/mL concentrations, F. magellanica and F. triphylla in 2.5, 5, 10 µg/mL concentrations and L. nummularia in 10, 25, 50 µg/mL concentrations were investigated. PDGF-BB was used as positive control at 15 ng/mL concentration. Within the cell-free gap the cell migration was visualized at every 4 h for 24 h by time-lapse imaging in bright field, using phase-contrast microscopy (JuLi Stage Real-Time Cell History Recorder, NanoEnTek, Seoul, Korea). The gap was monitored at an objective magnification of 10×. The closure rate of the open cell-free area was determined by quantifying the micro photo density data obtained for every occasion from the very same loci with ImageJ 1.x processing software (https://imagej.nih.gov/ij/). The closure rate in % was calculated by the following formula:
Closure   rate ( % ) = ( Open   area 0 . h Open   area x . h Open   area 0 . h ) × 100
where “Open area 0.h” is the cell-free area at the beginning of the experiment while “Open area x.h” is the still cell-free space at time points of imaging the samples. Finally, closure rate curves were constructed and the area under curve (AUC) for each treatment and cell line was calculated. The corresponding AUC data were averaged (±SD) and the summarized closure rates for the leaf extracts/PDGF were given in percentage (%) of the untreated controls. Three independent experiments were done with three technical replicates for each treatment.

2.11. Statistical Analyses

Where appropriate, data were expressed in % of the control samples, which were assumed to be ~100%. In the cytotoxicity plate reader assay correlation coefficients of each tested parameter were given for the dose-response curves. Statistical evaluation was carried out in the antioxidant assays using independent t-test, where the ethanolic and aqueous extracts were compared with each other, furthermore, in the migration assay using one-way ANOVA test, where the control and the sample data of one type of treatment were compared by SPSS software (IBM, SPSS Statistics, version 22, Armonk, NY, USA). In addition, principal component analysis (PCA) was also used to test the differences between the two types of extracts of four selected medicinal plants and four chemical antioxidant assays. For PCA, prcomp function was used from the stats package within R (R Core Team 2019, version 3.6.1, Vienna, Austria). In all cases, the level of significance was set at p < 0.05.

3. Results

3.1. Qualitative Analysis of Phenolic Compounds in Plant Extracts with LC-DAD-ESI-MS/MS

Aqueous and 50% (v/v) ethanolic extracts of A. vulneraria, F. magellanica, F. triphylla and L. nummularia were studied using LC-DAD-ESI-MS/MS methods, in order to characterize the constituents responsible for the biological actions. Eighty-two gallic acid derivatives, hydroxycinnamic acid derivatives and flavonoid glycosides were detected altogether in the samples; moreover, eight anthocyanins were described in Fuchsia samples. Compounds were tentatively characterized by comparing their chromatographic behaviors, UV spectra and mass spectrometric fragmentation patterns with data from the literature. In order to provide semi-quantitative results regarding the quantities of the constituents, their relative abundance (%) was calculated according to the summarized areas of all the compounds that were detected in the UV (280 nm) chromatogram of the sample. Results are presented in Table 1 and Table 2, UV chromatograms (280 nm) of the extracts are shown in Supplementary Material (Figures S1–S8).
Flavonol glycosides prevailed in A. vulneraria samples with compounds bearing the aglycone moieties kaempferol (e.g., compounds 23 and 25) and quercetin (e.g., 40), as well as methoxylated aglycone moieties isorhamnetin (e.g., 33) and rhamnocitrin (e.g., 77). In addition, the aqueous extract comprised diverse caffeoyl (e.g., 5, 8), coumaroyl (e.g., 7, 10) and feruloyl acid derivatives (e.g., 20, 22).
L. nummularia also contained flavonol glycosides in high amounts, however, the samples were dominated by the presence of myricetin glycosides (e.g., 43, 45, 68, 69) with myricetin 3-O-desoxyhexoside (49) as the main compound detected in both the aqueous and 50% (v/v) ethanolic extracts, and other aglycones were hardly found. For the aqueous samples, occurrence of coumaroyl (7, 14, 15) and feruloyl glucarate (18, 20, 22) isomers was characteristic.
Unusual quercetin galloyl hexosides (46, 50, 53) and a kaempferol galloyl hexoside (58) were detected in Fuchsia samples and primarily in F. magellanica. Even if anthocyanins were predominant, a peonidin dihexoside isomer (V) was present in each Fuchsia sample, while cyanidin dihexoside (II) was described only in F. magellanica extracts.
The compound analyses data are summarized in dendrograms for the ethanolic and aqueous leaf extracts separately in Figures S9 and S10 (Supplementary Material).

3.2. Determination of Minimum Inhibitory Concentration (MIC80)

The effects of leaf extracts on Gram-positive and Gram-negative bacteria were determined by CLSI M07-A9 (Vol. 32, No. 2) guidelines (Table 3). For this study, Minimum Inhibitory Concentration (MIC80) values under 100 µg/mL were considered to indicate good antimicrobial activity; from 500 to 100 µg/mL to show moderate antimicrobial activity; from 1000 to 500 µg/mL to point to weak antimicrobial activity; and over 1000 µg/mL to indicate inactivity.
The ethanolic extracts of Fuchsia species were considered to have good antibacterial activities (MIC80 values were between 5 and 60 µg/mL concentrations) on S. aureus, B. subtilis, S. pyogenes and P. aeruginosa, compared with erythromycin, where the MIC80 values were between 0.1–42 µg/mL concentrations. Ethanolic extracts of A. vulneraria and L. nummularia showed moderate antimicrobial activity on B. subtilis and S. pyogenes, and A. vulneraia pointed to weak antimicrobial activity on S. aureus.
Interestingly, only the aqueous extracts of Fuchsia spp. of the tested plants indicated a remarkably good influence on S. aureus, B. subtilis and S. pyogenes (MIC80 values between 17 and 65 µg/mL concentrations). The plant extracts did not have an antibacterial effect on E. coli.

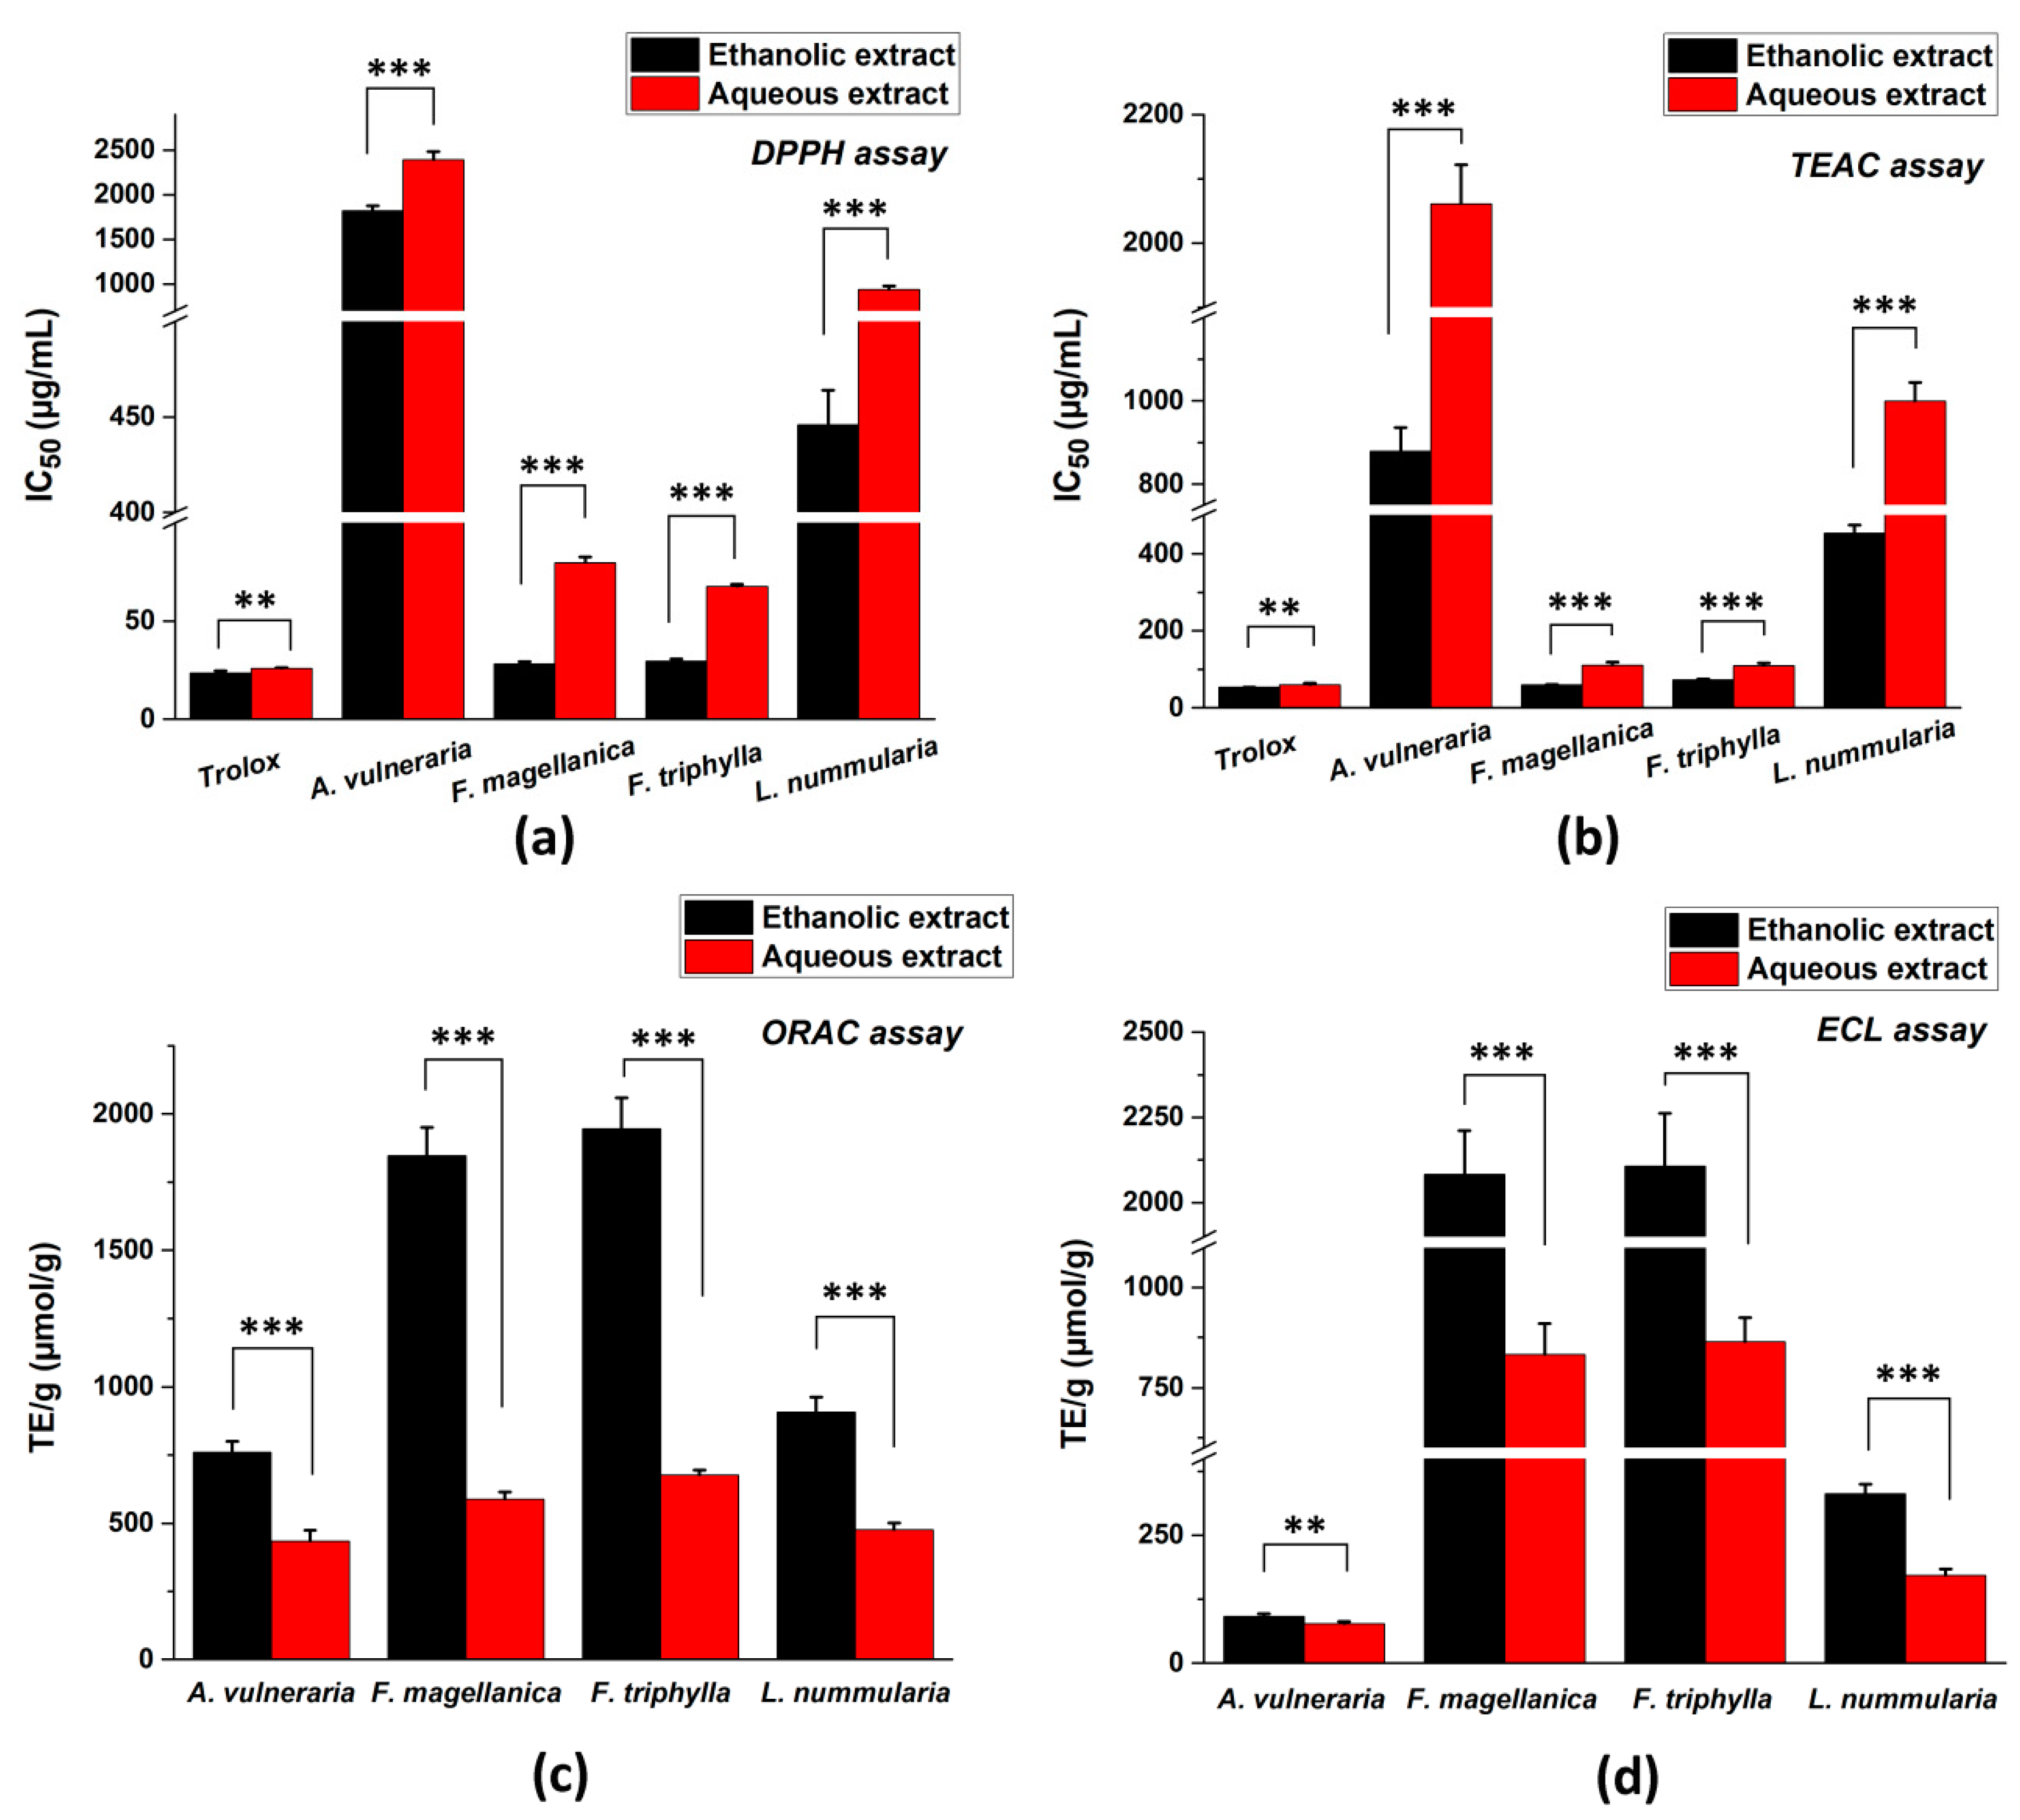
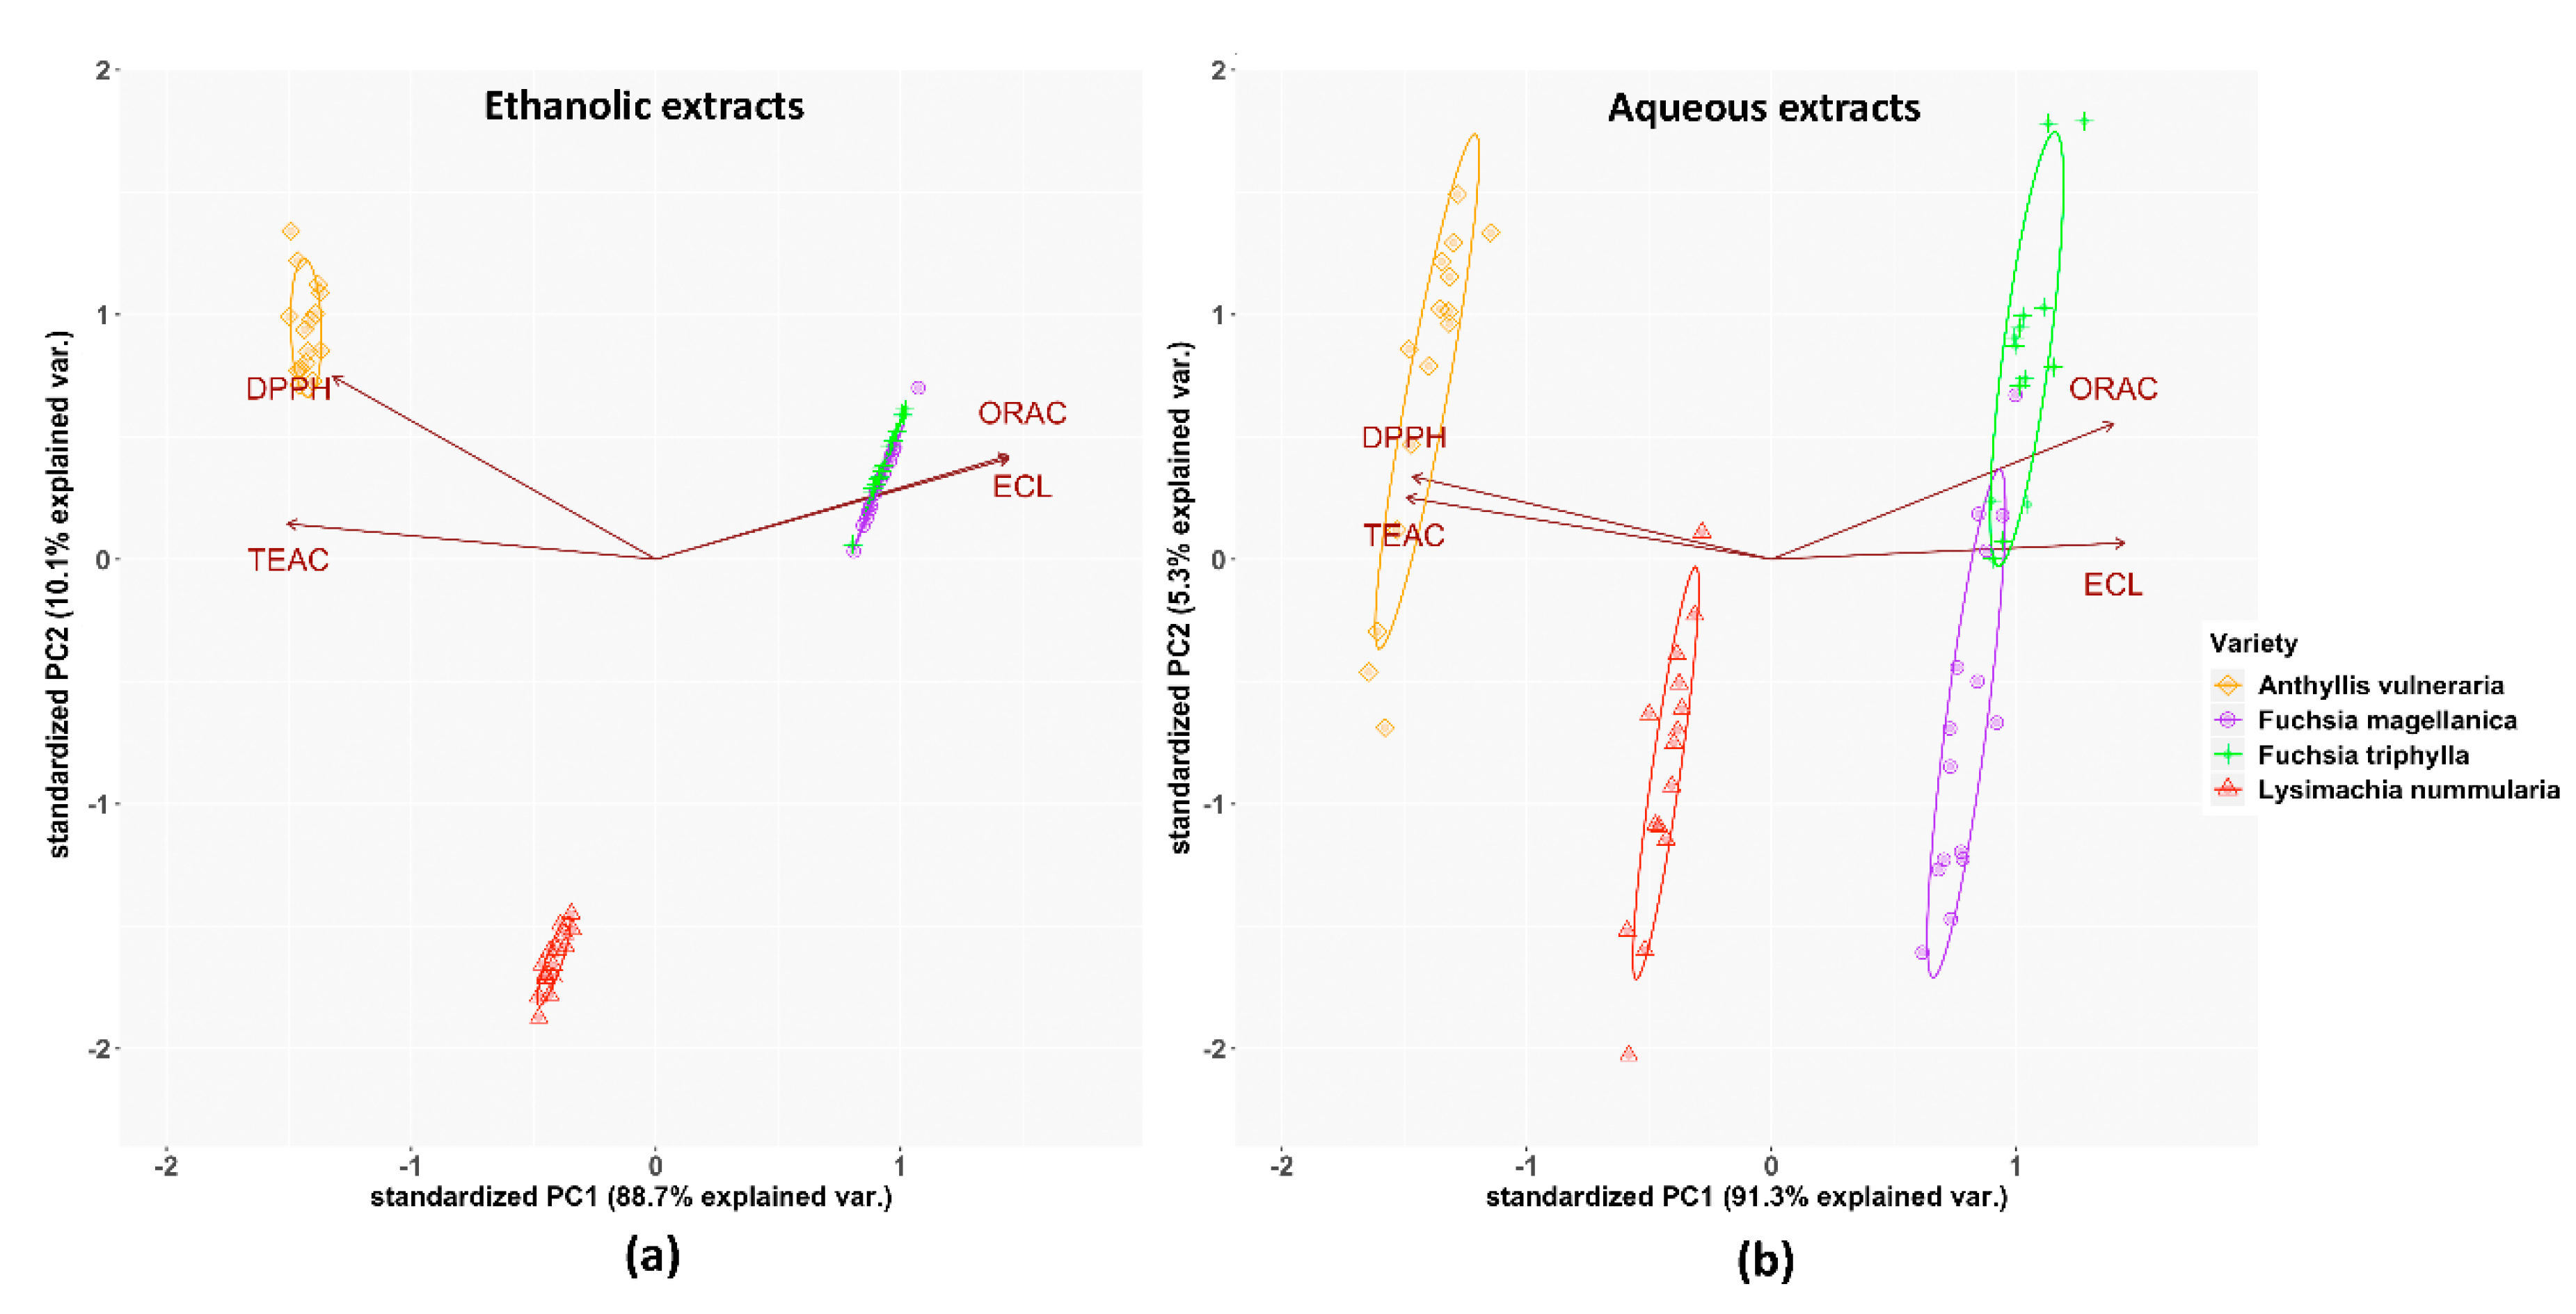
3.3. Total Antioxidant Capacity (TAC) Assays

The antioxidant properties of ethanolic and aqueous extracts of the investigated plants were evaluated by conventional chemical assays such as DPPH, TEAC, ORAC, and ECL methods (Figure 1). The lowest IC50 values indicate the highest antioxidant effect with DPPH and TEAC scavenging activity tests, while the highest TE/g values mean the strongest antioxidant capacity in case of ORAC and ECL assays. Generally, the ethanolic extracts showed higher antioxidant effect than aqueous extracts. Altogether, the ethanolic and aqueous extracts of Fuchsia species had the strongest antioxidant activity followed by Lysimachia nummularia and Anthyllis vulneraria in all methods.
The results of Principal Component Analysis (PCA) are shown in Figure 2. In the case of ethanolic extracts, a strong positive correlation was observed between the ORAC and ECL methods, while a moderate correlation existed between the data of TEAC and DPPH assays. These relationships were opposite to the results of aqueous extracts because of their stronger correlation between TEAC and DPPH methods than ECL and ORAC tests. The ethanolic extracts of Fuchsia species were more similar to each other than in the case of their aqueous extracts.

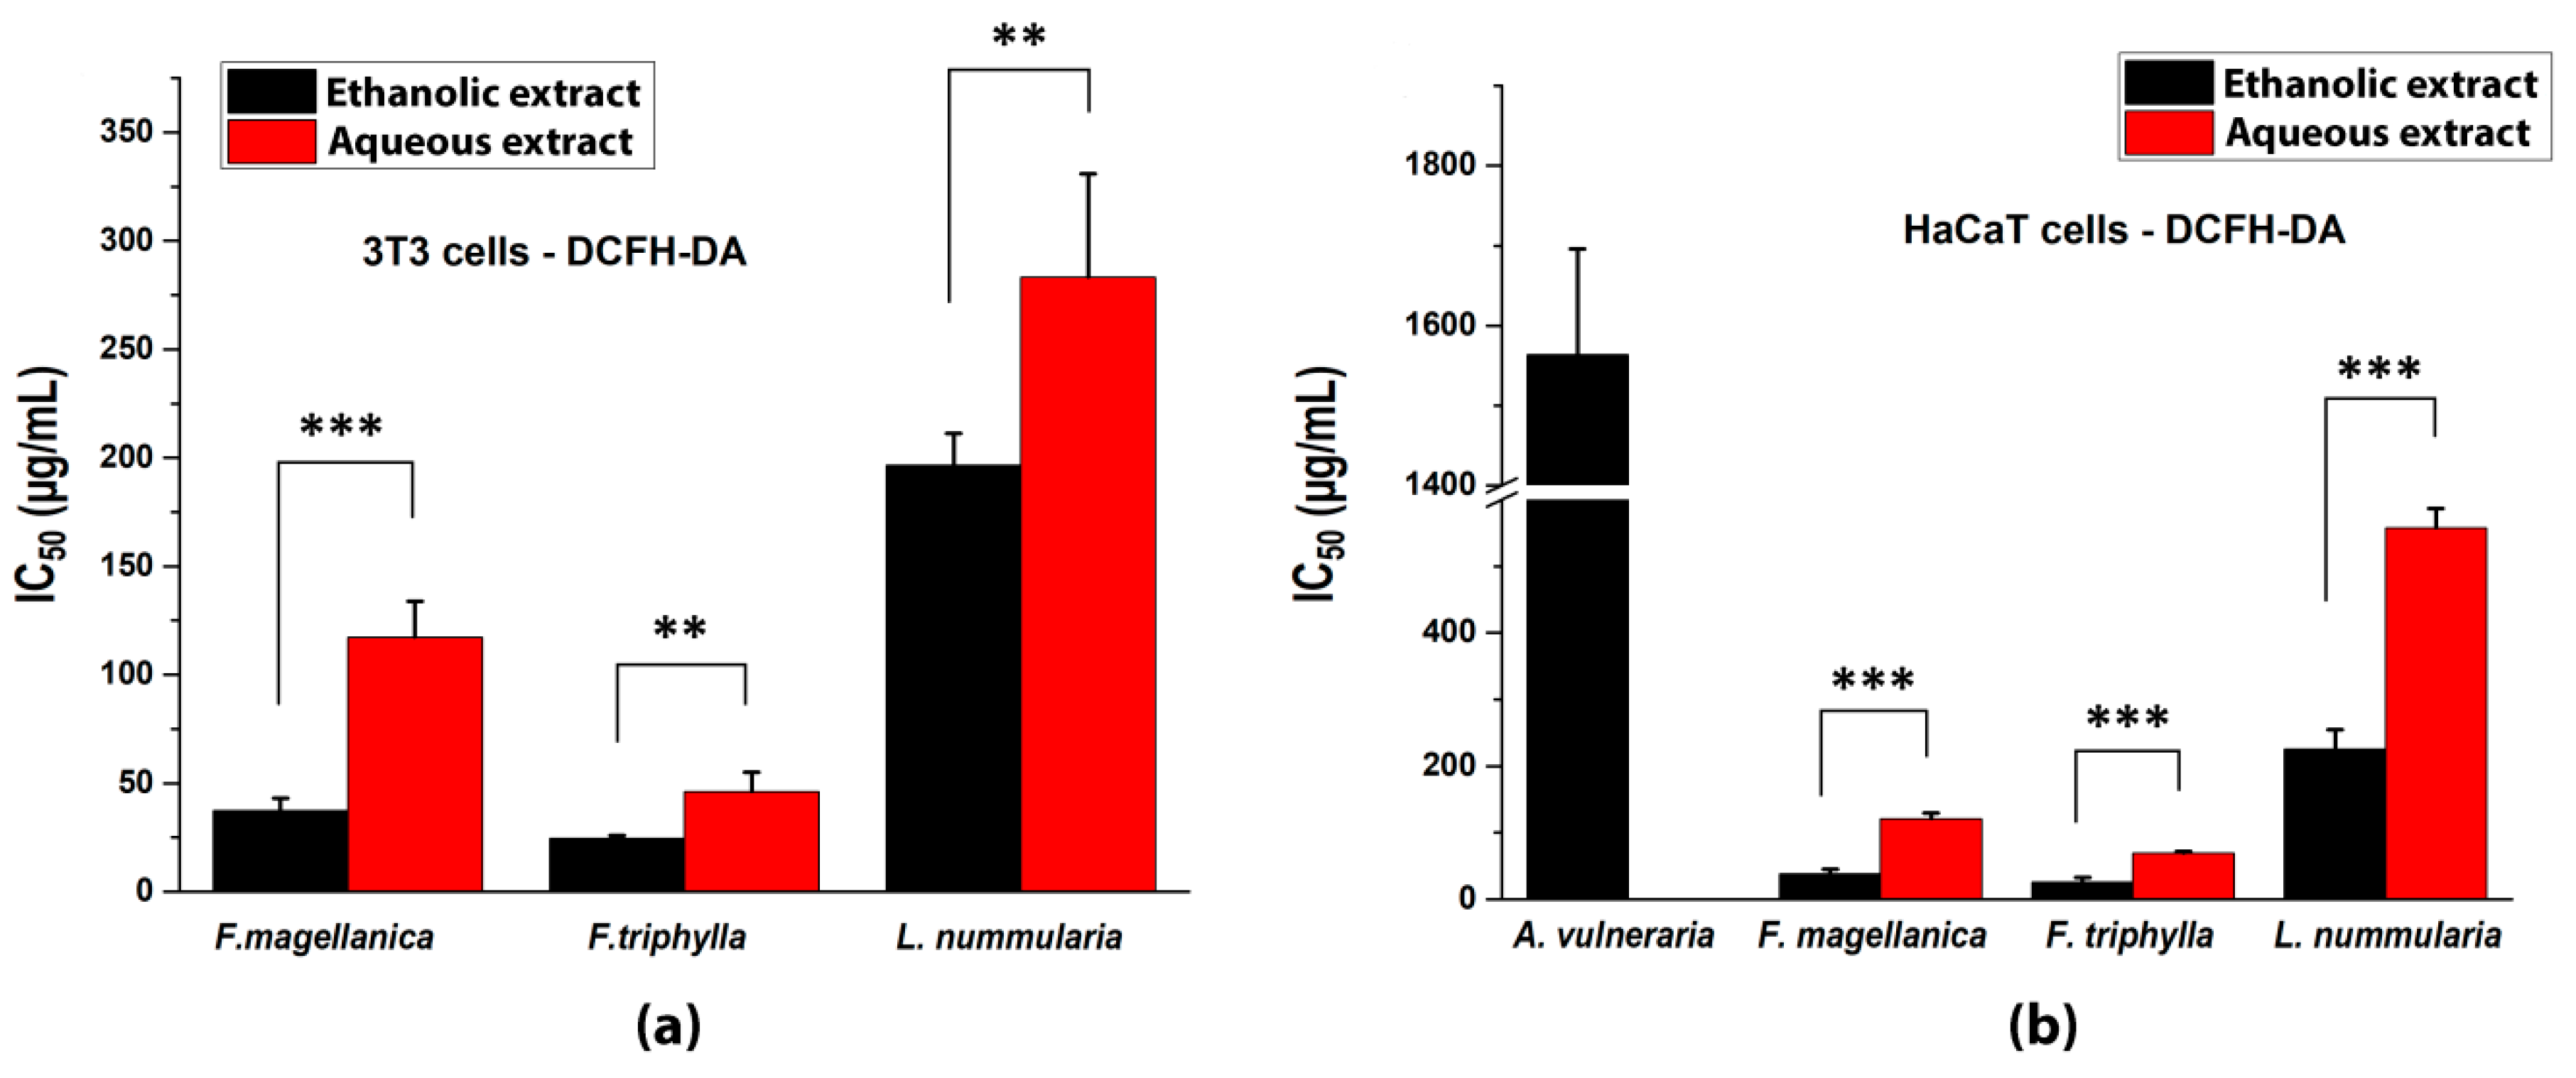
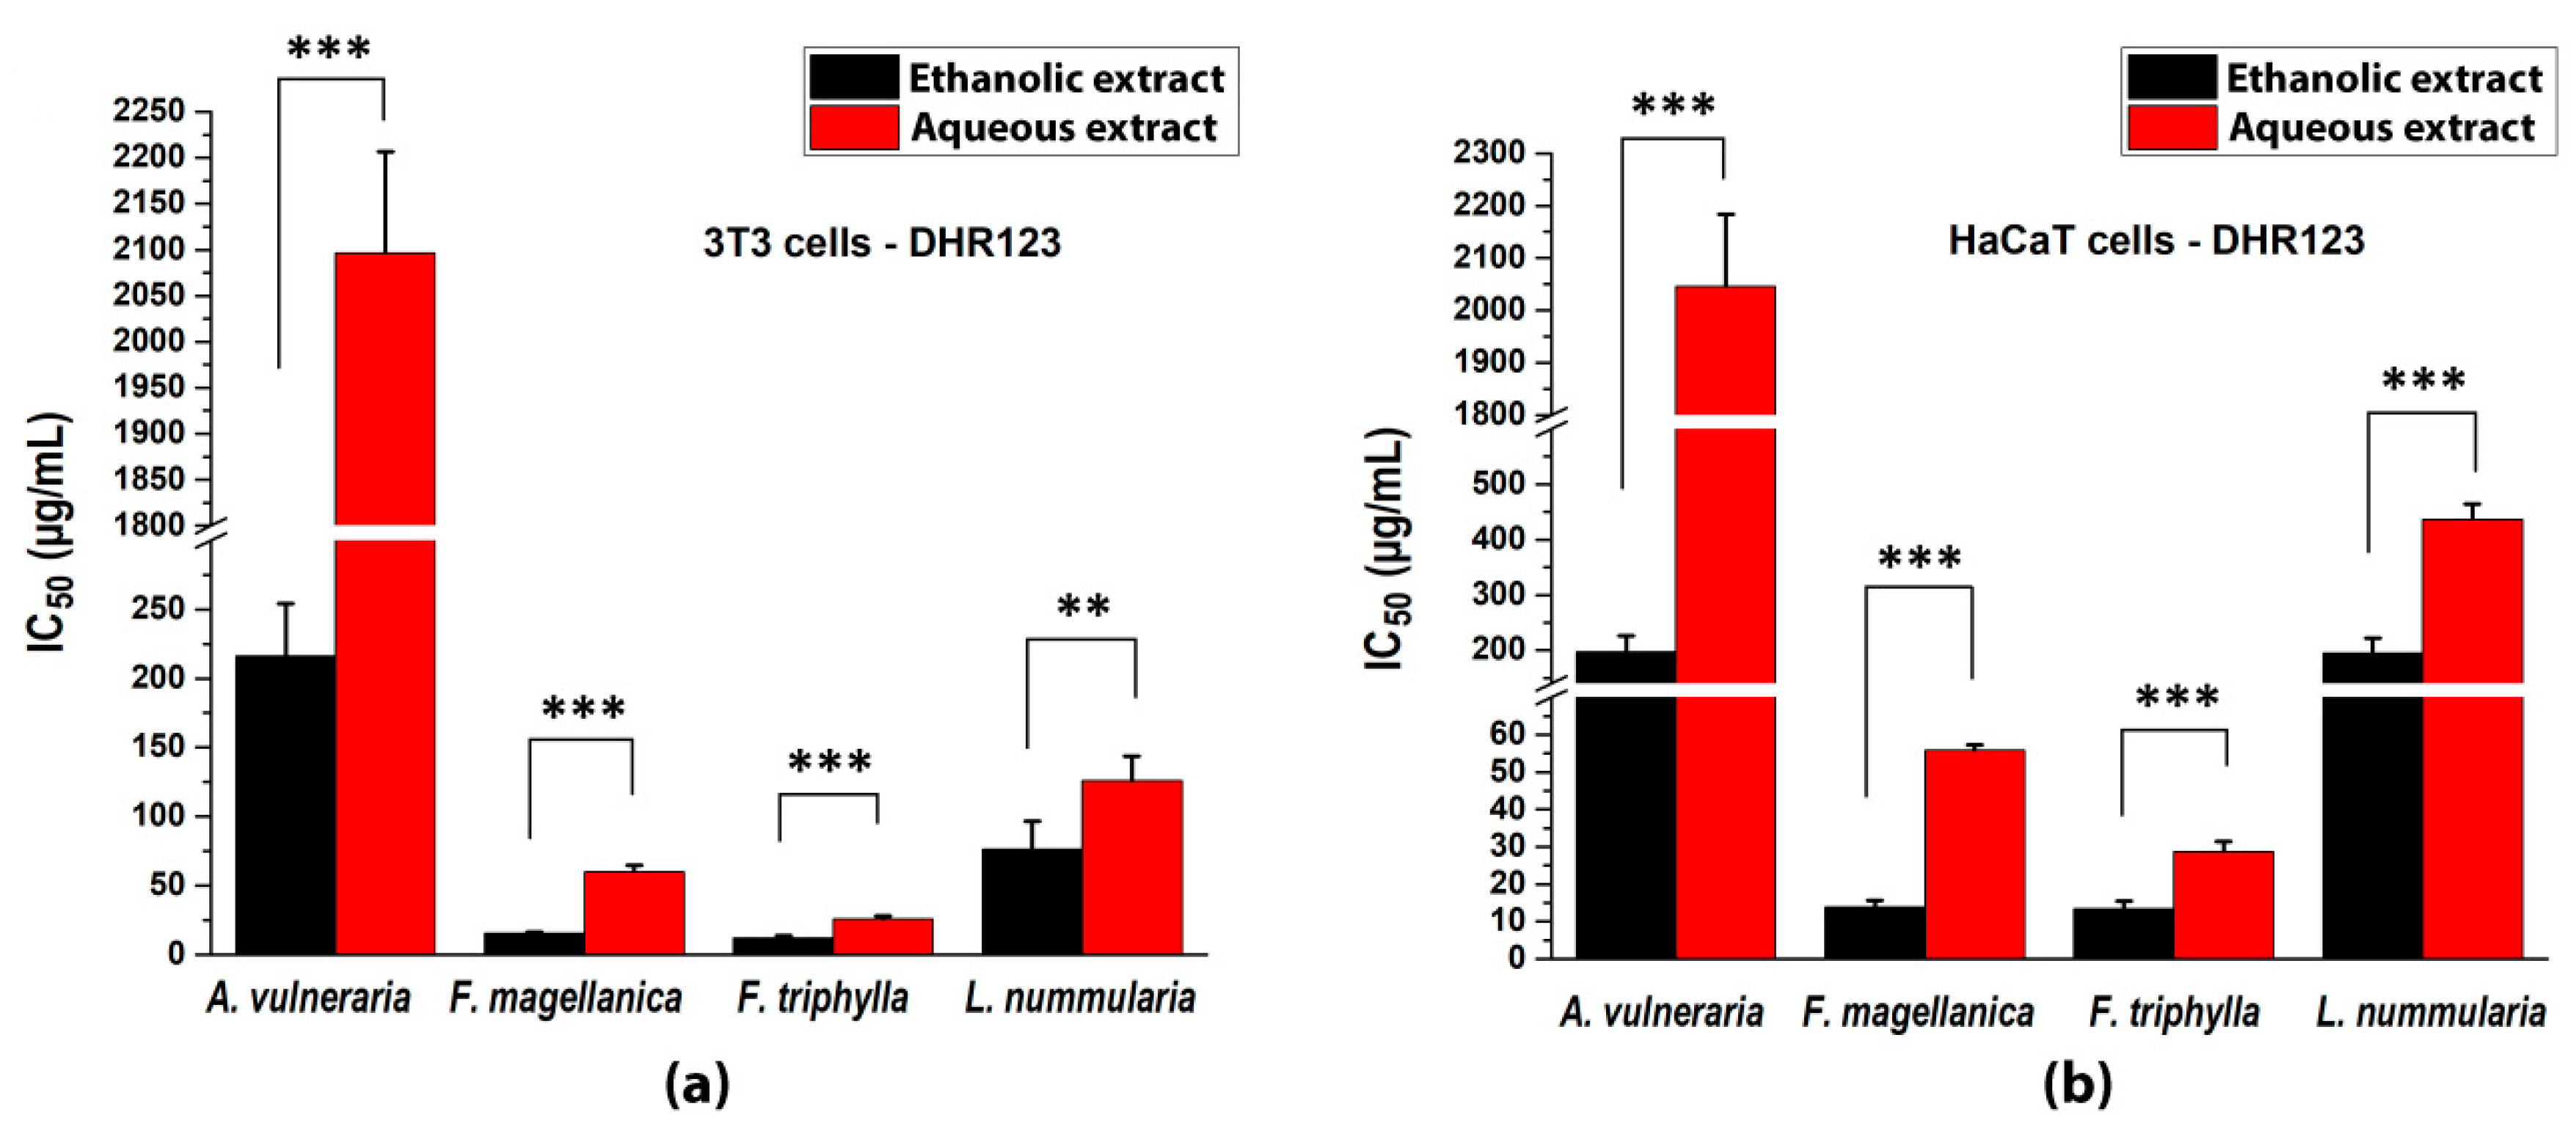
3.4. Inhibition of Intracellular ROS Production

The oxidation of DCFH and DHR was generated by peroxyl radicals from AAPH in 3T3 and in HaCaT cells [57]. The leaf extracts decreased the fluorescence of DCF and the calculated 50% inhibition values are shown in Figure 3. Ethanolic and aqueous extracts of Fuchsia species had the strongest inhibition in both cell lines, compared with other plant extracts. However, no antioxidant activity was detected for A. vulneraria in the case of 3T3 cells, and only ethanolic extracts of A. vulneraria showed measurable antioxidant property on HaCaT cell culture.
The generation of fluorescence signal from the rhodamine derivative was also decreased by the plant extracts and the calculated 50% inhibition values are shown in Figure 4. Both solvent fractions of Fuchsia spp. exerted the highest inhibition of the fluorescence intensity of rhodamine. Although ethanolic and aqueous extracts of A. vulneraria could be quantified, the aqueous fraction had only weak effectivity (at around the detection limit).

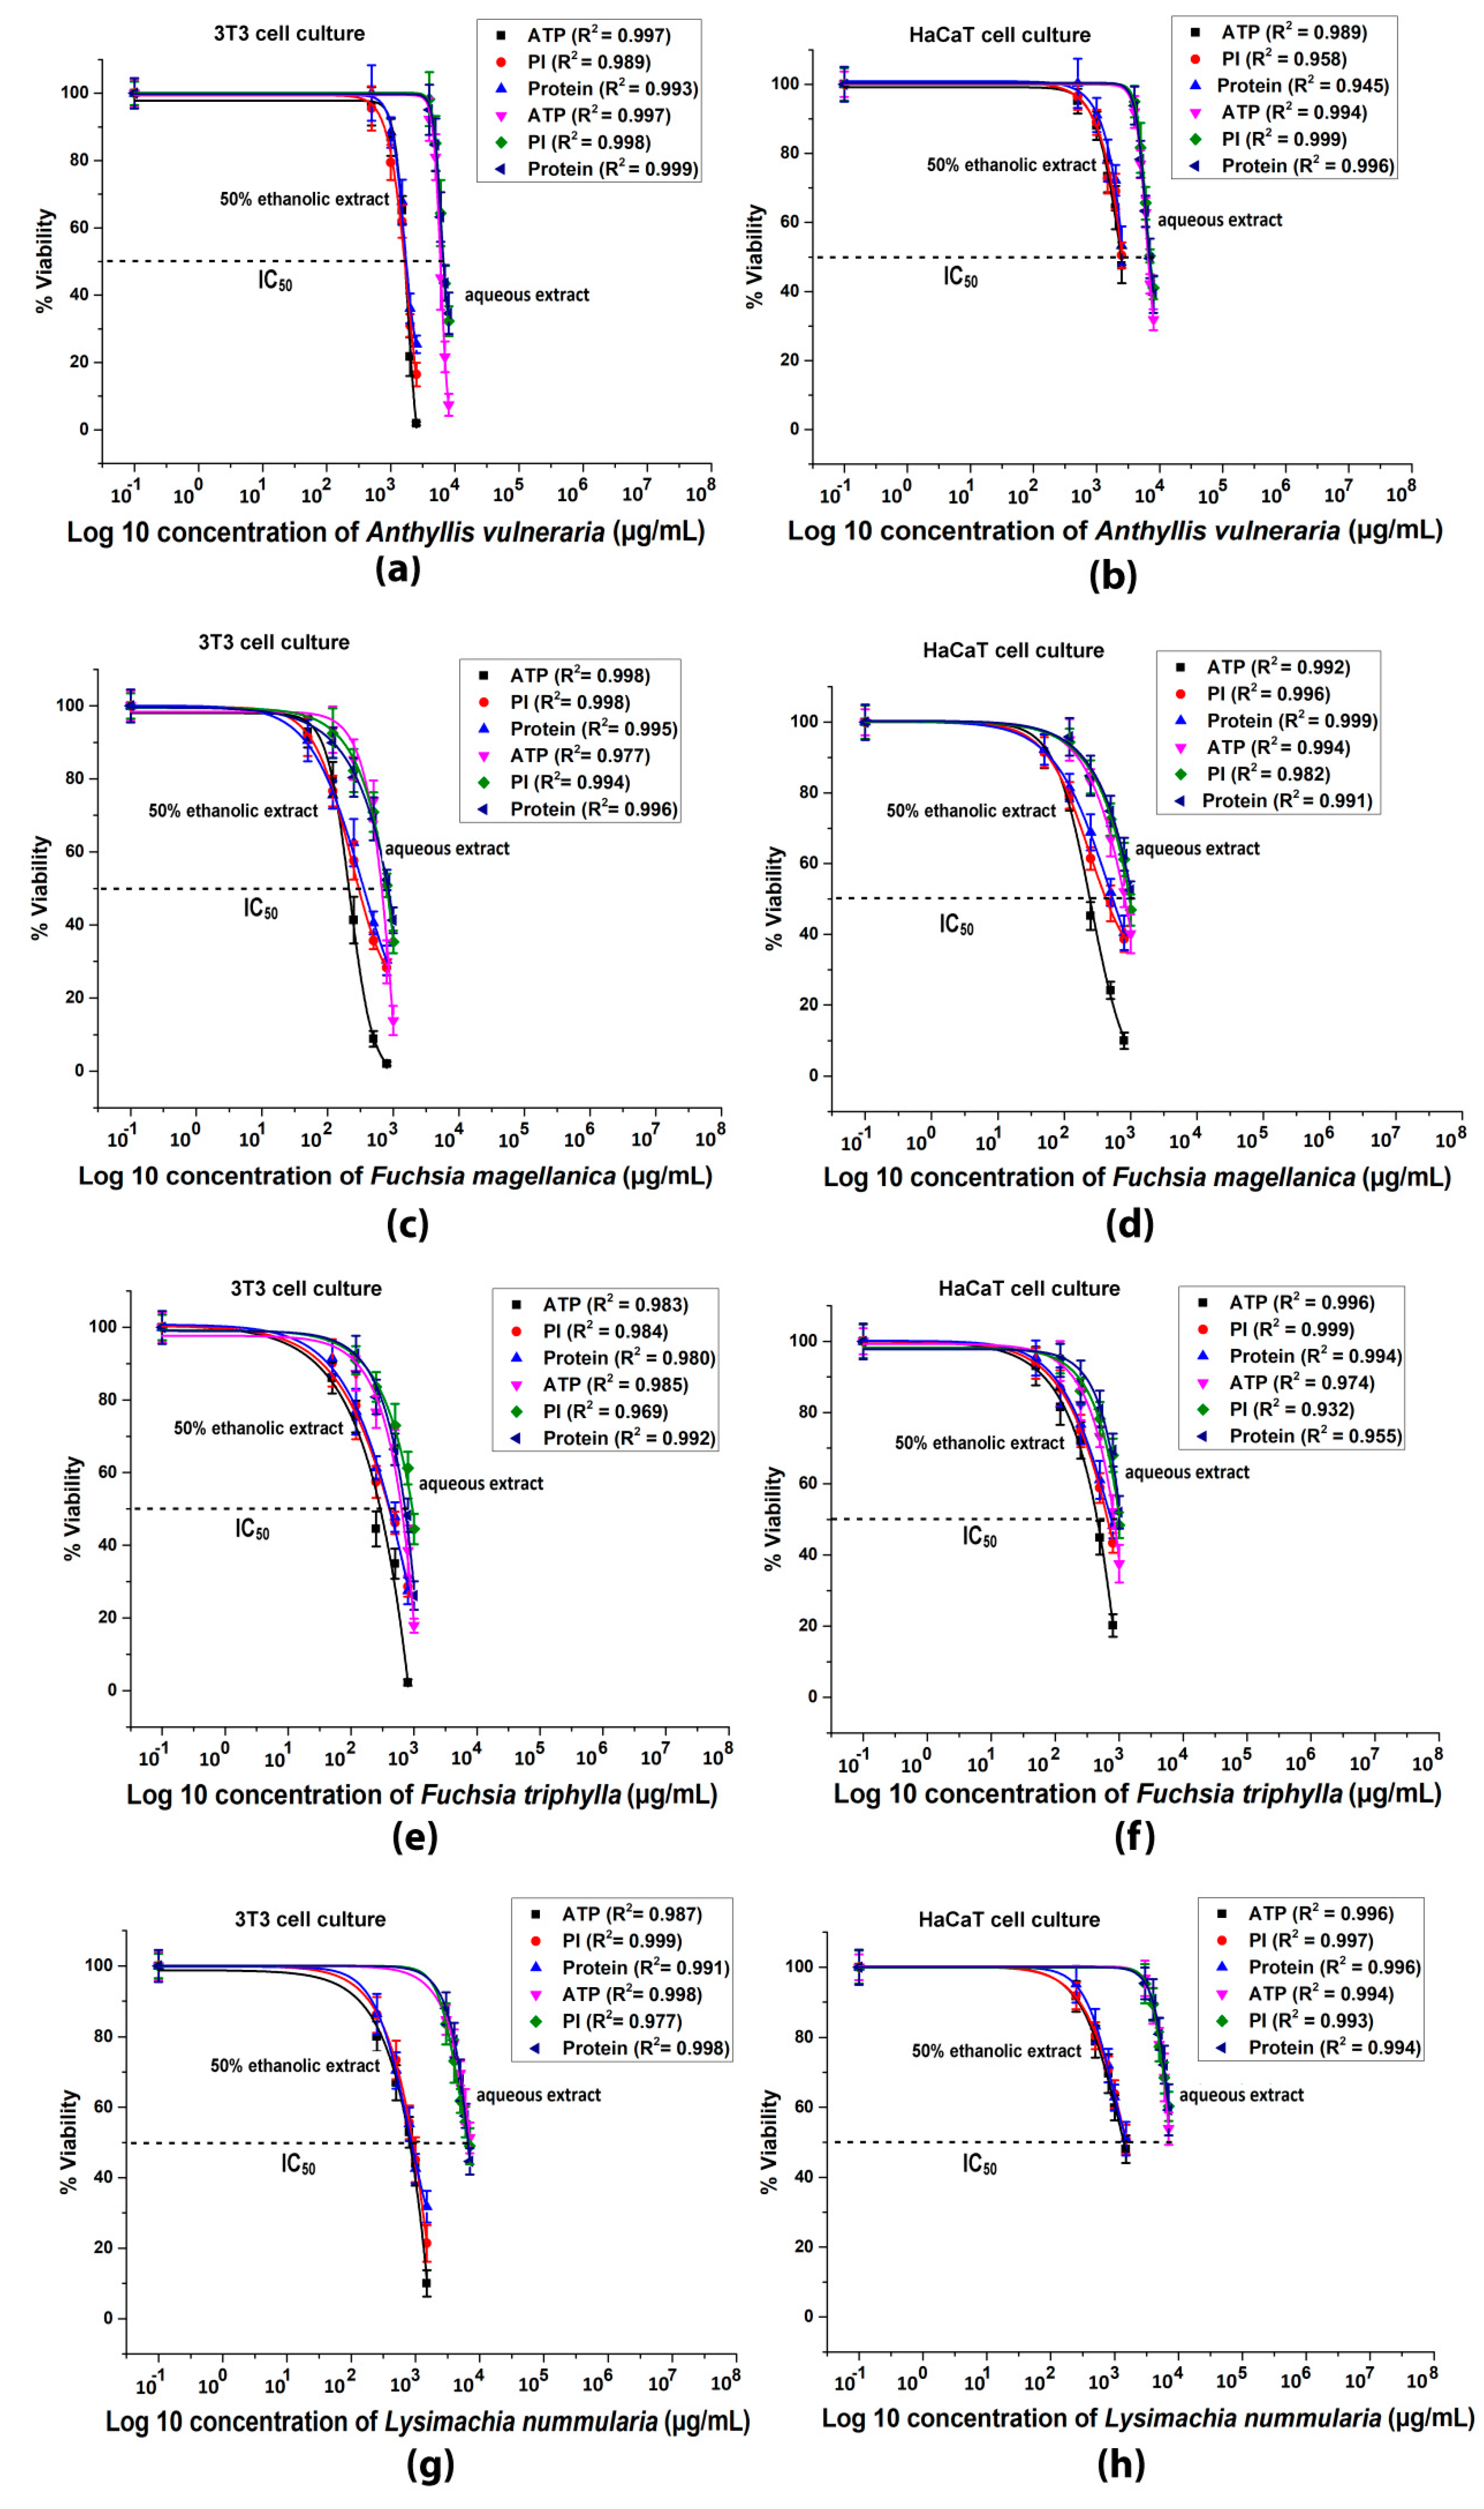
3.5. Plate Reader Cytotoxicity Tests

Cytotoxicity data obtained for fibroblast (3T3) and keratinocyte cell cultures (HaCaT) are seen in Figure 5. The ethanolic extracts reduced the ATP, cell number and protein contents of both cell lines in a dose dependent manner more effectively than the aqueous extracts. Nevertheless, these differences between the type of solvents were not observed in case of Fuchsia species. Both ethanolic and aqueous extracts of Fuchsias had the same toxic effects in the investigated cell lines. In 3T3 cells, the decrease of ATP, cell number and protein levels were more pronounced than in HaCaT cultures.
Evaluating the results of compound analyses, antimicrobial, antioxidant and cytotoxicity data we decided to use only the ethanolic extracts in the further experiments because of their richer ingredient content and stronger biological effects. Potentially sub-toxic concentrations of the ethanolic extracts (A. vulneraria in 50, 100, 200 µg/mL, F. magellanica and F. triphylla in 2.5, 5, 10 µg/mL and L. nummularia in 10, 25, 50 µg/mL concentrations) were used in all further investigations.

3.6. Flow Cytometric Cytotoxicity Test

Our apoptosis–necrosis results for the hypothesized nontoxic concentrations of ethanolic extracts are summarized for 3T3 cells in Table 4 and for HaCaT cells in Table 5. The two different cell lines gave similar results, namely the applied concentrations of the leaf extracts did not cause significant apoptosis/necrosis and most of the cells remained intact (the number of dead/dying cells was under 4% in both cell lines). An example of the gating strategy can be seen in the Supplementary Materials section (Figure S11).

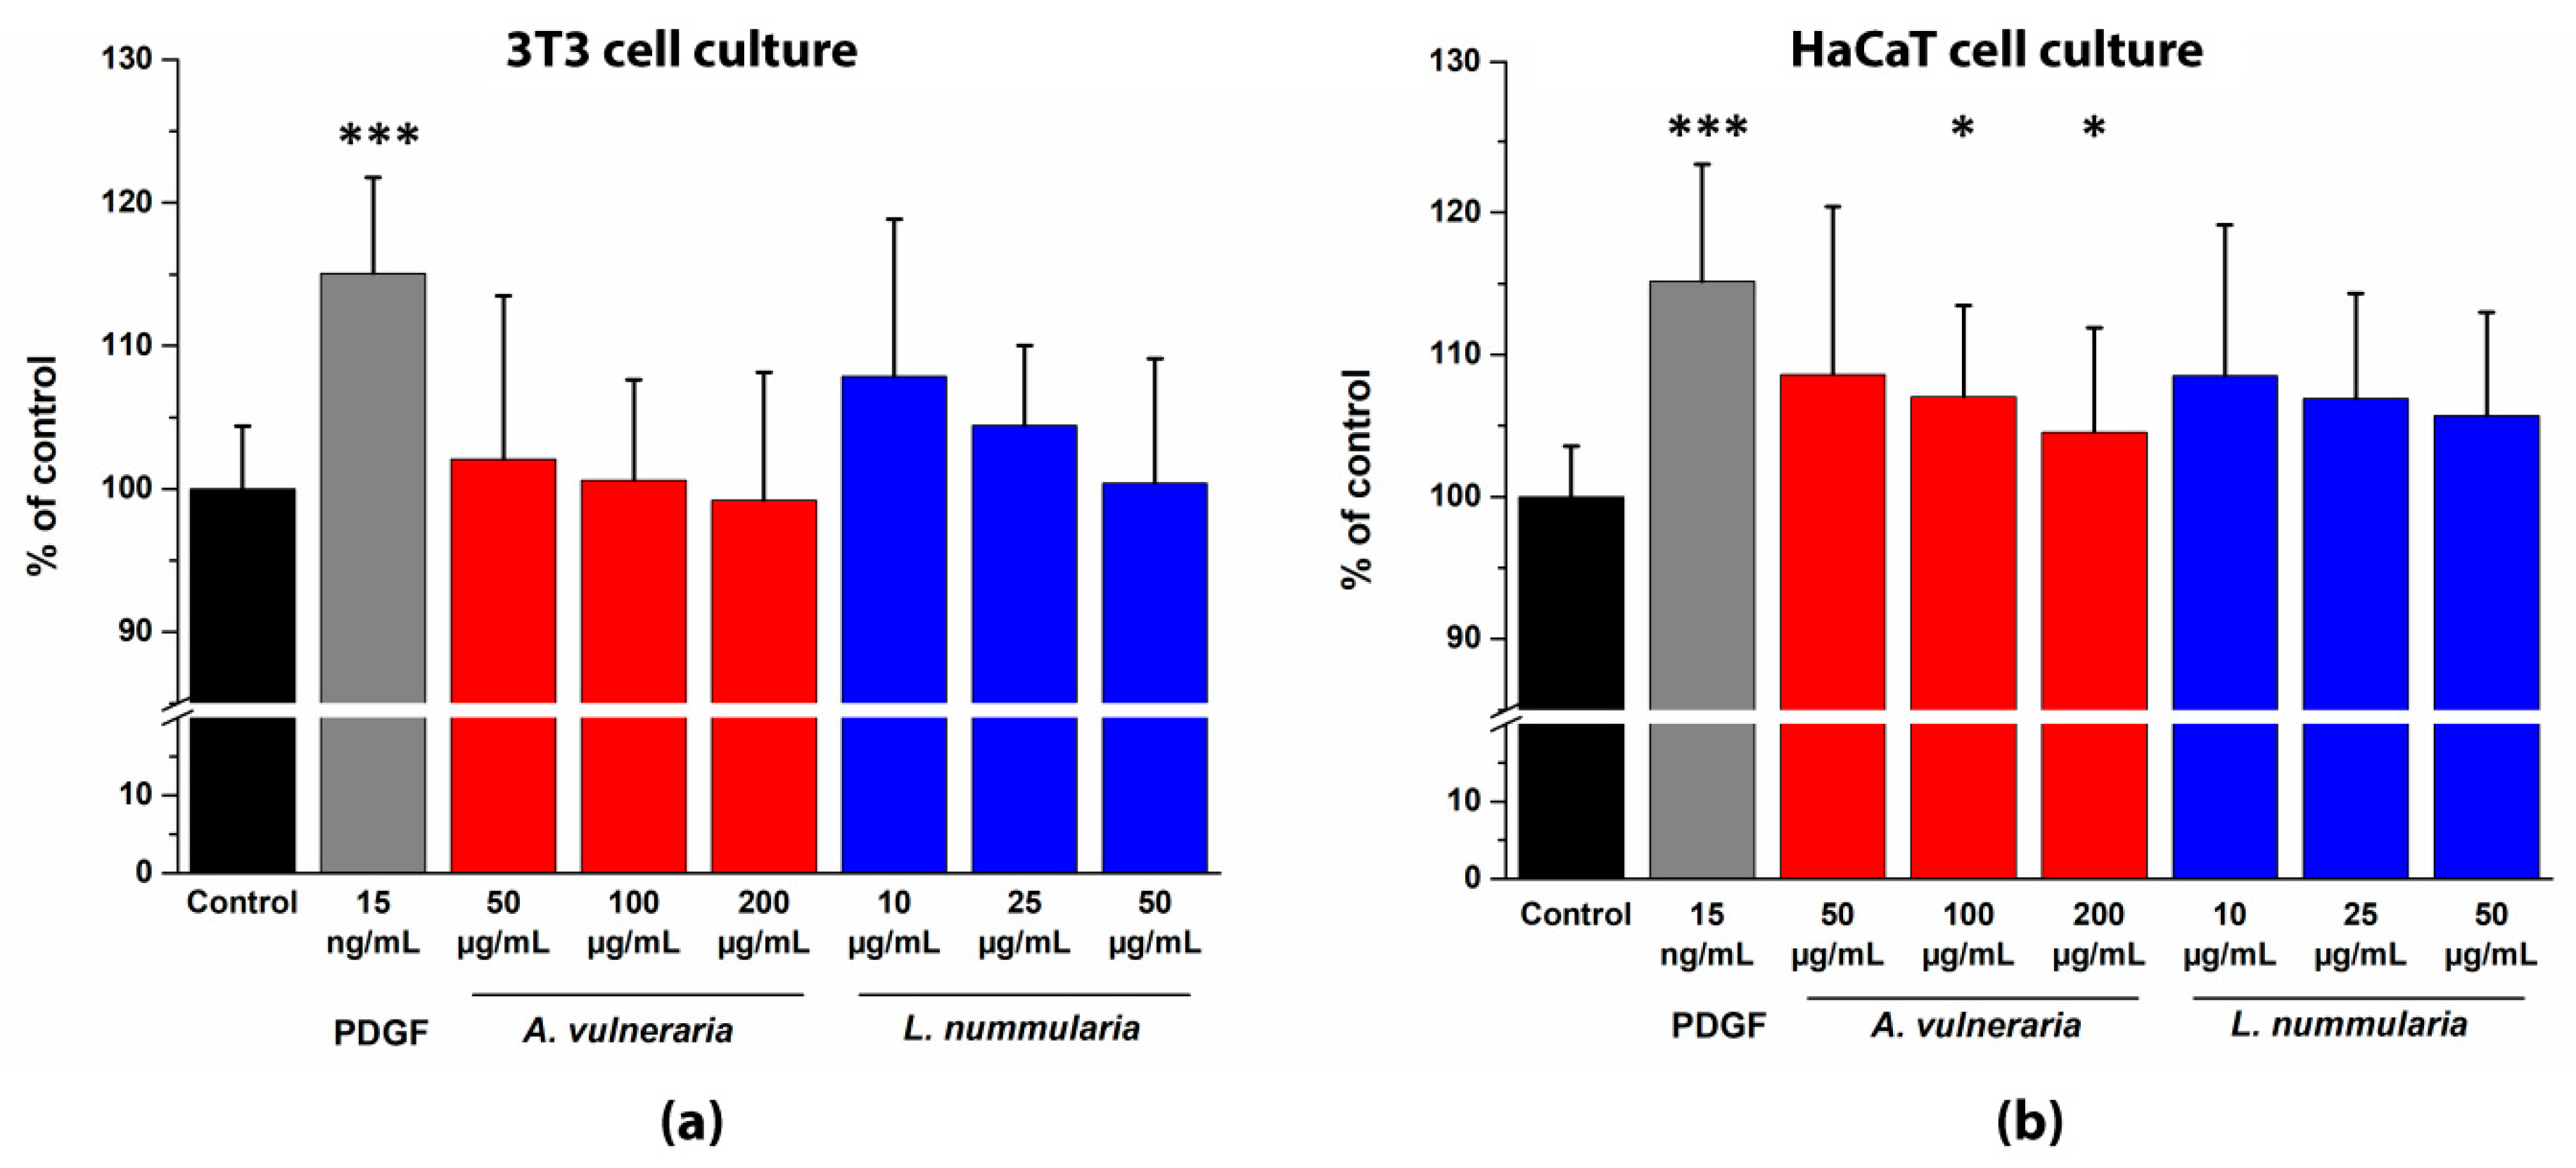
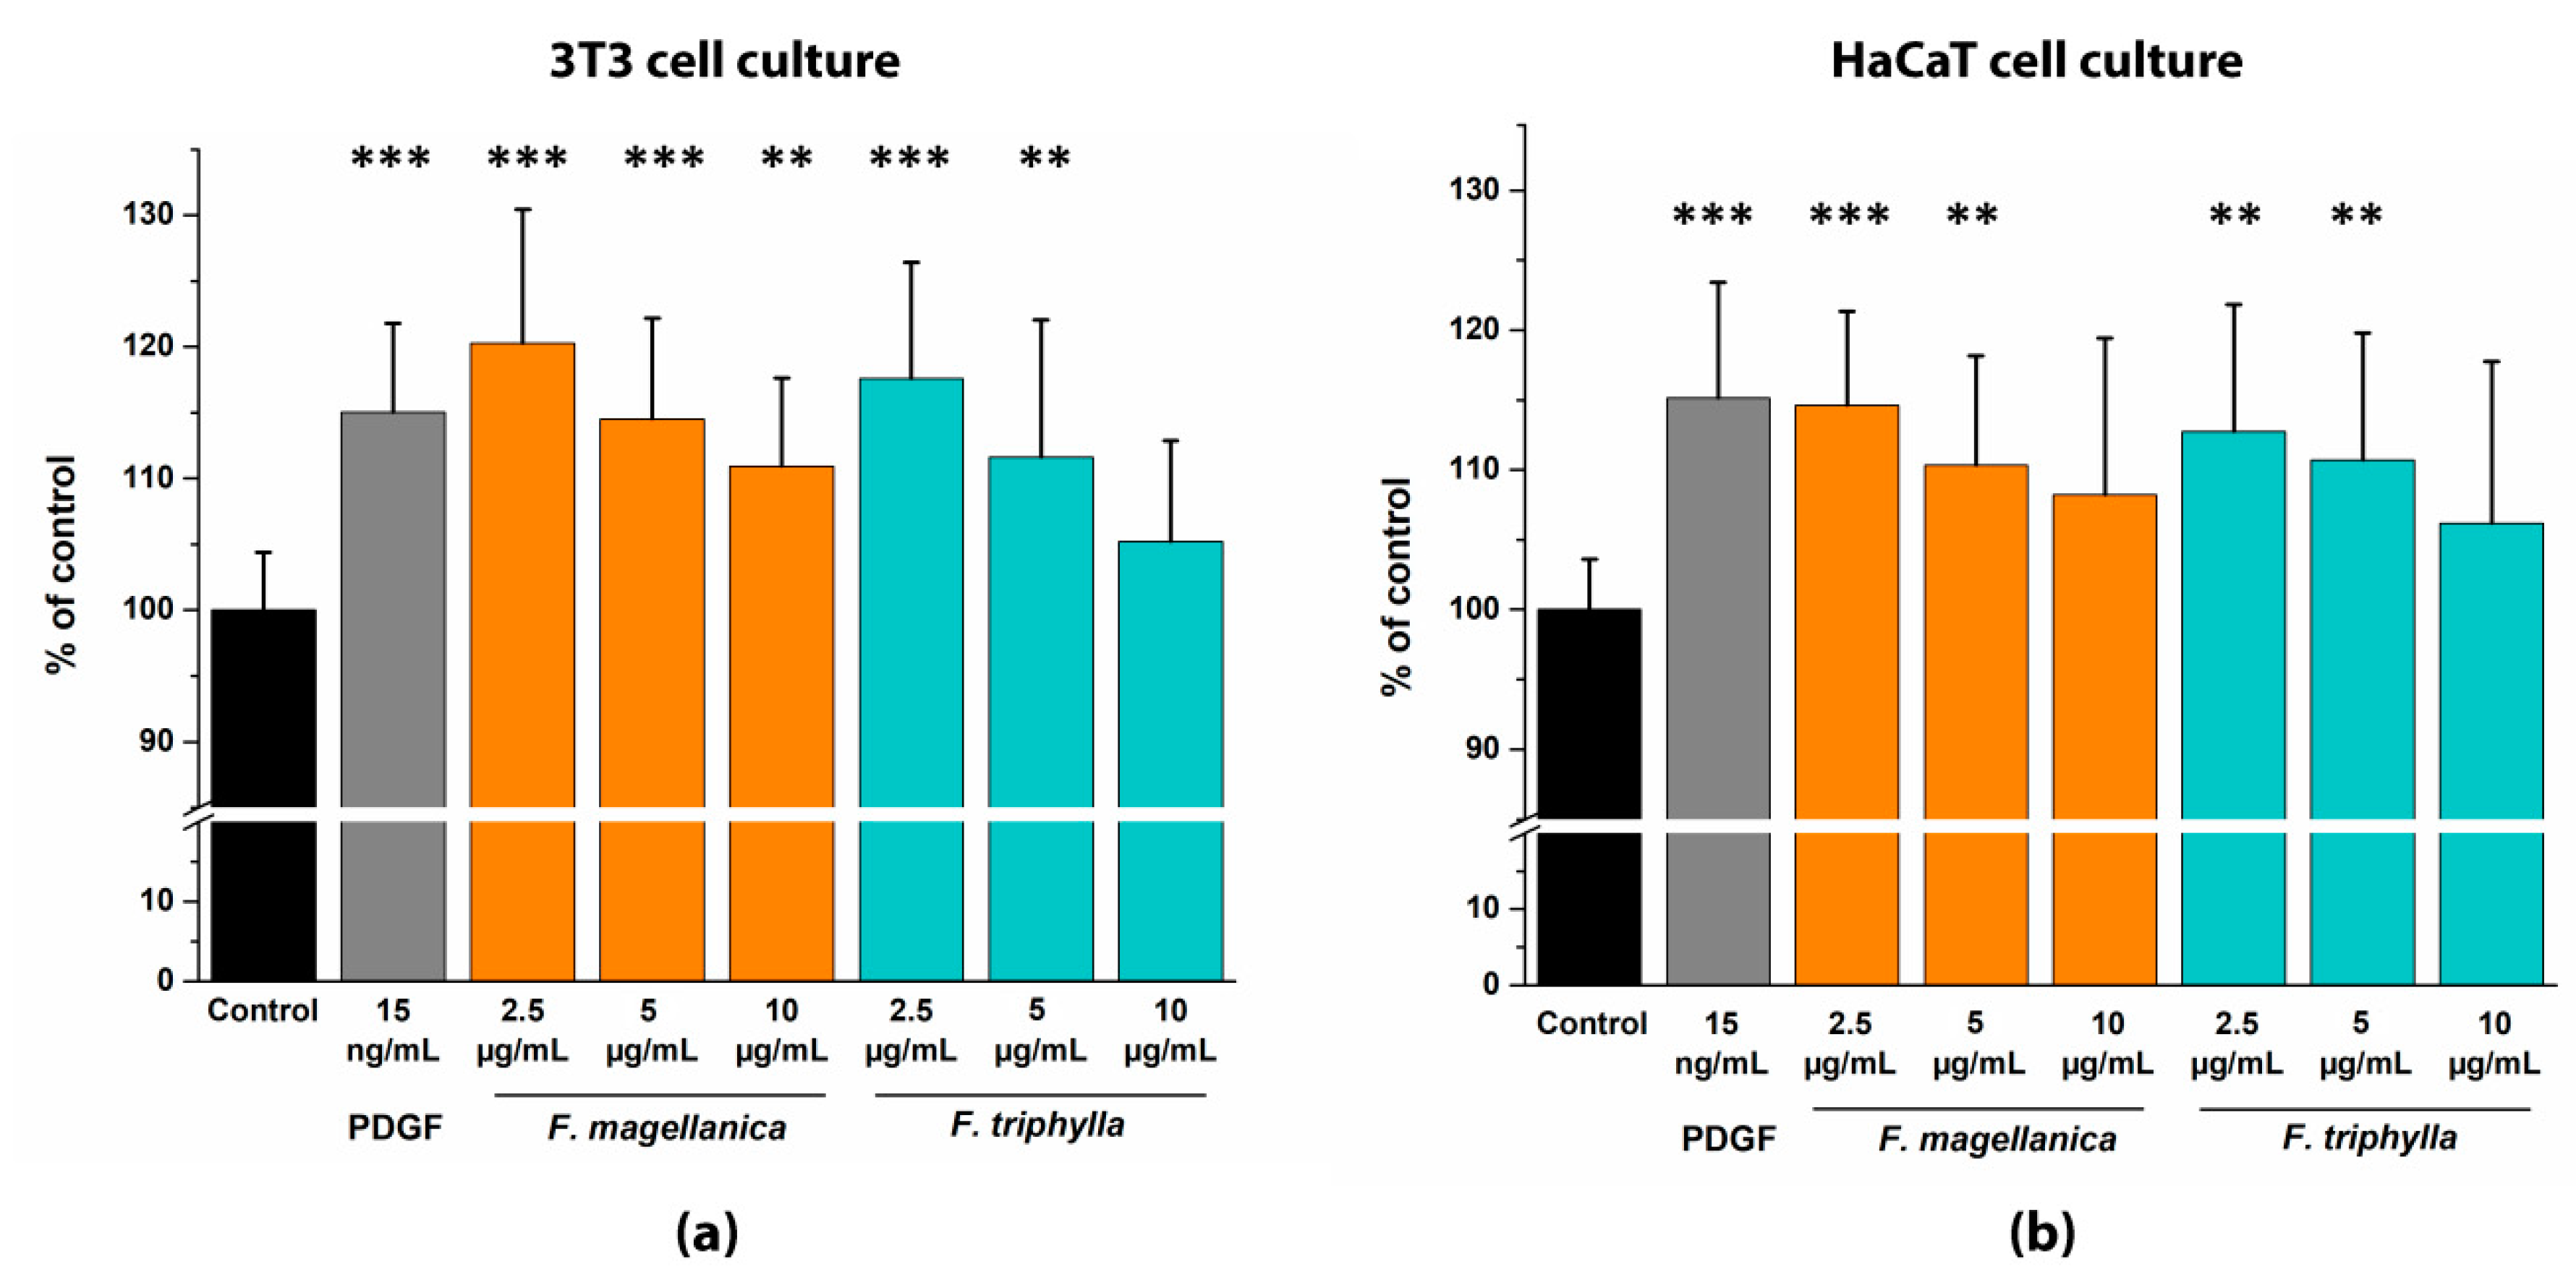
3.7. In vitro Migration Test

To investigate the impact of the ethanolic leaf extracts on the migration of fibroblasts and keratinocytes a standardized 500 µm cell-free area was created in 24-well culture plates by Teflon inserts. Figure 6 shows the effects of A. vulneraria and L. nummularia extracts while Figure 7 those of F. magellanica and F. triphylla on the migration of 3T3 and HaCaT cells.
The positive control PDGF-BB at 15 ng/mL concentration had a strong significant stimulating effect on cell migration (117.05 ± 6.72% on 3T3 and 115.16 ± 8.26% on HaCaT cells), compared with untreated control cells. Of the tested four plants, A. vulneraria expressed a slight stimulatory effect (107.01 ± 7.35% in 100 µg/mL concentration and 104.54 ± 8.86% in 200 µg/mL concentration) only on HaCaT cells, while enhanced migration and closure rate were observed in F. magellanica and F. triphylla treated cells when compared with untreated cells. Moreover, these extracts reached the response of the positive control, PDGF. Of the two Fuchsia species, F. magellanica had the strongest incentive effects on both cell lines, because the closure rate was 120.26 ± 10.17% on 3T3 cells and 114.61 ± 3.72% on HaCaT cells, respectively, in 2.5 µg/mL concentration. L. nummularia did not show any significant migration effect towards the two cell lines.
On the other hand, it is noteworthy that the less concentrated leaf extracts produced the most efficient stimulation on cell migration when compared with extracts of higher concentrations.

4. Discussion

Our investigated medicinal plants are used in Transylvanian folk medicine for the treatment of various skin diseases. Of the tested plants, we could not find scientific studies to evaluate their biological effects, especially on cell migration and proliferation. Although we have some preliminary results of antioxidant effects and phytochemical data of the extracts of Anthyllis vulneraria and Fuchsia species [58], to our best knowledge, the present study is the first to analyze the cytotoxicity and combined effects of the ethanolic extracts in a cellular migration model that mimics wound healing ability.
Bioactive agents of plants may have specific functions on wound healing properties, including antioxidant, antimicrobial, anti-inflammatory effects via migration, proliferation and pro-collagen stimulating actions and they can modulate one or more phases of the wound healing process. For instance, tannins and flavonoids have anti-inflammatory and antibiotic effects [59,60]. Flavonoids and phenolic acids are well-known antioxidant compounds, and the position and degree of hydroxylation are essential to their activity. In flavonoids, O-dihydroxy structure on the B ring, 2,3 double bond in conjugation with a 4-oxofunction on the C ring, the presence of a 3-hydroxyl group on C ring and C3- and C5-OH moieties in a combination with 4-oxofunction on the A and C rings are required for maximum radical scavenging potential [2,61]. In phenolic acids, the presence of a 3-hydroxyl structure (2,3-hydroxybenzoic acid, gallic acid, caffeic acid and caftaric acid) enhances the antioxidant effect [2,62]. Anthocyanins are strong antioxidant compounds and their scavenging activity corresponds with their structural characteristics as well, di-acylated forms possess higher antioxidant activity than the mono-acylated and non-acylated anthocyanins [63]. Sun et al. demonstrated that peonidin and cyanidin-based anthocyanins exert strong antioxidant properties. Furthermore, they verified, that acylated forms have high antibacterial effect [64]. On the other hand, anthocyanins from various berries have a strong anti-inflammatory effect via inhibition of IL-1β, Il-6 and COX-2 gene expression. Moreover, these colorful compounds stimulate the wound healing with increasing the migration of fibroblasts and keratinocytes [65,66].
We found that in A. vulneraria the most abundant amount of flavonol compounds are in glycosidic or methoxylated forms with lower activities than the aglycones [2]. In contrast, Fuchsia species contained, besides common flavonol compounds, various cinnamic acid and benzoic acid derivatives such as caffeic acid, ellagic acid and gallic acid derivatives, kaempferol– and quercetin–galloyl–glycosides. Moreover, the leaves of F. magellanica and F. triphylla contained several anthocyanins, such as cyanidin and peonidin derivatives. In the leaf extracts of L. nummularia, the main flavonoids were myricetin derivatives, which have strong antibacterial effects; however, in spite of this observation we detected weaker activities, compared to the standard antibiotic control and also to Fuchsia species [67]. The main differences between the investigated plants are that Fuchsia species contain high amounts of anthocyanins and hydroxybenzoic acids, which are well-known antioxidants and antimicrobial constituents; moreover, it has been proved, that they have a stimulating effect on cell migration [2,24,67].
Nevertheless, there are some contradictions in the literature regarding cell proliferation and migration effects of phenolic compounds, which act through different signaling pathways to express their effect in various cell lines. The polyphenols of tea suppress the migration of proliferation abilities of tumor cells by inhibiting NF-κB activation and quenching the expression of cyclin D1 [68]. The other compound carnosol inhibits the migration and tumor growth via ROS-dependent proteasome degradation of STAT3 in several breast cancer cell lines [69]. LaFoya et al. investigated that some flavonoids, including resveratrol, apigenin, chrysin, genistein, luteolin, and myricetin, significantly inhibited the endothelial cell migration and proliferation in a statistically significant manner with the moderation of Notch signaling, while quercetin did not regulate these processes [70]. Several studies demonstrated that phenolic acids, such as caffeic acid, coumaric acid and ferulic acid, which belong to hydroxycinnamic acids, have anti-proliferative and apoptotic effects on tumor cells [71,72,73,74]. On the other hand, the caffeic acid phenethyl ester can stimulate wound re-epithelization and enhance the proliferation of keratinocytes [75]. Ly et al. have proved that chlorogenic acid has migration and invasion stimulating effects on trophoblasts through an adenosine monophosphate-activated protein (AMP) kinase-dependent pathway, while not affecting cell proliferation [76]. However, the hydroxybenzoic acids, such as ellagic acid and gallic acid, increase the proliferation and migration of keratinocytes and fibroblasts in a dose-dependent manner [77].
During the past decades, a wide variety of analytical methods has been developed for the measurement of the total antioxidant capacity [78]. Several studies found good linear correlation between the total phenolic and/or flavonoid content and antioxidant capacities of plants. In agreement with other researchers, we found correlations between the TEAC and DPPH assay as well as for ORAC and ECL methods [31,79,80,81]. On the other hand, these differences between antioxidant methods can be explained by their chemical backgrounds. The underlying mechanism of ECL and ORAC assays is the hydrogen atom transfer (HAT), while TEAC and DPPH tests are based on single electron transfer (SET) reaction [81]. The assessment of total antioxidant capacity by cell-free chemical assays cannot completely reflect the behavior of the complex plant samples in vivo. Therefore, it is important to evaluate the effectiveness of antioxidants in more biologically relevant conditions, such as testing of the compounds in cell-based antioxidant assays [82]. The two used fluorogenic reporter molecules are sensitive to peroxyl radicals with similar oxidative mechanisms, therefore, DHR and DCFH gave closely matching scavenging activities as was expected from literature data [57].
In wound healing assays it is important to differentiate between proliferation and migration because the cells are usually not synchronized. Therefore, some authors use mitomycin C DNA synthesis inhibitor pretreatment to follow the migration solely when extended (48 h) incubation time is applied because it is longer than the generation cycle of the cells [83]. In our tests, we did not apply this compound because our incubation time was only 24 h, and the proliferation ability is minimal within this short period. HaCaT cell culture is an immortalized human keratinocyte cell line, with a doubling time of approximately 24 h (36.2 ± 1.5 h in the early passages (2–8) and 24 ± 0.6 h in the late passages (12–16) [84], while 3T3 mouse fibroblast cells have a doubling rate of 20–26 h [85].
In our migration tests, nontoxic doses of each extract were applied, where the fibroblast and keratinocyte cells showed more than 90% cell viability by the plate reader assay, and the necrotic (dead) cells were under 4% in the flow cytometric assay. 3T3 fibroblast cell culture was more vulnerable to exposure of the leaf extracts than HaCaT keratinocytes. One possible explanation of the increased sensitivity to potentially cytotoxic plant compounds might be that fibroblasts with the epidermal phenotype are located in the dermis, while keratinocytes are mostly found in the basement membrane zone (epidermis); therefore they should be more resistant against external noxae [86]. Our phytochemical and biological data suggest that Fuchsia species exerted the highest positive effect on cell migration among the four tested plants.
The found antimicrobial IC50 values of Fuchsia species were lower in the antibacterial assay than IC50 cytotoxicity values found for the fibroblasts and keratinocytes. Therefore, one may conclude that Fuchsia species extracts may possess effective components for the formulation of new antibacterial and wound healing stimulatory agents.
In our planned further experiments, another powerful approach for the characterization of the mode of action of the test compounds (i.e., polyphenols mediating the pathways of wound healing via modulation of various biomarkers such as growth factors, matrix metalloproteinases and cytokines) could be the measurement of secreted factors from the supernatant or the analysis of intracellular signaling pathways by Western blot and molecular biological methods. These studies are inevitably necessary for identifying the impact of complex plant extracts in wound healing processes [87,88].

Supplementary Materials

The following are available online at https://www.mdpi.com/2076-3921/9/2/166/s1. Figure S1: HPLC-DAD chromatogram of A. vulneraria 50% (v/v) ethanolic extract, detection wavelength: 280 nm. Numbering of peaks refers to data shown in Table 1. Figure S2: HPLC-DAD chromatogram of A. vulneraria aqueous extract, detection wavelength: 280 nm. Numbering of peaks refers to data shown in Table 1. Figure S3: HPLC-DAD chromatogram of F. magellanica 50% (v/v) ethanolic extract, detection wavelength: 280 nm. Numbering of peaks refers to data shown in Table 1 and Table 2. Figure S4: HPLC-DAD chromatogram of F. magellanica aqueous extract, detection wavelength: 280 nm. Numbering of peaks refers to data shown in Table 1 and Table 2. Figure S5: HPLC-DAD chromatogram of F. triphylla 50% (v/v) ethanolic extract, detection wavelength: 280 nm. Numbering of peaks refers to data shown in Table 1 and Table 2. Figure S6: HPLC-DAD chromatogram of F. triphylla aqueous extract, detection wavelength: 280 nm. Numbering of peaks refers to data shown in Table 1 and Table 2. Figure S7: HPLC-DAD chromatogram of L. nummularia 50% (v/v) ethanolic extract, detection wavelength: 280 nm. Numbering of peaks refers to data shown in Table 1. Figure S8: HPLC-DAD chromatogram of L. nummularia aqueous extract, detection wavelength: 280 nm. Numbering of peaks refers to data shown in Table 1. Figure S9: Dendrogram of the summarized compound analysis data of 50% (v/v) ethanolic plant extracts. Figure S10: Dendrogram of the summarized compound analysis data of aqueous plant extracts. Figure S11: Gating strategy of the flow cytometry experiments.

Author Contributions

R.C., T.K. and V.T. conceived the study and wrote the paper. Á.A. and C.A.T. performed and evaluated the HPLC investigations. R.C. performed the antioxidant assays and analyzed the data. R.C and S.D. performed the antimicrobial tests. R.H. performed the statistical analyses. R.C. and V.T. carried out the cellular experiments including the migration assays. N.P. collected the samples, performed the identification of the species and description of the habitats. N.P. and T.K. provided financial resources. All authors have read and agreed to the published version of the manuscript.

Funding

This work was supported by a grant from the NKFIH (Hungarian Scientific Research Fund. K 127944); KA-2018-17 grant from University of Pécs, Medical School; EFOP 3.6.1-16-2016-00004 project (Comprehensive Development for Implementing Smart Specialization Strategies at the University of Pécs); and Higher Education Institutional Excellence Program of the Ministry for Innovation and Technology in Hungary, within the framework of the second thematic program of the University of Pécs (FIKP II.2.).

Acknowledgments

We would like to thank the Bioinformatics Research Group at Szentágothai Research Center for their help in the statistical analyses. We also express our gratitude to Noémi Miltner, who gave us invaluable contributions in order to get the keratinocyte cell line.

Conflicts of Interest

The authors declare no conflict of interest.

References

  1. Patay, E.B.; Sali, N.; Koszegi, T.; Csepregi, R.; Balazs, V.L.; Nemeth, T.S.; Nemeth, T.; Papp, N. Antioxidant potential, tannin and polyphenol contents of seed and pericarp of three Coffea species. Asian Pac. J. Trop. Med. 2016, 9, 366–371. [Google Scholar] [CrossRef] [PubMed] [Green Version]
  2. Csepregi, K.; Neugart, S.; Schreiner, M.; Hideg, E. Comparative Evaluation of Total Antioxidant Capacities of Plant Polyphenols. Molecules 2016, 21, 208. [Google Scholar] [CrossRef] [PubMed] [Green Version]
  3. Maqsood, S.; Benjakul, S. Comparative studies of four different phenolic compounds on in vitro antioxidative activity and the preventive effect on lipid oxidation of fish oil emulsion and fish mince. Food Chem. 2010, 119, 123–132. [Google Scholar] [CrossRef]
  4. Tutin, T.; Heywood, V.; Burges, N.; Moore, D.; Valentine, D.; Walters, S.; Webb, D. Flora Europaea, 2nd ed.; Cambridge University Press: Cambridge, UK, 2010. [Google Scholar]
  5. Szabó, L.G. Medicinal Plants; Schmidt und Co. Ltd. Melius Foundation: Baksa-Pecs, Hungary, 2005. (In Hungarian) [Google Scholar]
  6. Butura, V. Ethnobotanical Encyclopaedia of Romania; Editura Ştiinţifică şi Enciclopedică: Bucharest, Romania, 1979. (In Hungarian) [Google Scholar]
  7. Borza, A. Dictionary of Ethnobotany; Editura Academiei Republicii Socialiste Romania: Bucharest, Romania, 1968. (In Romanian) [Google Scholar]
  8. Makay, B. Handbook of Healing with Plants; Felső-Magyarországi Kiadó: Nyíregyháza, Hungary, 1994. (In Hungarian) [Google Scholar]
  9. Péntek, J.; Szabó, T.A. People and Plants. Ethnobotanical Knowledge of Rural People in Tara Călatei; Kriterion Publ. House: Bucharest, Romania, 1985. (In Hungarian) [Google Scholar]
  10. Gonnett, J.-F.; Jay, M. Les aglycones flavoniques d’Anthyllis vulneraria. Phytochemistry 1972, 11, 2313–2316. [Google Scholar] [CrossRef]
  11. Nartowska, J.; Wawer, I.; Strzelecka, H. Triterpenoid sapogenin from Anthyllis vulneraria L. Acta Pol. Pharm. 2001, 58, 289–291. [Google Scholar]
  12. Ghalem, M.; Merghache, S.; Ghalem, S.; Belarbi, M. Phenolic contents and in vitro antioxidant activity of some secondary metabolites of Anthyllis vulneraria L. from Algeria. Int. J. Med. Pharm. Sci. 2012, 2, 51–64. [Google Scholar]
  13. Halász, P. Plants in the Everyday Life and Traditions of Moldovan Hungarians; General Press: Budapest, Hungary, 2010. (In Hungarian) [Google Scholar]
  14. Papp, N.; Horváth, D. Traditionns and Ethnomedicine in Crăciunel; Homoródkarácsonyfalvi Közbirtokosság: Homoródkarácsonyfalva, Romania, 2016. (In Hungarian) [Google Scholar]
  15. Rácz, G.; Füzi, J. Medicinal Plants in Covasna County; Directorate of Agriculture and Food Industry: Sepsiszentgyörgy, Romania, 1973. (In Hungarian) [Google Scholar]
  16. Gub, J. Ethnobotanical Data along the Nagy-Homoród. In Plants in the Folklore; Zsigmond, G., Ed.; Magyar Köztársaság Kulturális Intézete: Bucharest, Romania, 2005. (In Hungarian) [Google Scholar]
  17. Papp, N. Traditions and Ethnomedicine in Lueat; Lövétei Közbirtokossága és Polgármestei Hivatal: Lövéte, Romania, 2018. (In Hungarian) [Google Scholar]
  18. Toth, A.; Toth, G.; Kery, A. Polyphenol composition and antioxidant capacity of three Lysimachia species. Nat. Prod. Commun. 2014, 9, 1473–1478. [Google Scholar] [CrossRef] [Green Version]
  19. Podolak, I.; Koczurkiewicz, P.; Galanty, A.; Michalik, M. Cytotoxic triterpene saponins from the underground parts of six Lysimachia L. species. Biochem. Syst. Ecol. 2013, 47, 116–120. [Google Scholar] [CrossRef]
  20. Boris, G. Ethnobotanical Use of Medicinal Plants in Lueta. Bachelor’s Thesis, University of Pécs, Pécs, Hungary, 2010. (In Hungarian). [Google Scholar]
  21. Crowden, R.K.; Wright, J.; Harborne, J.B. Anthocyanins of Fuchsia (Onagraceae). Phytochemistry 1977, 16, 400–402. [Google Scholar] [CrossRef]
  22. Ruiz, A.; Hermosín-Gutiérrez, I.; Vergara, C.; Baer, D.; Zapata, M.; Hitschfeld, A.; Obando, L.; Mardones, C. Anthocyanin profiles in south Patagonian wild berries by HPLC-DAD-ESI-MS/MS. Food Res. Int. 2013, 51, 706–713. [Google Scholar] [CrossRef]
  23. Williams, C.A.; Garnock-Jones, P.J. Leaf flavonoids and other phenolic glycosides and the taxonomy and phylogeny of Fuchsia sect. skinnera (Onagraceae). Phytochemistry 1986, 25, 2547–2549. [Google Scholar] [CrossRef]
  24. Ghosh, P.K.; Gaba, A. Phyto-extracts in wound healing. J. Pharm. Pharm. Sci. Publ. Can. Soc. Pharm. Sci. Soc. Can. Sci. Pharm. 2013, 16, 760–820. [Google Scholar] [CrossRef] [PubMed]
  25. Adetutu, A.; Morgan, W.A.; Corcoran, O. Antibacterial, antioxidant and fibroblast growth stimulation activity of crude extracts of Bridelia ferruginea leaf, a wound-healing plant of Nigeria. J. Ethnopharmacol. 2011, 133, 116–119. [Google Scholar] [CrossRef] [PubMed]
  26. Süntar, I.; Akkol, E.K.; Nahar, L.; Sarker, S.D. Wound healing and antioxidant properties: Do they coexist in plants? Free Radic. Antioxid. 2012, 2, 1–7. [Google Scholar] [CrossRef] [Green Version]
  27. Behm, B.; Babilas, P.; Landthaler, M.; Schreml, S. Cytokines, chemokines and growth factors in wound healing. J. Eur. Acad. Dermatol. Venereol. JEADV 2012, 26, 812–820. [Google Scholar] [CrossRef]
  28. Csepregi, R.; Temesfoi, V.; Poor, M.; Faust, Z.; Koszegi, T. Green Fluorescent Protein-Based Viability Assay in a Multiparametric Configuration. Molecules 2018, 23, 1575. [Google Scholar] [CrossRef] [Green Version]
  29. Lee, J.H.; Cho, S.; Paik, H.D.; Choi, C.W.; Nam, K.T.; Hwang, S.G.; Kim, S.K. Investigation on antibacterial and antioxidant activities, phenolic and flavonoid contents of some thai edible plants as an alternative for antibiotics. Asian-Australas. J. Anim. 2014, 27, 1461–1468. [Google Scholar] [CrossRef] [Green Version]
  30. Das, S.; Gazdag, Z.; Szente, L.; Meggyes, M.; Horvath, G.; Lemli, B.; Kunsagi-Mate, S.; Kuzma, M.; Koszegi, T. Antioxidant and antimicrobial properties of randomly methylated beta cyclodextrin-captured essential oils. Food Chem. 2019, 278, 305–313. [Google Scholar] [CrossRef]
  31. Koszegi, T.; Sali, N.; Raknic, M.; Horvath-Szalai, Z.; Csepregi, R.; Koncic, M.Z.; Papp, N.; Poor, M. A novel luminol-based enhanced chemiluminescence antioxidant capacity microplate assay for use in different biological matrices. J. Pharmacol. Toxicol. Methods 2017, 88, 153–159. [Google Scholar] [CrossRef] [PubMed]
  32. Bertoncelj, J.; Doberšek, U.; Jamnik, M.; Golob, T. Evaluation of the phenolic content, antioxidant activity and colour of Slovenian honey. Food Chem. 2007, 105, 822–828. [Google Scholar] [CrossRef]
  33. Beretta, G.; Granata, P.; Ferrero, M.; Orioli, M.; Facino, R.M. Standardization of antioxidant properties of honey by a combination of spectrophotometric/fluorimetric assays and chemometrics. Anal. Chim. Acta 2005, 533, 185–191. [Google Scholar] [CrossRef]
  34. Re, R.; Pellegrini, N.; Proteggente, A.; Pannala, A.; Yang, M.; Rice-Evans, C. Antioxidant activity applying an improved ABTS radical cation decolorization assay. Free Radic. Biol. Med. 1999, 26, 1231–1237. [Google Scholar] [CrossRef]
  35. Stratil, P.; Klejdus, B.; Kuban, V. Determination of phenolic compounds and their antioxidant activity in fruits and cereals. Talanta 2007, 71, 1741–1751. [Google Scholar] [CrossRef] [PubMed]
  36. Wan, H.; Liu, D.; Yu, X.; Sun, H.; Li, Y. A Caco-2 cell-based quantitative antioxidant activity assay for antioxidants. Food Chem. 2015, 175, 601–608. [Google Scholar] [CrossRef]
  37. Balaiya, S.; Chalam, K.V. An In vitro Assay to Quantify Nitrosative Component of Oxidative Stress. J. Mol. Genet. Med. Int. J. Biomed. Res. 2014, 8. [Google Scholar] [CrossRef] [Green Version]
  38. Kalyanaraman, B.; Darley-Usmar, V.; Davies, K.J.; Dennery, P.A.; Forman, H.J.; Grisham, M.B.; Mann, G.E.; Moore, K.; Roberts, L.J., 2nd; Ischiropoulos, H. Measuring reactive oxygen and nitrogen species with fluorescent probes: Challenges and limitations. Free Radic. Biol. Med. 2012, 52, 1–6. [Google Scholar] [CrossRef] [Green Version]
  39. Clifford, M.N.; Johnston, K.L.; Knight, S.; Kuhnert, N. Hierarchical scheme for LC-MSn identification of chlorogenic acids. J. Agric. Food Chem. 2003, 51, 2900–2911. [Google Scholar] [CrossRef]
  40. Said, R.B.; Hamed, A.I.; Mahalel, U.A.; Al-Ayed, A.S.; Kowalczyk, M.; Moldoch, J.; Oleszek, W.; Stochmal, A. Tentative Characterization of Polyphenolic Compounds in the Male Flowers of Phoenix dactylifera by Liquid Chromatography Coupled with Mass Spectrometry and DFT. Int. J. Mol. Sci. 2017, 18, 512. [Google Scholar] [CrossRef]
  41. Alberti, A.; Beni, S.; Lacko, E.; Riba, P.; Al-Khrasani, M.; Kery, A. Characterization of phenolic compounds and antinociceptive activity of Sempervivum tectorum L. leaf juice. J. Pharm. Biomed. Anal. 2012, 70, 143–150. [Google Scholar] [CrossRef]
  42. Lorenz, P.; Conrad, J.; Bertrams, J.; Berger, M.; Duckstein, S.; Meyer, U.; Stintzing, F.C. Investigations into the Phenolic Constituents of Dog’s Mercury (Mercurialis perennis L.) by LC-MS/MS and GC-MS analyses. Phytochem. Anal. 2012, 23, 60–71. [Google Scholar] [CrossRef]
  43. Abad-García, B.; Berrueta, L.A.; Garmón-Lobato, S.; Gallo, B.; Vicente, F. A general analytical strategy for the characterization of phenolic compounds in fruit juices by high-performance liquid chromatography with diode-array detection coupled to electrospray ionization and triple quadrupole mass spectrometry. J. Chromatogr. A 2009, 1216, 5398–5415. [Google Scholar] [CrossRef] [PubMed]
  44. Rösch, D.; Krumbein, A.; Mügge, C.; Kroh, L.W. Structural Investigations of Flavonol Glycosides from Sea Buckthorn (Hippophae rhamnoides) Pomace by NMR Spectroscopy and HPLC-ESI-MS. J. Agric. Food Chem. 2004, 52, 4039–4046. [Google Scholar] [CrossRef] [PubMed]
  45. Simirgiotis, M.J.; Schmeda-Hirschmann, G. Direct identification of phenolic constituents in Boldo Folium (Peumus boldus Mol.) infusions by high-performance liquid chromatography with diode array detection and electrospray ionization tandem mass spectrometry. J. Chromatogr. A 2010, 1217, 443–449. [Google Scholar] [CrossRef]
  46. Kang, J.; Price, W.E.; Ashton, J.; Tapsell, L.C.; Johnson, S. Identification and characterization of phenolic compounds in hydromethanolic extracts of sorghum wholegrains by LC-ESI-MS. Food Chem. 2016, 211, 215–226. [Google Scholar] [CrossRef] [Green Version]
  47. Chen, Y.; Yu, H.; Wu, H.; Pan, Y.; Wang, K.; Jin, Y.; Zhang, C. Characterization and Quantification by LC-MS/MS of the Chemical Components of the Heating Products of the Flavonoids Extract in Pollen Typhae for Transformation Rule Exploration. Molecules 2015, 20, 18352–18366. [Google Scholar] [CrossRef] [PubMed] [Green Version]
  48. Tóth, A.; Riethmüller, E.; Alberti, Á.; Végh, K.; Kéry, Á. Comparative Phytochemical Screening of Phenoloids in Lysimachia Species. Eur. Chem. Bull. 2012, 1, 27–30. [Google Scholar]
  49. Lin, L.Z.; Harnly, J.M. Identification of the phenolic components of chrysanthemum flower (Chrysanthemum morifolium Ramat). Food Chem. 2010, 120, 319–326. [Google Scholar] [CrossRef]
  50. de Brito, E.S.; de Araujo, M.C.; Lin, L.Z.; Harnly, J. Determination of the flavonoid components of cashew apple (Anacardium occidentale) by LC-DAD-ESI/MS. Food Chem. 2007, 105, 1112–1118. [Google Scholar] [CrossRef] [Green Version]
  51. Kumar, S.; Singh, A.; Kumar, B. Identification and characterization of phenolics and terpenoids from ethanolic extracts of Phyllanthus species by HPLC-ESI-QTOF-MS/MS. J. Pharm. Anal. 2017, 7, 214–222. [Google Scholar] [CrossRef]
  52. Mena, P.; Cirlini, M.; Tassotti, M.; Herrlinger, K.A.; Dall’Asta, C.; Del Rio, D. Phytochemical Profiling of Flavonoids, Phenolic Acids, Terpenoids, and Volatile Fraction of a Rosemary (Rosmarinus officinalis L.) Extract. Molecules 2016, 21, 1576. [Google Scholar] [CrossRef]
  53. Bouaoudia-Madi, N.; Boulekbache-Makhlouf, L.; Madani, K.; Silva, A.M.S.; Dairi, S.; Oukhmanou-Bensidhoum, S.; Cardoso, S.M. Optimization of Ultrasound-Assisted Extraction of Polyphenols from Myrtus communis L. Pericarp. Antioxidants 2019, 8, 205. [Google Scholar] [CrossRef] [PubMed] [Green Version]
  54. Li, Y.; Wang, C.; Li, H.; Yu, T.; Tan, L. Simultaneous Determination of Formononetin, Calycosin and Rhamnocitrin from Astragalus Complanatus by UHPLC-MS-MS in Rat Plasma: Application to a Pharmacokinetic Study. J. Chromatogr. Sci. 2016, 54, 1605–1612. [Google Scholar] [CrossRef] [PubMed]
  55. Wu, X.; Prior, R.L. Identification and characterization of anthocyanins by high-performance liquid chromatography-electrospray ionization-tandem mass spectrometry in common foods in the United States: Vegetables, nuts, and grains. J. Agric. Food Chem. 2005, 53, 3101–3113. [Google Scholar] [CrossRef] [PubMed]
  56. Mazzuca, P.; Ferranti, P.; Picariello, G.; Chianese, L.; Addeo, F. Mass spectrometry in the study of anthocyanins and their derivatives: Differentiation of Vitis vinifera and hybrid grapes by liquid chromatography/electrospray ionization mass spectrometry and tandem mass spectrometry. J. Mass Spectrom. JMS 2005, 40, 83–90. [Google Scholar] [CrossRef] [PubMed]
  57. Pavelescu, L.A. On reactive oxygen species measurement in living systems. J. Med. Life 2015, 8, 38–42. [Google Scholar] [PubMed]
  58. Csepregi, R.; Bencsik, T.; Papp, N. Examination of secondary metabolites and antioxidant capacity of Anthyllis vulneraria, Fuchsia sp., Galium mollugo and Veronica beccabunga. Acta Biol. Hung. 2016, 67, 442–446. [Google Scholar] [CrossRef] [PubMed] [Green Version]
  59. Ibrahim, N.; Wong, S.K.; Mohamed, I.N.; Mohamed, N.; Chin, K.Y.; Ima-Nirwana, S.; Shuid, A.N. Wound Healing Properties of Selected Natural Products. Int. J. Environ. Res. Public Health 2018, 15, 2360. [Google Scholar] [CrossRef] [Green Version]
  60. Harborne, J.B. Phytochemical Methods; Fakenham Press Limited: New York, NY, USA, 1973. [Google Scholar] [CrossRef]
  61. Dai, J.; Mumper, J.J. Plant Phenolics: Extraction, Analysis and Their Antioxidant and Anticancer Properties. Molecules 2010, 15, 7313–7352. [Google Scholar] [CrossRef]
  62. Rahman, M.M.; Ichiyanagi, T.; Komiyama, T.; Hatano, Y.; Konishi, T. Superoxide radical- and peroxynitrite-scavenging activity of anthocyanins; structure-activity relationship and their synergism. Free Radic. Res. 2006, 40, 993–1002. [Google Scholar] [CrossRef]
  63. Ali, H.M.; Almagribi, W.; Al-Rashidi, M.N. Antiradical and reductant activities of anthocyanidins and anthocyanins, structure-activity relationship and synthesis. Food Chem. 2016, 194, 1275–1282. [Google Scholar] [CrossRef]
  64. Sun, X.H.; Zhou, T.T.; Wei, C.H.; Lan, W.Q.; Zhao, Y.; Pan, Y.J.; Wu, V.C.H. Antibacterial effect and mechanism of anthocyanin rich Chinese wild blueberry extract on various foodborne pathogens. Food Control 2018, 94, 155–161. [Google Scholar] [CrossRef]
  65. Van de Velde, F.; Esposito, D.; Grace, M.H.; Pirovani, M.E.; Lila, M.A. Anti-inflammatory and wound healing properties of polyphenolic extracts from strawberry and blackberry fruits. Food Res. Int. 2019, 121, 453–462. [Google Scholar] [CrossRef] [PubMed]
  66. Nizamutdinova, I.T.; Kim, Y.M.; Chung, J.I.; Shin, S.C.; Jeong, Y.K.; Seo, H.G.; Lee, J.H.; Chang, K.C.; Kim, H.J. Anthocyanins from black soybean seed coats stimulate wound healing in fibroblasts and keratinocytes and prevent inflammation in endothelial cells. Food Chem. Toxicol. Int. J. Publ. Br. Ind. Biol. Res. Assoc. 2009, 47, 2806–2812. [Google Scholar] [CrossRef] [PubMed]
  67. Xie, Y.; Chen, J.; Xiao, A.; Liu, L. Antibacterial Activity of Polyphenols: Structure-Activity Relationship and Influence of Hyperglycemic Condition. Molecules 2017, 22, 1913. [Google Scholar] [CrossRef] [PubMed] [Green Version]
  68. Singh, M.; Bhatnagar, P.; Mishra, S.; Kumar, P.; Shukla, Y.; Gupta, K.C. PLGA-encapsulated tea polyphenols enhance the chemotherapeutic efficacy of cisplatin against human cancer cells and mice bearing Ehrlich ascites carcinoma. Int. J. Nanomed. 2015, 10, 6789–6809. [Google Scholar] [CrossRef] [PubMed] [Green Version]
  69. Alsamri, H.; El Hasasna, H.; Al Dhaheri, Y.; Eid, A.H.; Attoub, S.; Iratni, R. Carnosol, a Natural Polyphenol, Inhibits Migration, Metastasis, and Tumor Growth of Breast Cancer via a ROS-Dependent Proteasome Degradation of STAT3. Front. Oncol. 2019, 9, 743. [Google Scholar] [CrossRef] [Green Version]
  70. LaFoya, B.; Munroe, J.A.; Albig, A.R. A comparison of resveratrol and other polyphenolic compounds on Notch activation and endothelial cell activity. PLoS ONE 2019, 14, e0210607. [Google Scholar] [CrossRef]
  71. Ye, J.C.; Hsiao, M.W.; Hsieh, C.H.; Wu, W.C.; Hung, Y.C.; Chang, W.C. Analysis of caffeic acid extraction from Ocimum gratissimum Linn. by high performance liquid chromatography and its effects on a cervical cancer cell line. J. Obstet. Gynecol. 2010, 49, 266–271. [Google Scholar] [CrossRef] [Green Version]
  72. Sanderson, J.T.; Clabault, H.; Patton, C.; Lassalle-Claux, G.; Jean-Francois, J.; Pare, A.F.; Hebert, M.J.; Surette, M.E.; Touaibia, M. Antiproliferative, antiandrogenic and cytotoxic effects of novel caffeic acid derivatives in LNCaP human androgen-dependent prostate cancer cells. Bioorg. Med. Chem. 2013, 21, 7182–7193. [Google Scholar] [CrossRef]
  73. Nasr Bouzaiene, N.; Kilani Jaziri, S.; Kovacic, H.; Chekir-Ghedira, L.; Ghedira, K.; Luis, J. The effects of caffeic, coumaric and ferulic acids on proliferation, superoxide production, adhesion and migration of human tumor cells in vitro. Eur. J. Pharmacol. 2015, 766, 99–105. [Google Scholar] [CrossRef]
  74. Kampa, M.; Alexaki, V.I.; Notas, G.; Nifli, A.P.; Nistikaki, A.; Hatzoglou, A.; Bakogeorgou, E.; Kouimtzoglou, E.; Blekas, G.; Boskou, D.; et al. Antiproliferative and apoptotic effects of selective phenolic acids on T47D human breast cancer cells: Potential mechanisms of action. Breast Cancer Res. BCR 2004, 6, R63–R74. [Google Scholar] [CrossRef] [PubMed] [Green Version]
  75. Brudzynski, K.; Carlone, R. Stage-dependent modulation of limb regeneration by caffeic acid phenethyl ester (CAPE)--immunocytochemical evidence of a CAPE-evoked delay in mesenchyme formation and limb regeneration. J. Exp. Zool. Part A Comp. Exp. Biol. 2004, 301, 389–400. [Google Scholar] [CrossRef] [PubMed]
  76. Ly, C.; Ferrier, J.; Gaudet, J.; Yockell-Lelievre, J.; Arnason, J.T.; Gruslin, A.; Bainbridge, S. Vaccinium angustifolium (lowbush blueberry) leaf extract increases extravillous trophoblast cell migration and invasion in vitro. Phytother. Res. PTR 2018, 32, 705–714. [Google Scholar] [CrossRef] [PubMed]
  77. Bueno, F.G.; Panizzon, G.P.; Mello, E.V.; Lechtenberg, M.; Petereit, F.; de Mello, J.C.; Hensel, A. Hydrolyzable tannins from hydroalcoholic extract from Poincianella pluviosa stem bark and its wound-healing properties: Phytochemical investigations and influence on in vitro cell physiology of human keratinocytes and dermal fibroblasts. Fitoterapia 2014, 99, 252–260. [Google Scholar] [CrossRef]
  78. Cornelli, U. Antioxidant use in nutraceuticals. Clin. Dermatol. 2009, 27, 175–194. [Google Scholar] [CrossRef]
  79. Han, J.H.; Lee, H.J.; Cho, M.R.; Chang, N.; Kim, Y.; Oh, S.Y.; Kang, M.H. Total antioxidant capacity of the Korean diet. Nutr. Res. Pract. 2014, 8, 183–191. [Google Scholar] [CrossRef] [Green Version]
  80. Milicevic, A. The relationship between antioxidant activity, first electrochemical oxidation potential, and spin population of flavonoid radicals. Arch. Ind. Hyg. Toxicol. 2019, 70, 134–139. [Google Scholar] [CrossRef] [Green Version]
  81. Apak, R.; Ozyurek, M.; Guclu, K.; Capanoglu, E. Antioxidant Activity/Capacity Measurement. 1. Classification, Physicochemical Principles, Mechanisms, and Electron Transfer (ET)-Based Assays. J. Agric. Food Chem. 2016, 64, 997–1027. [Google Scholar] [CrossRef]
  82. Wolfe, K.L.; Liu, R.H. Cellular antioxidant activity (CAA) assay for assessing antioxidants, foods, and dietary supplements. J. Agric. Food Chem. 2007, 55, 8896–8907. [Google Scholar] [CrossRef]
  83. Vang Mouritzen, M.; Jenssen, H. Optimized Scratch Assay for In Vitro Testing of Cell Migration with an Automated Optical Camera. J. Vis. Exp. JoVE 2018. [Google Scholar] [CrossRef] [Green Version]
  84. Scheitza, S.; Bonifas, J.; Blomeke, B. Variable NAT1 enzyme activity in long-term cultured human HaCaT keratinocytes. J. Toxicol. Environ. Health Part A 2012, 75, 471–477. [Google Scholar] [CrossRef]
  85. Brooks, R.F.; Riddle, P.N. The 3T3 cell cycle at low proliferation rates. J. Cell Sci. 1988, 90 Pt 4, 601–612. [Google Scholar]
  86. Werner, S.; Krieg, T.; Smola, H. Keratinocyte-fibroblast interactions in wound healing. J. Investig. Dermatol. 2007, 127, 998–1008. [Google Scholar] [CrossRef] [PubMed] [Green Version]
  87. Patel, S.; Maheshwari, A.; Chandra, A. Biomarkers for wound healing and their evaluation. J. Wound Care 2016, 25, 46–55. [Google Scholar] [CrossRef] [PubMed]
  88. Lindley, L.E.; Stojadinovic, O.; Pastar, I.; Tomic-Canic, M. Biology and Biomarkers for Wound Healing. Plast. Reconstr. Surg. 2016, 138, 18S–28S. [Google Scholar] [CrossRef] [PubMed]
Figure 1. Total antioxidant capacity (TAC) of four selected medicinal plants measured by different spectroscopic methods: (a) DPPH assay; (b) TEAC assay; (c) ORAC assay and (d) ECL assay. IC50 values (in μg/mL concentration at 50% inhibition) were calculated in case of DPPH and TEAC methods, while TE/g values (Trolox equivalent in µmol referred to 1 g of initial dry material) were determined in case of ORAC and ECL tests. Mean ± SD of 5 independent experiments, each in 3 replicates. The aqueous and ethanolic extracts were compared with t-probe (** p < 0.01, *** p < 0.001).
Antioxidants 09 00166 g001
Figure 2. PCA analysis of the investigated plant species’ total antioxidant capacity by four independent methods: (a) in the ethanolic extracts, (b) in the aqueous solutions, based on the antioxidant activities. % of total variance explained by each axis is provided within the figure. The symbols indicate 15 individual data for each plant extract.
Antioxidants 09 00166 g002
Figure 3. Intracellular antioxidant capacities of studied plant extracts with DCFH-DA staining (a) in 3T3 fibroblast cells and (b) in HaCaT keratinocyte cells. IC50 inhibitory concentrations were calculated from the equations obtained for the inhibitory capacities of the serial dilutions of the extracts. In the case of A. vulneraria the DCFH-DA scavenging activity data (when not shown) were at around/below the detection limit. Mean ± SD of five independent experiments, n = 5 × 4 replicates for each concentration. The aqueous and ethanolic extracts were compared with t-probe (** p < 0.01, *** p < 0.001).
Antioxidants 09 00166 g003
Figure 4. Intracellular antioxidant capacities of studied plant extracts with DHR123 (a) on 3T3 fibroblast cells and (b) on HaCaT cell culture. 50% inhibitory concentrations were calculated from the equations obtained for the inhibitory capacities of the serial dilutions of the extracts. Mean ± SD of 5 independent experiments, n = 5 × 4 replicates for each concentration. The aqueous and ethanolic extracts were compared with t-probe (** p < 0.01, *** p < 0.001).
Antioxidants 09 00166 g004
Figure 5. Intracellular ATP content, cell number (PI) and total protein levels of 3T3 and HaCaT cells with dose-response fitting: (a,b) cytotoxic effects of A. vulnearia on 3T3 and HaCaT cells; (c, d) cytotoxic effects of F. magellanica on 3T3 and HaCaT cells; (e,f) cytotoxic effects of F. triphylla on 3T3 and HaCaT cells; (g,h) cytotoxic effects of L. nummularia on 3T3 and HaCaT cells. Data are expressed in % of the control. Mean ± SD of 5 independent experiments, n = 5 × 8 replicates for each concentration. Dose-response curves were created by log10 transformation and nonlinear curve fitting. Correlation coefficients (R2) were calculated for each treatment.
Antioxidants 09 00166 g005
Figure 6. Comparative analysis by time-lapse imaging of wound closure ability of PDGF-BB and leaf extracts. (a) 50% (v/v) ethanolic extracts of A. vulneraria and L. nummularia on 3T3 monolayer cultures; (b) 50% (v/v) ethanolic extracts of A. vulneraria and L. nummularia on HaCaT monolayer cultures. Cells were monitored for 24 h in the absence and in the presence of plant extracts or PDGF with phase contrast microscopy. The bar graphs of AUC were calculated from cumulative closure rates (CR %) studied at every 4 h with three different concentrations from each plant. Mean ± SD of three independent experiments. n = 3 × 3 replicates. One-way Anova test (* p < 0.05, *** p < 0.001 compared with control).
Antioxidants 09 00166 g006
Figure 7. Comparative analysis by time-lapse imaging of wound closure ability of PDGF-BB and plant extracts on HaCaT monolayer. (a) 50% (v/v) ethanolic extracts of F. magellanica and F. triphylla on 3T3 monolayer cells; (b) 50% (v/v) ethanolic extracts of F. magellanica and F. triphylla on HaCaT monolayer cultures. Cells were monitored for 24 h in the absence and in the presence of plant extracts or PDGF with phase contrast microscopy. The bar graphs of AUC were calculated from cumulative closure rates (CR %) studied at every 4 h with three different concentrations from each plant. Mean ± SD of three independent experiments. n = 3 × 3 replicates. One-way Anova test (** p < 0.01, *** p < 0.001 compared with control).
Antioxidants 09 00166 g007
Table 1. LC-MS/MS data and tentative characterization of compounds from Anthyllis vulneraria, Fuchsia magellanica, Fuchsia triphylla and Lysimachia nummularia leaf extracts.
No.tR (min)λmax (nm)[M−H] (m/z)Fragment ions (m/z)Tentative Characterization aPresence and Relative Abundance (%) of Compounds in the Leaf Extracts bRef.
AvEcAvWcFmEcFmWcFt EcFtWcLnEcLnWc
12.0315343179, 135Caffeic acid derivative0.1 [39]
22.2306533, 375,217, 173, 149Cinnamoylquinic acid derivative 0.3 [39]
32.5315341 (683)179, 149, 135Caffeoyl-O-hexoside (dimer)0.2 0.3 0.2[40]
42.6265, 312337267, 191, 163, 149, 1355-p-Coumaroylquinic acid 0.20.10.1 [39]
53.2288sh, 311639, 353191Caffeoylquinic acid derivative0.30.9 [39]
67.1272331169, 125Galloyl hexoside 0.2 0.2[41]
79.5311355191Coumaroyl glucarate isomer 0.1 2.9[42]
810.1298sh, 320371209, 191, 179Caffeoylquinic acid derivative 0.5 [39]
910.5260611305n.i. 2.01.8-
1010.5298, 310355209, 191, 163Coumaroyl glucarate isomer 0.5 1.3[42]
1110.6298, 320549387, 369, 267, 249, 137Cinnamic acid derivative 0.3 [43]
1210.6298331169, 125Galloyl hexoside 2.6[41]
1310.9300301168, 150, 125Galloyl pentoside 0.2 [41]
1411.9282sh, 307355 (711)271, 209, 191Coumaroyl glucarate isomer (dimer) 3.4[42]
1512.6283sh, 312355271, 209, 191Coumaroyl glucarate isomer 1.9 5.06.9[42]
1613.0290, 328sh297, (595)179, 161, 135Caffeic acid derivative (dimer) 2.02.4 4.0 [39]
1713.0296575413, 351, 267, 249, 163, 113Coumaric acid derivative 0.5 [39]
1813.1310385209, 191Feruloyl glucarate 2.23.9[42]
1913.2255, 350787625, 462, 301, 299Quercetin 3-O-hexosyl-hexosyl-7-O-hexoside 1.0 [44]
2013.3283sh, 312385209, 191Feruloyl glucarate 0.7 3.010.2[42]
2113.5265, 349771609, 462, 301, 299, 285, 284, 283, 179Quercetin 3-O-hexosyl-desoxyhexosyl-7-O-hexoside 2.21.0 [44]
2213.8288sh, 312385271, 209, 191, 163, 146, 119Feruloyl glucarate 3.0 2.3[42]
2313.9265, 349771609, 446, 445, 285, 284, 283, 179Kaempferol 3-O-hexosyl-hexosyl-7-O-hexoside 2.60.9 [44]
2413.9276475, 453-n.i. 2.5 -
2514.4264, 351755593, 446, 284, 283Kaempferol 3-O-hexosyl-desoxyhexosyl-7-O-hexoside2.52.9 [45]
2615.0272651399, 325, 163n.i. 1.9 2.9 -
2715.2256, 354625463, 462, 301, 299Quercetin 3-O-hexosyl-7-O-hexoside 1.61.2 [45]
2815.7257, 352595462, 433, 301, 299, 271Quercetin 3-O-pentosyl-7-O-hexoside0.71.2 [41]
2915.8268305225, 147, 135n.i. 0.80.5 0.91.3-
3016.2265, 347609447, 446, 285, 283Kaempferol 3-O-hexosyl-7-O-hexoside 1.70.5 [41]
3116.4278449357, 275n.i. 1.50.9-
3216.5288sh, 321575443, 267, 249, 193, 1751,3-O-Diferuloylglycerol pentoside 0.7 [46]
3316.6254, 354639519, 477, 461, 315, 314, 313, 299, 151Isorhamnetin 3-O-hexosyl-7-O-hexoside4.61.4 [47]
3417.2268, 295sh693477, 345, 327, 315, 300, 207, 183, 165n.i. 1.8 -
3517.4252, 269sh, 332443267, 249, 193, 175, 149, 134, 1131,3-O-Diferuloylglycerol5.14.4 [46]
3617.5252, 269sh, 352963801, 625Flavonoid 0.6 [43]
3718.0260197 n.i. 3.2 -
3818.0268, 350639319, 301, 283, 239, 213, 203, 197, 157, 142, 130, 116, 109Flavonoid6.26.5 [43]
3918.1276521337, 191, 163Coumaroylquinic acid derivative 1.20.7[39]
4018.2266, 350625463, 300, 271, 255, 243, 179Quercetin 3-O-hexosyl-hexoside2.92.5 [47]
4119.2274387 (775)169, 151, 124 Gallic acid derivative (dimer) 0.40.2 [46]
4219.3274537271, 211, 169, 151, 124Gallic acid derivative 0.20.1 [46]
4319.3266, 357625479, 306Myricetin 3-O-desoxyhexosyl-hexoside 2.31.5[48]
4419.3266, 355609429, 285, 284, 255, 227Kaempferol 3-O-hexosyl-hexoside1.22.6 [41]
4519.4267, 357479316Myricetin 3-O-hexoside 1.10.8-
4619.5262, 355615463, 301, 300, 271, 169Quercetin galloyl hexoside 0.40.41.81.0 [47]
4719.6264, 352639459, 315, 314, 257Isorhamnetin 3-O-hexosyl-hexoside 1.9 [49]
4819.8266, 331593429, 284, 255, 227Kaempferol 3-O-desoxyhexosyl-hexoside 2.71.7 [41]
4920.2260, 354463317, 316Myricetin 3-O-desoxyhexoside 22.017.2[50]
5020.3255, 293sh, 359615301Quercetin galloyl hexoside 0.10.1 [47]
5120.5259, 356477301, 283, 255, 179, 151, 121Quercetin glucuronide 0.50.20.60.6 [47]
5220.6257, 268sh, 356433301, 300Quercetin 3-O-pentoside 0.10.1 [47]
5320.7257, 268sh, 356615301Quercetin galloyl hexoside 0.90.5 [51]
5420.7260, 353463317, 316Myricetin 3-O-desoxyhexoside 2.4 [50]
5520.8257, 355463301, 300, 271, 255, 243, 179, 163, 151Quercetin 3-O-hexoside 3.64.90.10.10.60.5 [41]
5620.9266, 350579463, 315, 313Isorhamnetin-3-O-pentosyl-7-O-pentoside5.03.8 [47]
5720.9257, 355609463, 301, 300, 299Quercetin 3-O-desoxyhexosyl-7-O-hexoside 0.10.10.20.50.81.8[48]
5821257, 355599447, 313, 285, 169Kaempferol galloyl hexoside 0.10.1 [43]
5921.3256, 356433300, 271, 255, 151Quercetin 3-O-pentoside2.42.00.20.10.40.4 [47]
6021.5254, 368301284, 245, 229, 201, 185, 145, 129, 117Ellagic acid 0.30.11.10.6 [51]
6121.7266, 350447284, 255, 227, 151Kaempferol 3-O-hexoside2.62.20.20.1 [41]
6221.7266, 350447301, 300, 271, 255, 179, 151Quercetin 3-O-desoxyhexoside 1.11.2 [47]
6321.8266, 332705437, 407, 325, 245, 231, 199, 163, 121n.i.2.41.8 -
6421.8266, 350521331, 271, 211, 169Galloyl hexoside derivative 0.50.3 [41]
6521.9 517267, 249, 205, 161, 113n.i.2.01.2 -
6622.0266, 347447284, 255, 227Kaempferol 3-O-hexoside 0.40.2 [41]
6722.0255, 350477315, 314, 285, 271, 257, 243Isorhamnetin 3-O-hexoside1.84.2 [52]
6822.0264, 340477331, 317Myricetin desoxyhexoside derivative 2.83.4[53]
6922.0264, 340447331, 317Myricetin derivative 2.51.0[53]
7022.3266, 340639477, 459, 315, 314, 267Isorhamnetin 3-O-hexosyl-hexoside1.12.6 [52]
7122.3266, 347417285, 284, 255, 227Kaempferol 3-O-pentoside 0.30.2 [41]
7222.4267, 328727551, 491, 415, 267, 249Ferulic acid derivative2.0 [54]
7322.4 623431, 371, 345, 317, 301, 299n.i. 0.80.5-
7422.5267, 328727551, 415, 267, 183Ferulic acid derivative 1.4 [54]
7522.8255, 266sh, 334447314, 285, 271, 257, 243Isorhamnetin 3-O-pentoside 1.3 [52]
7622.9266, 351599447, 301, 300, 179, 151Quercetin 3-O-desoxyhexoside derivative 0.10.1 [47]
7723.4266, 348623443, 299, 298, 283, 271Rhamnocitrin 3-O-dihexozid3.83.2 [54]
7823.7268, 339609315, 314, 193Isorhamnetin 3-O-pentosyl-hexoside0.61.5 [52]
7923.8268, 329799623, 485, 397, 299, 298n.i.2.10.7 -
8024.8 477301, 267, 249, 227, 209, 183, 165, 113Ellagic acid derivative 0.6 [51]
8124.9250, 370531301, 300Quercetin derivative 0.10.5 [47]
8224.9266, 344593413, 299, 298, 283Rhamnocitrin 3-O-hexosyl-pentoside1.10.7 [54]
a Compound numbers and retention times (tR) refer to UV chromatograms shown in Supplementary Materials (Figures S1–S8). b Relative abundance: area% of the compound calculated from the summarized areas of all compounds detected in the UV (280 nm) chromatogram. c Abbreviations: AvE: Anthyllis vulneraria 50% (v/v) ethanolic extract, AvW: Anthyllis vulneraria aqueous extract, FmE: Fuchsia magellanica 50% (v/v) ethanolic extract, FmW: Fuchsia magellanica aqueous extract, FtE: Fuchsia triphylla ethanolic extract, FtW: Fuchsia triphylla aqueous extract, LnE: Lysimachia nummularia 50% (v/v) ethanolic extract, LnW: Lysimachia nummularia aqueous extract, n.i.: not identified.
Table 2. LC-MS/MS data and tentative characterization of anthocyanins from Fuchsia magellanica and Fuchsia triphylla leaf extracts.
No.tR (min)[M + H]+ (m/z)Fragment Ions (m/z)Tentative Characterization aPresence and Relative Abundance (%) of Compounds in the Leaf Extracts bRef.
FmEcFmWcFtEcFtWc
I2.0767453, 153Anthocyanin (n.i.)1.1 -
II2.7611449, 287Cyanidin dihexoside3.018.3 [55,56]
III2.9783303Anthocyanin (n.i.) 5.9 -
IV9.1625463, 301Peonidin dihexoside15.7 [55,56]
V10.3625463, 301Peonidin dihexoside18.939.95.35.4[55,56]
VI10.7487325, 185Anthocyanidin hexoside 4.2 -
VII11.4441249Anthocyanin (n.i.) 9.6-
VIII11.8411249Anthocyanin (n.i.) 6.19.6-
a Compound numbers and retention times (tR) refer to UV chromatograms shown in Supplementary Materials (Figures S3–S6). b Relative abundance: area% of the compound calculated from the summarized areas of all compounds detected in the UV (280 nm) chromatogram. c Abbreviations: FmE: Fuchsia magellanica 50% (v/v) ethanolic extract, FmW: Fuchsia magellanica aqueous extract, FtE: Fuchsia triphylla 50% (v/v) ethanolic extract, FtW: Fuchsia triphylla aqueous extract.
Table 3. Minimum inhibitory concentration (MIC80) of selected medicinal plant extracts on E. coli, P. aeruginosa, S. aureus, B. subtilis and S. pyogenes.
MIC80 (µg/mL)
Test BacteriaTreatmentEthanolic Extracts Aqueous Extracts
Escherichia colierythromycin30.56–42.88
A. vulnerariaN.D.N.D.
F. magellanicaN.D.N.D.
F. triphyllaN.D.N.D.
L. nummulariaN.D.N.D.
Pseudomonas aeruginosaerythromycin69.91–82.76
A. vulnerariaN.D.N.D.
F. magellanica55.03–58.91N.D.
F. triphylla49.03–58.87N.D.
L. nummulariaN.D.N.D.
Staphylococcus aureuserythromycin0.09–0.25
A. vulneraria715.90–835.92N.D.
F. magellanica4.81–7.6517.13–25.03
F. triphylla5.32–6.7330.24–36.99
L. nummularia1063.75–1181.29N.D.
Bacillus subtiliserythromycin0.10–0.18
A. vulneraria288.02–313.01N.D.
F. magellanica13.91–15.7252.73–65.03
F. triphylla14.55–22.6633.16–45.33
L. nummularia160.90–164.28N.D.
Streptococcus pyogeneserythromycin0.08–0.09
A. vulneraria220.06–236.30N.D.
F. magellanica11.83–14.9941.72–44.91
F. triphylla11.61–17.9241.95–43.23
L. nummularia179.43–203.56N.D.
Five independent experiments, each in three replicates, compared with erythromycin as positive control. N.D.: not detected.
Table 4. Apoptosis-necrosis assay data of 3T3 cells treated with 50% (v/v) ethanolic extracts of A. vulneraria, F. magellanica, F. triphylla and L. nummularia with Annexin V-7AAD flow cytometric method.
3T3 Cells
Treatment GroupsAnnexin V–7AAD Method
Live Cells (%)Necrotic Cells (%)Early Apoptotic Cells (%)Late Apoptotic Cells (%)
Control cells97.132.060.660.15
50 µg/mL A. vulneraria96.292.461.000.25
100 µg/mL A. vulneraria96.002.900.830.27
200 µg/mL A. vulneraria96.892.220.700.20
2.5 µg/mL F. magellanica96.952.030.750.26
5 µg/mL F. magellanica96.272.670.790.27
10 µg/mL F. magellanica96.622.250.780.34
2.5 µg/mL F. triphylla97.741.260.840.17
5 µg/mL F. triphylla98.151.010.710.13
10 µg/mL F. triphylla97.571.500.620.30
10 µg/mL L. nummularia95.632.981.050.33
25 µg/mL L. nummularia95.333.311.070.29
50 µg/mL L. nummularia95.482.811.340.38
Table 5. Apoptosis–necrosis assay data of HaCaT cells treated with 50% (v/v) ethanolic extracts of A. vulneraria, F. magellanica, F. triphylla and L. nummularia with Annexin V–7AAD flow cytometric method.
HaCaT Cells
Treatment GroupsAnnexin V–7AAD Method
Live Cells (%)Necrotic Cells (%)Early Apoptotic Cells (%)Late Apoptotic Cells (%)
Control cells99.041.310.490.47
50 µg/mL A. vulneraria96.841.560.511.09
100 µg/mL A. vulneraria95.293.360.510.83
200 µg/mL A. vulneraria96.062.600.350.99
2.5 µg/mL F. magellanica97.761.390.470.37
5 µg/mL F. magellanica97.082.190.380.34
10 µg/mL F. magellanica97.561.610.540.28
2.5 µg/mL F. triphylla97.981.060.540.42
5 µg/mL F. triphylla97.681.330.540.45
10 µg/mL F. triphylla98.040.910.630.42
10 µg/mL L. nummularia97.191.700.420.69
25 µg/mL L. nummularia96.891.860.410.84
50 µg/mL L. nummularia96.152.490.440.91

