Abstract
Class III peroxidases are plant-specific enzymes that play indispensable roles in catalyzing oxidative–reductive reactions, which are integral to numerous biochemical processes in plants. In this study, we identified 69 members of the class III peroxidase (POD) gene family in the Populus simonii genome and classified them into four subfamilies based on phylogenetic analysis. Chromosomal localization revealed that these PsPOD genes are unevenly distributed across 19 chromosomes, with chromosomes 3 and 7 harboring the highest densities. Conserved domain and motif analyses demonstrated that all PsPOD proteins contain the characteristic peroxidase domain and share highly conserved motif structures. Cis-acting element analysis of promoter regions revealed the presence of numerous regulatory elements associated with light responsiveness, phytohormone signaling, stress responses, and plant growth and development. Transcriptome data showed that the expression of PsPOD genes varies significantly across different tissues and organs and under various stress conditions, suggesting their involvement in both developmental processes and abiotic stress responses. These findings were further validated by qRT-PCR analysis of selected PsPOD genes. Notably, PsPOD45, PsPOD69, PsPOD33, and PsPOD64 were identified as central hub genes in the protein–protein interaction network, making them promising candidates for further functional characterization. Overall, this study provides a comprehensive overview of the PsPOD gene family in P. simonii, laying a solid foundation for future functional studies and offering valuable insights for comparative research in other plant species.
1. Introduction
Populus simonii, a perennial deciduous tree in the Populus genus (family Salicaceae), is one of China’s most important native tree species. It plays a key role in the shelterbelt systems of northeastern and northwestern China, contributing significantly to windbreaks, sand fixation, slope stabilization, and soil-water conservation [1]. These ecological functions are especially valuable in arid and semi-arid regions, where P. simonii helps combat soil erosion and supports ecosystem rehabilitation [2]. In addition to its ecological utility, P. simonii exhibits strong drought resistance, cold tolerance, and high biomass productivity. It also demonstrates outstanding hybrid vigor and natural regeneration capacity, making it one of the earliest tree species in China to undergo artificial selection and genetic improvement [3]. Particularly during the afforestation campaigns of 1950–1969, it was regarded as a “pioneering species,” playing a crucial role in forestry ecological engineering and the regional economy of northern China [4]. Today, P. simonii remains foundational to artificial poplar plantations in desert and arid regions. With increasing global attention on stress adaptation and horticultural traits in poplars, P. simonii is increasingly recognized as a valuable genetic resource for breeding and improvement programs.
Peroxidase is a type of enzyme that is widely present in organisms, mainly catalyzing the redox reaction between hydrogen peroxide, which acts as an electron acceptor, and a variety of electron donors [5,6]. This process plays a crucial role in protecting cells from oxidative stress damage. When there is an imbalance in the oxidation–reduction state within cells, which could potentially harm the cells, the activity of peroxidase adjusts accordingly, maintaining the cell’s internal oxidation–reduction balance by decomposing peroxides [7]. This helps prevent oxidative damage such as lipid peroxidation, protein injury, and DNA damage, thereby maintaining the normal function of cells. Therefore, peroxidase plays an important role in preventing cell damage caused by oxidative stress [8]. Based on their protein sequences and structural features, peroxidases can be divided into non-heme peroxidases and heme peroxidases. The heme peroxidases are mainly divided into animal heme peroxidases and non-animal heme peroxidases [9]. According to their amino acid sequences and catalytic properties, non-animal heme peroxidases can be further subdivided into three categories: Class I peroxidases are intracellular, including yeast cytochrome c peroxidase, ascorbic acid peroxidase, and catalase-peroxidase sourced from bacteria; Class II peroxidases are extracellular, sourced from fungi, including various manganese peroxidases and lignin peroxidases produced by fungi [10,11]; Class III peroxidases are plant-specific redox enzymes, i.e., secretory peroxidases derived from higher plants that are involved in various physiological processes. Current research indicates that Class III peroxidases primarily serve two main functions in plants. On one hand, they are associated with normal morphogenesis and development, playing a crucial role in plant growth and developmental processes [12]. On the other hand, they contribute to plant stress resistance, including drought, cold, salt, and disease tolerance, making them a key component of the plant defense system [13]. However, there is an inconsistency in the naming conventions of Class III peroxidases, with abbreviations such as POX [14,15], POD [16,17], PRX [18], and GPX [19] being used interchangeably. In this paper, for the sake of brevity, we will refer to Class III peroxidase as POD.
Peroxidases (PODs) play crucial roles in diverse plant processes, including growth, development, stress responses, and lignin biosynthesis. Over the years, systematic studies on POD gene families have been conducted in many plant species, revealing their functions in maintaining plant homeostasis and coping with abiotic stress. For instance, in Populus trichocarpa, Betula platyphylla, and Arabidopsis thaliana, researchers have characterized POD gene families and elucidated their expression patterns in various tissues and under stress conditions [18,20,21]. Similarly, in crops such as maize, cassava, and fruits like lychee and Chinese pear, researchers have identified POD gene members and provided valuable insights into their roles in stress tolerance and secondary metabolism [22,23,24,25]. However, despite these advances, little is known about the POD gene family in P. simonii. Given the ecological and economic importance of P. simonii as a tree species with remarkable adaptability to arid and semi-arid environments, a comprehensive analysis of its POD gene family is warranted.
In this study, we conducted a comprehensive analysis of the class III peroxidase (POD) gene family in P. simonii. This analysis encompassed phylogenetic relationships, gene synteny, conserved functional domain characteristics, and the identification of cis-acting regulatory elements. Furthermore, we investigated the expression profiles of these POD genes across six distinct organs or tissues and their transcriptional responses to three abiotic stress conditions. To validate these findings, we randomly selected twelve POD genes for quantitative real-time PCR (qRT-PCR) analysis. This study aims to investigate the evolutionary expansion and adaptive characteristics of POD genes in P. simonii, providing insights into the molecular mechanisms underlying its ecological adaptability.
2. Materials and Methods
2.1. Plant Materials and Sample Collections
The experimental materials consisted of six-year-old clonal P. simonii trees cultivated under standardized conditions at the Tongliao Forestry and Grassland Science Research Institute, Inner Mongolia, China (44°01′05.300″ N, 121°59′03.300″ E). To ensure genetic uniformity, all specimens were vegetatively propagated from a single elite genotype selected for superior drought tolerance. During the active growth season (June 2022), samples were systematically collected from six distinct organs or tissues: apical buds (NT), axillary buds (NB), leaves (NL), one-year-old stems (NS), phloem (NP), and roots (NR). For each material type, three biological replicates were collected from separate individuals (n = 3). Immediately after excision, samples were flash-frozen in liquid nitrogen and stored at −80 °C until RNA extraction to preserve transcriptomic integrity [26]. Additionally, uniform one-year-old potted P. simonii plantlets were subjected to three abiotic stress treatments, including heat stress (plants were exposed to 42 °C for 6 h in a growth chamber), cold stress (plants were maintained at 4 °C for 6 h in a growth chamber), and salt stress (plants were irrigated with 200 mM NaCl solution for 6 h). For each stress treatment, mature leaves were collected at the end of the stress period, with three biological replicates harvested per condition. Samples were promptly flash-frozen in liquid nitrogen and stored at −80 °C for subsequent RNA extraction [27].
2.2. Identification of POD Genes in Populus simonii
To identify members of the POD gene family in the P. simonii genome, the complete protein sequences of POD from A. thaliana were retrieved from the TAIR database (https://www.arabidopsis.org/, accessed on 9 June 2024). Furthermore, a high-quality chromosome-level reference genome of P. simonii was assembled for subsequent analyses, achieving a contig N50 of 24 Mb and a BUSCO complete gene percentage of 98.9%. Subsequently, the PsPOD protein sequences were identified by performing a BlastP search against the P. simonii genome data file using TBtools (version 2.145) [28]. Candidate sequences obtained from this analysis were further validated for the presence of conserved POD protein domains using the Conserved Domain Database (CDD) of NCBI (https://www.ncbi.nlm.nih.gov/Structure/bwrpsb/bwrpsb.cgi, accessed on 10 June 2024) and Pfam (http://pfam-legacy.xfam.org/, accessed on 10 June 2024). The integrity of these domains was confirmed, resulting in the identification of candidate PsPOD genes. Furthermore, the physicochemical properties of each PsPOD protein, including amino acid length, isoelectric point, molecular weight, and instability index, were analyzed using TBtools software [29]. To investigate the subcellular localization characteristics of POD gene family members, this study employed the Wolf PSORT online tool (https://wolfpsort.hgc.jp/, accessed on 30 April 2025) for predictive analysis.
2.3. Phylogenetic Analyses of POD Genes in P. simonii
The Muscle algorithm within the MEGA (11.0.13) software package was employed to carry out multiple sequence alignments of the POD proteins from A. thaliana and P. simonii [30]. Subsequently, a phylogenetic tree depicting the relationships among POD proteins was constructed utilizing the Neighbor-Joining method. This tree was validated through Bootstrap analysis with 1000 replicates, while other parameters were maintained at their default settings. The online platform Interactive Tree of Life (iTOL) (https://itol.embl.de/, accessed on 23 June 2024) was subsequently utilized to refine and annotate the phylogenetic tree of the PsPOD family.
2.4. Gene Structure and Conserved Motif of the PsPOD Genes
The visualization of gene structures was performed using the “Gene Structure View” module in TBtools (version 2.145), which enabled the depiction of exon–intron organization for the PsPOD genes. This process utilized genomic annotation data (GFF format) in combination with gene ID information. To investigate conserved motif distributions in the PsPOD-encoded proteins, the online tool Multiple Em for Motif Elicitation (MEME, version 5.5.3; https://meme-suite.org/meme/tools/meme, accessed on 3 July 2024) was employed. The MEME analysis was conducted using the following parameters: the number of motifs was limited to 10, and the maximum motif width was set to 50 amino acids. All gene structure and motif pattern visualizations were generated using TBtools (version 2.145).
2.5. Analysis of the Cis-Acting Elements for the Promoters of the PsPOD Genes
The promoter sequences of the PsPOD genes were extracted from the P. simonii genome, comprising 2000 base pairs upstream of the translational start codon (ATG). The prediction of cis-acting regulatory elements within these promoter regions was performed using the PlantCARE database (https://bioinformatics.psb.ugent.be/webtools/plantcare/html/, accessed on 18 July 2024) [31]. Visualization of the identified cis-elements and their positional distribution within the promoter regions was carried out using TBtools (version 2.145).
2.6. Chromosomal Localization and Synteny Analysis of PsPOD Genes
The chromosomal distribution of the PsPOD genes was determined using TBtools (version 2.145), which enabled accurate identification of their positions on the P. simonii chromosomes. Based on their physical locations, the PsPOD genes were systematically renamed from PsPOD1 to PsPOD69. For comparative genomic analysis, two model plant species, A. thaliana and P. trichocarpa, were selected to conduct collinearity analysis. This analysis, along with the corresponding visualizations, was performed using the “One-step MCScanX” function in TBtools (version 2.145).
2.7. Expression Analysis and Interaction Network Construction of PsPOD Genes
Total RNA was extracted from various organs and tissues subjected to different treatments using the Plant Total RNA Extraction Kit (Biotopped, Beijing, China), following the manufacturer’s instructions. The concentration and integrity of RNA samples were assessed using the Agilent 2100 Bioanalyzer (Santa Clara, CA, USA). High-quality RNA was then used for cDNA library construction and sequencing, which was carried out on the Illumina NovaSeq6000 platform by Wuhan Maiwei Metabolomics Biotechnology Co., Ltd. (Wuhan, China). Raw sequencing reads were processed using Fastp (version 0.20.1) with default parameters to remove low-quality reads and adapter sequences [32]. Clean reads were aligned to the P. simonii reference genome using HISAT2 (version 2.2.1) with default settings [33]. Gene expression levels were quantified in FPKM (fragments per kilobase of transcript per million mapped reads) using FeatureCounts (version 2.6.0) [34]. The expression profiles of PsPOD genes, derived from RNA-seq data, were visualized as a heatmap using TBtools (version 2.145).
To further explore the expression patterns of PsPOD genes under abiotic stress conditions, raw RNA-seq datasets corresponding to heat, cold, and salt stress treatments were retrieved from the NCBI Sequence Read Archive (SRA) under accession numbers SRS1866875, SRR7686816, and SRS1890707. The sequences were aligned to the P. simonii reference genome using the same approach, followed by stringent quality control, normalization, and quantification. A count matrix was generated, and the expression levels of PsPODs were calculated using FPKM normalization. The resulting data were visualized as a clustered heatmap using TBtools (version 2.145).
Functional prediction of the 69 PsPOD protein sequences was performed using the STRING database (https://www.string-db.org/, accessed on 3 August 2024), and a protein–protein interaction (PPI) network was subsequently constructed. The resulting network was visualized and refined using Cytoscape software 2.8 [35].
2.8. Quantitative Reverse Transcription Polymerase Chain Reaction (qRT-PCR) Analysis
Total RNA was extracted from the samples using the Plant Total RNA Extraction Kit (Biotopped, Beijing, China), following the manufacturer’s instructions. First-strand cDNA synthesis was carried out using the PrimeScript RT Master Mix (Takara, Osaka, Japan). To validate the RNA-seq expression profiles, twelve PsPOD genes were selected for qRT-PCR analysis using gene-specific primers (Table S1), which were designed with TBtools. Actin was used as the internal reference gene [36]. qRT-PCR was performed on the CFX Opus 96 system (Bio-Rad, Hercules, CA, USA) with the following thermal cycling conditions: 94 °C for 30 s; 39 cycles of 94 °C for 5 s and 60 °C for 35 s; followed by 95 °C for 15 s, 60 °C for 1 min, and 95 °C for 15 s. Relative gene expression levels were calculated using the 2−ΔΔCt method, with three biological replicates included for each sample [37].
3. Results
3.1. Identification of PsPOD Genes
As a benchmark, POD coding sequences in A. thaliana were employed and we used TBtools for alignment and screening combined with the Conserved Domain Database (CDD) tool to detect conserved domains. Through this process, we ultimately identified 69 POD family genes in P. simonii. Subsequently, the 69 identified PsPOD genes were named PsPOD1 to PsPOD69 according to their order on homologous chromosomes. We delved into the basic parameters of these POD genes to gain a deeper comprehension, including protein length, predicted isoelectric point (pI), molecular weight (MW), and other essential data, as shown in Table S2. The results indicate that the longest POD protein (PsPOD10) contains 464 amino acid residues, while the shortest one (PsPOD6) has 243 amino acid residues, with an average of 335. The predicted isoelectric points (pI) are in the range of 4.38~9.57, among which 38 POD proteins have a pI greater than 7, accounting for 55.07%. This suggests that most of the POD protein family in P. simonii is rich in basic amino acids. The molecular weights (MWs) vary in the range of 26.266~50.397 kDa, and the instability index is in the range of 28.06~58.59. Specifically, 61 proteins are hydrophilic, while 8 proteins are not. In addition, subcellular locations of these PsPODs are mainly in the chloroplast, extracellular, vacuole, and cytoplasm (Table S2).
3.2. Phylogenetic Analysis of PsPOD Genes
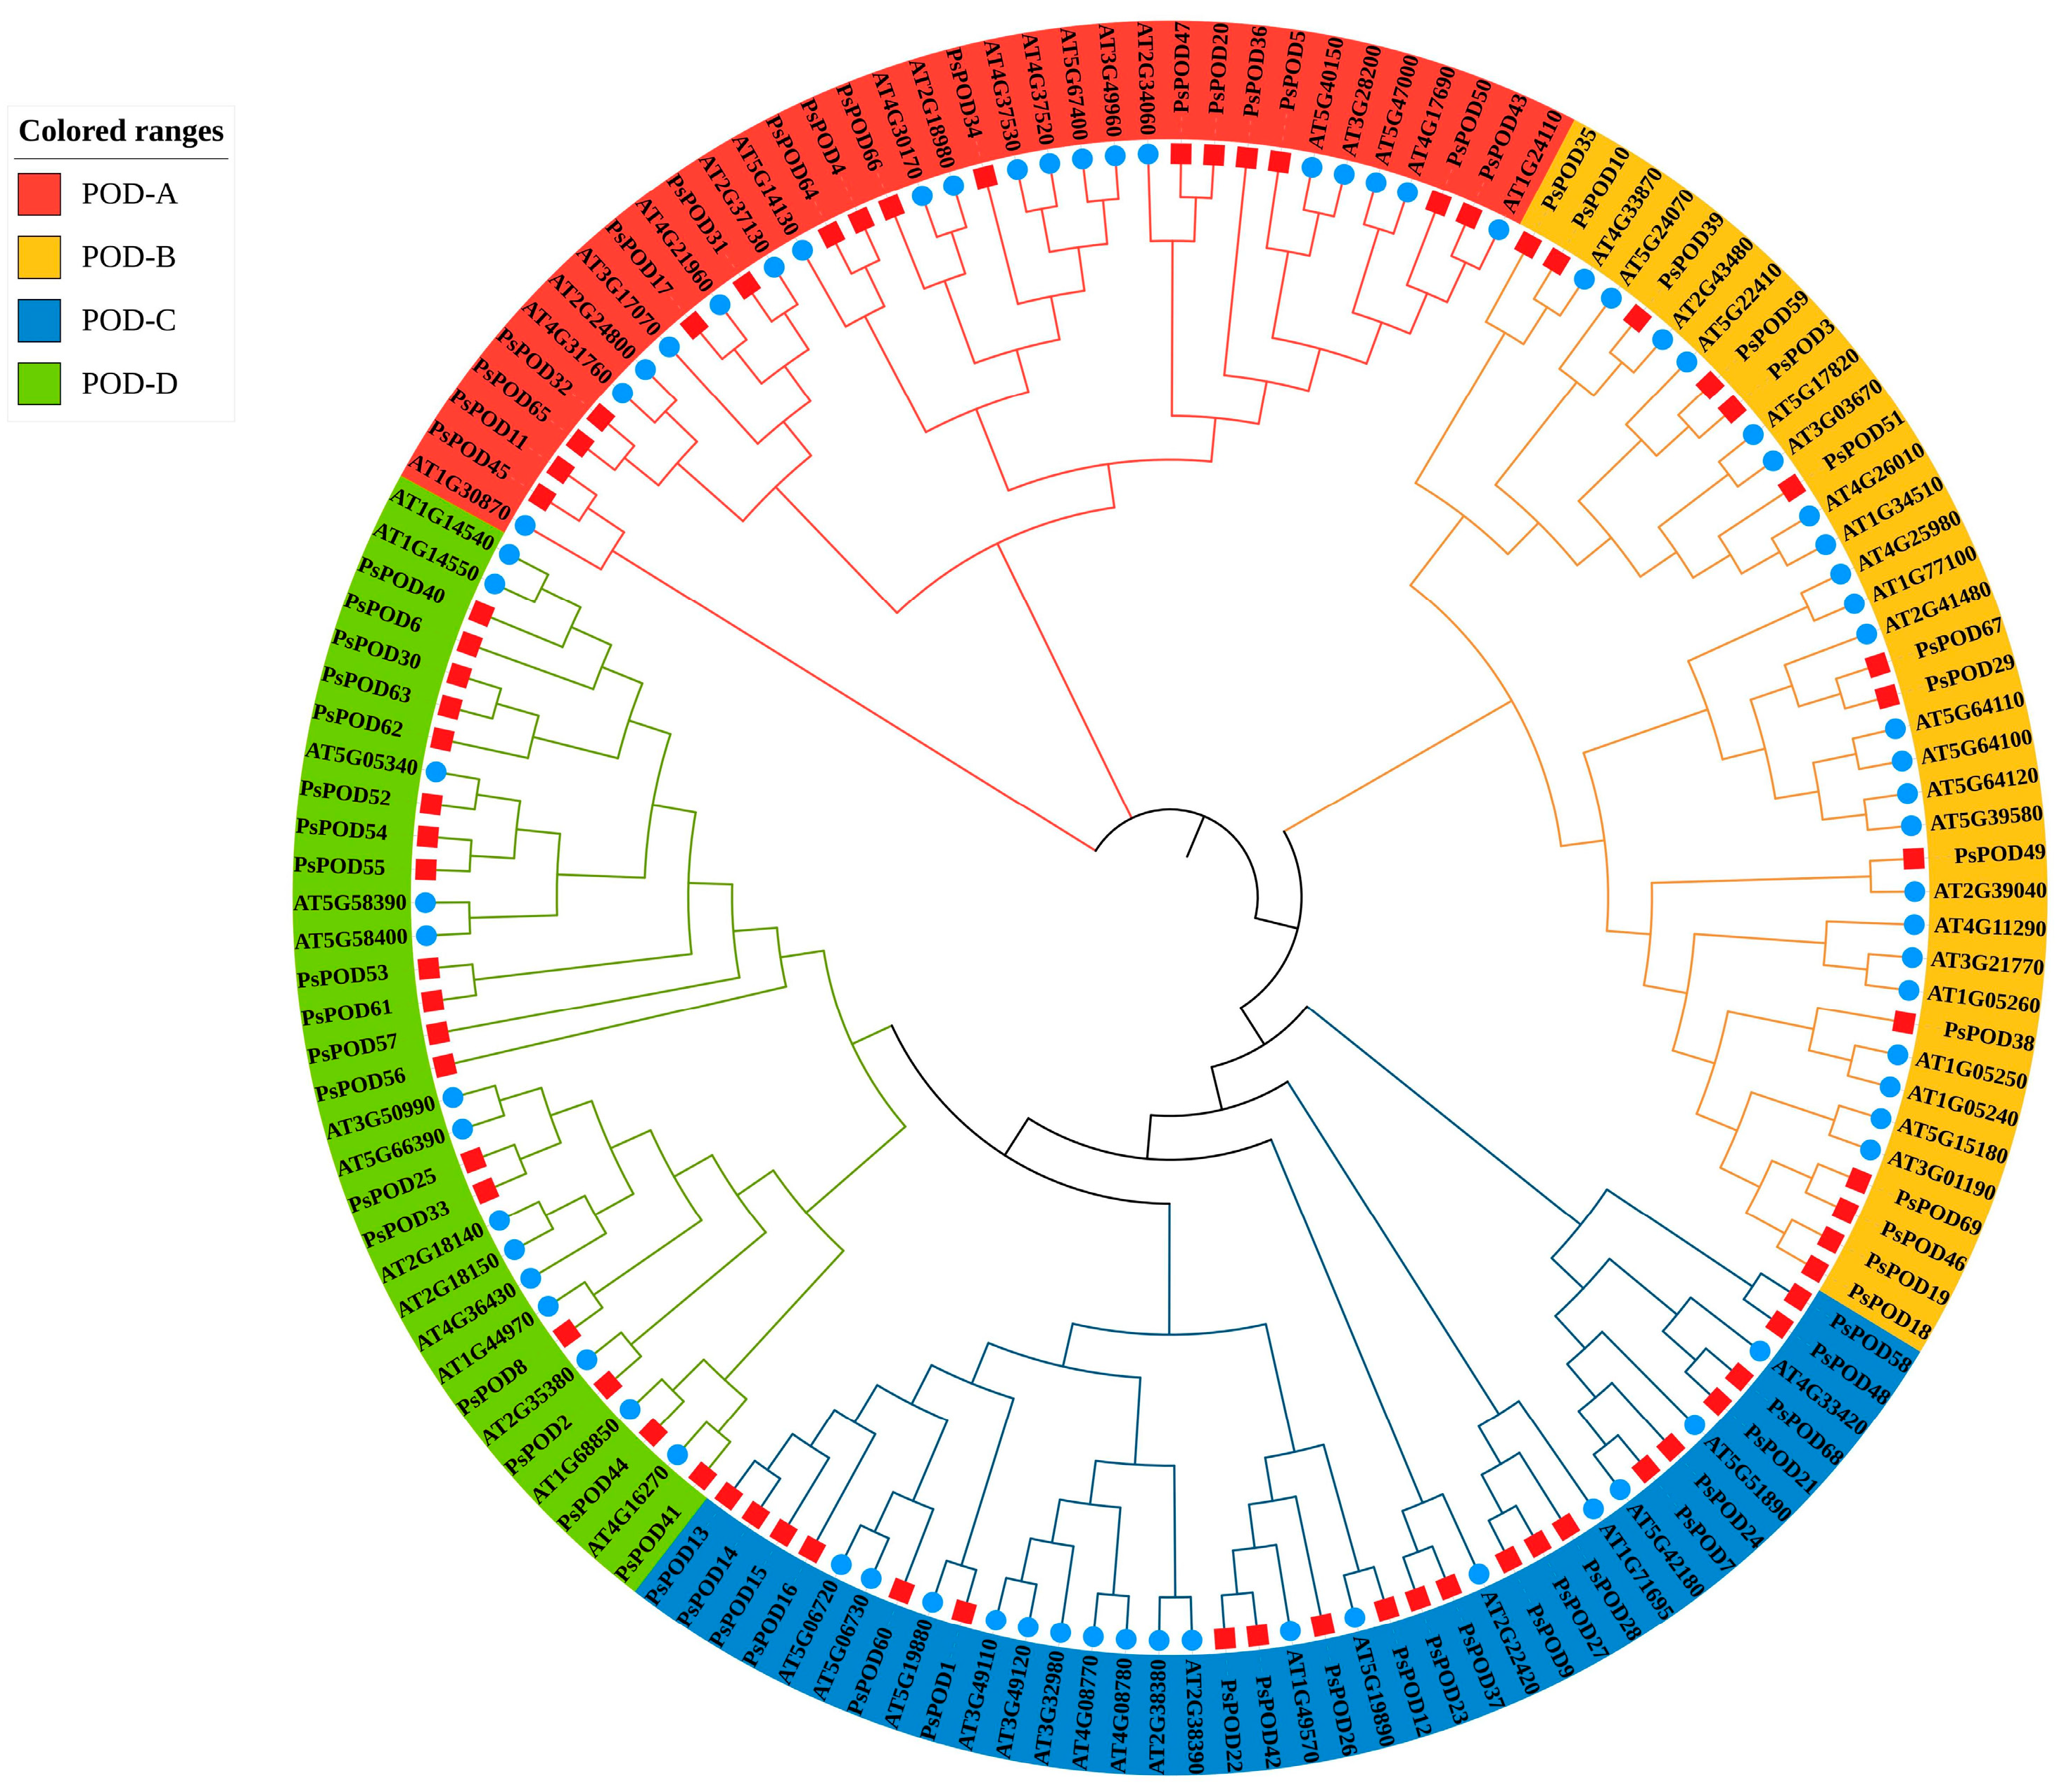
To investigate the evolutionary relationships within the PsPOD protein family of P. simonii, a phylogenetic tree was constructed using MEGA11 software with the Maximum Likelihood (ML) method. The analysis was based on the amino acid sequences of 69 PsPOD proteins from P. simonii and 73 POD proteins from A. thaliana, resulting in a total of 142 sequences (Figure 1). This phylogenetic analysis provided insights into the evolutionary divergence and potential functional differentiation among the POD proteins. Based on the tree topology, the POD family members were classified into four distinct subfamilies: POD-A (35 members), POD-B (37 members), POD-C (38 members), and POD-D (33 members). Among them, the POD-C subfamily contained the highest number of members, with 21 from P. simonii and 17 from A. thaliana. All four subfamilies included members from both species, suggesting that diversification of the POD gene family predates the divergence of P. simonii and A. thaliana.
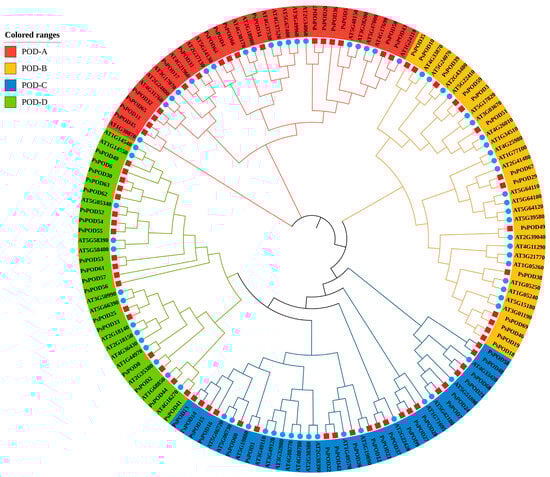
Figure 1.
Evolutionary analysis of Populus simonii and Arabidopsis thaliana POD family members. The phylogenetic tree of PsPOD proteins is divided into four subfamilies, namely POD-A, POD-B, POD-C, and POD-D, represented by red, yellow, blue, and green arcs, respectively. The blue circles represent members of the POD gene family from A. thaliana, while the red squares represent members of the POD gene family from P. simonii.
3.3. Motif Composition, Protein Conserved Domain and Gene Structure of PsPOD Genes
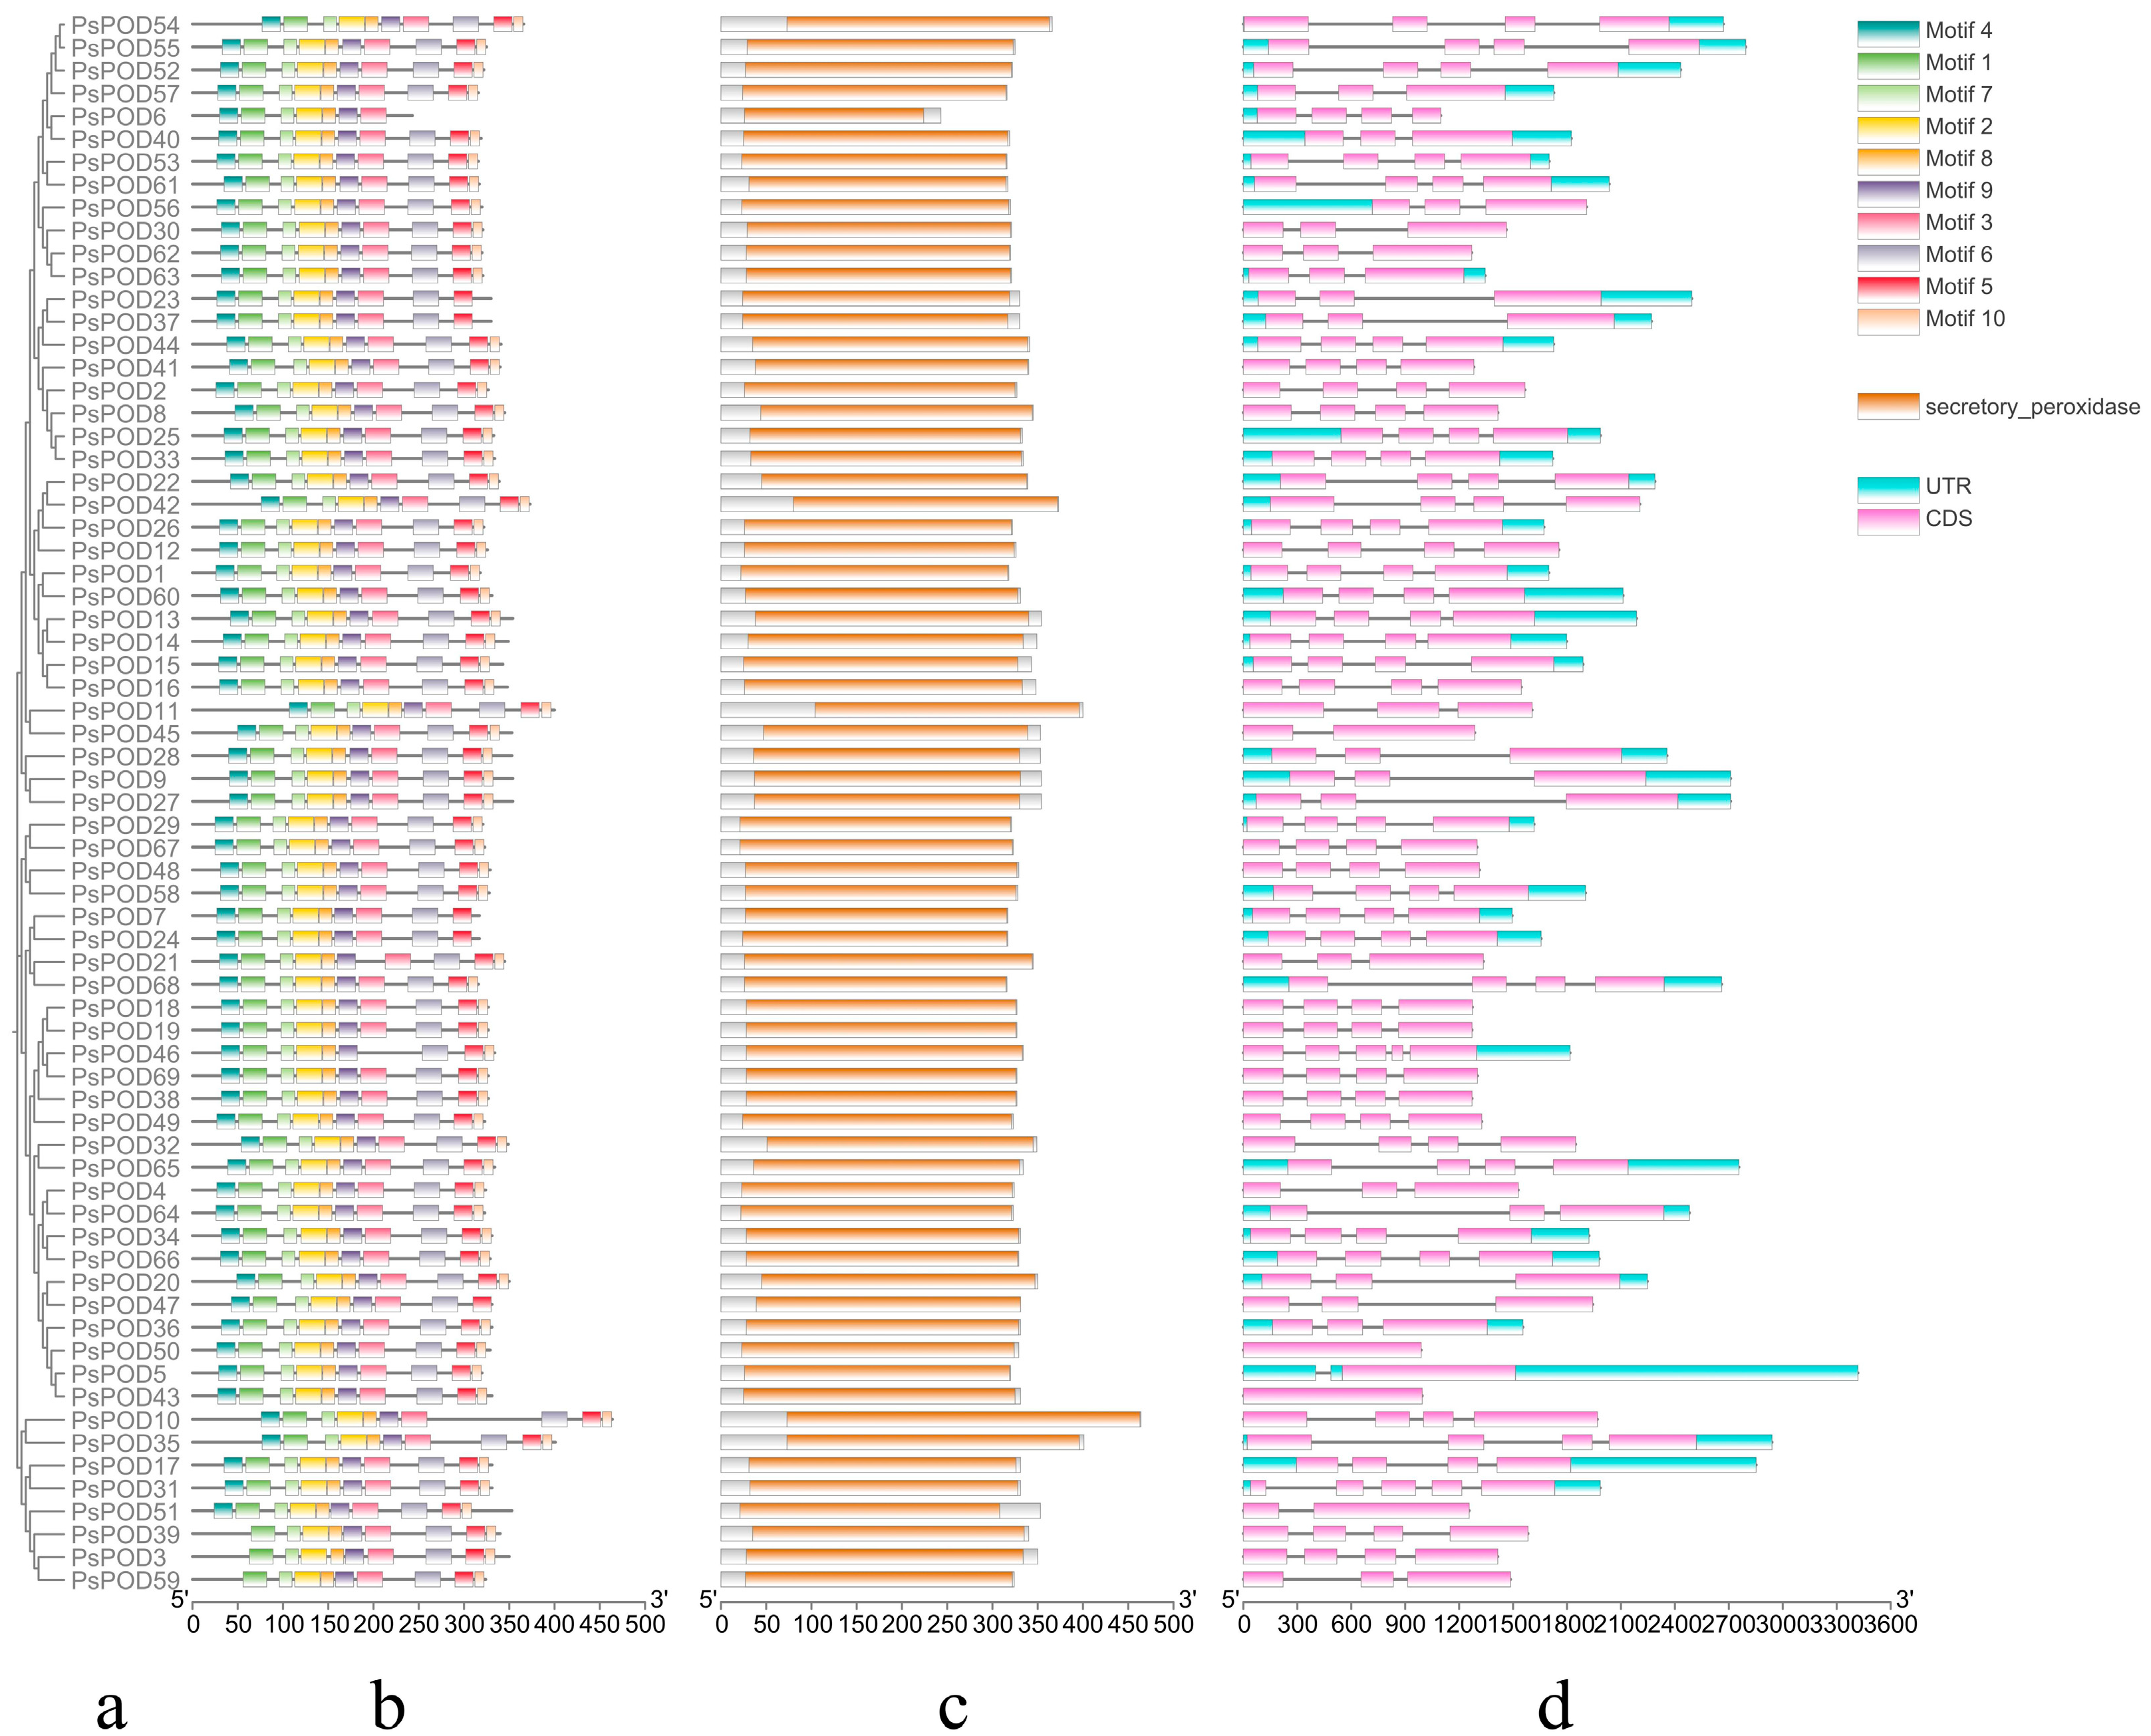
Conservative motif analysis showed that different PsPOD family members contained different motifs, ranging from 7 to 10. Except for PsPOD3, 6, 39, and 59, which have fewer than 10 motifs, all other genes contain 10 motifs. Among them, PsPOD6 has the fewest motifs, with only 7, lacking motifs 5, 6, and 10. PsPOD3, 39, and 59 do not contain motif 1 (Figure 2a,b). These findings suggest diversity in the structural and functional properties of the PsPOD family members. Protein conserved domain analysis indicated that all members of the PsPOD family contain only the plant peroxidase conserved domain (Figure 2c). This finding suggests a common functional core among these proteins related to their peroxidase activity.
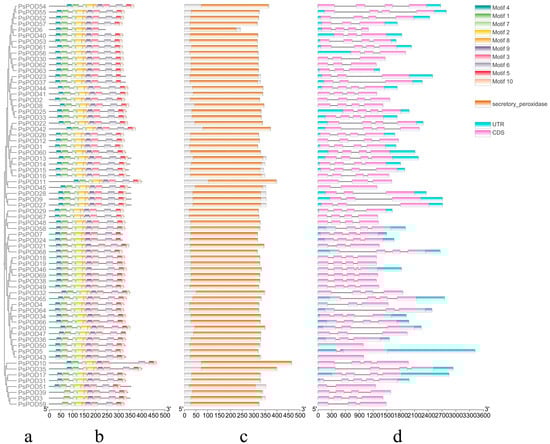
Figure 2.
Analysis of conserved domains, motifs and gene structure of PsPOD genes. (a) Phylogenetic tree of the PsPOD gene family. (b) Motif composition of PsPOD proteins. Different colored rectangles represent different conserved motifs. (c) Conserved domains of POD genes in P. simonii, marked with orange squares. (d) Exon–intron structure of PsPOD genes. The UTR regions, exons, and introns are represented by blue squares, pink squares, and black lines, respectively. The scale at the bottom indicates the length of exon and intron segments.
Structural analysis revealed that all PsPOD genes contain exons, with the number of exons ranging from 1 to 5, and the majority of genes harboring 4 exons. Intron counts varied from 0 to 4, with most genes containing 3 introns. Notably, PsPOD31 and PsPOD46 exhibited the highest intron number (four), while PsPOD5, PsPOD45, and PsPOD51 each contained only a single intron. PsPOD43 and PsPOD50 were identified as intronless genes, composed entirely of exonic sequences (Figure 2d). These structural characteristics indicate a relatively conserved gene architecture across the PsPOD family, which may have functional implications in terms of transcriptional regulation and evolutionary diversification.
3.4. Analysis of Cis-Elements in PsPOD Gene Promoters
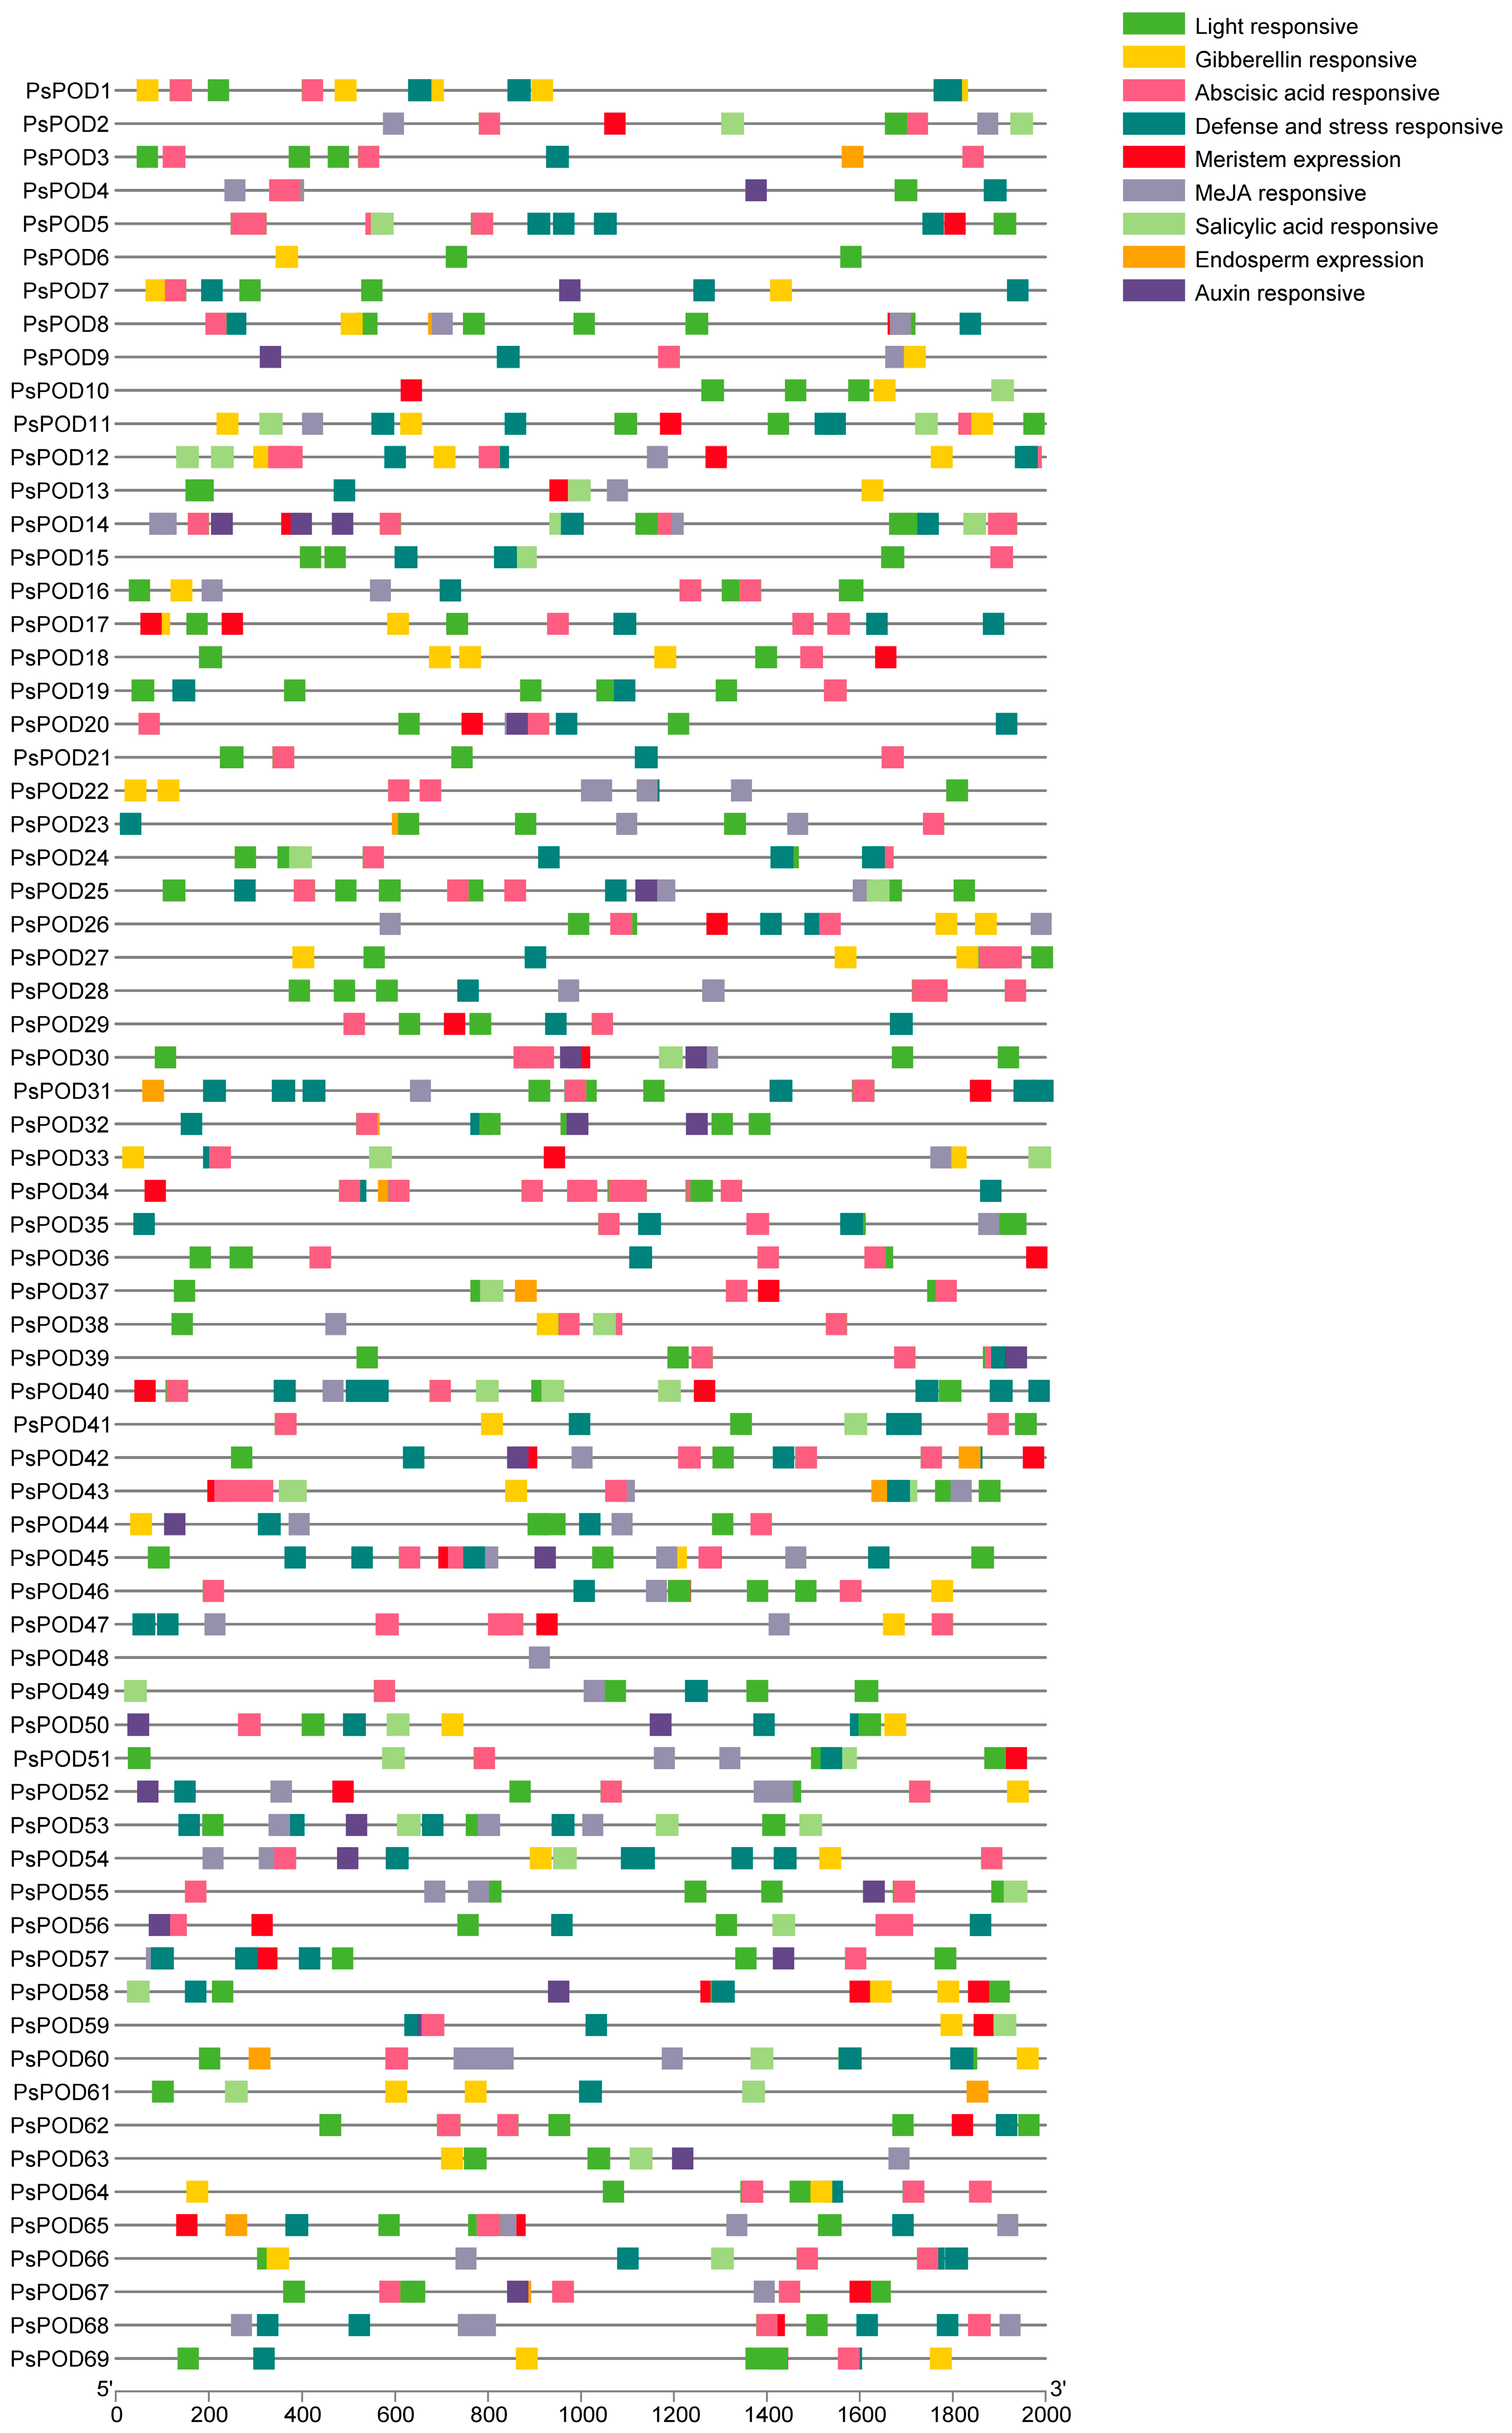
To gain further insights into the regulatory mechanisms of the PsPOD gene family, cis-acting elements within their promoter regions were analyzed using the PlantCARE online database. All 69 PsPOD genes had response elements found in their promoter regions, though the quantity and kind of these elements varied between them (Figure 3). We identified nine categories of cis-acting elements in the promoters of PsPOD genes, with the most prevalent being light-responsive elements, totaling 329 instances. Additionally, five types of hormone-responsive elements were predicted, including 170 abscisic acid-responsive, 28 auxin-responsive, 61 gibberellin-responsive, 166 methyl jasmonate-responsive, and 43 salicylic acid-responsive elements. Two kinds of growth and development-related response components were identified, with 13 endosperm expression-related and 43 meristem expression-related elements. Furthermore, 129 defense and stress-responsive elements were also predicted. The data point to PsPOD genes being affected by a variety of elements, such as light, growth and development, hormones, and stress; these response components may be directly involved in the expression and control of PsPOD genes during developmental stages and in varying stress scenarios.
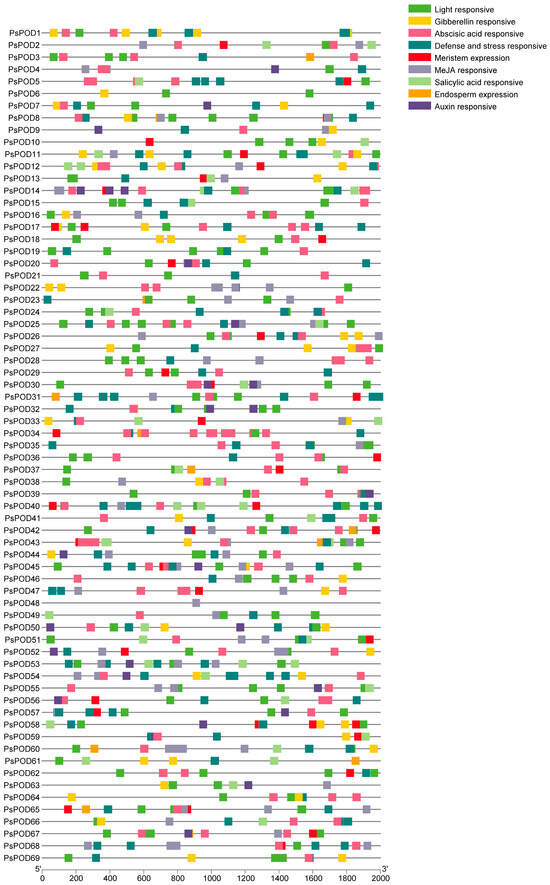
Figure 3.
Analysis of the cis-acting elements in the promoter region of the PsPOD genes. Each colored box on the right denotes a cis-acting element with a specific function.
3.5. Chromosomal Location and Synteny Relationship of PsPOD Genes
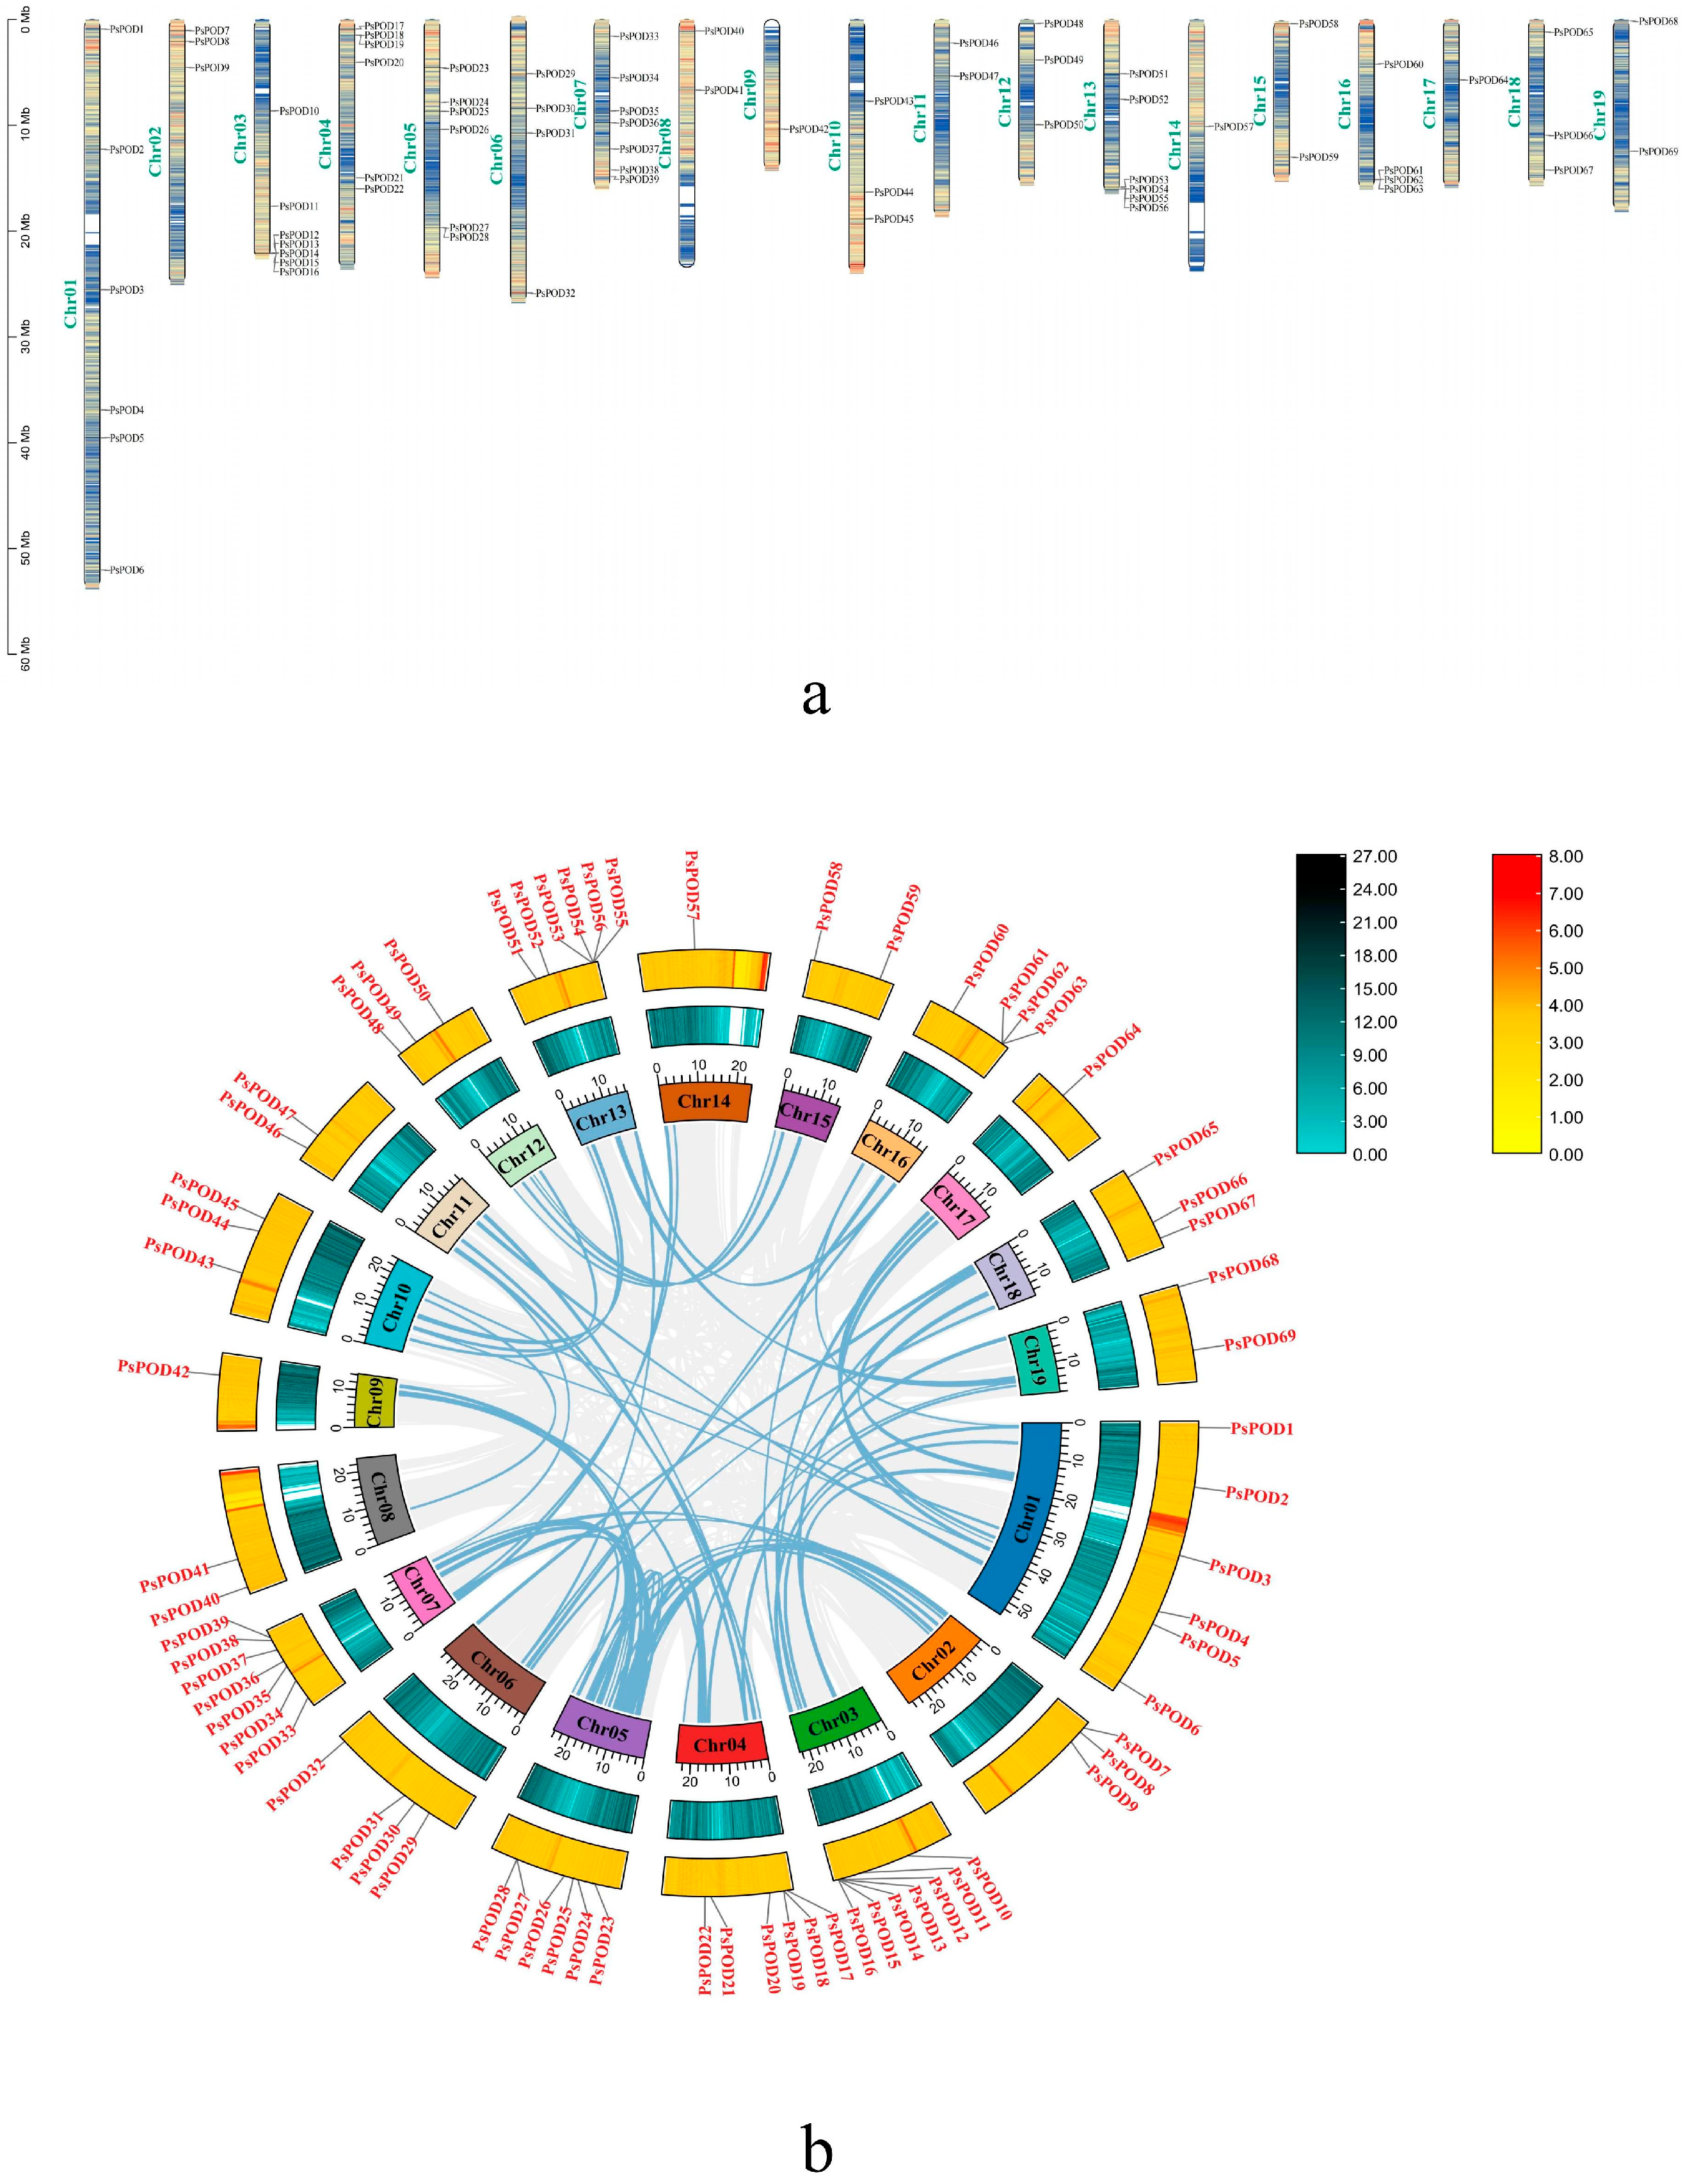
Based on the GFF annotation file of P. simonii, all 69 PsPOD genes were mapped onto the 19 chromosomes, enabling a comprehensive visualization of their genomic distribution (Figure 4a). Among them, the highest number of genes, seven, are located on the Chr3 and Chr7 chromosomes. The next highest concentration is found on Chr1, Chr4, Chr5, and Chr13, with six members each. The fewest number of genes, only one, are present on Chr9, Chr14, and Chr17. Additionally, gene clusters formed by multiple genes are observed on Chr3, Chr4, Chr5, Chr13, and Chr16.

Figure 4.
Chromosomal localization and gene collinearity of the PsPOD genes. (a) Chromosomal localization of genes, the colors within the chromosome represent gene density, with a gradient from yellow to blue signifying a transition from high to low gene density. (b) Collinearity analysis of genes, where the numbers on each chromosome box represent the sequence length in bases. The blue–black histogram shows the distribution of gene density, while the red–yellow histogram displays the distribution of GC ratios along the chromosome. The gray lines indicate collinear blocks within the P. simonii genome, and the blue lines represent collinear relationships between POD regions.
One of the primary catalysts for genome development is the duplication of genes, including segmental and tandem duplication [38]. In this study, we observed tandem duplication phenomena, as illustrated in Figure 4b. Typically, tandem gene duplication is a fundamental reason for the formation of gene clusters. In our investigation, we observed that some PsPODs are located adjacent to each other (Figure 4a). For instance, PsPOD12–16 on chromosome 3, PsPOD53–56 on chromosome 13, and PsPOD61–63 on chromosome 16 are all arranged in tandem, suggesting the possibility of tandem duplication relationships among these PsPODs. Tandem duplication’s prominent part in the enlargement of the PsPOD gene family is evidenced by the results.
Collinearity analysis was performed to investigate the evolutionary relationships among all PsPOD genes, using the Circos visualization module integrated in TBtools (Figure 4b). The collinearity analysis identified 44 homologous gene pairs among the 69 PsPOD genes, indicating substantial evolutionary relationships within the gene family. Chromosomes 1 and 5 exhibited the highest number of collinear gene pairs, each containing 11 pairs. Notably, several PsPOD genes displayed collinear relationships with multiple genes located on different chromosomes, suggesting possible gene duplication events. These findings provide insights into the complex evolutionary dynamics and potential functional redundancy within the PsPOD gene family.
3.6. Synteny Relationships of PsPOD Genes in P. simonii and Different Species
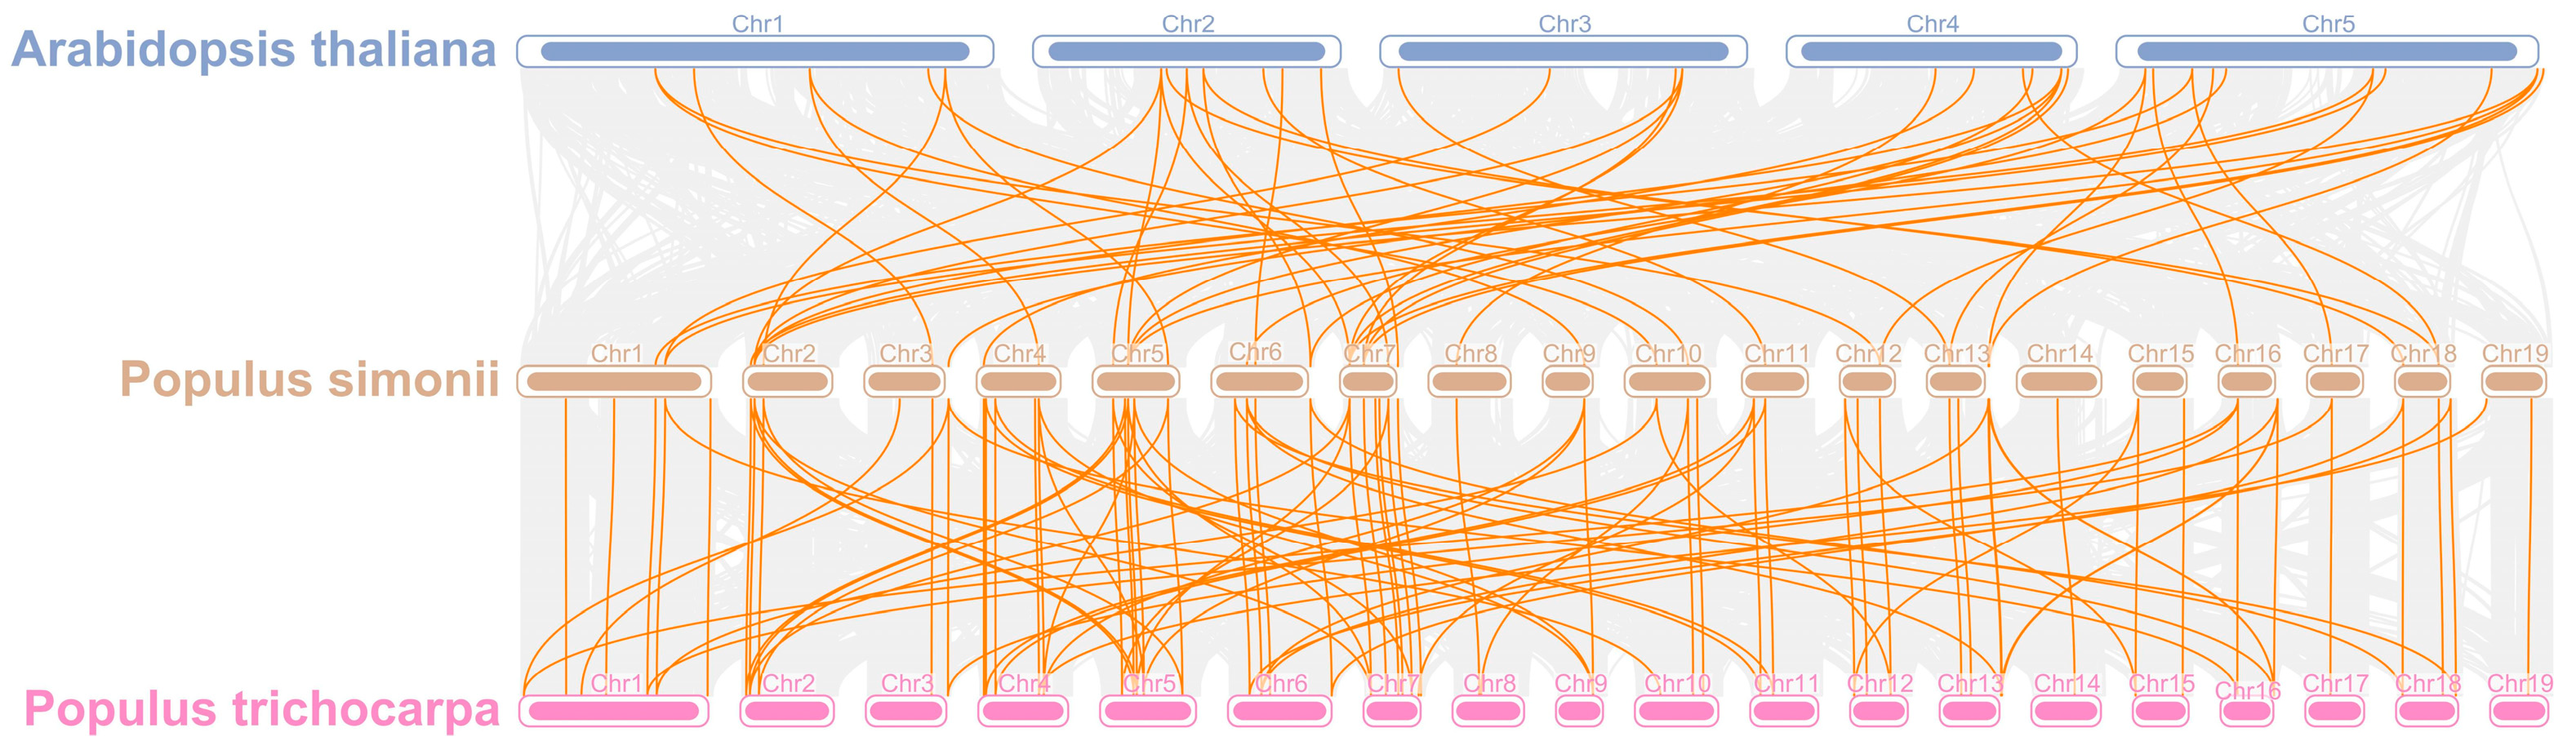
To elucidate the evolutionary trajectory of the PsPOD gene family, a comparative synteny analysis was conducted among P. simonii, P. trichocarpa, and A. thaliana (Figure 5). A total of 48 and 98 homologous gene pairs were identified between the 69 PsPOD genes of P. simonii and the genomes of A. thaliana and P. trichocarpa, respectively. Notably, chromosome 7 of P. simonii exhibited the highest density of orthologous gene pairs, with nine homologs identified with A. thaliana and nine with P. trichocarpa. In addition, chromosomes 2, 5, and 6 of P. simonii displayed high concentrations of both intra- and inter-species syntenic gene pairs, indicating conserved genomic regions. As expected, the degree of homology between P. simonii and P. trichocarpa was greater than that with A. thaliana, reflecting their closer evolutionary relationship.
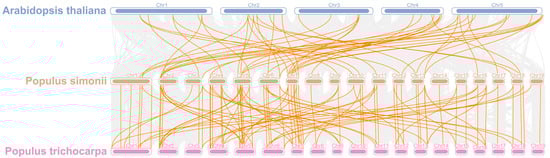
Figure 5.
Collinearity analysis of POD genes in P. simonii, A. thaliana and Populus trichocarpa. The gray lines depict collinear segments of homologous plant genomes in P. simonii, while the yellow lines represent POD gene pairs.
3.7. Regulatory Network and Expression Patterns of PsPOD Genes
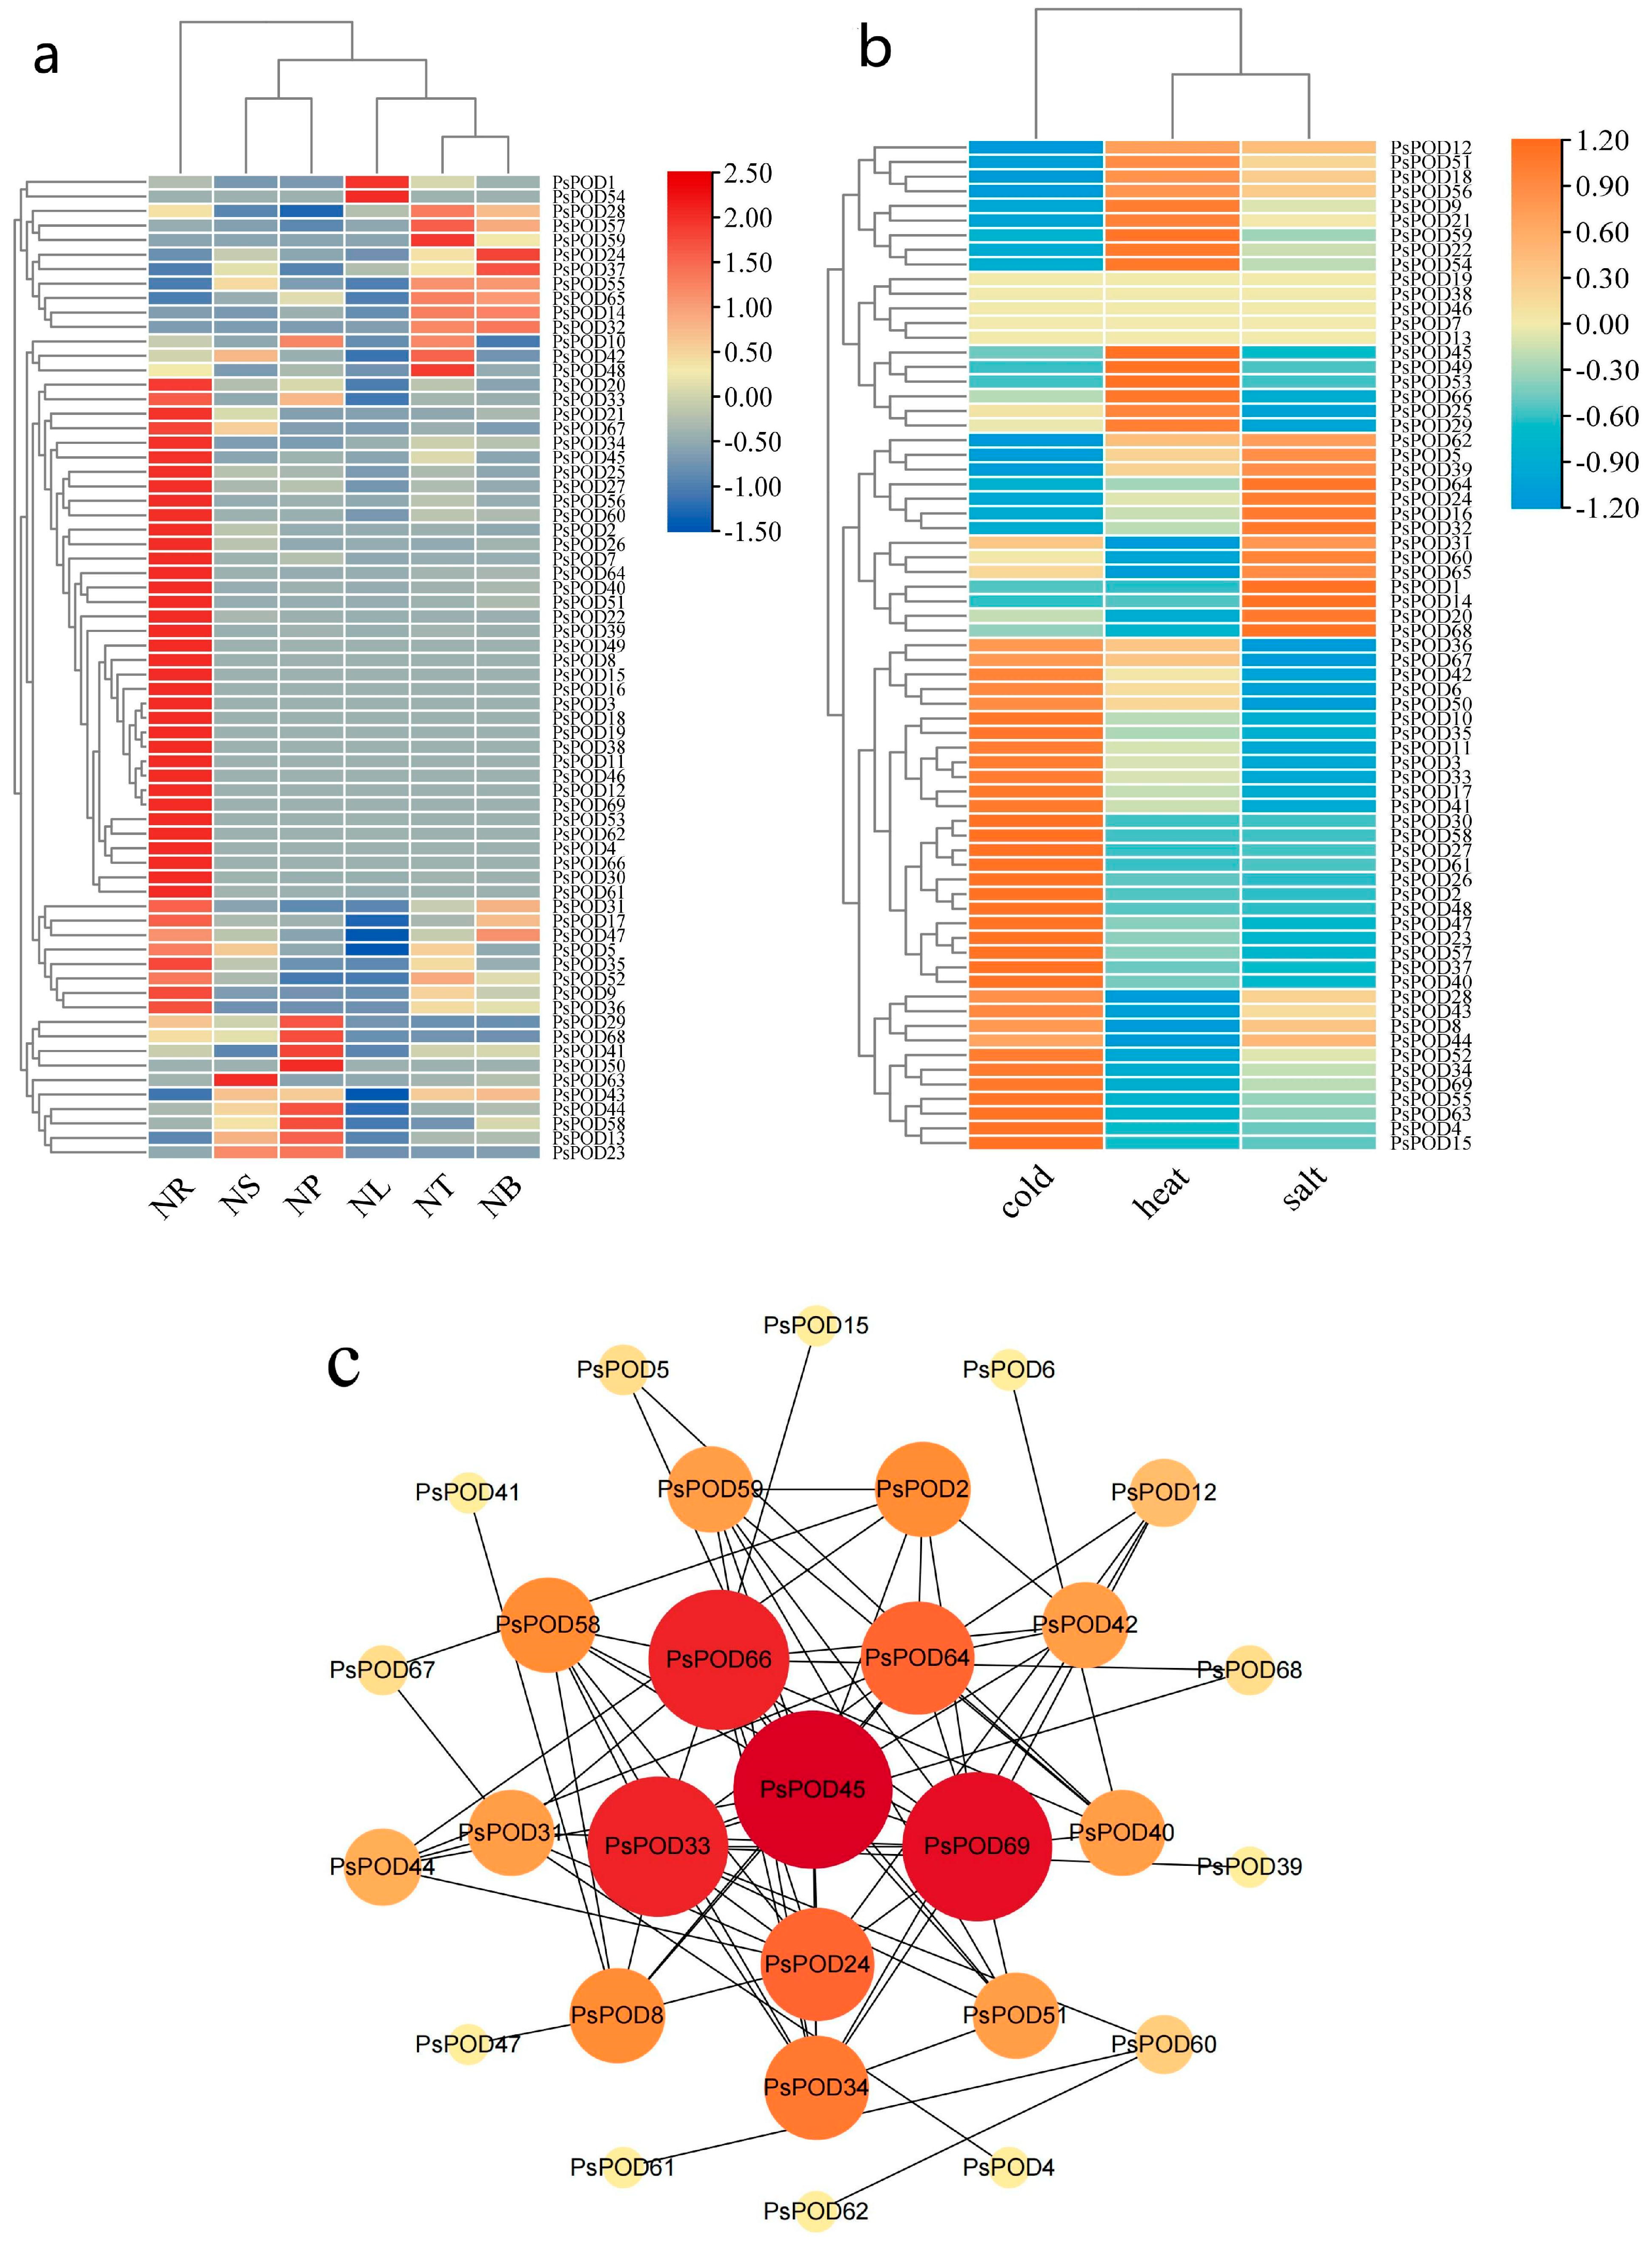
To investigate the role of the PsPOD genes in P. simonii, we utilized transcriptome sequencing technology to explore the expression patterns of genes in different organs or tissues of the plant, including roots (NR), stems (NS), phloem (NP), leaves (NL), apical buds (NT), and axillary buds (NB). The results, as shown in Figure 6a, indicate significant expression differences of the PsPOD gene across various organs/tissues of P. simonii. For instance, most PsPOD genes show higher expression levels in roots compared to other organs/tissues. However, PsPOD63 exhibits higher expression in the stem than in other tissues, while PsPOD50 demonstrates elevated expression in the phloem. Additionally, PsPOD1 and PsPOD54 display higher expression in leaves, and PsPOD59 has increased expression in apical buds compared to other tissues.

Figure 6.
Heatmap and interaction network of expression of PsPOD gene family. (a) Heatmap of organ/tissue expression levels of the PsPOD gene family in P. simonii. The color spectrum from red to deep blue indicates gene expression levels from low to high. NR represents roots, NS represents stems, NP represents phloem, NL represents leaves, NT represents terminal buds, and NB represents axillary buds. (b) Heatmap of expression levels of the PsPOD gene family in P. simonii under stress conditions. The color spectrum from orange to sky blue indicates gene expression levels from high to low. Heat represents heat stress, cold represents cold stress, and salt represents salt stress. (c) Interaction network of PsPOD genes in P. simonii. The network contains 29 nodes and 78 edges (interaction combinations). Network nodes symbolize proteins, and edges represent interactions between proteins in the network. The size and color of the circles representing genes indicate their weight value, with larger circles and redder colors reflecting higher weight values.
Given the discovery of cis-acting elements responsible for stress response in the promoter of PsPOD genes, this study utilized RNA-seq data from P. simonii leaves under heat, cold, and salt stress conditions to explore the expression pattern of PsPOD genes under stress conditions (Figure 6b). Under cold stress, half of the PsPOD genes exhibited higher expression levels. Conversely, under heat and salt stress, the majority of PsPOD genes showed a reduction in expression. Notably, a small subset of genes displayed significant alterations in expression levels, manifesting as increased gene expression under various stress conditions.
Moreover, we constructed an interaction network comprising all PsPOD genes, utilizing the STRING database and Cytoscape software, to further explore the potential links between them (Figure 6c). The results indicate that among the 69 PsPOD genes, 29 genes are involved in constructing a complex gene regulatory network, and some of these genes often act as hub genes in the regulatory network. For instance, PsPOD45 interacts with 14 other genes as a hub gene, while PsPOD69 interacts with 13 other genes. The identification of this regulatory network provides valuable information for a better understanding of the role of POD genes in development and stress responses.
3.8. qRT-PCR Analysis
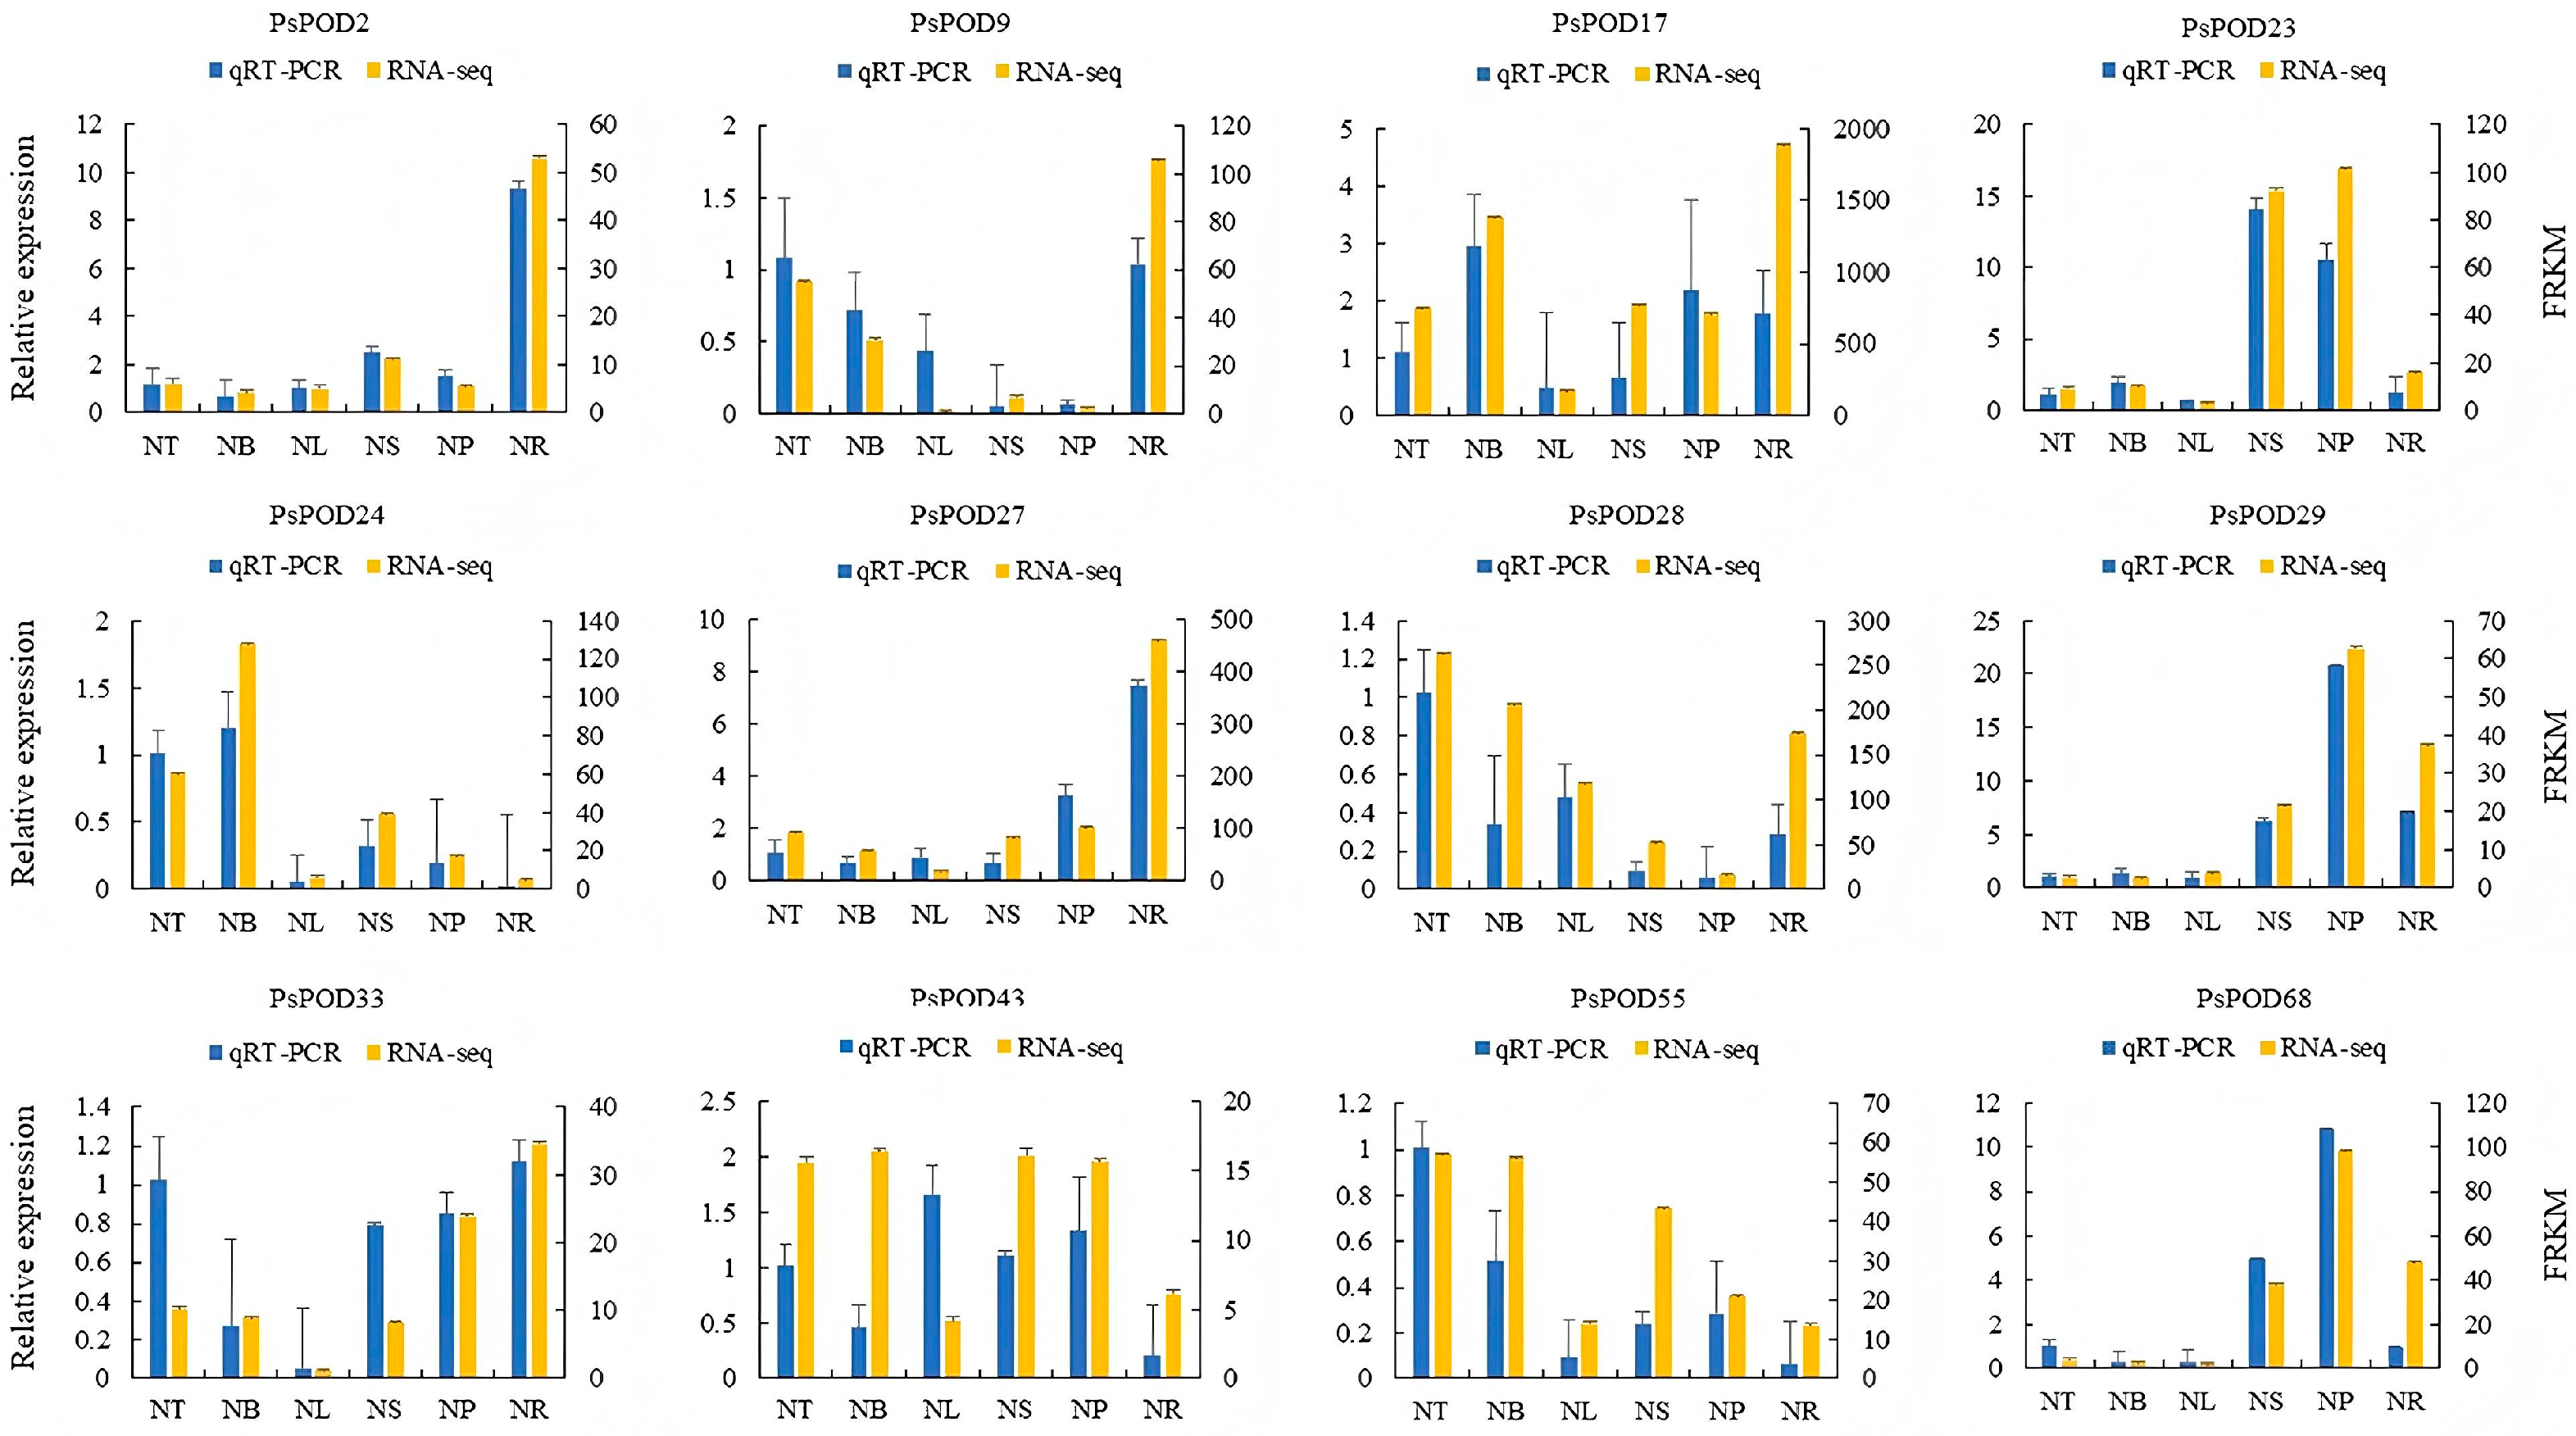
To further investigate the organ- or tissue-specific expression patterns of PsPOD genes, twelve genes were randomly selected for qRT-PCR analysis using gene-specific primers. The qRT-PCR results were consistent with the RNA-seq data, thereby validating the reliability of the transcriptomic analysis in reflecting PsPOD gene expression levels (Figure 7).
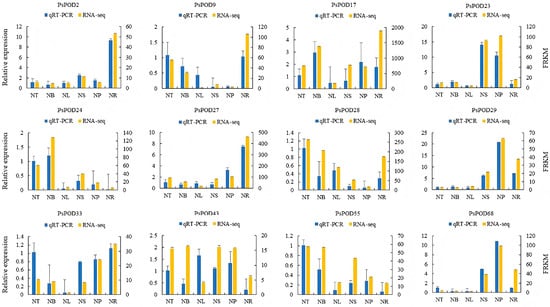
Figure 7.
Gene expression profiles of RNA-seq and qPCR of the PsPOD gene family. The x-axis represents six different organs or tissues (abbreviations are shown in Figure 6). The left y-axis shows the expression data from qRT-PCR. The right y-axis indicates the relative expression levels of genes validated by RNA-seq. Error bars represent standard errors.
4. Discussion
Class III peroxidases play essential roles in plant growth, development, and responses to both biotic and abiotic stresses [39]. Although comprehensive genome-wide analyses of the POD gene family have been conducted in several plant species, including A. thaliana [18], rice [22], P. trichocarpa [20], and maize [22], a systematic characterization of this gene family in P. simonii has not yet been reported. In the present study, we performed a genome-wide identification and analysis of the POD gene family in P. simonii. The expansion, structure, and diversity of gene families are often shaped by complex evolutionary processes, including genome duplication and environmental adaptation. A total of 69 PsPOD genes were identified in P. simonii. This number is comparable to that reported in sweet orange (73) [40], A. thaliana (73) [18], carrot (75) [41], and lychee (77) [24], but lower than in cassava (91) [23], Chinese pear (94) [25], and maize (119) [22]. Conversely, it is higher than the POD gene count in sesame (45) [42]. These differences in gene family size among species likely reflect lineage-specific evolutionary trajectories driven by genomic duplications and adaptive pressures.
Based on chromosomal localization analysis, PsPOD genes were identified on all chromosomes of P. simonii. Among them, a higher number of PsPOD genes were found on chromosomes 3 and 7, while fewer genes were detected on chromosomes 9, 14, and 17. This indicates that there is a phenomenon of uneven distribution of genes during the evolutionary process. In addition, the results indicated the existence of repeated sequences of PsPOD genes arranged in tandem across several chromosomes of P. simonii, constituting the primary mechanism for the enlargement of the PsPOD gene family. The expansion of the POD gene family in P. simonii is notably affected by tandem repetitive sequences, which is consistent with the results observed in studies focused on the POD gene family in P. trichocarpa [20]. In contrast to the results of this study, the POD gene family of pear was found to have been primarily augmented by segmental duplication [25]. Notably, both segmental duplication and tandem duplication were found to be influential in the expansion of the POD gene family of corn [22]. These findings reveal notable variations in the patterns of POD gene amplification among P. simonii, corn, and Chinese pear, indicating that the expansion of the POD gene family differs across species.
We conducted a synteny analysis between P. simonii, A. thaliana, and P. trichocarpa POD genes. The findings revealed that P. simonii shares 98 pairs of homologous genes with P. trichocarpa, which is 50 pairs more than its homologous genes with A. thaliana. Compared to A. thaliana, the POD genes of P. simonii and P. trichocarpa exhibit higher homology. This may be attributed to their closer phylogenetic relationship, as both belong to the same genus. Conversely, their more distant relationship to Arabidopsis, which is a herbaceous plant while the former two are woody plants, could account for the lower homology. Through analysis of gene structure and conserved motifs, it was found that all members of the POD gene family in P. simonii contain only one typical peroxidase domain. Furthermore, the majority of these members possess all ten motifs (65/69), suggesting their potential role in maintaining intracellular ROS balance. The diverse protein motifs likely determine their involvement in different regulatory pathways and the execution of distinct biological functions [43].
It is widely believed that cis-regulatory elements are crucial in gene expression regulation by acting as binding sites for transcription factors [44]. In this study, we identified a variety of cis-regulatory elements in the promoter regions of PsPOD genes, including motifs responsive to light, hormones, defense, and stress. The presence of light- and hormone-responsive elements such as G-box, TGA-element, and ABRE is consistent with canonical regulatory motifs previously characterized in A. thaliana and Oryza sativa POD genes [11,18], indicating conserved transcriptional control mechanisms in plant responses to abiotic stimuli. Additionally, the enrichment of defense- and stress-responsive elements agrees with earlier observations in P. trichocarpa defense-related genes [45], suggesting a conserved role of POD genes in biotic stress responses within the Populus genus. Importantly, we also observed a notable distribution of meristem-specific elements in the promoter regions of PsPOD genes. To our knowledge, such elements have not been systematically reported in POD genes of Solanaceae species, including Capsicum annuum and Nicotiana tabacum [46,47], indicating a potential Salicaceae-specific regulatory feature. This may reflect a functional adaptation associated with the regulation of secondary growth and cambial development, processes that are particularly prominent in woody perennials like Populus. Overall, the presence of both conserved and potentially lineage-specific cis-elements suggests that while core POD gene regulation is maintained across plant species, additional regulatory complexity may have evolved in Populus to support its perennial growth habit and stress adaptability.
Gene expression at the RNA level is a key determinant of biological phenotypes [48]. In this study, we found that most PsPOD genes exhibited higher expression levels in root tissues, a pattern consistent with findings in A. thaliana [18] and maize [22]. In A. thaliana, POD genes are co-expressed with those encoding root hair-specific proteins and nitrate transporters, while in maize, they show coordinated expression with genes involved in root cell wall biosynthesis and mycorrhizal symbiosis. These conserved co-expression patterns across diverse species strongly support the critical role of POD genes in root-related physiological processes. Furthermore, the elevated expression of PsPOD genes in roots suggests their potential involvement in maintaining root functionality and enhancing plant adaptation to environmental stresses. Compared to other tissues, the overall expression levels of PsPOD genes in the leaves of P. simonii were relatively low; however, two genes, PsPOD1 and PsPOD54, exhibited notably high expression. This may indicate that these genes play specific roles in leaf function or development, potentially compensating for the reduced activity of other PsPOD genes during later developmental stages [49,50,51]. Different functional genes may be expressed in roots and leaves, leading to distinct physiological and biochemical characteristics in these tissues.
Abiotic stresses, such as salinity and temperature extremes, are major limiting factors for plant growth and development. To survive under such conditions, plants activate complex regulatory networks at morphological, physiological, and transcriptional levels, including the upregulation of antioxidant defense genes like PODs [52]. In this study, expression profiling under multiple abiotic stress conditions demonstrated that PsPOD genes are actively involved in stress responses, as reflected by substantial changes in their transcript levels. Among the tested stresses, cold stress elicited the most prominent transcriptional activation, with PsPOD2, 4, 15, 26, 27, 30, 37, 48, 58, and 61 showing markedly elevated expression. In contrast, PsPOD45, 49, and 53 were specifically responsive to heat stress, while only PsPOD1 and 14 exhibited significant induction under salt stress. Notably, no individual gene exhibited strong responsiveness across all three abiotic stresses, indicating that PsPOD gene responses are stress-type specific. Similar patterns have been observed in other plant species. In passion fruit (Passiflora edulis), several PePOD genes—including PePOD1, PePOD3, PePOD22, PePOD26, and PePOD29—were significantly induced by cold treatment [53]. In cassava (Manihot esculenta), MePOD13 and MePOD16 were consistently upregulated under drought stress across multiple genotypes [23]. Likewise, in grapevine (Vitis vinifera), approximately 52% of VvPOD genes were upregulated under salt stress, while drought stress led to the downregulation of 72% of family members [54]. These comparative findings support the stress-responsive nature of POD genes across diverse plant taxa, while also highlighting species-specific and stress-type-specific regulatory patterns. The observed expression divergence of PsPOD genes in P. simonii may reflect lineage-specific regulatory adaptations to temperature-related stresses, consistent with the ecological distribution of the species. Additionally, the RNA-seq results were validated by qRT-PCR analysis of PsPOD gene expression across six organs and tissues. The qRT-PCR expression patterns were largely consistent with the transcriptome data, thereby confirming the reliability of RNA-seq in evaluating PsPOD gene expression profiles.
Protein–protein interactions are fundamental to the execution of biological functions within living systems [55]. In the present study, protein interaction network analysis revealed that only 29 PsPOD proteins were involved in detectable interactions. Among them, PsPOD45, PsPOD69, PsPOD33, and PsPOD64 were identified as major hub genes, each interacting with 14, 13, 12, and 12 other proteins, respectively. These hub genes are likely involved in a wide range of biological processes, including signal transduction, transcriptional regulation, energy metabolism, metabolite processing, and cell cycle control. The broader interaction network consists of multiple genes and proteins whose coordinated functions collectively influence plant growth and development under varying environmental conditions. Given that the specific roles of most PsPOD genes remain poorly understood, the identification of these four central genes provides valuable targets for future functional studies aimed at elucidating protein mechanisms and regulatory networks in P. simonii.
5. Conclusions
In this study, a total of 69 class III peroxidase (PsPOD) genes were identified in the P. simonii genome through genome-wide analysis. These genes are unevenly distributed across all 19 chromosomes. Based on phylogenetic relationships, gene structures, and conserved motif compositions, the PsPOD genes were classified into four distinct subfamilies, with members of each subfamily exhibiting similar exon–intron organization and motif arrangements. All PsPOD proteins were found to contain a single conserved domain characteristic of the POD family. Promoter analysis revealed the presence of multiple cis-acting elements related to light responsiveness, hormone signaling, growth and development, and abiotic stress responses, suggesting the regulatory complexity of this gene family. Expression profiling across different tissues and stress conditions demonstrated that PsPOD genes exhibit diverse and tissue-specific expression patterns. Furthermore, four hub genes were identified from the protein–protein interaction network, providing potential candidates for future functional characterization. Overall, this study presents the first comprehensive investigation of the PsPOD gene family in P. simonii and lays a solid foundation for further studies on their biological roles and stress response mechanisms.
Supplementary Materials
The following supporting information can be downloaded at https://www.mdpi.com/article/10.3390/antiox14050602/s1: Table S1: Specific primers used for qRT-PCR analysis; Table S2: Basic information of the POD genes in Populus simonii.
Author Contributions
L.H. was the main contributor to the manuscript and drafted it. Y.R., X.B. and G.Y. substantially revised the manuscript. J.Z., H.Y. and J.C. were responsible for sample collection and subsequent transcription data processing and analysis. X.X., Y.Z. and S.D. analyzed the data and made the figures. W.C., K.C. and X.Z. participated in the revision of the manuscript. K.C. and X.Z. conceived the idea of the study, participated in its design and data interpretation, and revised the manuscript critically. All authors have read and agreed to the published version of the manuscript.
Funding
This research was funded by the Technology Innovation 2030—Major Project for Agricultural Biotechnology Breeding (2022ZD0401504).
Institutional Review Board Statement
Not applicable.
Informed Consent Statement
Not applicable.
Data Availability Statement
All data generated or analyzed during this study are included in this published article.
Acknowledgments
The authors would like to acknowledge the members of Jilin Provincial Key Laboratory of Tree and Grass Genetics and Breeding for their assistance during laboratory work and for their participation in fruitful discussion.
Conflicts of Interest
The authors declare no conflicts of interest.
References
- Chen, J.; Song, Y.; Zhang, H.; Zhang, D. Genome-Wide Analysis of Gene Expression in Response to Drought Stress in Populus simonii. Plant Mol. Blol. Rep. 2013, 31, 946–962. [Google Scholar] [CrossRef]
- Meng, S.; Zhang, C.; Su, L.; Li, Y.; Zhao, Z. Nitrogen Uptake and Metabolism of Populus simonii in Response to PEG-Induced Drought Stress. Environ. Exp. Bot. 2016, 123, 78–87. [Google Scholar] [CrossRef]
- Wei, Z.; Du, Q.; Zhang, J.; Li, B.; Zhang, D. Genetic Diversity and Population Structure in Chinese Indigenous Poplar (Populus simonii) Populations Using Microsatellite Markers. Plant Mol. Biol. Rep. 2013, 31, 620–632. [Google Scholar] [CrossRef]
- Zhang, D.; Ritonga, F.N.; Siqin, T.; Song, R.; Zhang, Z.; Tang, M.; Sun, P.; Gao, W. Comprehensive Overview of Populus simonii Research in the Recent Years. Open J. Ecol. 2024, 14, 419–434. [Google Scholar] [CrossRef]
- Hamid, M. Potential Applications of Peroxidases. Food Chem. 2009, 115, 1177–1186. [Google Scholar] [CrossRef]
- Chanwun, T.; Muhamad, N.; Chirapongsatonkul, N.; Churngchow, N. Hevea Brasiliensis Cell Suspension Peroxidase: Purification, Characterization and Application for Dye Decolorization. AMB Express 2013, 3, 14. [Google Scholar] [CrossRef]
- Davies, K.J.A. Oxidative Stress, Antioxidant Defenses, and Damage Removal, Repair, and Replacement Systems. Iubmb Life 2000, 50, 279–289. [Google Scholar] [CrossRef]
- Rojkind, M.; Dominguez-Rosales, J.A.; Nieto, N.; Greenwel, P. Role of Hydrogen Peroxide and Oxidative Stress in Healing Responses. Cell. Mol. Life Sci. 2002, 59, 1872–1891. [Google Scholar] [CrossRef]
- Pandey, V.P.; Awasthi, M.; Singh, S.; Tiwari, S.; Dwivedi, U. A Comprehensive Review on Function and Application of Plant Peroxidases. Anal. Biochem. 2017, 6, 308. [Google Scholar] [CrossRef]
- Welinder, K.G. Superfamily of Plant, Fungal and Bacterial Peroxidases. Curr. Opin. Struct. Biol. 1992, 2, 388–393. [Google Scholar] [CrossRef]
- Passardi, F.; Longet, D.; Penel, C.; Dunand, C. The Class III Peroxidase Multigenic Family in Rice and Its Evolution in Land Plants. Phytochemistry 2004, 65, 1879–1893. [Google Scholar] [CrossRef] [PubMed]
- Shigeto, J.; Tsutsumi, Y. Diverse Functions and Reactions of Class III Peroxidases. New Phytol. 2016, 209, 1395–1402. [Google Scholar] [CrossRef]
- Gao, C.; Wang, Y.; Liu, G.; Wang, C.; Jiang, J.; Yang, C. Cloning of Ten Peroxidase (POD) Genes from Tamarix Hispida and Characterization of Their Responses to Abiotic Stress. Plant Mol. Biol. Rep. 2010, 28, 77–89. [Google Scholar] [CrossRef]
- Mei, W.; Qin, Y.; Song, W.; Li, J.; Zhu, Y. Cotton GhPOX1 Encoding Plant Class III Peroxidase May be Responsible for the High Level of Reactive Oxygen Species Production That Is Related to Cotton Fiber Elongation. Int. J. Genet. Genom. 2009, 36, 141–150. [Google Scholar] [CrossRef] [PubMed]
- Martinez-Rubio, R.; Acebes, J.L.; Encina, A.; Karkonen, A. Class III Peroxidases in Cellulose Deficient Cultured Maize Cells During Cell Wall Remodeling. Plant Physiol. 2018, 164, 45–55. [Google Scholar] [CrossRef]
- Delannoy, E.; Jalloul, A.; Assigbetse, K.; Marmey, P.; Geiger, J.P.; Lherminier, J.; Daniel, J.F.; Martinez, C.; Nicole, M. Activity of Class III Peroxidases in the Defense of Cotton to Bacterial Blight. Mol. Plant-Microbe Interact. 2003, 16, 1030–1038. [Google Scholar] [CrossRef] [PubMed]
- Racz, A.; Hideg, E.; Czegeny, G. Selective Responses of Class III Plant Peroxidase Isoforms to Environmentally Relevant UV-B Doses. J. Plant Physiol. 2018, 221, 101–106. [Google Scholar] [CrossRef]
- Tognolli, M.; Penel, C.; Greppin, H.; Simon, P. Analysis and Expression of the Class III Peroxidase Large Gene Family in Arabidopsis thaliana. Genes 2002, 288, 129–138. [Google Scholar] [CrossRef]
- Zhang, Z.; Xin, W.; Wang, S.; Zhang, X.; Dai, H.; Sun, R.; Frazier, T.; Zhang, B.; Wang, Q. Xylem Sap in Cotton Contains Proteins That Contribute to Environmental Stress Response and Cell Wall Development. Funct. Integr. Genom. 2015, 15, 17–26. [Google Scholar] [CrossRef]
- Ren, L.-L.; Liu, Y.-J.; Liu, H.-J.; Qian, T.-T.; Qi, L.-W.; Wang, X.-R.; Zeng, Q.-Y. Subcellular Relocalization and Positive Selection Play Key Roles in the Retention of Duplicate Genes of Populus Class III Peroxidase Family. Plant Cell 2014, 26, 2404–2419. [Google Scholar] [CrossRef]
- Cai, K.; Liu, H.; Chen, S.; Liu, Y.; Zhao, X.; Chen, S. Genome-wide Identification and Analysis of Class III Peroxidases in Betula pendula. BMC Genom. 2021, 22, 314. [Google Scholar] [CrossRef]
- Wang, Y.; Wang, Q.; Zhao, Y.; Han, G.; Zhu, S. Systematic Analysis of Maize Class III Peroxidase Gene Family Reveals a Conserved Subfamily Involved in Abiotic Stress Response. Genes 2015, 566, 95–108. [Google Scholar] [CrossRef] [PubMed]
- Wu, C.; Ding, X.; Ding, Z.; Tie, W.; Yan, Y.; Wang, Y.; Yang, H.; Hu, W. The Class III Peroxidase (POD) Gene Family in Cassava: Identification, Phylogeny, Duplication, and Expression. Int. J. Mol. Sci. 2019, 20, 2730. [Google Scholar] [CrossRef] [PubMed]
- Yang, J.; Chen, R.; Xiang, X.; Liu, W.; Fan, C. Genome-Wide Identification and Expression Analysis of the Class III Peroxidase Gene Family under Abiotic Stresses in Litchi (Litchi chinensis Sonn.). Int. J. Mol. Sci. 2024, 25, 5804. [Google Scholar] [CrossRef]
- Cao, Y.; Han, Y.; Meng, D.; Li, D.; Jin, Q.; Lin, Y.; Cai, Y. Structural, Evolutionary, and Functional Analysis of the Class III Peroxidase Gene Family in Chinese Pear (Pyrus bretschneideri). Front. Plant Sci. 2016, 7, 1874. [Google Scholar] [CrossRef]
- Cai, K.; Zhao, Q.; Zhang, J.; Yuan, H.; Li, H.; Han, L.; Li, X.; Li, K.; Jiang, T.; Zhao, X. Unraveling the Guardians of Growth: A Comprehensive Analysis of the Aux/IAA and ARF Gene Families in Populus simonii. Plants 2023, 12, 3566. [Google Scholar] [CrossRef]
- Song, Y.; Ci, D.; Tian, M.; Zhang, D. Comparison of the Physiological Effects and Transcriptome Responses of Populus simonii under Different Abiotic Sresses. Plant Mol. Biol. 2014, 86, 139–156. [Google Scholar] [CrossRef]
- Chen, C.; Chen, H.; Zhang, Y.; Thomas, H.R.; Frank, M.H.; He, Y.; Xia, R. TBtools: An Integrative Yoolkit Developed for Interactive Analyses of Big Biological Data. Mol. Plant 2020, 13, 1194–1202. [Google Scholar] [CrossRef]
- Zhang, X.; Xue, L.; Chen, R.; Ma, Q.; Ma, D.; Liu, X. Genome-wide Identification of the Cytochrome P450 Family and Analysis of CYP Regarding Salt Tolerance in Medicago sativa L. Grass Res. 2023, 3, 21. [Google Scholar] [CrossRef]
- Tamura, K.; Stecher, G.; Kumar, S. MEGA11: Molecular Evolutionary Genetics Analysis Version 11. Mol. Biol. Evol. 2021, 38, 3022–3027. [Google Scholar] [CrossRef]
- Lescot, M.; Dehais, P.; Thijs, G.; Marchal, K.; Moreau, Y.; Van de Peer, Y.; Rouze, P.; Rombauts, S. PlantCARE, A Database of Plant Cis-acting Regulatory Elements and A Portal to Tools for in Silico Analysis of Promoter Sequences. Nucleic Acids Res. 2002, 30, 325–327. [Google Scholar] [CrossRef] [PubMed]
- Chen, S.; Zhou, Y.; Chen, Y.; Gu, J. Fastp: An Ultra-Fast All-in-One FASTQ Preprocessor. Bioinformatics 2018, 34, 884–890. [Google Scholar] [CrossRef]
- Kim, D.; Paggi, J.M.; Park, C.; Bennett, C.; Salzberg, S.L. Graph-Based Genome Alignment and Genotyping with HISAT2 and HISAT-Genotype. Nat. Biotechnol. 2019, 37, 907–915. [Google Scholar] [CrossRef]
- Liao, Y.; Smyth, G.K.; Shi, W. FeatureCounts: An Efficient General Purpose Program for Assigning Sequence Reads to Genomic Features. Bioinformatics 2014, 30, 923–930. [Google Scholar] [CrossRef]
- Smoot, M.E.; Ono, K.; Ruscheinski, J.; Wang, P.-L.; Ideker, T. Cytoscape 2.8: New Features for Data Integration and Network Visualization. Bioinformatics 2011, 27, 431–432. [Google Scholar] [CrossRef]
- Regier, N.; Frey, B. Experimental Comparison of Relative RT-qPCR Quantification Approaches for Gene Expression Studies in Poplar. BMC Mol. Biol. 2010, 11, 57. [Google Scholar] [CrossRef]
- Pfaffl, M.W. A New Mathematical Model for Relative Quantification in Real-Tme RT–PCR. Nucleic Acids Res. 2001, 29, e45. [Google Scholar] [CrossRef] [PubMed]
- Liu, G.; Li, Y.; Liu, Y.; Guo, H.; Guo, J.; Du, Y.; Chen, Y.; Yu, C.; Zhong, F.; Lian, B.; et al. Genome-Wide Identification and Analysis of Monolignol Biosynthesis Genes in Salix matsudana Koidz and Their Relationship to Accelerated Growth. For. Res. 2021, 1, 8. [Google Scholar] [CrossRef]
- Kidwai, M.; Ahmad, I.Z.; Chakrabarty, D. Class III Peroxidase: An Indispensable Enzyme for Biotic/Abiotic Stress Tolerance and A Potent Candidate for Crop Improvement. Plant Cell Rep. 2020, 39, 1381–1393. [Google Scholar] [CrossRef]
- Li, Q.; Dou, W.; Qi, J.; Qin, X.; Chen, S.; He, Y. Genomewide Analysis of the CIII Peroxidase Family in Sweet Orange (Citrus sinensis) and Expression Profiles Induced by Xanthomonas Citri Subsp. Citri and Hormones. J. Genet. 2020, 99, 10. [Google Scholar] [CrossRef]
- Meng, G.; Fan, W.; Rasmussen, S.K. Characterisation of the Class III Peroxidase Gene Family in Carrot Taproots and Its Role in Anthocyanin and Lignin Accumulation. Plant Physiol. Biochem. 2021, 167, 245–256. [Google Scholar] [CrossRef]
- Vishwakarma, H.; Sharma, S.; Panzade, K.P.; Kharate, P.S.; Kumar, A.; Singh, N.; Avashthi, H.; Rangan, P.; Singh, A.K.; Singh, A. Genome-Wide Analysis of the Class III Peroxidase Gene Family in Sesame and SiPRXs Gene Validation by Expression Analysis under Drought Stress. Plant Stress 2024, 11, 100367. [Google Scholar] [CrossRef]
- Bailey-Serres, J.; Mittler, R. The Roles of Reactive Oxygen Species in Plant Cells. Plant Physiol. 2006, 141, 311. [Google Scholar] [CrossRef]
- Zhao, Y.; Zhao, H.; Wang, Y.; Zhang, X.; Zhao, X.; Yuan, Z. Genome-Wide Identification and Expression Analysis of MIKC-Type MADS-Box Gene Family in Punica granatum L. Agronomy 2020, 10, 1197. [Google Scholar] [CrossRef]
- Leng, X.; Wang, H.; Zhang, S.; Qu, C.; Yang, C.; Xu, Z.; Liu, G. Identification and Characterization of the APX Gene Family and Its Expression Pattern Under Phytohormone Treatment and Abiotic Stress in Populus trichocarpa. Genes 2021, 12, 334. [Google Scholar] [CrossRef]
- Gonzalez-Gordo, S.; Munoz-Vargas, M.A.; Palma, J.M.; Corpas, F.J. Class III Peroxidases (POD) in Pepper (Capsicum annuum L.): Genome-Wide Identification and Regulation During Nitric Oxide (NO)-Influenced Fruit Ripening. Antioxidants 2023, 12, 1013. [Google Scholar] [CrossRef]
- Cheng, L.; Ma, L.; Meng, L.; Shang, H.; Cao, P.; Jin, J. Genome-Wide Identification and Analysis of the Class III Peroxidase Gene Family in Tobacco (Nicotiana tabacum). Front. Genet. 2022, 13, 916867. [Google Scholar] [CrossRef]
- Buccitelli, C.; Selbach, M. MRNAs, Proteins and the Emerging Principles of Gene Expression Control. Nat. Rev. Genet. 2020, 21, 630–644. [Google Scholar] [CrossRef]
- Jabeen, R.; Iqbal, A.; Deeba, F.; Zulfiqar, F.; Mustafa, G.; Nawaz, H.; Habiba, U.; Nafees, M.; Zaid, A.; Siddique, K.H. Isolation and Characterization of Peroxidase P7-Like Gene and Rab-GDI Like Gene from Potential Medicinal Plants: A Step Toward Understanding Cell Defense Signaling. Front. Plant Sci. 2022, 13, 975852. [Google Scholar] [CrossRef]
- Fagerstedt, K.V.; Kukkola, E.M.; Koistinen, V.V.T.; Takahashi, J.; Marjamaa, K. Cell Wall Lignin is Polymerised by Class III Secretable Plant Peroxidases in Norway Spruce. J. Integr. Plant Biol. 2010, 52, 186–194. [Google Scholar] [CrossRef]
- Yang, T.; Zhang, P.; Pan, J.; Amanullah, S.; Luan, F.; Han, W.; Liu, H.; Wang, X. Genome-Wide Analysis of the Peroxidase Gene Family and Verification of Lignin Synthesis-Related Genes in Watermelon. Int. J. Mol. Sci. 2022, 23, 642. [Google Scholar] [CrossRef] [PubMed]
- Zhang, H.; Zhu, J.; Gong, Z.; Zhu, J.K. Abiotic stress responses in plants. Nat. Rev. Genet. 2022, 23, 104–119. [Google Scholar] [CrossRef] [PubMed]
- Liang, D.; Ali, M.M.; Alam, S.; Huang, X.; YOUSEF, A.F.; Mosa, W.F.; Orhan, E.; Lin, Z.; Chen, F. Genome-Wide Analysis of Peroxidase Genes in Passion Fruit (Passiflora edulis Sims.) and Their Expression Patterns Induced by Root Colonization of Piriformospora Indica under Cold Stress. Turk. J. Agric. For. 2022, 46, 496–508. [Google Scholar] [CrossRef]
- Xiao, H.; Wang, C.; Khan, N.; Chen, M.; Fu, W.; Guan, L.; Leng, X. Genome-Wide Identification of the Class III POD Gene Family and Their Expression Profiling in Grapevine (Vitis vinifera L.). BMC Genom. 2020, 21, 444. [Google Scholar] [CrossRef]
- Jacob, P.; Hirt, H.; Bendahmane, A. The Heat-Shock Protein/chaperone Network and Multiple Stress Resistance. Plant Biotechnol. J. 2017, 15, 405–414. [Google Scholar] [CrossRef]
Disclaimer/Publisher’s Note: The statements, opinions and data contained in all publications are solely those of the individual author(s) and contributor(s) and not of MDPI and/or the editor(s). MDPI and/or the editor(s) disclaim responsibility for any injury to people or property resulting from any ideas, methods, instructions or products referred to in the content. |
© 2025 by the authors. Licensee MDPI, Basel, Switzerland. This article is an open access article distributed under the terms and conditions of the Creative Commons Attribution (CC BY) license (https://creativecommons.org/licenses/by/4.0/).