
Exploring the Relationship between Antioxidant Enzymes, Oxidative Stress Markers, and Clinical Profile in Relapsing–Remitting Multiple Sclerosis

 ,
, 
Abstract
:1. Introduction
2. Materials and Methods
Statistics
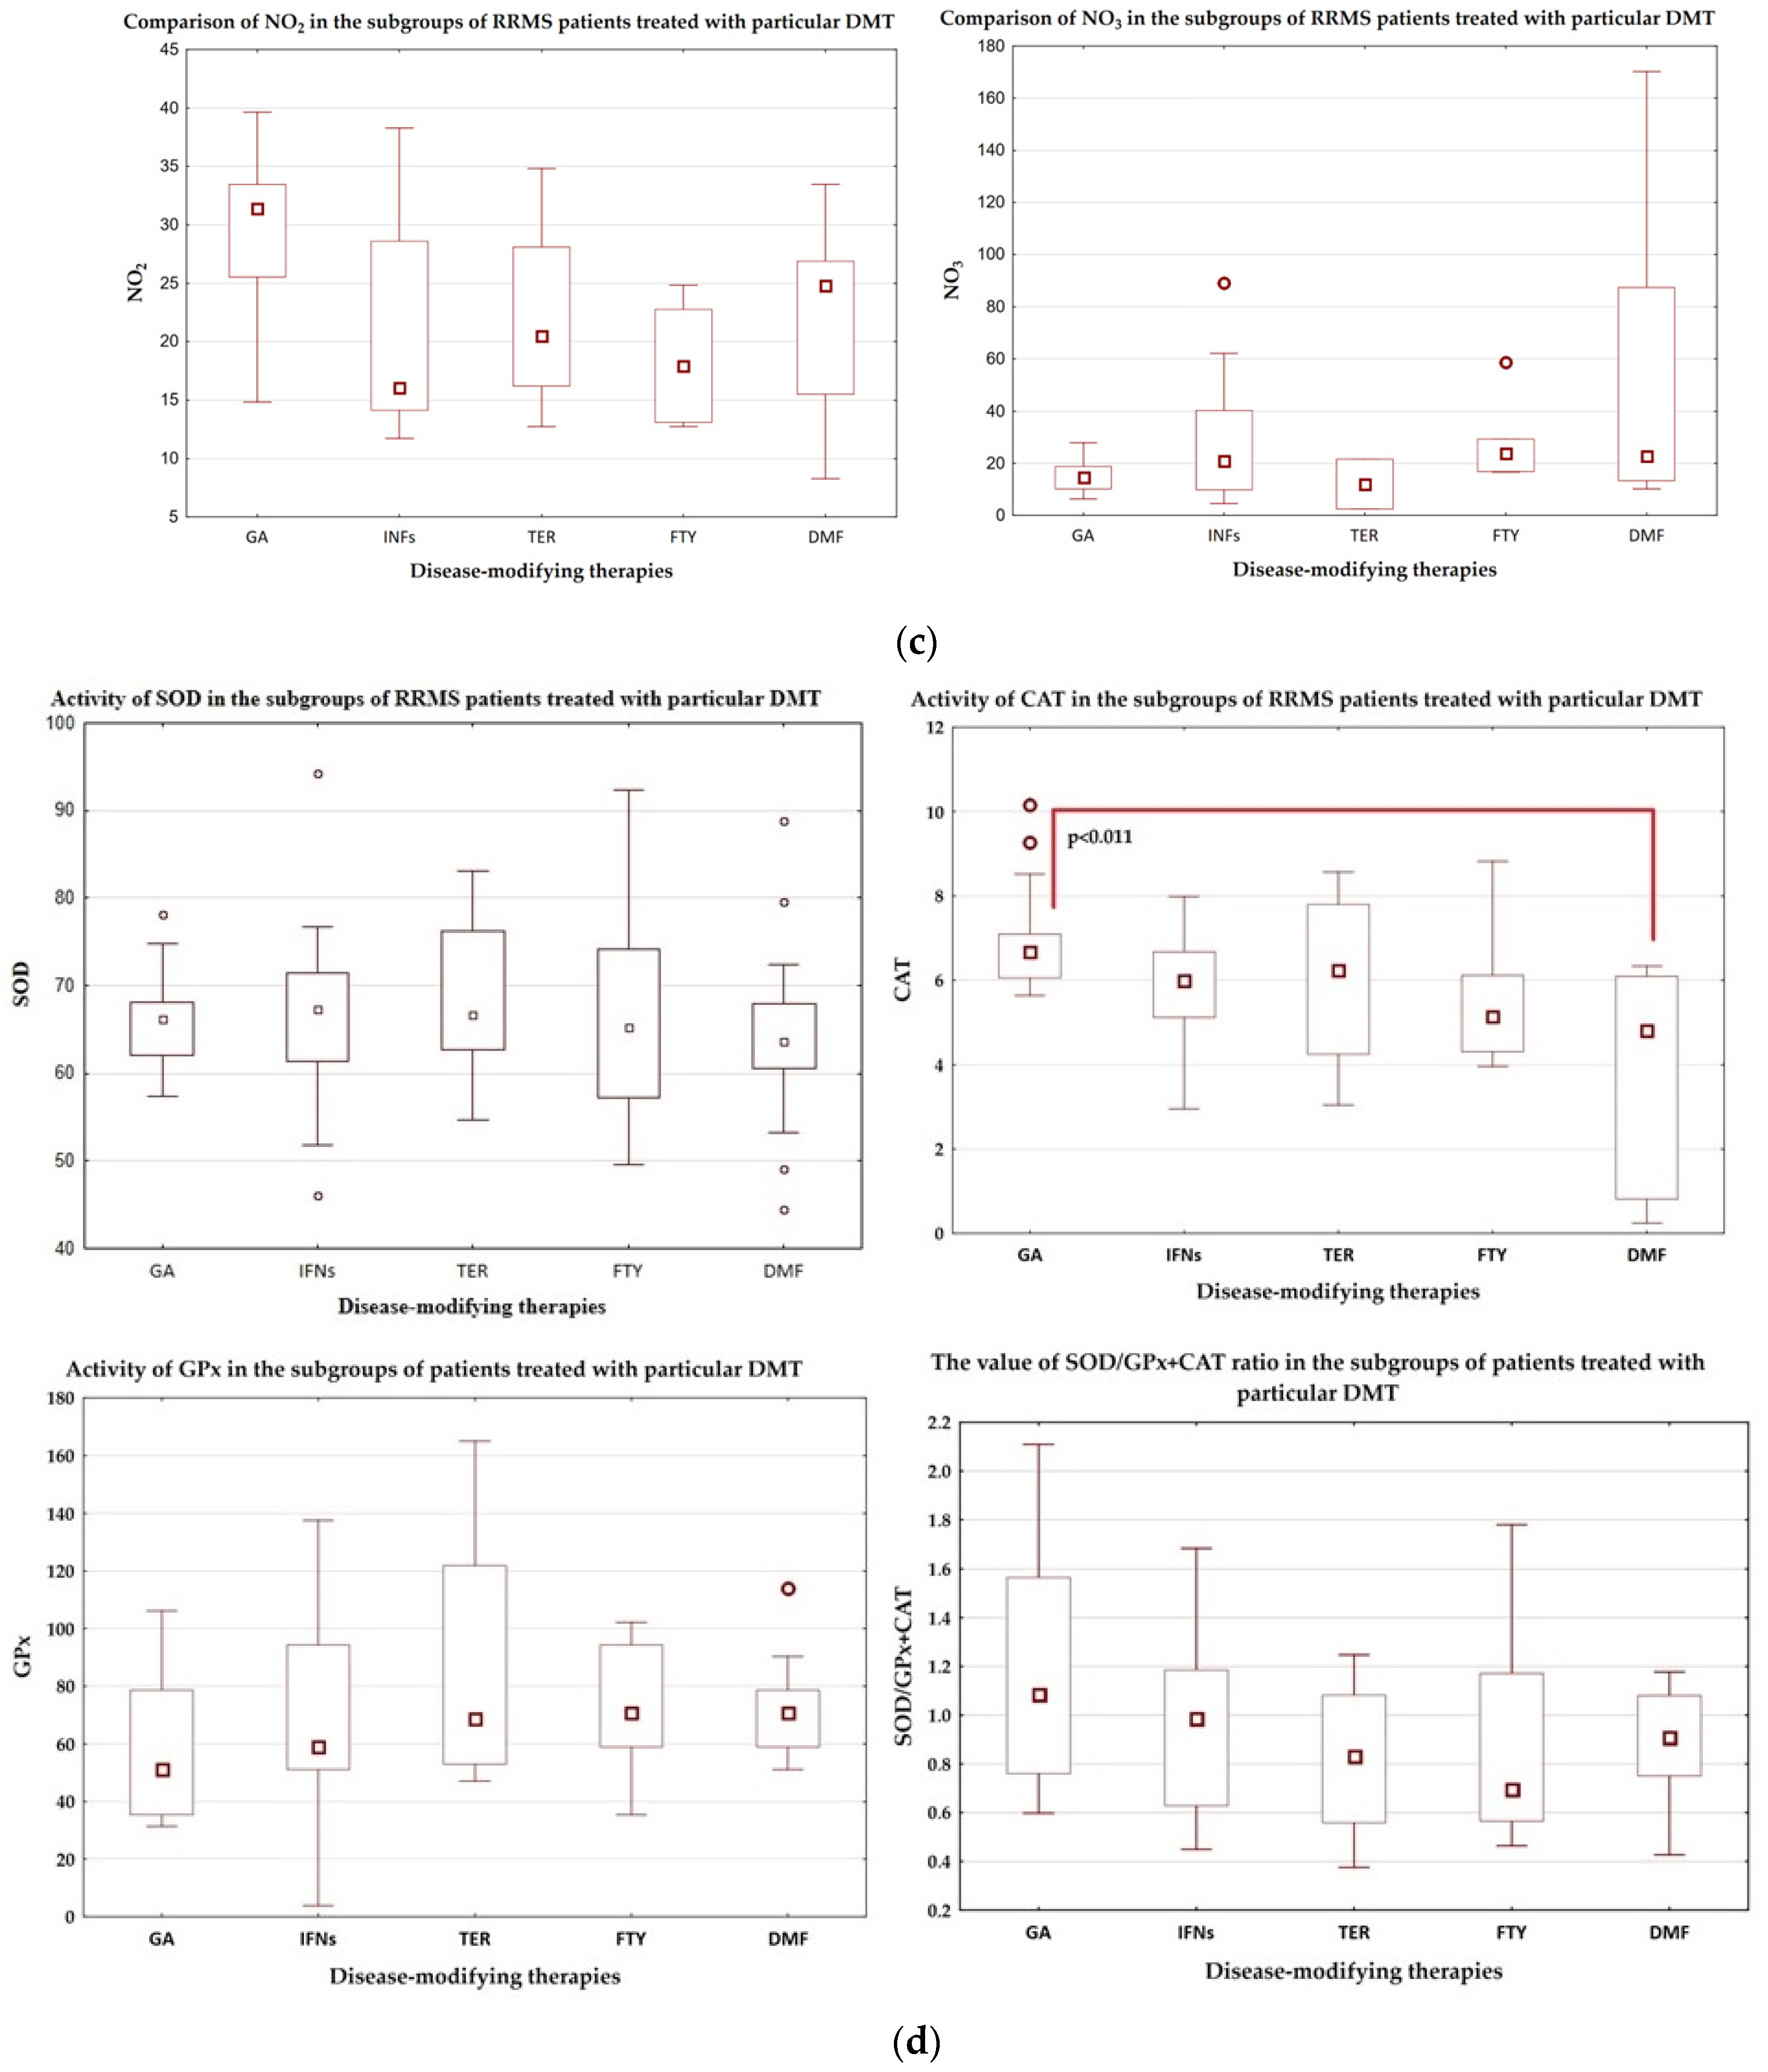
3. Results
4. Discussion
5. Conclusions
Author Contributions
Funding
Institutional Review Board Statement
Informed Consent Statement
Data Availability Statement
Conflicts of Interest
References
- Filippi, M.; Bar-Or, A.; Piehl, F.; Preziosa, P.; Solari, A.; Vukusic, S.; Rocca, M.A. Multiple Sclerosis. Nat. Rev. Dis. Primers 2018, 4, 43. [Google Scholar] [CrossRef]
- Ohl, K.; Tenbrock, K.; Kipp, M. Oxidative Stress in Multiple Sclerosis: Central and Peripheral Mode of Action. Exp. Neurol. 2016, 277, 58–67. [Google Scholar] [CrossRef]
- Lassmann, H.; van Horssen, J. Oxidative Stress and Its Impact on Neurons and Glia in Multiple Sclerosis Lesions. Biochim. Biophys. Acta 2016, 1862, 506–510. [Google Scholar] [CrossRef]
- Vallières, C.; Golinelli-Cohen, M.-P.; Guittet, O.; Lepoivre, M.; Huang, M.-E.; Vernis, L. Redox-Based Strategies against Infections by Eukaryotic Pathogens. Genes 2023, 14, 778. [Google Scholar] [CrossRef] [PubMed]
- Rosa, A.C.; Corsi, D.; Cavi, N.; Bruni, N.; Dosio, F. Superoxide Dismutase Administration: A Review of Proposed Human Uses. Molecules 2021, 26, 1844. [Google Scholar] [CrossRef] [PubMed]
- Irato, P.; Santovito, G. Enzymatic and Non-Enzymatic Molecules with Antioxidant Function. Antioxidants 2021, 10, 579. [Google Scholar] [CrossRef]
- Wang, Y.; Branicky, R.; Noë, A.; Hekimi, S. Superoxide Dismutases: Dual Roles in Controlling ROS Damage and Regulating ROS Signaling. J. Cell Biol. 2018, 217, 1915–1928. [Google Scholar] [CrossRef]
- Alfonso-Prieto, M.; Biarnés, X.; Vidossich, P.; Rovira, C. The Molecular Mechanism of the Catalase Reaction. J. Am. Chem. Soc. 2009, 131, 11751–11761. [Google Scholar] [CrossRef] [PubMed]
- Lubos, E.; Loscalzo, J.; Handy, D.E. Glutathione Peroxidase-1 in Health and Disease: From Molecular Mechanisms to Therapeutic Opportunities. Antioxid. Redox Signal 2011, 15, 1957–1997. [Google Scholar] [CrossRef]
- Weydert, C.J.; Cullen, J.J. Measurement of Superoxide Dismutase, Catalase and Glutathione Peroxidase in Cultured Cells and Tissue. Nat. Protoc. 2010, 5, 51–66. [Google Scholar] [CrossRef]
- Melo, D.; Coimbra, S.; Rocha, S.; Santos-Silva, A. Inhibition of Erythrocyte’s Catalase, Glutathione Peroxidase or Peroxiredoxin 2—Impact on Cytosol and Membrane. Arch. Biochem. Biophys. 2023, 739, 109569. [Google Scholar] [CrossRef] [PubMed]
- de Toledo, J.H.D.S.; Fraga-Silva, T.F.d.C.; Borim, P.A.; de Oliveira, L.R.C.; Oliveira, E.d.S.; Périco, L.L.; Hiruma-Lima, C.A.; de Souza, A.A.L.; de Oliveira, C.A.F.; Padilha, P.d.M.; et al. Organic Selenium Reaches the Central Nervous System and Downmodulates Local Inflammation: A Complementary Therapy for Multiple Sclerosis? Front. Immunol. 2020, 11, 571844. [Google Scholar] [CrossRef] [PubMed]
- Solovyev, N.D. Importance of Selenium and Selenoprotein for Brain Function: From Antioxidant Protection to Neuronal Signalling. J. Inorg. Biochem. 2015, 153, 1–12. [Google Scholar] [CrossRef] [PubMed]
- Yu, H.; Ge, Y.; Wang, Y.; Lin, C.-T.; Li, J.; Liu, X.; Zang, T.; Xu, J.; Liu, J.; Luo, G.; et al. A Fused Selenium-Containing Protein with Both GPx and SOD Activities. Biochem. Biophys. Res. Commun. 2007, 358, 873–878. [Google Scholar] [CrossRef]
- de Haan, J.B.; Cristiano, F.; Iannello, R.C.; Kola, I. Cu/Zn-Superoxide Dismutase and Glutathione Peroxidase during Aging. Biochem. Mol. Biol. Int. 1995, 35, 1281–1297. [Google Scholar]
- Obradovic, D.; Andjelic, T.; Ninkovic, M.; Dejanovic, B.; Kotur-Stevuljevic, J. Superoxide Dismutase (SOD), Advanced Oxidation Protein Products (AOPP), and Disease-Modifying Treatment Are Related to Better Relapse Recovery after Corticosteroid Treatment in Multiple Sclerosis. Neurol. Sci. 2021, 42, 3241–3247. [Google Scholar] [CrossRef]
- Thompson, A.J.; Banwell, B.L.; Barkhof, F.; Carroll, W.M.; Coetzee, T.; Comi, G.; Correale, J.; Fazekas, F.; Filippi, M.; Freedman, M.S.; et al. Diagnosis of Multiple Sclerosis: 2017 Revisions of the McDonald Criteria. Lancet Neurol. 2018, 17, 162–173. [Google Scholar] [CrossRef]
- Dewar, D.; Underhill, S.M.; Goldberg, M.P. Oligodendrocytes and Ischemic Brain Injury. J. Cereb. Blood Flow. Metab. 2003, 23, 263–274. [Google Scholar] [CrossRef]
- Pegoretti, V.; Swanson, K.A.; Bethea, J.R.; Probert, L.; Eisel, U.L.M.; Fischer, R. Inflammation and Oxidative Stress in Multiple Sclerosis: Consequences for Therapy Development. Oxid. Med. Cell Longev. 2020, 2020, 7191080. [Google Scholar] [CrossRef]
- Zabłocka-Słowińska, K.; Skórska, K.; Placzkowska, S.; Prescha, A.; Pawełczyk, K.; Kosacka, M.; Porębska, I.; Grajeta, H. The Relationships between Glycemic Index and Glycemic Loadof Diets and Nutritional Status and Antioxidant/Oxidant Statusin the Serum of Patients with Lung Cancer. Adv. Clin. Exp. Med. 2019, 28, 1027–1036. [Google Scholar] [CrossRef]
- Bizoń, A.; Chojdak-Łukasiewicz, J.; Kołtuniuk, A.; Budrewicz, S.; Pokryszko-Dragan, A.; Piwowar, A. Evaluation of Selected Oxidant/Antioxidant Parameters in Patients with Relapsing-Remitting Multiple Sclerosis Undergoing Disease-Modifying Therapies. Antioxidants 2022, 11, 2416. [Google Scholar] [CrossRef] [PubMed]
- Tobore, T.O. Oxidative/Nitroxidative Stress and Multiple Sclerosis. J. Mol. Neurosci. 2021, 71, 506–514. [Google Scholar] [CrossRef] [PubMed]
- Moezzi, D.; Dong, Y.; Jain, R.W.; Lozinski, B.M.; Ghorbani, S.; D’Mello, C.; Wee Yong, V. Expression of Antioxidant Enzymes in Lesions of Multiple Sclerosis and Its Models. Sci. Rep. 2022, 12, 12761. [Google Scholar] [CrossRef] [PubMed]
- Tajouri, L.; Mellick, A.S.; Ashton, K.J.; Tannenberg, A.E.G.; Nagra, R.M.; Tourtellotte, W.W.; Griffiths, L.R. Quantitative and Qualitative Changes in Gene Expression Patterns Characterize the Activity of Plaques in Multiple Sclerosis. Mol. Brain Res. 2003, 119, 170–183. [Google Scholar] [CrossRef]
- Ljubisavljevic, S.; Stojanovic, I.; Cvetkovic, T.; Vojinovic, S.; Stojanov, D.; Stojanovic, D.; Stefanovic, N.; Pavlovic, D. Erythrocytes’ Antioxidative Capacity as a Potential Marker of Oxidative Stress Intensity in Neuroinflammation. J. Neurol. Sci. 2014, 337, 8–13. [Google Scholar] [CrossRef]
- Miller, E.; Walczak, A.; Majsterek, I.; Kędziora, J. Melatonin Reduces Oxidative Stress in the Erythrocytes of Multiple Sclerosis Patients with Secondary Progressive Clinical Course. J. Neuroimmunol. 2013, 257, 97–101. [Google Scholar] [CrossRef]
- Jensen, G.E.; Gissel-Nielsen, G.; Clausen, J. Leucocyte Glutathione Peroxidase Activity and Selenium Level in Multiple Sclerosis. J. Neurol. Sci. 1980, 48, 61–67. [Google Scholar] [CrossRef]
- Sarıkaya, E.; Doğan, S. Glutathione Peroxidase in Health and Diseases. In Glutathione System and Oxidative Stress in Health and Disease; Bagatini, M.D., Ed.; IntechOpen: London, UK, 2020; ISBN 978-1-83880-125-0. [Google Scholar]
- Ortiz, G.G.; Macías-Islas, M.Á.; Pacheco-Moisés, F.P.; Cruz-Ramos, J.A.; Sustersik, S.; Barba, E.A.; Aguayo, A. Oxidative Stress Is Increased in Serum from Mexican Patients with Relapsing-Remitting Multiple Sclerosis. Dis. Markers 2009, 26, 35–39. [Google Scholar] [CrossRef]
- Welker, A.F.; Moreira, D.C.; Hermes-Lima, M. Roles of Catalase and Glutathione Peroxidase in the Tolerance of a Pulmonate Gastropod to Anoxia and Reoxygenation. J. Comp. Physiol. B 2016, 186, 553–568. [Google Scholar] [CrossRef]
- Nandi, A.; Yan, L.-J.; Jana, C.K.; Das, N. Role of Catalase in Oxidative Stress- and Age-Associated Degenerative Diseases. Oxid. Med. Cell Longev. 2019, 2019, 9613090. [Google Scholar] [CrossRef]
- Al-Abrash, A.S.; Al-Quobaili, F.A.; Al-Akhras, G.N. Catalase Evaluation in Different Human Diseases Associated with Oxidative Stress. Saudi Med. J. 2000, 21, 826–830. [Google Scholar] [PubMed]
- Zhang, S.-Y.; Gui, L.-N.; Liu, Y.-Y.; Shi, S.; Cheng, Y. Oxidative Stress Marker Aberrations in Multiple Sclerosis: A Meta-Analysis Study. Front. Neurosci. 2020, 14, 823. [Google Scholar] [CrossRef] [PubMed]
- Seven, A.; Aslan, M.; Incir, S.; Altıntaş, A. Evaluation of oxidative and nitrosative stress in relapsing remitting multiple sclerosis: Effect of corticosteroid therapy. Folia Neuropathol. 2013, 51, 58–64. [Google Scholar] [CrossRef] [PubMed]


| Variable | Control Group | Patients with RRMS |
|---|---|---|
| Number of subjects | n = 29 | n = 158 |
| Sex [men/women] | 9/20 | 65/93 |
| Age [years] | 41.9 ± 10.1 41.0 (36.0–41.0) | 43.9 ± 9.7 43.0 (37.0–51.0) |
| Duration of RRMS [years] | N/A | 12.3 ± 6.4 12.0 (8.0–15.0) |
| EDSS | N/A | 2.8 ± 1.5 2.2 (1.5–3.5) |
| IL-6 [pg/mL] | 1.6 ± 2.0 0.9 (0.4–2.7) | 4.4 ± 7.1 2.1 (0.7–5.9) * |
| TOS [µM] | 44.0 ± 17.7 43.0 (38.0–48.0) | 58.4 ± 96.5 38.0 (23.0–53.0) |
| NO2 [µmol/L] | 6.6 ± 2.4 6.7 (5.9–7.6) | 11.6 ± 4.6 11.4 (7.43–15.5) * |
| NO3 [µmol/L] | 10.2 ± 8.0 8.3 (4.5–15.8) | 18.3 ± 28.5 10.4 (5.5–14.6) |
| LPO [µM] | 21.9 ± 19.0 16.4 (11.4–24.3) | 28.0 ± 40.1 18.7 (8.0–30.1) |
| TAS [µM] | 370.7 ± 61.5 387.9 (383.5–390.4) | 380.3 ± 43.9 385.5 (368.5–392.8) |
| OSI | 0.1 ± 0.0 0.11 (0.08–0.13) | 0.2 ± 0.3 0.10 (0.07–0.14) |
| SOD [U/L] | 65.6 ± 10.7 64.0 (59.8–69.5) | 66.6 ± 8.5 65.8 (61.9–71.5) |
| GPx [U/L] | 113.6 ± 71.1 98.2 (86.4–113.9) | 69.6 ± 28.4 66.8 (51.1–82.5) * |
| CAT [U/L] | 4.9 ± 1.4 5.1 (3.6–5.8) | 5.8 ± 1.8 6.0 (5.0–6.7) * |
| SOD/GPx + CAT | 0.6 ± 0.2 0.6 (0.6–0.7) | 1.2 ± 1.5 1.0 (0.7–1.2) * |
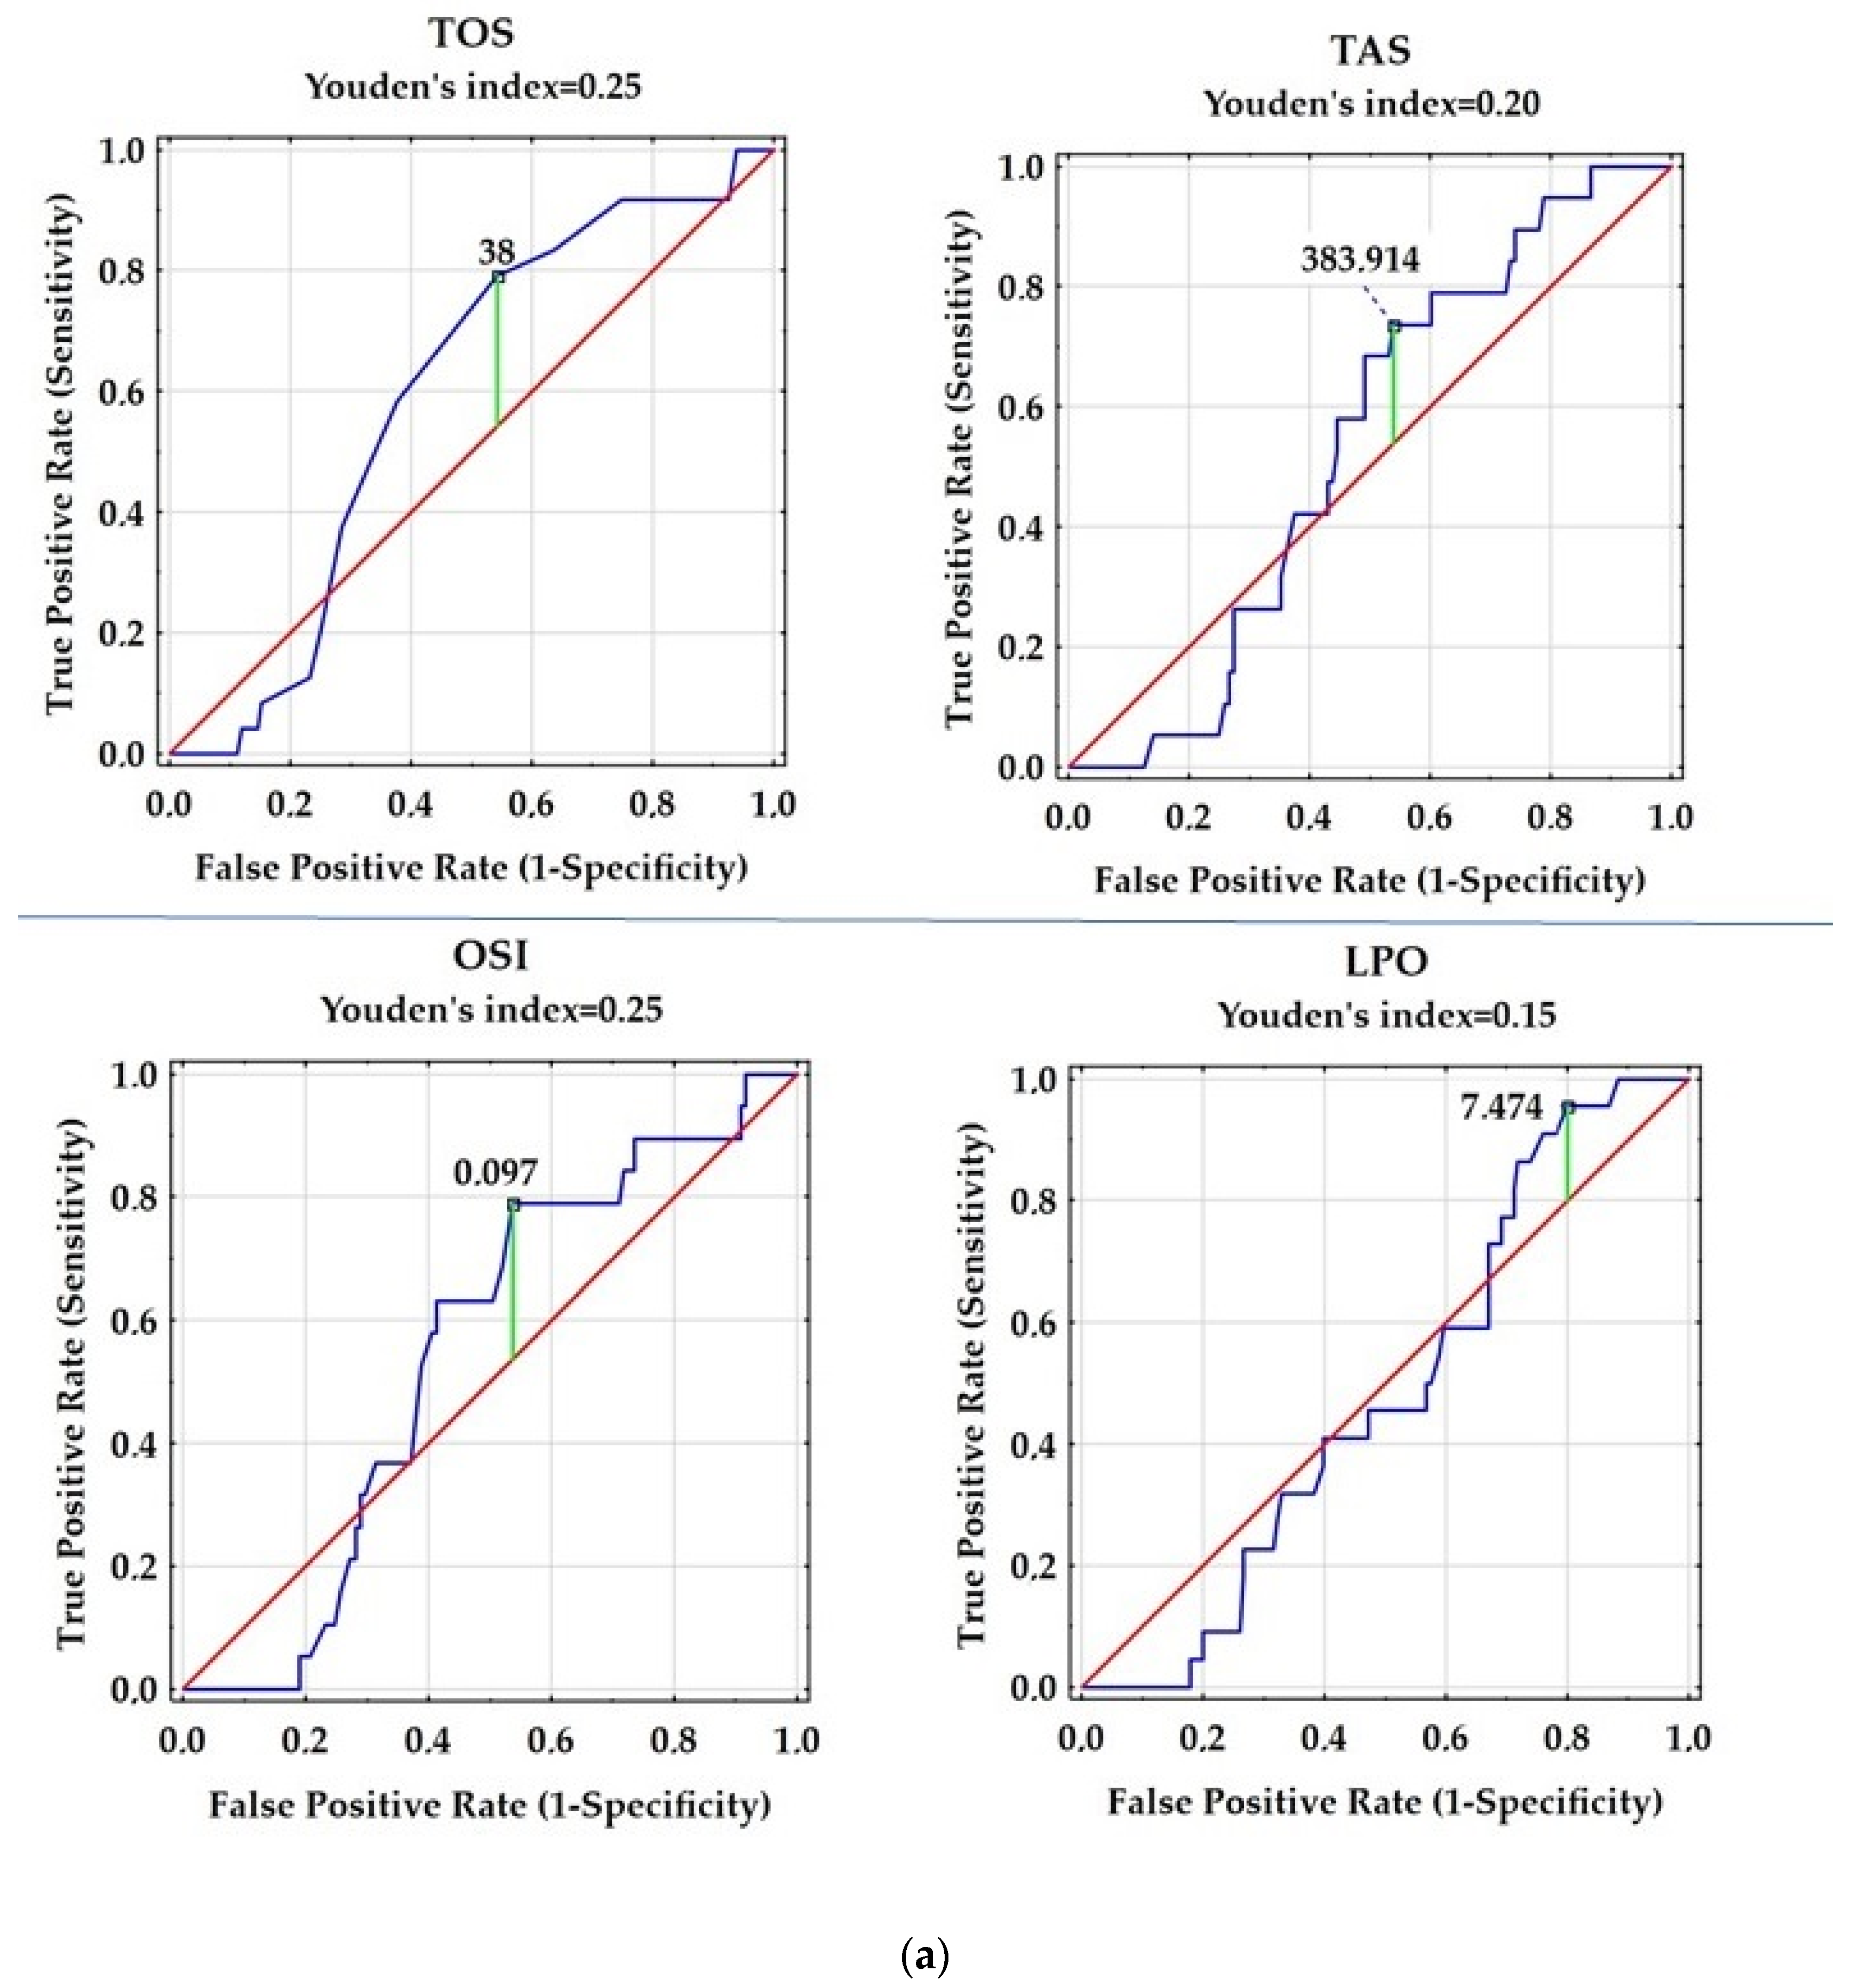
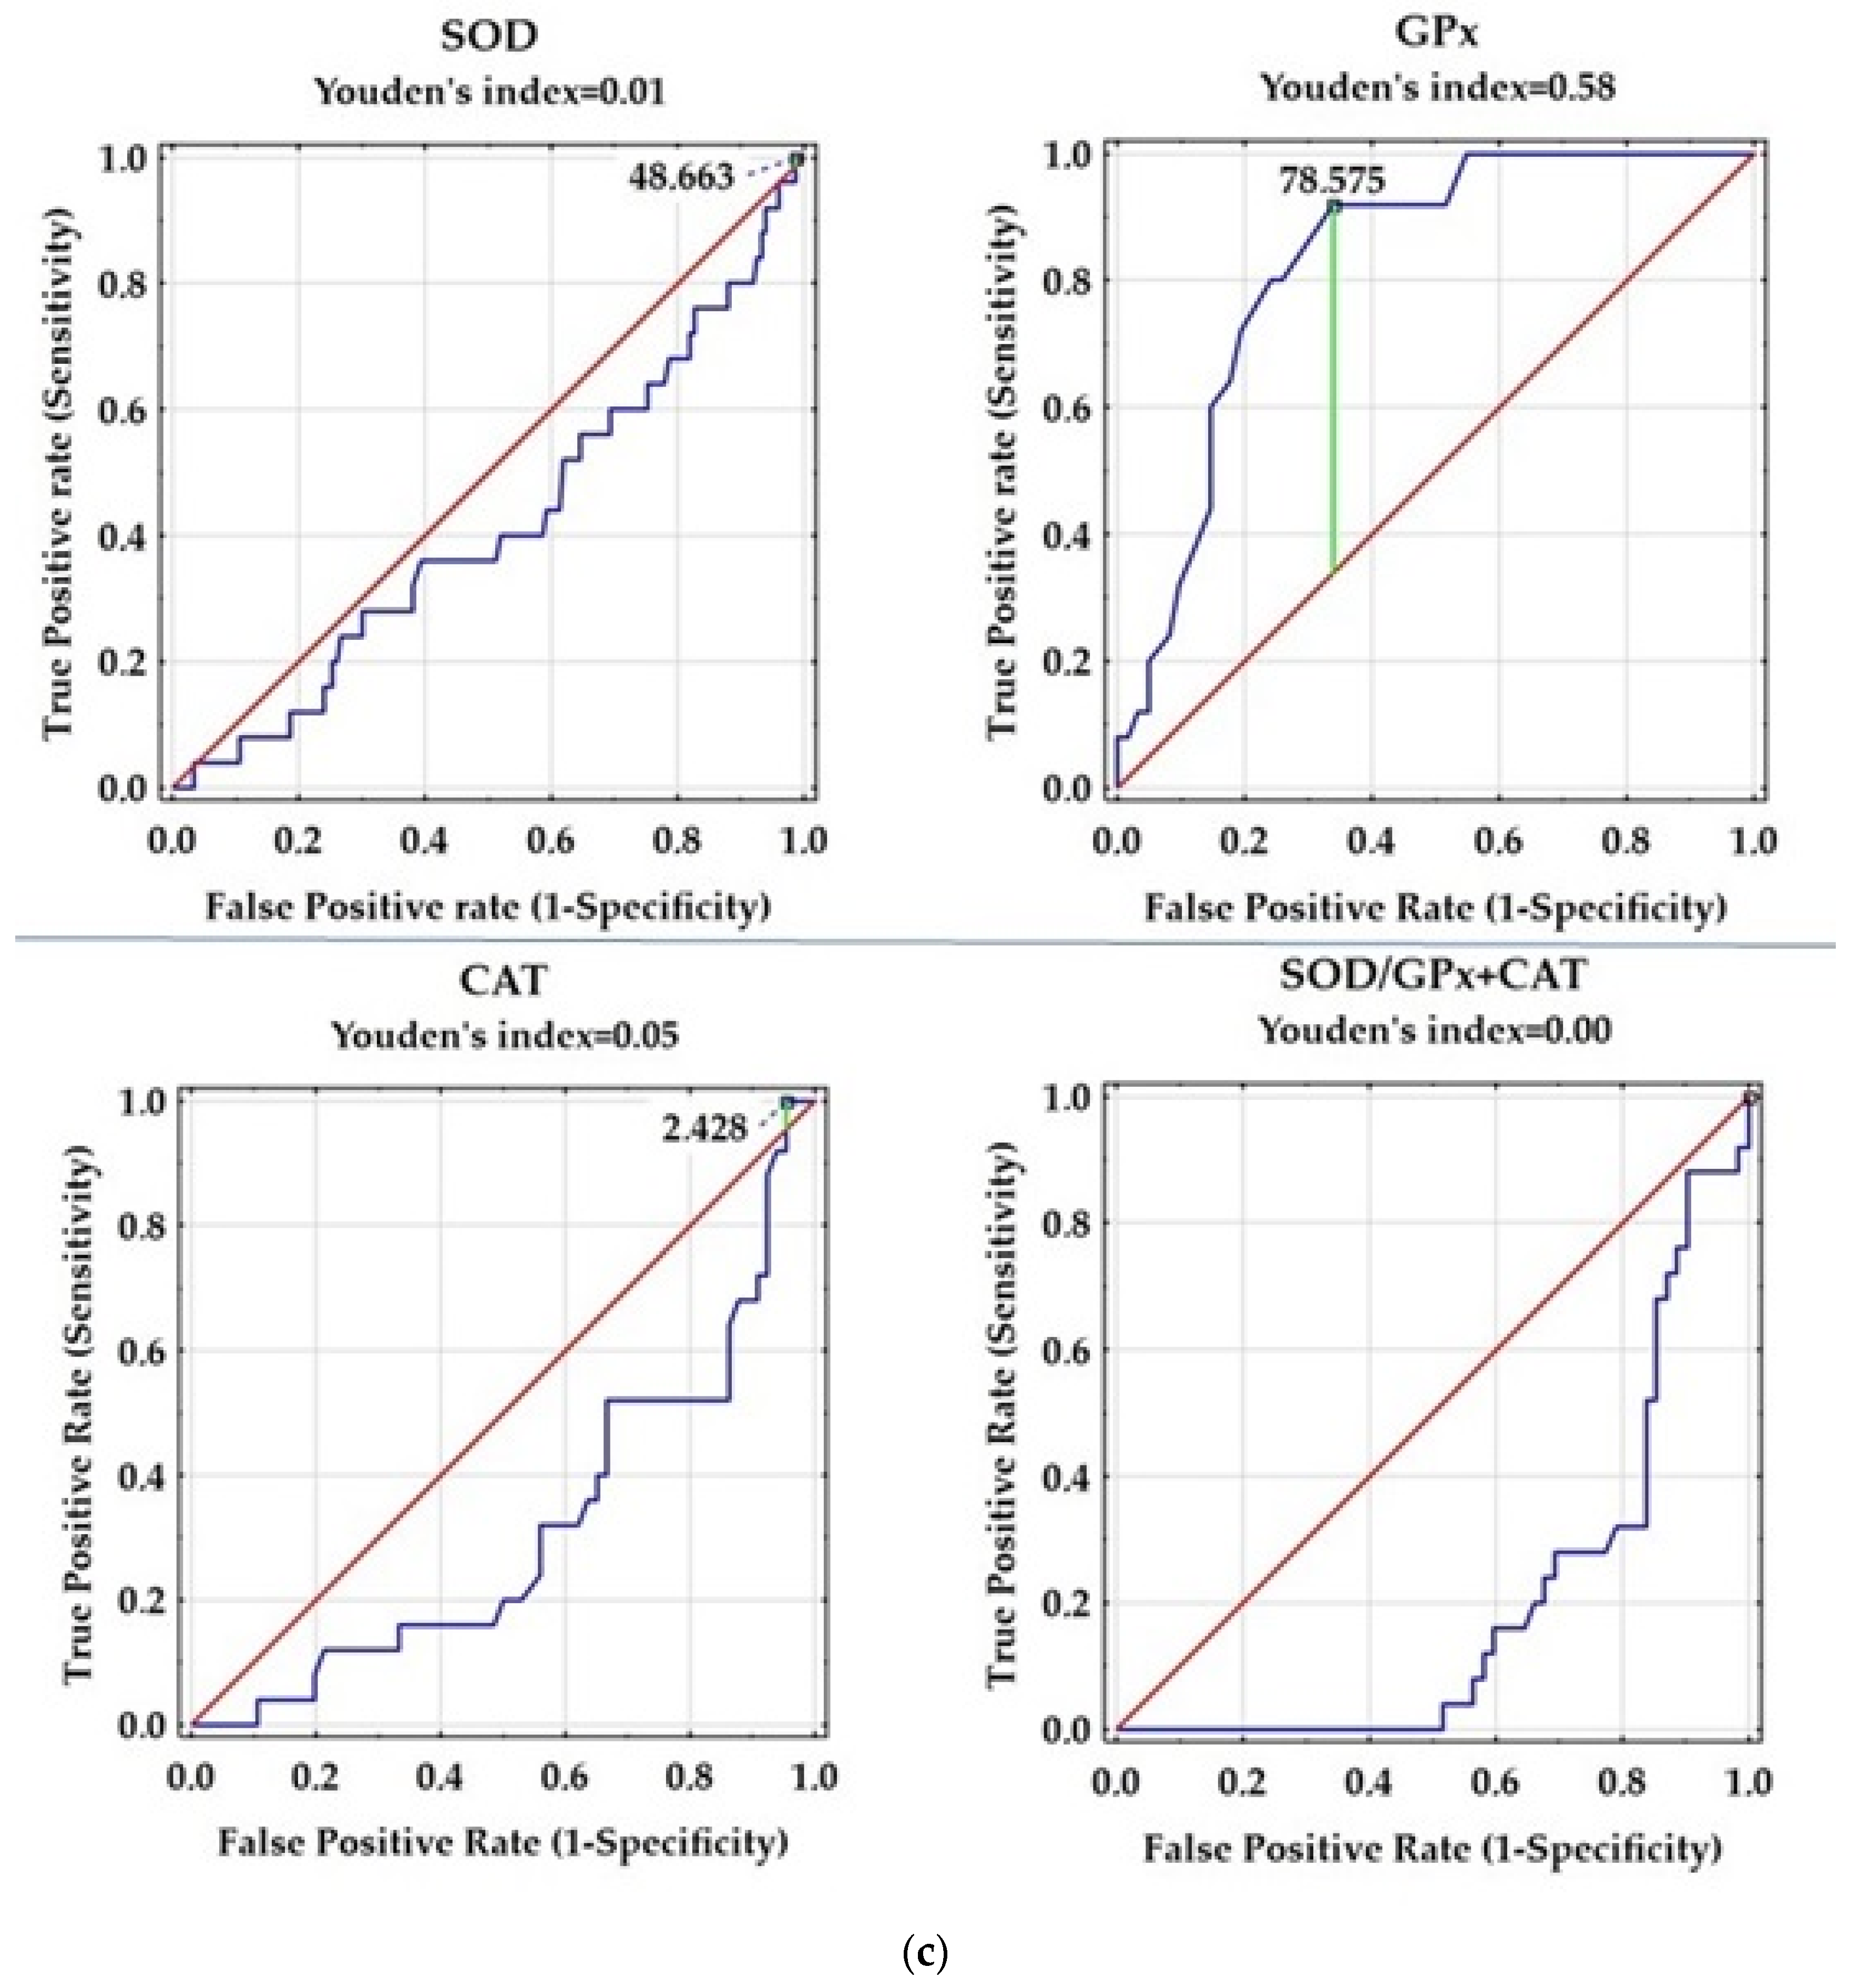
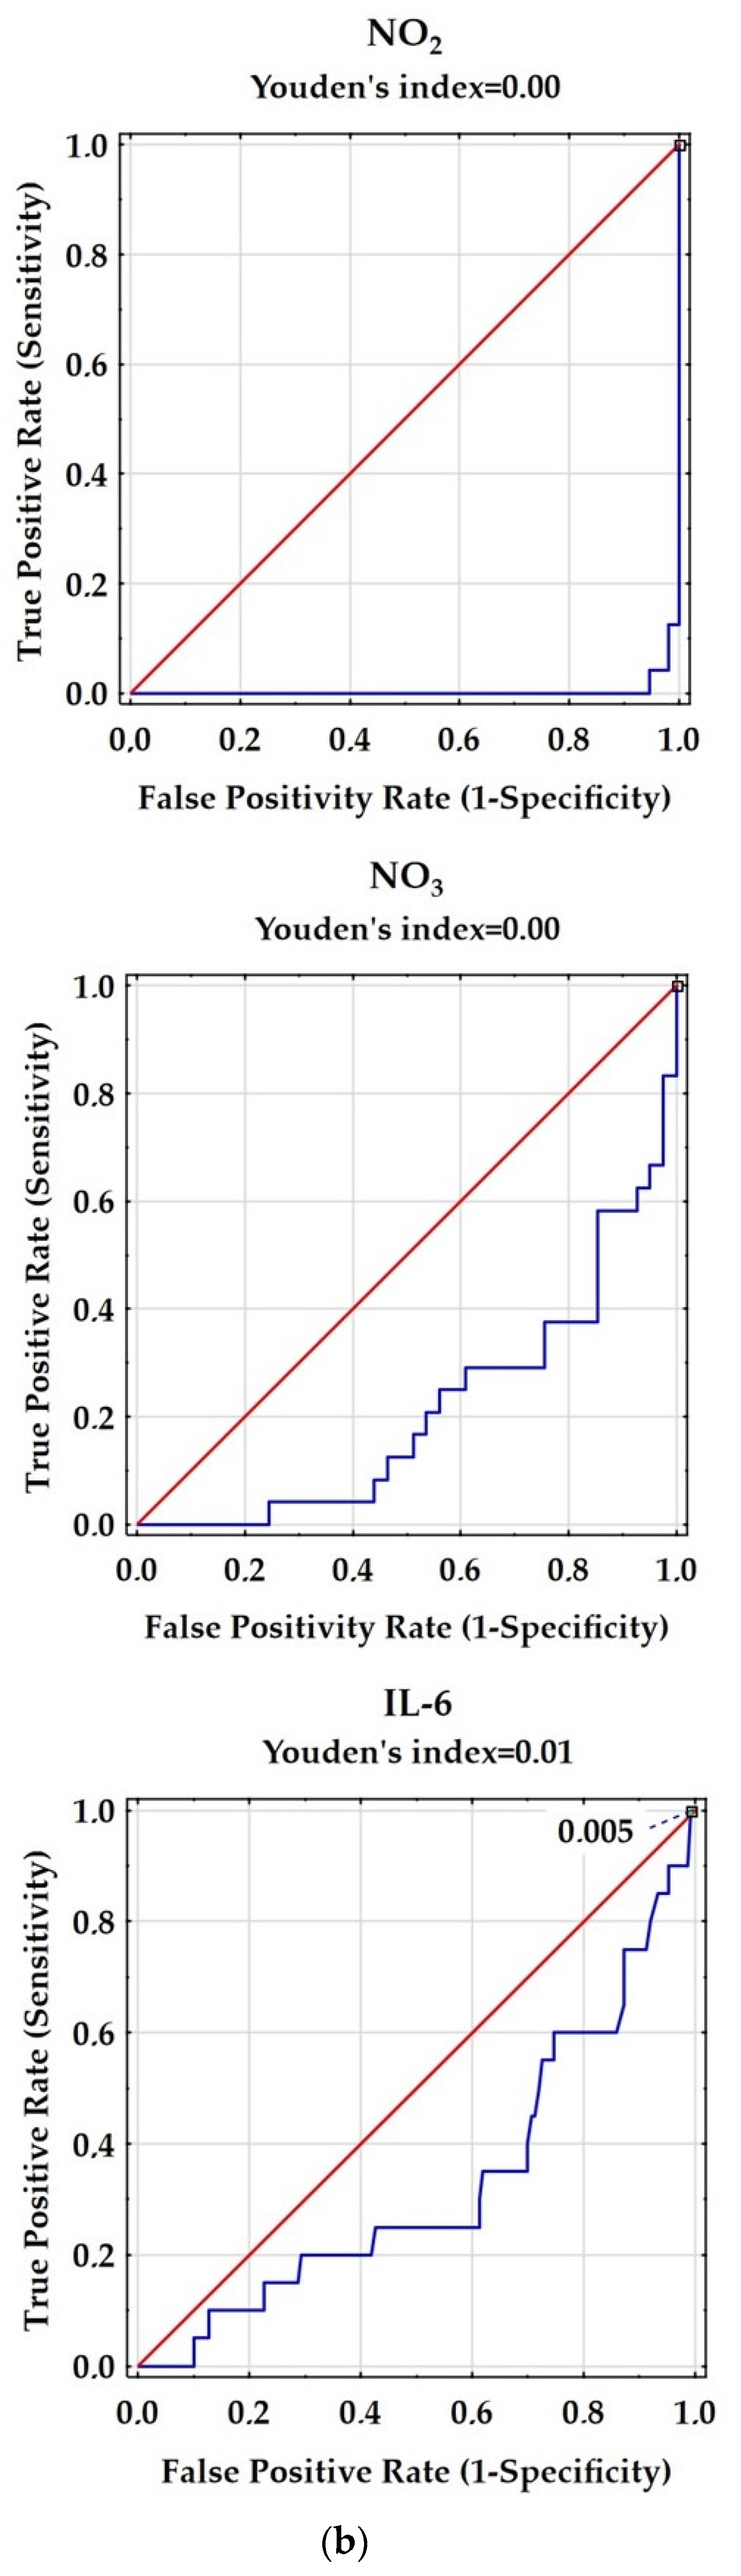
| Variable | AUC | SE | AUC Lower 95% | AUC Upper 95% | z = (v1 − 0.5)/v2 | p Value |
|---|---|---|---|---|---|---|
| IL-6 [pg/mL] | 0.351 | 0.067 | 0.221 | 0.482 | −2.233 | 0.0255 |
| TOS [µM] | 0.58 | 0.053 | 0.476 | 0.683 | 1.513 | 0.1304 |
| NO2 [µmol/L] | 0.004 | 0.004 | −0.003 | 0.011 | −136.109 | 0.000 |
| NO3 [µmol/L] | 0.211 | 0.057 | 0.1 | 0323 | −5.058 | 0.000 |
| LPO [µM] | 0.483 | 0.054 | 0.377 | 0.589 | −0.311 | 0.7555 |
| TAS [µM] | 0.536 | 0.055 | 0.429 | 0.643 | 0.654 | 0.5129 |
| OSI | 0.533 | 0.059 | 0.417 | 0.649 | 0.551 | 0.5816 |
| SOD [U/L] | 0.415 | 0.063 | 0.291 | 0.538 | −1.359 | 0.1740 |
| GPx [U/L] | 0.831 | 0.044 | 0.745 | 0.916 | 7.586 | 0.0000 |
| CAT [U/L] | 0.312 | 0.062 | 0.191 | 0.434 | −3.036 | 0.0024 |
| SOD/GPx + CAT | 0.214 | 0.049 | 0.118 | 0.31 | −5.856 | 0.0000 |
| Correlation | SOD | GPx | CAT |
|---|---|---|---|
| IL-6 [pg/mL] | NS | NS | NS |
| TAS [µM] | NS | NS | NS |
| TOS [µM] | NS | NS | NS |
| NO2 [µmol/L] | NS | NS | NS |
| NO3 [µmol/L] | NS | NS | NS |
| OSI | NS | NS | NS |
| SOD [U/L] | - | −0.27; 0.039 | NS |
| GPx [U/L] | −0.27; 0.039 | - | −0.37; 0.005 |
| CAT [U/L] | NS | −0.37; 0.005 | - |
| SOD/GPx + CAT | 0.46; 0.000 | −0.95; 0.000 | 0.29; 0.027 |
| AOPP [µM] # | NS | −0.30; 0.024 | 0.26; 0.039 |
| Variable | Control Group | Patients with RRMS | ||
|---|---|---|---|---|
| Women | Men | Women | Men | |
| Age | 42.1 ± 11.2 41.0 (33.0–49.0) | 41 ± 7.5 41.0 (36.0–47.5) | 42.7 ± 8.5 43.0 (37.0–51.0) | 43.8 ± 9.4 42.5 (35.5–51.0) |
| Disease duration [years] | N/A | N/A | 11.9 ± 5.7 12.0 (8.0–15.0) | 13.0 ± 6.7 12.0 (8.5–16.0) |
| EDSS | N/A | N/A | 2.8 ± 1.4 2.5 (1.5–3.5) | 2.7 ± 1.6 2.5 (1.5–3.0) |
| IL-6 [pg/mL] | 1.4 ± 2.0 0.8 (0.2–1.4) | 2.1 ± 2.4 1.0 (0.3–2.7) | 4.3 ± 6.7 2.2 (0.8–5.2) | 4.6 ± 7.9 1.5 (0.6–5.9) |
| TOS [µM] | 39.4 ± 12.9 39.4 (33.0–48.0) | 48.0 ± 14.4 48.0 (40.5–50.5) | 55.9 ± 102.0 38.0 (23.0–48.0) | 62.6 ± 87.1 38.0 (25.5–58.0) |
| NO2 [µmol/L] | 6.7 ± 2.5 6.7 (5.9–48.0) | 6.3 ± 2.0 6.8 (6.3–7.4) | 21.9 ± 8.4 21.0 (13.8–27.2) | 26.0 ± 10.2 26.2(15.5–34.1) |
| NO3 [µmol/L] | 10.9 ± 8.4 9.6 (4.6–17.3) | 6.9 ± 5.5 6.0 (3.3–8.1) | 24.2 ± 19.8 20.1 (11.9–27.9) | 70.6 ± 100.6 20.8 (10.1–150.1) |
| LPO [µM] | 18.8 ± 9.6 15.9 (12.2–28.0) | 17.5 ± 6.6 17.5 (9.8–24.1) | 24.4 ± 36.4 17.2 (8.0–24.6) | 33.6 ± 44.9 20.6 (9.1–37.7) |
| TAS [µM] | 381.7 ± 14.3 386.1 (371.3–392.0) | 387.8 ± 4.4 388.4 (387.7–390.2) | 374.5 ± 5 382.3 (361.5–391.3) | 390.4 ± 41.4 390.2 (378.0–394.2) * |
| OSI | 0.1 ± 0.0 0.1 (0.1–0.1) | 0.1 ± 0.0 0.1 (0.1–0.1) | 0.2 ± 0.3 0.1 (0.1–0.1) | 0.2 ± 0.4 0.1 (0.1–0.2) |
| SOD [U/L] | 64.9 ± 9.0 64.0 (59.8–71.1) | 62.4 ± 5.7 63.0 (59.1–66.0) | 66.8 ± 7.3 66.2 (62.2–71.8) | 66.3 ± 10.3 64.6 (60.8–70.9) |
| GPx [U/L] | 100.6 ± 26.0 98.2 (78.6–113.9) | 148.7 ± 123.9 100.2 (96.3–129.4) | 68.2 ± 30.6 62.9 (51.1–86.4) | 72.2 ± 24.1 74.6 (55.0–78.6) |
| CAT [U/L] | 4.7 ± 1.5 4.4 (3.2–5.7) | 5.4 ± 1.0 5.5 (5.0–5.9) | 5.8 ± 1.7 6.0 (5.1–6.7) | 5.8 ± 4.9–6.3 5.8 (4.9–6.3) * |
| SOD/GPx + CAT | 0.7 ± 0.2 0.6 (0.6–0.8) | 0.5 ± 0.2 0.6 (0.5–0.6) | 1.4 ± 1.8 1.0 (0.7–1.2) | 1.0 ± 0.4 0.8 (0.7–1.2) |
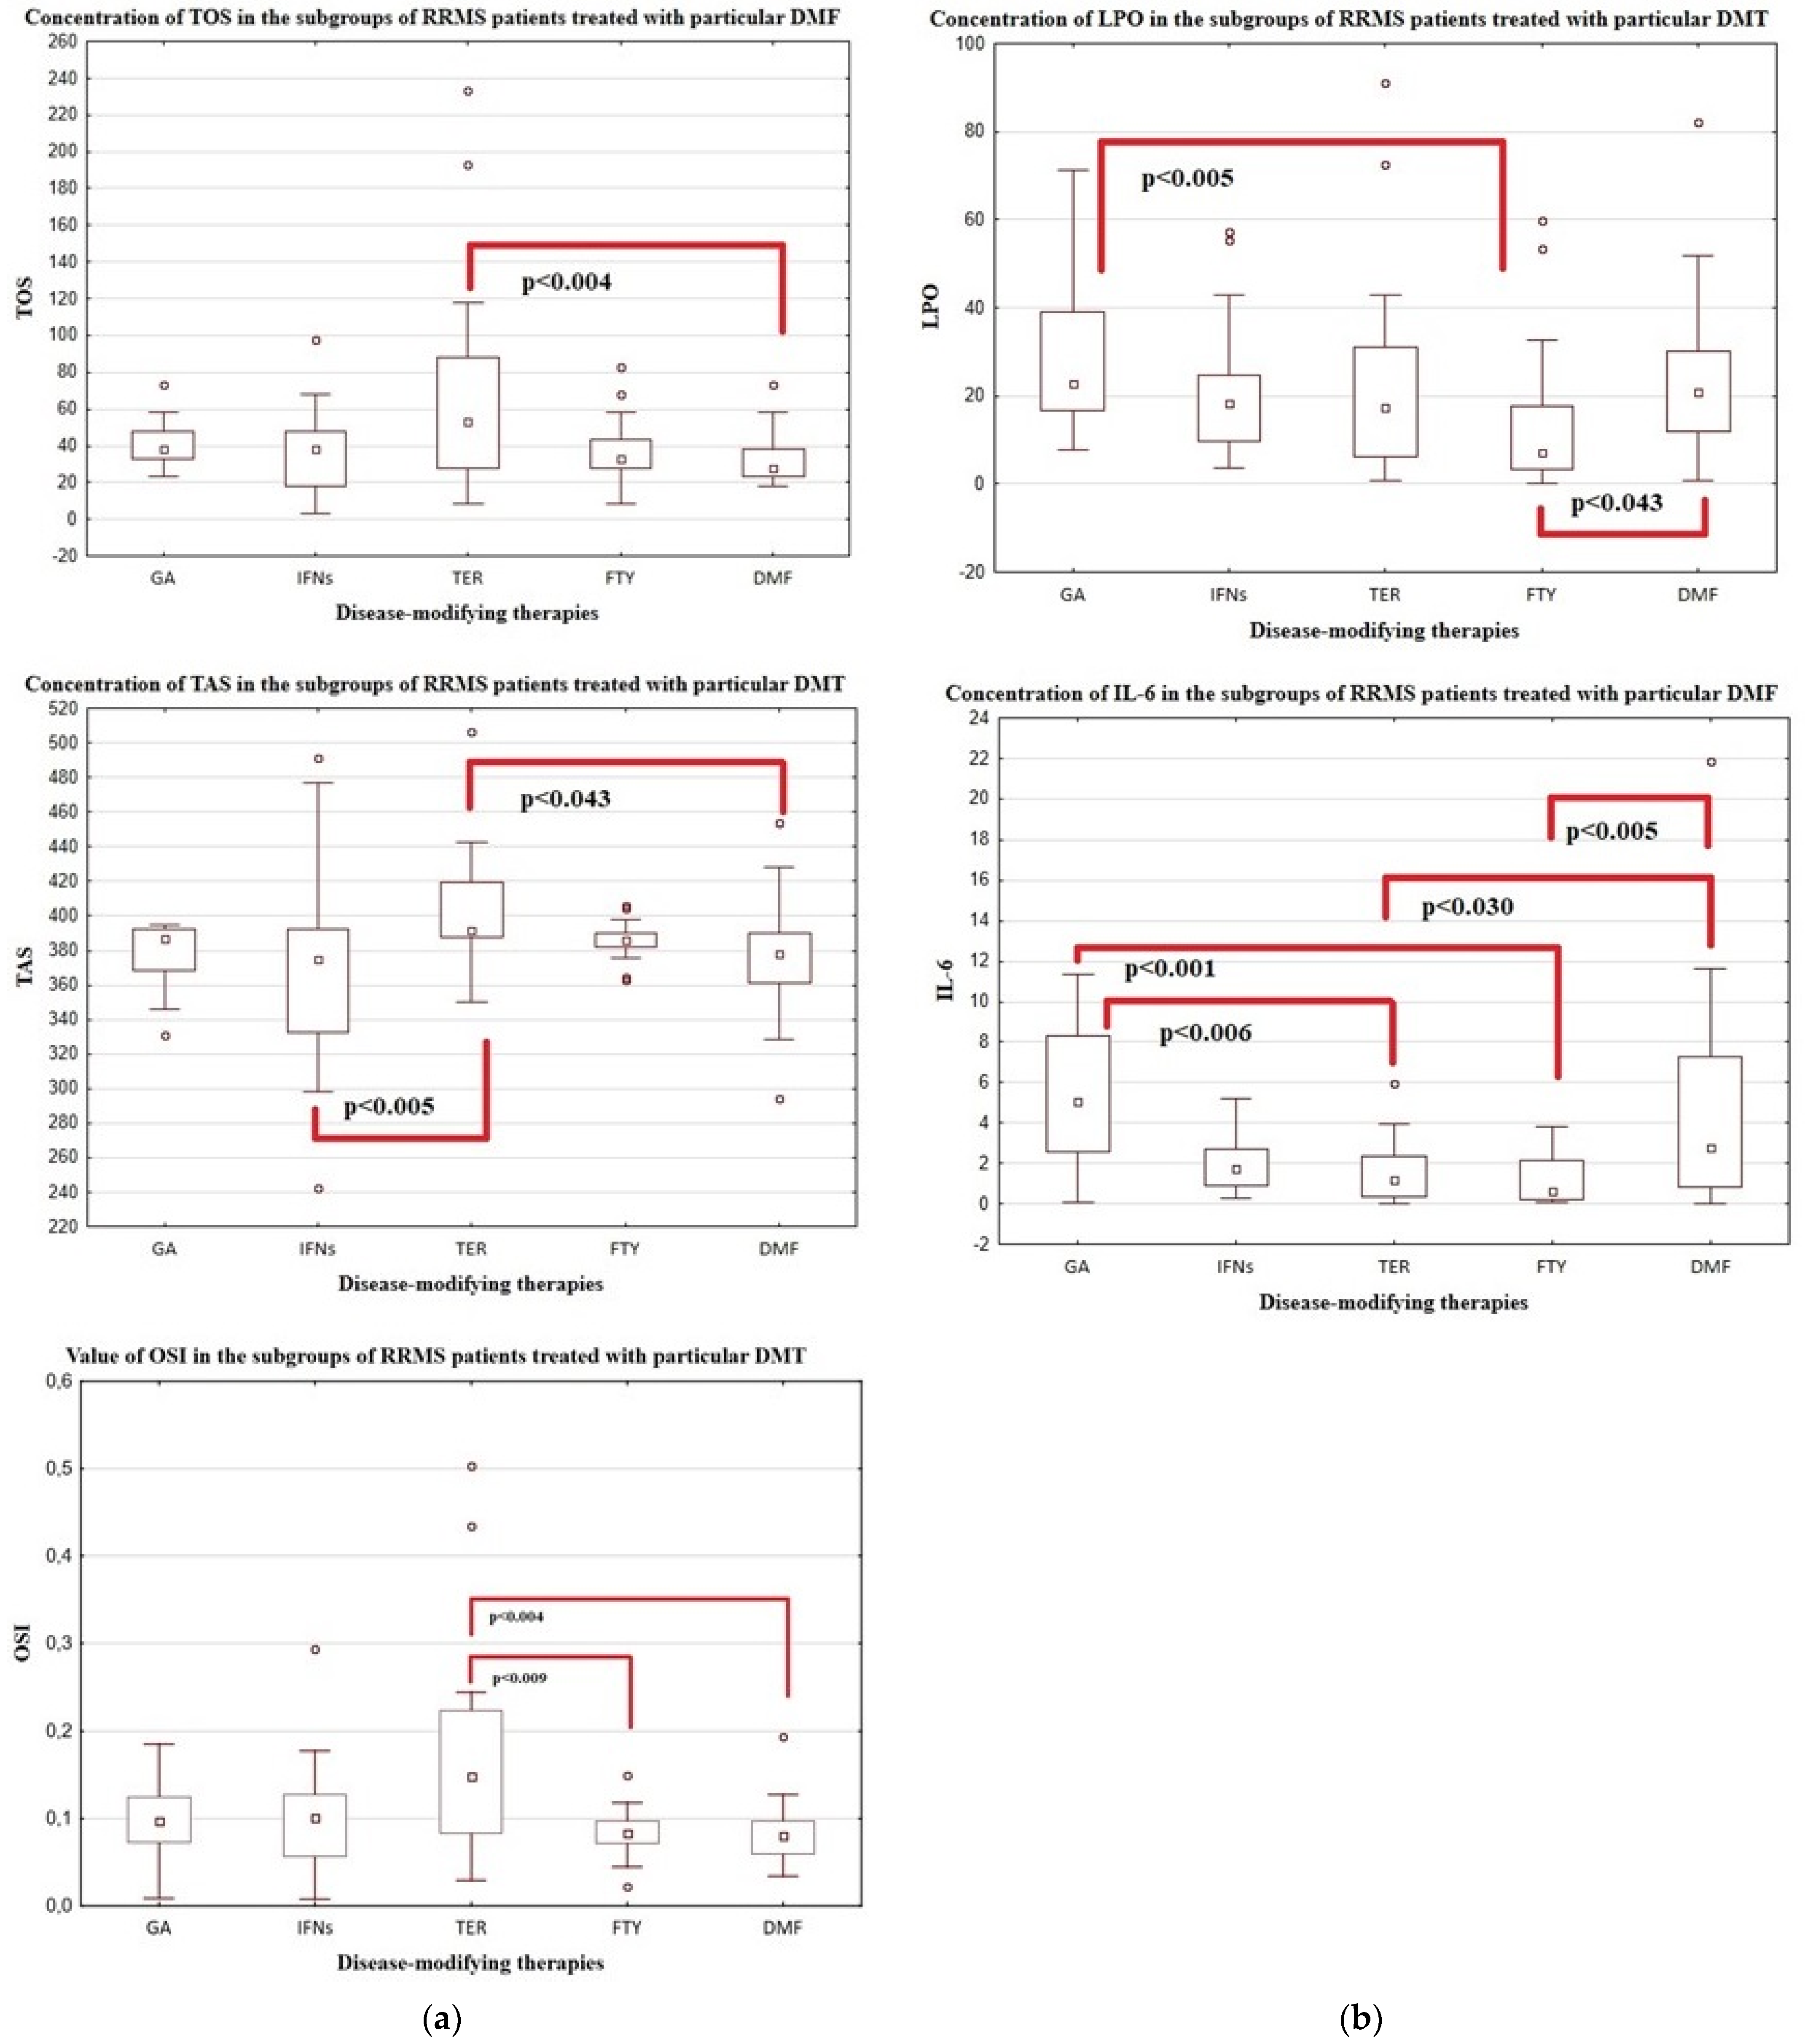
| Variable | Patients with RRMS | ||||
|---|---|---|---|---|---|
| GA | IFNs | TER | FTY | DMF | |
| Number of subjects | n = 18 | n = 47 | n = 26 | n = 28 | n = 39 |
| men/women [number] | 6/12 | 23/24 | 14/12 | 8/20 | 14/25 |
| Age [years] | 43.2 ± 10.2 44.0 (36.0–51.0) | 44.9 ± 8.6 43.0 (39.0–50.0) | 47.6 ± 12.3 46.5 (42.0–58.0) | 42.8 ± 10.4 41.0 (34.5–49.5) | 42.6 ± 10.4 42.0 (35.0–50.0) |
| Disease duration [years] | 12.2 ± 6.2 10.0 (7.0–17.0) | 13.0 ± 4.9 12.0 (10.0–15.0) | 13.1 ± 7.6 13.5 (7.0–17.0) | 15.5 ± 5.3 14.0 (12.5–20.5) | 10.5 ± 7.7 8.0 (4.0–13.0) * |
| EDSS | 2.4 ± 1.3 2.0 (1.5–3.0) | 2.2 ± 1.0 2.0 (1.5–3.0) | 3.1 ± 1.4 3.0 (2.0–4.0) | 4.3 ± 1.8 4.0 (3.0–6.0) | 2.3 ± 1.3 2.0 (1.0–3.0) * |
| IL-6 [pg/mL] | 5.3 ± 3.4 6.7 (2.8–11.3) | 3.1 ± 4.0 2.0 (1.0–3.2) | 1.5 ± 1.5 1.3 (0.4–2.6) | 1.3 ± 1.2 1.3 (0.4–3.4) | 3.8 ± 3.4 2.9 (0.8–7.5) * |
| TOS [µM] | 37.7 ± 16.5 38.0 (28.0–48.0) | 56.4 ± 91.4 38.0 (28.0–48.0) | 126.7 ± 182.7 58.0 (33.0–103.0) | 41.8 ± 30.1 35.5 (28.0–43.0) | 35.2 ± 21.6 28.0 (23.0–38.0) * |
| NO2 [µmol/L] | 30.0 ± 7.4 31.4 (25.5–33.4) | 20.7 ± 9.3 16.0 (14.1–28.6) | 22.2 ± 9.2 20.5 (16.2–28.1) | 22.3 ± 11.7 20.7 (13.1–24.8) | 22.2 ± 7.5 24.8 (15.5–26.9) |
| NO3 [µmol/L] | 15.3 ± 7.7 14.6 (10.1–7.7) | 43.3 ± 72.5 21.3 (9.8–41.3) | 12.0 ± 13.5 12.0 (2.4–21.6) | 28.2 ± 15.7 23.8 (16.9–29.2) | 53.4 ± 66.3 22.8 (13.3–87.4) |
| LPO [µM] | 42.1 ± 58.5 23.3 (16.7–42.2) | 26.6 ± 34.6 19.1 (11.2–27.2) | 23.4 ± 23.5 17.2 (6.2–31.2) | 13.3 ± 16.0 7.2 (3.3–17.7) | 36.3 ± 53.1 21.4 (13.3–35.1) * |
| TAS [µM] | 377.7 ± 18.5 386.4 (368.6–392.7) | 370.3 ± 48.8 376.7 (333.8–392.5) | 398.5 ± 62.6 391.5 (385.5–421.6) | 380.3 ± 27.4 385.5 (381.0–390.0) | 379.8 ± 40.2 378.7 (361.5–390.9) * |
| OSI | 0.1 ± 0.0 0.1 (0.1–0.1) | 0.1 ± 0.2 0.1 (0.1–0.1) | 0.2 ± 0.4 0.2 (0.1–0.2) | 0.1 ± 0.1 0.1 (0.1–0.1) | 0.1 ± 0.0 0.08 (0.1–0.1) * |
| SOD [U/L] | 67.8 ± 8.0 66.4 (62.2–68.6) | 66.6 ± 7.8 67.2 (63.0–70.9) | 68.6 ± 8.0 66.7 (62.7–76.2) | 66.3 ± 10.1 65.2 (57.3–74.2) | 65.1 ± 9.0 63.8 (60.6–68.3) |
| GPx [U/L] | 57.0 ± 23.9 51.1 (35.4–78.6) | 72.1 ± 32.0 66.8 (51.1–94.3) | 87.4 ± 53.3 68.8 (53.0–121.8) | 74.1 ± 22.3 70.7 (58.9–94.3) | 72.7 ± 17.2 72.9 (60.9–78.6) |
| CAT [U/L] | 6.9 ± 1.4 6.6 (6.0–7.1) | 5.9 ± 1.1 6.0 (5.1–6.7) | 6.0 ± 2.4 6.2 (4.2–7.8) | 5.5 ± 1.6 5.1 (4.3–6.1) | 4.2 ± 2.4 4.8 (0.8–6.1) * |
| SOD/GPx + CAT | 1.2 ± 0.5 1.1 (0.8–1.6) | 1.6 ± 2.4 1.0 (0.7–1.3) | 0.8 ± 0.4 0.8 (0.6–1.1) | 0.9 ± 0.5 0.7 (0.6–1.2) | 0.9 ± 0.2 0.9 (0.8–1.1) |
Disclaimer/Publisher’s Note: The statements, opinions and data contained in all publications are solely those of the individual author(s) and contributor(s) and not of MDPI and/or the editor(s). MDPI and/or the editor(s) disclaim responsibility for any injury to people or property resulting from any ideas, methods, instructions or products referred to in the content. |
© 2023 by the authors. Licensee MDPI, Basel, Switzerland. This article is an open access article distributed under the terms and conditions of the Creative Commons Attribution (CC BY) license (https://creativecommons.org/licenses/by/4.0/).
Share and Cite
Bizoń, A.; Chojdak-Łukasiewicz, J.; Budrewicz, S.; Pokryszko-Dragan, A.; Piwowar, A. Exploring the Relationship between Antioxidant Enzymes, Oxidative Stress Markers, and Clinical Profile in Relapsing–Remitting Multiple Sclerosis. Antioxidants 2023, 12, 1638. https://doi.org/10.3390/antiox12081638
Bizoń A, Chojdak-Łukasiewicz J, Budrewicz S, Pokryszko-Dragan A, Piwowar A. Exploring the Relationship between Antioxidant Enzymes, Oxidative Stress Markers, and Clinical Profile in Relapsing–Remitting Multiple Sclerosis. Antioxidants. 2023; 12(8):1638. https://doi.org/10.3390/antiox12081638
Chicago/Turabian StyleBizoń, Anna, Justyna Chojdak-Łukasiewicz, Sławomir Budrewicz, Anna Pokryszko-Dragan, and Agnieszka Piwowar. 2023. "Exploring the Relationship between Antioxidant Enzymes, Oxidative Stress Markers, and Clinical Profile in Relapsing–Remitting Multiple Sclerosis" Antioxidants 12, no. 8: 1638. https://doi.org/10.3390/antiox12081638
APA StyleBizoń, A., Chojdak-Łukasiewicz, J., Budrewicz, S., Pokryszko-Dragan, A., & Piwowar, A. (2023). Exploring the Relationship between Antioxidant Enzymes, Oxidative Stress Markers, and Clinical Profile in Relapsing–Remitting Multiple Sclerosis. Antioxidants, 12(8), 1638. https://doi.org/10.3390/antiox12081638