Article

Free, Conjugated, and Bound Phenolics in Peel and Pulp from Four Wampee Varieties: Relationship between Phenolic Composition and Bio-Activities by Multivariate Analysis

1
School of Food Science and Engineering, Hainan University, Haikou 570228, China
2
Key Laboratory of Food Nutrition and Functional Food of Hainan Province, Hainan University, Haikou 570228, China
3
School of Food Science and Engineering, Hainan Tropical Ocean University, Sanya 572022, China
*
Authors to whom correspondence should be addressed.
Antioxidants 2022, 11(9), 1831; https://doi.org/10.3390/antiox11091831
Submission received: 21 July 2022 / Revised: 3 September 2022 / Accepted: 13 September 2022 / Published: 16 September 2022
(This article belongs to the Special Issue Antioxidant Potential of Extracts from Foods and Plants)

Abstract

:
Free, conjugated, and bound phenolic fractions of peel and pulp in four wampee varieties from South China were analyzed for their contents, composition, antioxidant capacities, and inhibitory activities against α-glucosidase. We found that there were significant differences in phenolic/flavonoid contents among diverse varieties and different parts (peel and pulp), and the contents were highest in the peel’s bound form. The results of UHPL-Q-Exactive HF-X and HPLC showed that chlorogenic acid, gentisic acid, and rutin were abundantly distributed over the three phenolic fractions in peel and pulp of all wampee samples, while isoquercitrin was the most abundant in the conjugated form of peel/pulp and myricetin had the richest content in the free form of peel/pulp. Wampee peel had stronger antioxidant capacities of ABTS+, DPPH, ·OH, and FRAP than the pulp, and the bound phenolic fraction of the peel/pulp had much higher antioxidant activities than FP and CP fractions. It is interesting that the same phenolic fraction of the wampee peel displayed roughly close IC50 values of α-glucosidase inhibition to those from the pulp samples. The relationship between individual phenolic and TPC/TFC/the bio-activities and the similarity among the free, conjugated, and bound phenolic fractions in peel and pulp samples were explored by using Pearson correlation analysis, principal component analysis, and hierarchical cluster analysis. This work provides a systematic and comprehensive comparison of the three phenolic fractions of diverse wampee varieties and different parts, and a rationale for applying phenolics from wampee fruits.

1. Introduction

Clausena lansium (Lour.) Skeels (wampee) belongs to the genus Clausena in the family Rutaceae, originating from Southern China [1], and is mainly cultivated in tropical and subtropical regions of the world, such as Southern China, India, Vietnam, and Thailand [2]. Wampee fruit resembles grapes, with a brown or yellow peel that is usually eaten along with the pulp, and tastes sour and sweet, similar to the flavor of kumquat. The leaf is a spicy substitute for curry leaves in cooking in Sri Lanka and Nigeria [3,4]. Wampee has recently received much attention not only because its fruits and leaves have a special flavor, but also because its root, stem, leaf, fruit, and seed can be used to treat and prevent common cold, cough, asthma, viral hepatitis, gastrointestinal disease, ulcers, bronchitis, and malaria in traditional Chinese and Vietnamese medicine [5,6]. Previous studies about wampee mainly focused on carbazole alkaloids isolated from the roots and stems of wampee and neuroprotective effects of these compounds [3,5,6]; the polyphenol composition, antidiabetic, and lipid-lowering effects of polyphenol extracts of the leaves [7]; the polyphenolic profile and antioxidant activity during the leaf development stages, chemical profiles of the leaves, barks, flower, peels, pulps, and seeds of wampee with liquid chromatography tandem mass spectrometry (LC-MS) untargeted metabolomics [8]; the antioxidant and anticancer activities of wampee peel extracts by using different solvents (ethanol, hexane, ethyl acetate, butanol, and water) [1]; and the isolation and purification of compounds from wampee fruit and antioxidant or amylase inhibitory activity of these compounds [9]. Although the polyphenolic composition in the wampee leaves has been well characterized, information about polyphenolic constituents of free phenolic (FP), conjugated phenolic (CP), and bound phenolic (BP) fractions in the peel and pulp of different wampee varieties is still lacking.
Oxidative stress is an imbalance between the production of reactive oxygen species (ROS) and their elimination in the cells and tissues [10], and it can cause chronic inflammation, which can further mediate several chronic diseases such as insulin resistance, type 2 diabetes mellitus (T2DM), and cardiovascular diseases (CVD) [11]. Polyphenols are natural compounds that are rich in dietary sources such as fruits, vegetables, red wine, tea, coffee, cholates, cereals, and dry legumes [12]. Many researchers have demonstrated that polyphenols exert antioxidant and anti-inflammatory effects both in vitro and in vivo [13,14].
The aim of this study was to systematically investigate polyphenol compositions, antioxidant activities in four different in vitro models, and α-glucosidase inhibitory activities of FP, CP, and BP fractions in the peel and pulp of four wampee varieties. The polyphenol constituents of wampee samples were accurately identified and quantified by UHPLC-Q Exactive HF-X and HPLC for the first time. More importantly, the contributions of the individual phenolic compounds to the observed biological activities were explored by Pearson correlation analysis and principal component analysis (PCA). In addition, PCA and hierarchical cluster analysis (HCA) were conducted to classify FP, CP, and BP fractions of different parts (peel and pulp) of four different wampee varieties.

2. Materials and Methods

2.1. Materials and Reagents

Four wampee fruits samples, W1–W4, were collected in July 2020 from South China, including Guangdong, Guangxi, and Hainan provinces, and the varieties were identified by professionals. Detailed information about W1–W4 is shown in Table 1. All the standards, including o-coumaric acid, gallic acid, gentisic acid, chlorogentic acid, DL-catechin, isoquercitrin, caffeic acid, myricetin, quercein, rutin, kaempferol 7-O-glucoside, quercitrin, and kaempferol, were HPLC-grade (>97%) and purchased from Shanghai Macklin Biochemical Co., Ltd. (Shanghai, China). 4-nitrophenyl α-D-glucopyranoside (pNPG), 2,2′-azinobis (3-ethylbenzothiazoline-6-sulfonic acid ammonium salt) (ABTS), 1,1-diphenyl-2-picrylhydrazyl radical (DPPH), 6-hydroxy-2,5,7,8-tetramethylchroman-2-carboxylic acid (Trolox), 2,4,6-tris(2-pyridyl)-s-triazine (TPTZ), and all mobile phase reagents used for liquid chromatography, including ethanol, acetonitrile, formic acid, and 2-propanol (HPLC-grade), were purchased from Shanghai Aladdin Biochemical Technology Co., Ltd. (Shanghai, China). Folin–Ciocalteu phenol reagent was purchased from Sigma-Aldrich Chemical Co., Ltd. (St. Louis, MO, USA). Other reagents applied in the study were of analytical grade and purchased from Sinopharm Chemical Reagent Co., Ltd. (Shanghai, China).

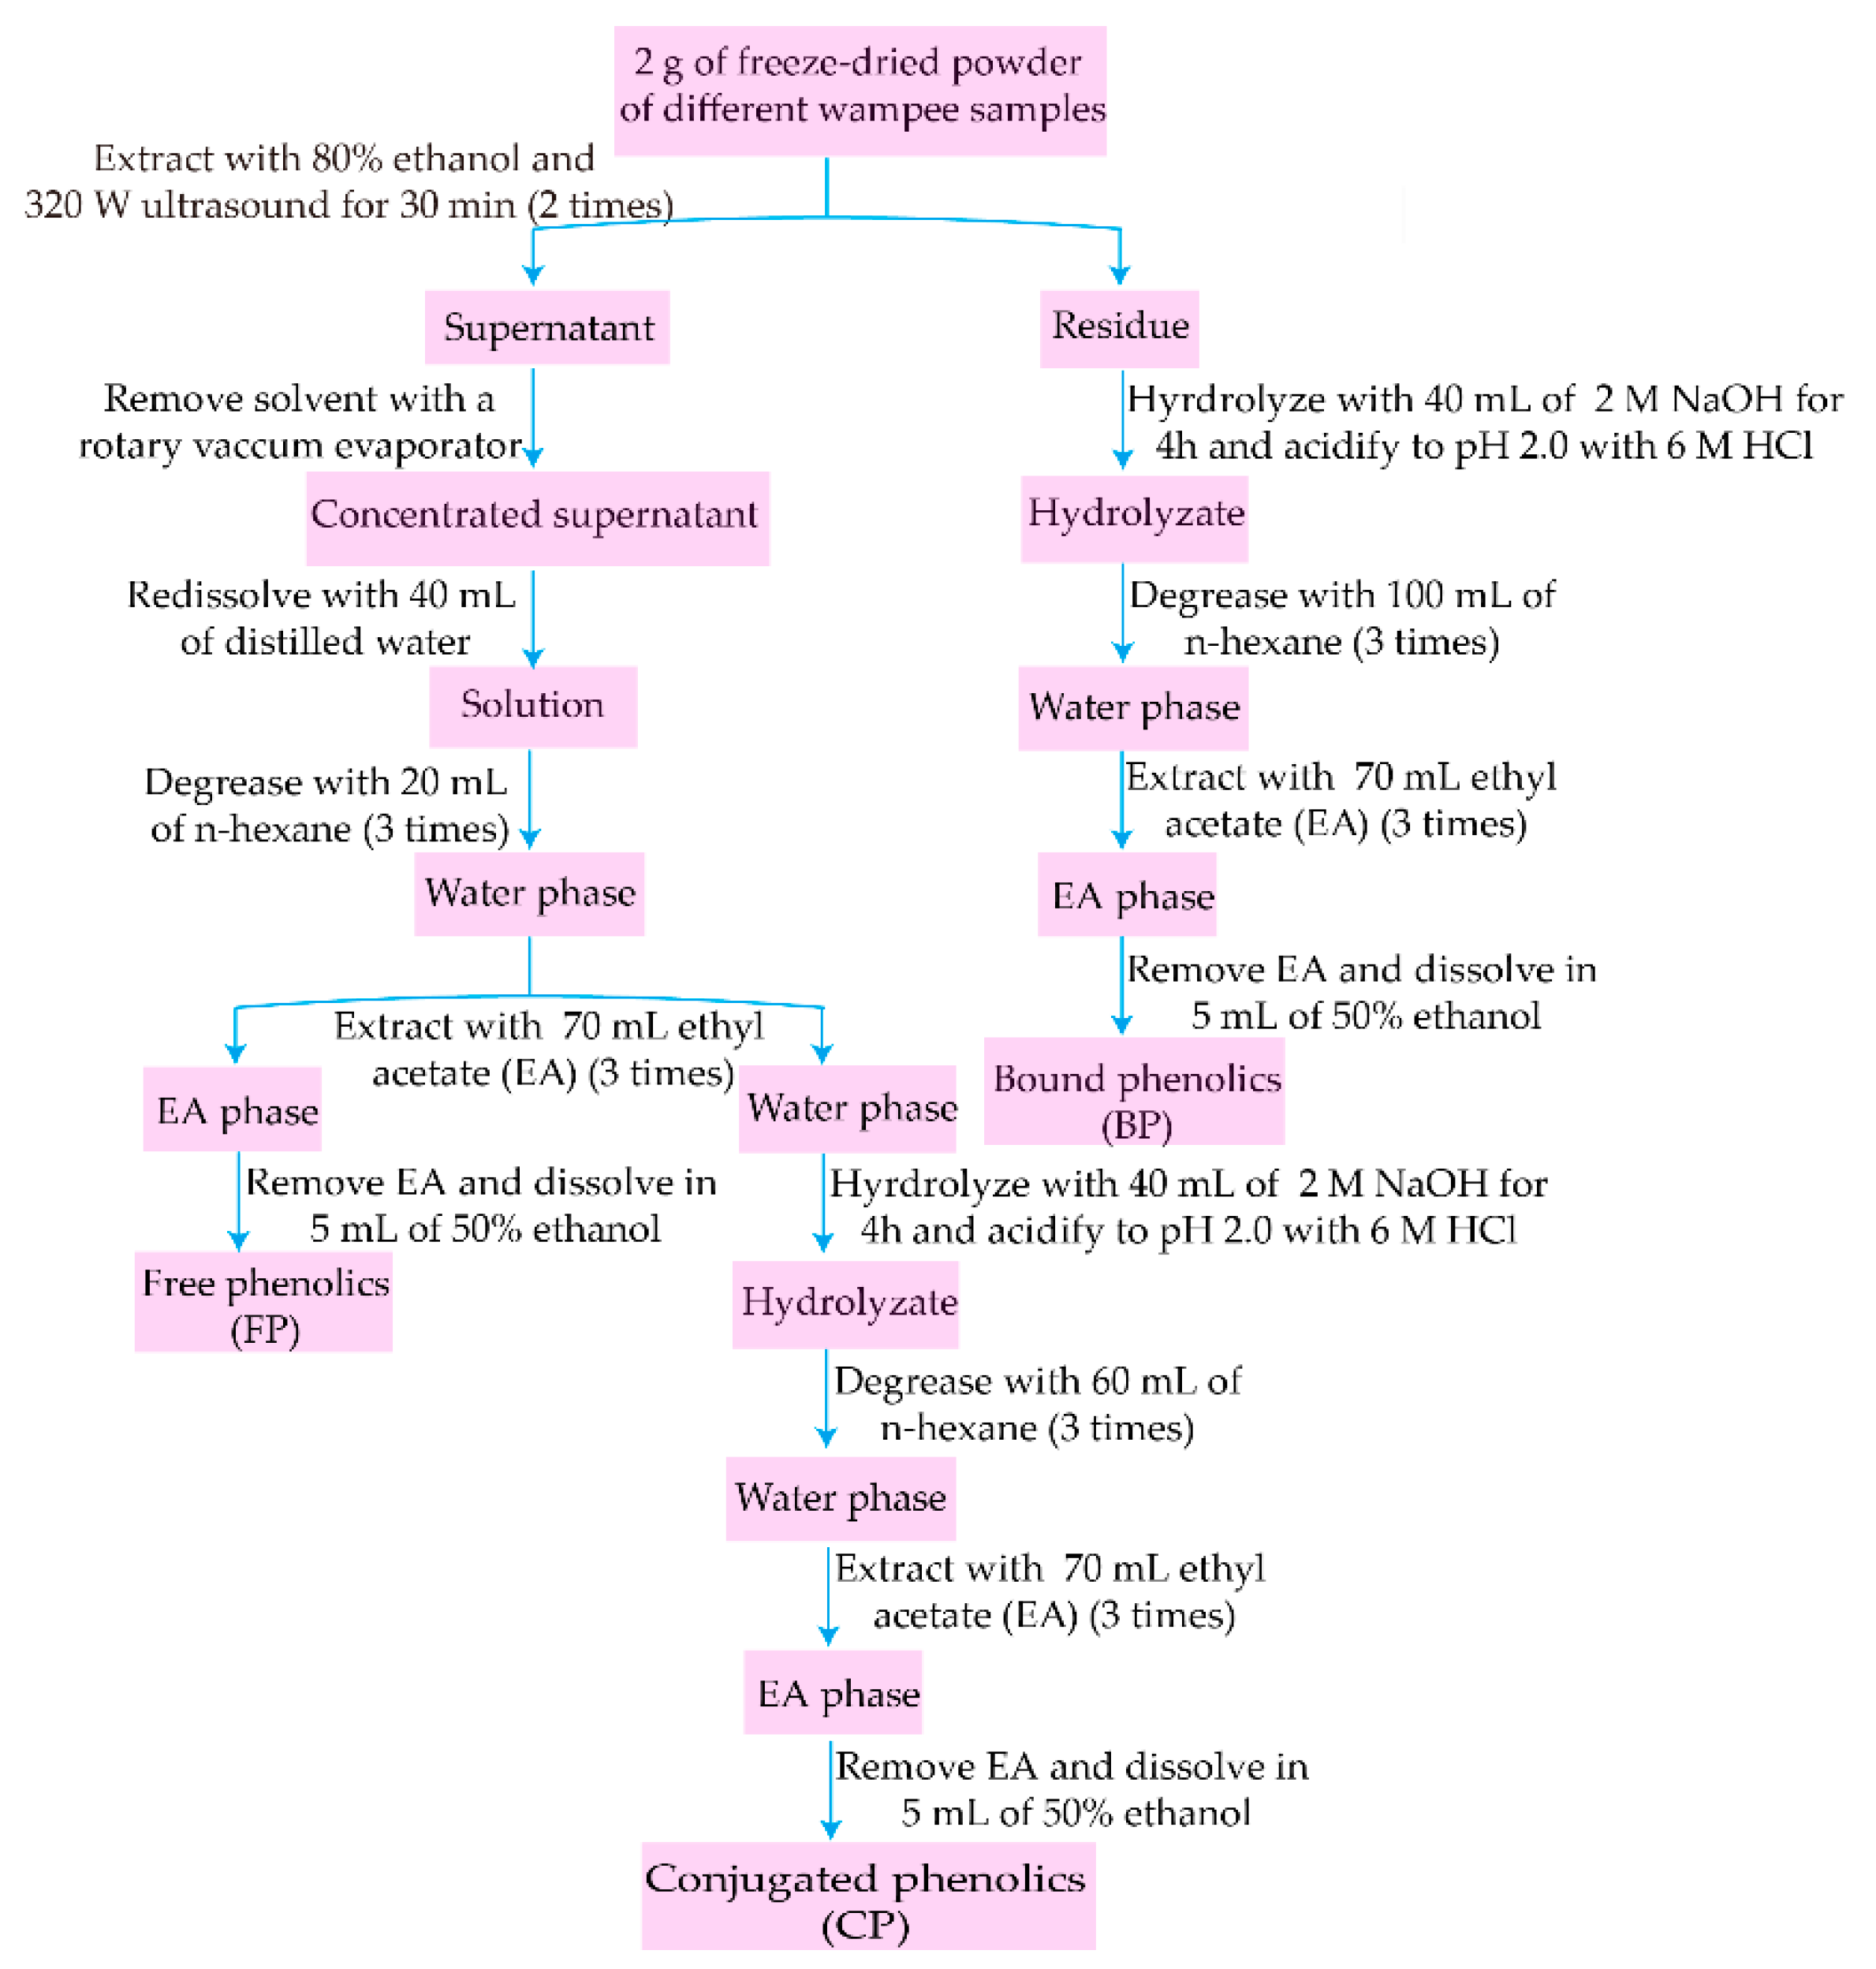
2.2. Extraction of FP, CP, and BP Fractions

The peel and pulp of W1–W4 were freeze-dried in an LGJ-10 vacuum freeze dryer (Songyuan, Beijing, China). First, dried peel and pulp were ground with a Chinese medicine grinder. Next, they were sieved through a 180 µm mesh, and then the fine peel and pulp powder of W1–W4 were stored at −20 °C until analyses were conducted. Exactions of FP, CP, and BP fractions were performed according to reported methods with some minor modifications [15,16], and the extracting procedure is shown in Figure 1. In brief, freeze-dried powder (2 g) was extracted twice with 25 mL ethanol–water (80:20, v/v) under ultrasound (320 W) for 30 min. The residue was used for extracting BP, while the supernatant was concentrated, re-dissolved with water (40 mL), degreased with n-hexane (20 mL/time, 3 times), and the water phase was retained to prepare FP and CP. Firstly, the water phase was extracted 3 times with 70 mL/time ethyl acetate (EA). Secondly, EA was removed from EA phase and 50% ethanol (5 mL) was added to obtain FP. Thirdly, the residue and water phase combined from the above two steps were hydrolyzed with 2 M NaOH (40 mL) for 4 h under a nitrogen atmosphere, acidified to pH 2.0 with 6 M HCl, and then degreased 3 times with n-hexane, extracted with EA (70 mL/time, 3 times). Finally, EA was removed and the extractions of CP and BP were prepared by adding 5 mL of 50% ethanol. All samples of peel and pulp from W1–W4 were extracted in three replicates.

2.3. Determination of Total Phenolic Content (TPC) and Total Flavonoid Content (TFC)

TPC and TFC of FP, CP, and BP fractions in the peel and pulp of W1–W4 were determined using Folin–Ciocalteu (FC) and aluminum chloride colorimetric methods described by Dou et al. [17]. Gallic acid and rutin were applied as the standards for the determination of TPC and TFC, respectively. TPC and TFC were expressed as mg gallic acid and mg rutin equivalents per gram in dry weight, that is, mg GAE/g DW and mg RE/g DW, respectively. Three biological replicates of all samples obtained as described in Section 2.2 were measured.

2.4. Analysis of Polyphenol Composition

2.4.1. Identification of Phenolic Compounds

Phenolic compounds in the FP, CP, and BP fractions from the peel and pulp of W1–W4 were separated by the Vanqusih Horizon UHPLC system (Thermo Scientific, Waltham, MA, USA) equipped with an UHPLC column (Waters ACQUITY UHPLC HSS T3, 100 mm × 2.1 mm i.d., 1.8 µm, Lindon, UT, USA) with eluting solvent A (95% Milli-Q grade water and 5% acetonitrile including 0.1% formic aid) and solvent B (47.5% acetonitrile, 47.5% 2-propanol, and 5% Milli-Q grade water including 0.1% formic aid). The gradient elution procedure was as follows: 0–3.5 min 100–75.5% A; 3.5–5 min 75.5–35% A; 5–5.5 min 35–0% A; 5.5–7.4 min 0% A; 7.4–7.6 min 0–48.5% A; 7.6–7.8 min 48.5–100% A; 7.8–10 min 100% A. Flow rate was 0.4 mL/min, column temperature was set at 40 °C, and injection volume was 2 µL. Mass spectrometry (MS) data were obtained in the positive and negative modes from m/z 70 to 1050 with Q-Exactive HF-X (Thermo Scientific, Waltham, MA, USA) coupled with an electrospray ionization (ESI) source. MS parameters were as follows: a sheath gas flow rate of 50 arb; an aux gas flow rate of 13 arb; a heater temperature of 425 °C; a capillary temperature of 325 °C; a spray voltage of +3500 V or −3500 V; an s-lens RF level of 50; a normalized collision energy of 20 eV, 40 eV, and 60 eV; a full MS resolution of 60,000; and an MS2 resolution of 7500. ProgenesisQI (WatersCorporation, Lindon, UT, USA) was used to obtain retention times, m/z, and peak intensities of mass spectra. In addition, phenolic compounds in the FP, CP, and BP fractions were identified by matching MS and MS2 information with some public databases and literature works. Three biological replicates of all samples obtained as described in Section 2.2 were analyzed.

2.4.2. Quantification of Phenolic Compounds

An Agilent 1200 HPLC system equipped with a column (Agilent Zorbax Eclipse Plus C18, 250 mm × 4.6 mm i.d., 5 µm, Santa Clara, CA, USA) and a diode array detector (Agilent, Santa Clara, CA, USA) was used to quantify the phenolic compounds in the FP, CP, and BP fractions from the peel and pulp of W1–W4. The elution process was performed according to a reported method with minor modifications with eluting solvent A (Milli-Q grade water with 0.1% formic aid) and solvent B (acetonitrile with 0.1% formic aid) [18]. The gradient elution procedure was as follows: 0–6 min 85% A; 6–10 min 85–80% A; 10–20 min 80–75% A; 20–30 min 75–65% A; 30–40 min 65–50% A; 40–55 min 50–20% A; 55–60 min 20–85% A. Other HPLC parameters were as follows: column temperature of 30 °C, injection volume of 10 µL, flow rate of 0.8 mL/min, and detection wavelength of 280 nm. Three biological replicates of all samples obtained as described in Section 2.2 were analyzed.

2.5. Evaluation of Antioxidant Activities in Four In Vitro Models

ABTS+, DPPH, and OH radical scavenging activities and ferric-reducing antioxidant power (FRAP) were used to evaluate the antioxidant activities of the FP, CP, and BP fractions from the peel and pulp of W1–W4. The antioxidant activity assays in the four models were conducted according to previous studies [19,20]. Trolox was a positive control in the first three models, and the results were all expressed as µmol Trolox equivalents per gram in dry weight (µmol Trolox/g DW). In the FRAP model, FeSO4 was used to establish a standard curve, and the antioxidant activity was expressed as µM Fe(II)SE/g DW. Three biological replicates of all samples obtained as described in Section 2.2 were measured.

2.6. Determination of α-Glucosidase Inhibitory Activity

The α-glucosidase inhibitory activities of FP, CP, and BP fractions from the peel and pulp of W1–W4 were determined by the method described by Cai et al. [21]. Firstly, 1 U/mL α-glucosidase solution was prepared with 0.1 M phosphate buffer solution (PBS, pH 6.8). Secondly, 100 µL of the enzyme solution was mixed with 50 µL of FP, CP, and BP extracts and incubated at 37 °C for 10 min. Thirdly, 100 µL of 5 mM pNPG solution was added and incubated at 37 °C for 20 min. Finally, the absorbance of the reaction mixture was detected at 405 nm in 15 min.
In the model, acarbose and PBS (pH 6.8) were the positive and negative controls, respectively. Inhibitory activity against α-glucosidase was expressed as IC50 (µg/mL), referring to the amount of the FP, CP, and BP fractions required to inhibit 50% of α-glucosidase activity. Three biological replicates of all samples obtained as described in Section 2.2 were analyzed.

2.7. Statistical Analysis

All the detections were conducted in triplicate, and the data were expressed as mean ± standard deviation (SD). One-way analysis of variance (ANOVA) and Pearson correlation analysis were performed using SPSS statistics 23 (IBM, Chicago, IL, USA), and graphs were generated using GraphPad Prism 8 (GraphPad Software, San Diego, CA, USA) and R 3.6.3 (ggplot2 package). SIMCA 14.1 (MKSUmetrics, SE) and R 3.6.3 (ggplot2 and ggdendro packages) were used to perform principal component analysis (PCA) and hierarchical cluster analysis (HCA) and visualize related graphs.

3. Results and Discussion

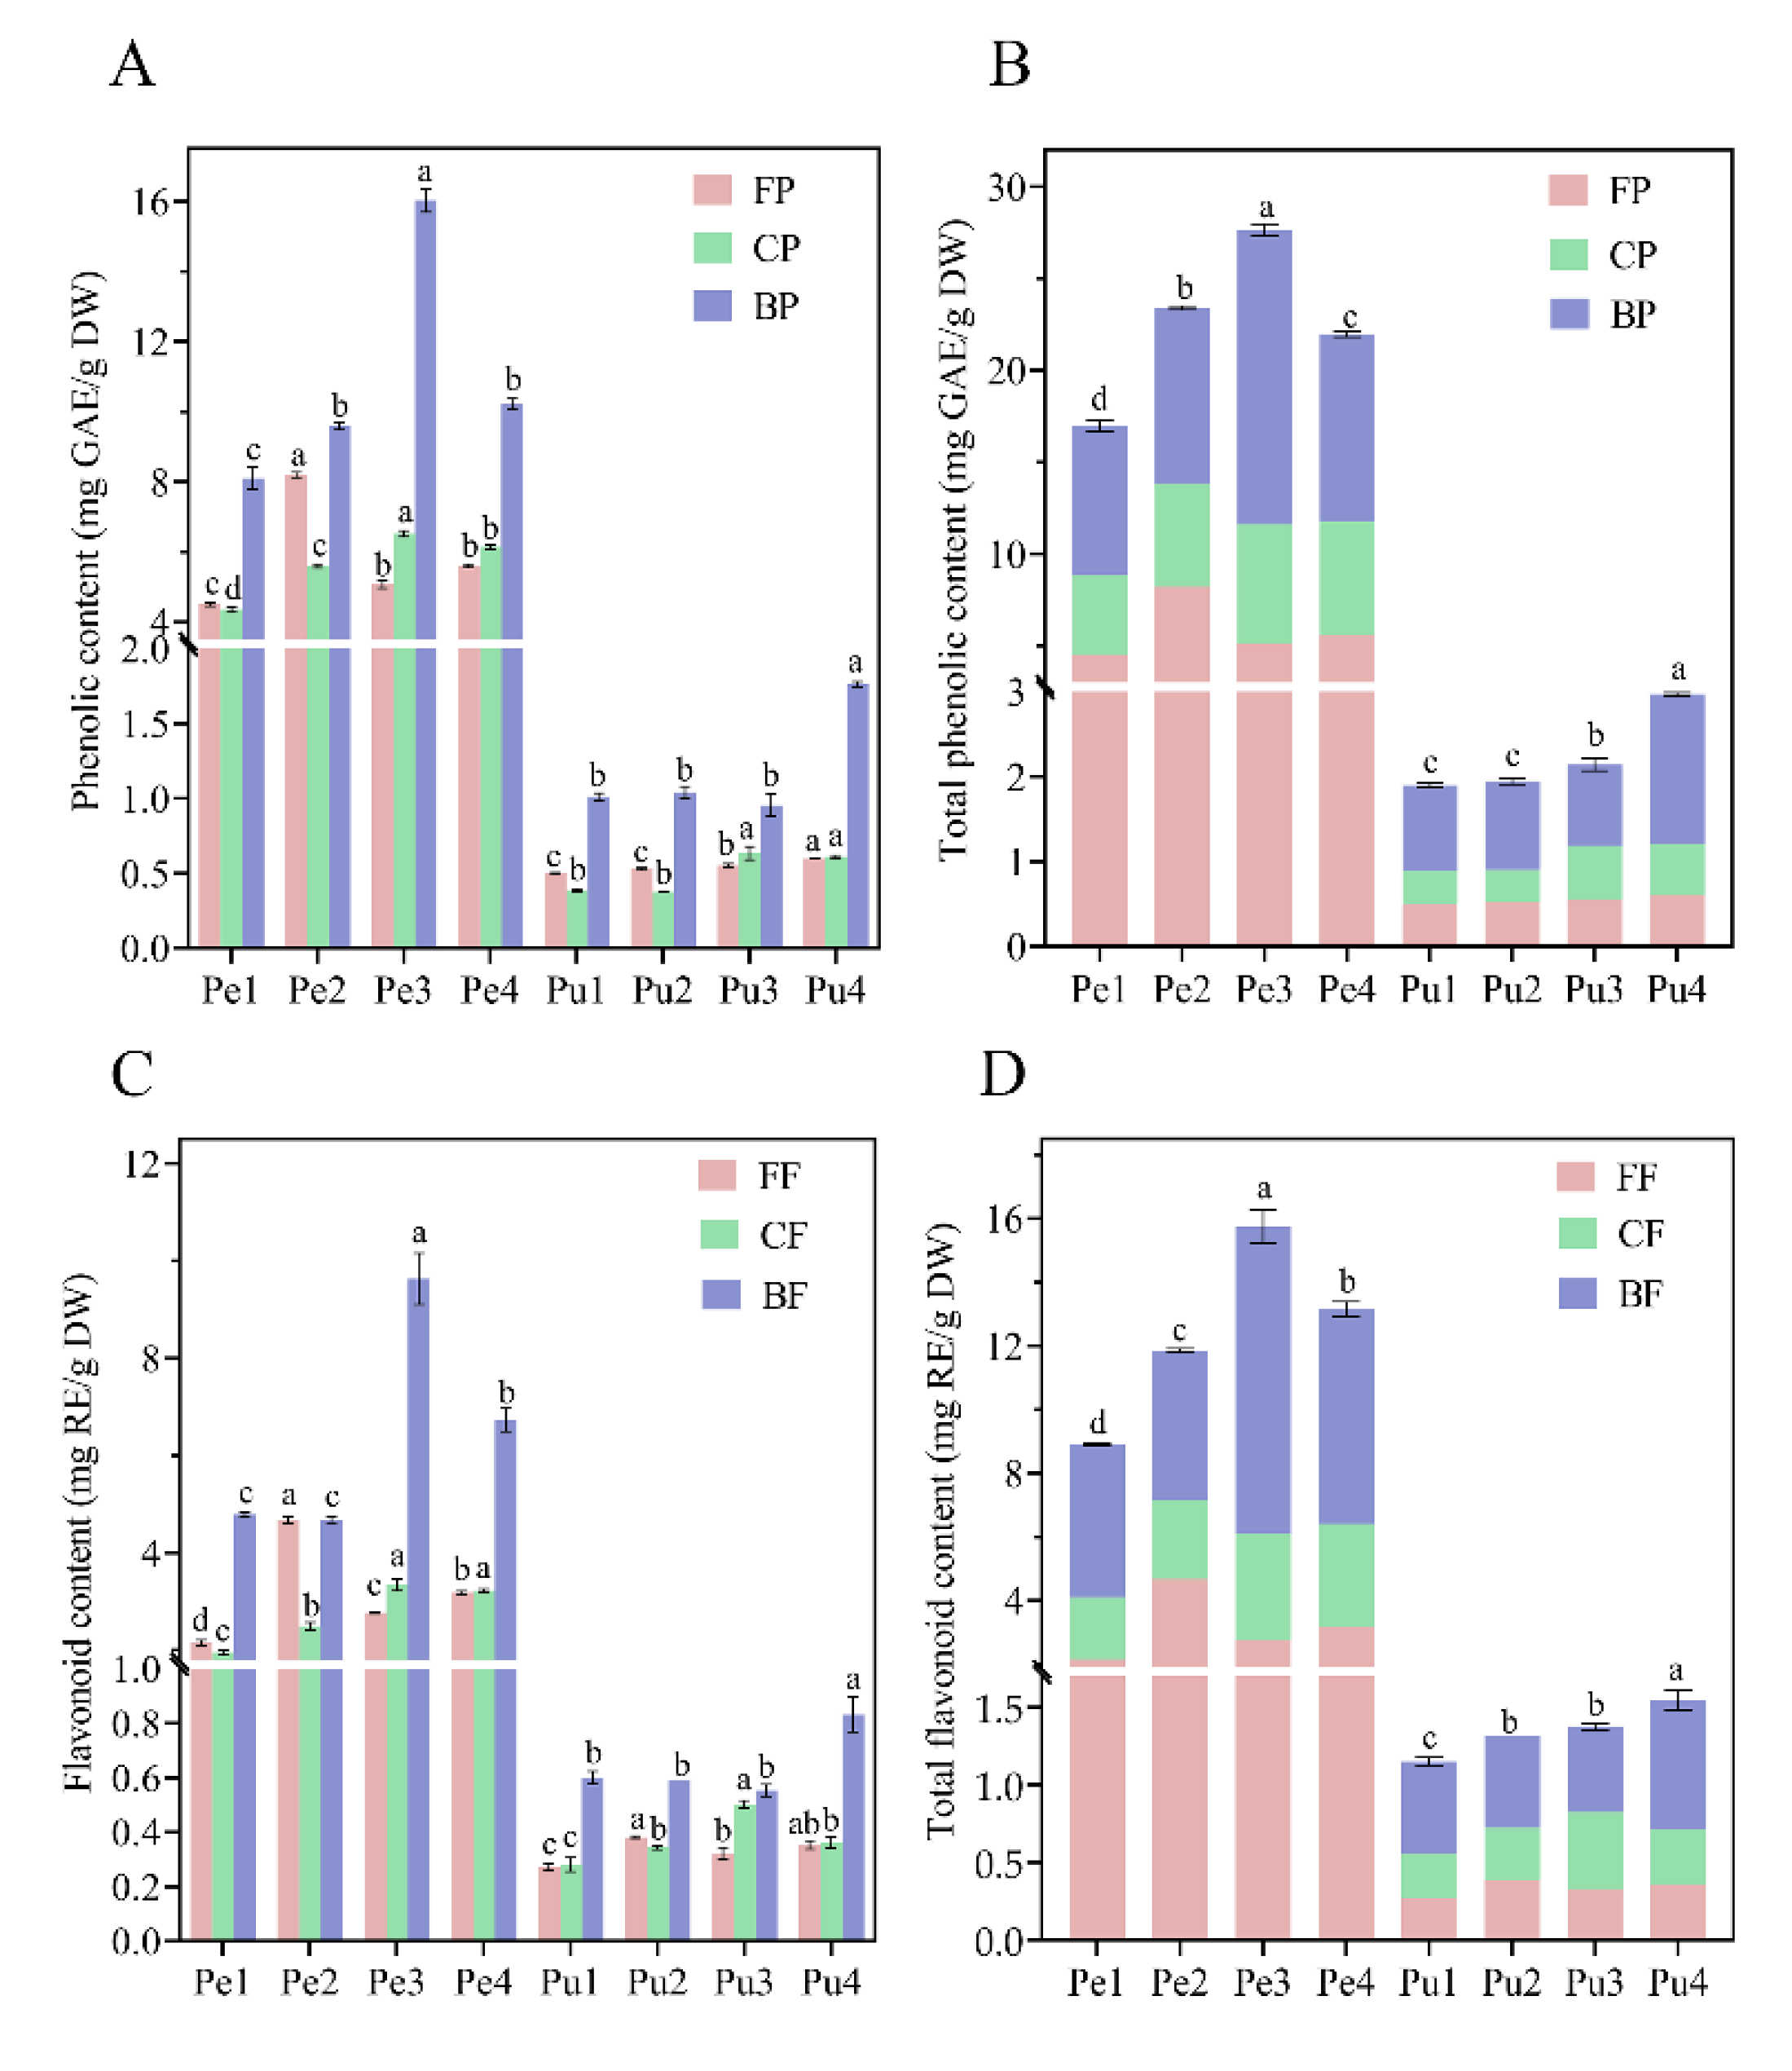
3.1. Total Phenolic Contents (TPC) and Total Flavonoid Contents (TFC)

There were significant differences among the contents of free phenolic (FP), conjugated phenolic (CP), bound phenolic (BP), free flavonoid (FF), conjugated flavonoid (CF), and bound flavonoid (BF) in the peel and pulp of different wampee samples, as shown in Figure 2. TPC and TFC in the four wampee peel samples were in the ranges of 16.99–27.64 mg GAE/g DW and 8.90–15.75 mg RE/g DW, respectively; TPC and TFC in the four pulp samples were 1.90–2.97 mg GAE/g DW and 1.15–1.55 mg RE/g DW, respectively. It was found that the contents of FP and CP in peel or pulp of the four wampee samples resembled one another, and similar contents of FF and CF were also observed in the same peel or pulp samples. Moreover, the BP or BF was dominant in the TPC or TFC, accounting for approximately 50–65% of the total contents. BP/BF contents and TPC/TFC in the peel of Jixin wampee or in the pulp of Heipi wampee were significantly higher than in other genotype samples.
Prasad et al. [1] confirmed that the phenolic contents of hexane fraction, ethyl acetate fraction, butanol fraction, and water fraction of wampee peel were 7.9 µg GAE/g DW, 330 µg GAE/g DW, 30.3 µg GAE/g DW, and 54 µg GAE/g DW, respectively. The total FP content from the above four fractions was 4.22 mg GAE/g DW, lower than those of the samples in the current study (4.52–8.20 mg GAE/g FW). Chang et al. [22] reported that the average FP and FF of peel and pulp mixture from five sour wampees were 5.22 mg GAE/g FW and 4.81 mg CE/g FW, and they were 6 times and 4 times higher than those of five sweet wampee varieties, respectively. In this research, Jixin (W3) is a sour wampee and Seedless (W1) is a sweet wampee, and we found 1.2- to 2.2-fold differences in the contents of FP, CP, BP, FF, CF, and BF of the peel or pulp from the four wampee samples. This discrepancy may be due to the diverse genotypes and growth environment.
Previous studies have mainly focused on the soluble FP of plants; however, CP and BP have been less studied. CP is soluble and can be bound to soluble oligo-saccharides or peptides by hydrophobic, covalent ester, and ether bonds, while BP is insoluble and can be covalently bound to cellulose, hemicellulose, and lignin [16,23,24,25]. Many studies demonstrate that significant amounts of CP and BP are released by colonic fermentation, and the released phenolics may play a significant role in gut health [23,26,27]. In this work, the contents of CP and BP from peel/pulp of the wampee samples accounted for 75–80% of the TPC; thus, the total phenolic content and biological activities have been seriously underestimated. The two phenolic fractions may be the predominant contributors to the delivery of antioxidants to the colon.

3.2. Identification of Phenolic Compounds

Phenolic compositions of wampee peel and pulp were analyzed by UHPLC coupled with Q-Exactive HF-X, and the total ionic chromatograms are shown in Figure S1. By comparing parent ions, MS2 fragment ions, and retention times with public databases and standards, a total of 19 polyphenols were identified, as shown in Table 2. Some of them belonged to flavonoids, including epigallocatechin, (+/−)-taxifolin, DL-catechin, isoquercitrin, (+)-epicatechin, myricetin, quercetin, rutin, fisetin, populnin (i.e., kaempferol 7-O-glucoside), quercitrin, kaempferol, and (+/−)-naringenin. The others were phenolic acids, including o-coumaric acid, gallic acid, gentisic acid, chlorogenic acid, m-salicylic acid, and caffeic acid.
Compounds 1 and 5 were easily identified as o-coumaric acid and chlorogenic acid with molecular ions at m/z 165.0549 [M+H]+ and 353.0883 [M-H], respectively, as well as MS2 fragment ions at m/z 123.0444 and 191.0543, based on the MS information from public database (MassBank of North America). Compounds 2, 3, and 10 were identified as gallic acid, gentisic acid, and caffeic acid with parent ions at m/z 169.0136 [M-H], m/z 153.0185 [M-H], and m/z 179.0344 [M-H], respectively. Moreover, all the three phenolic acids lost CO2, and created fragment ions at m/z 125.0234 [(M-H)-CO2], m/z 109.0283 [(M-H)-CO2], and m/z 135.0441 [(M-H)-CO2], respectively. These phenolic acids had similar fragment patterns to the ones reported by Zhu et al. [18], Arruda et al. [28], and Wang et al. [29].
Compounds 4 and 6 exhibited precursor ions at m/z 305.0669 [M-H], 303.0514 [M-H], and fragment ions at m/z 125.0234, 137.0229 and 125.0233, 258.0435. Therefore, they were easily identified as epigallocatechin and taxifolin by comparing the fragment patterns with the data from MassBank Europe and MassBank of North America, respectively. Compound 7 was characterized as m-salicylic acid by the molecular ion at m/z 139.0392 [M+H]+, and MS/MS fragment ions at m/z 121.0284 [(M+H)-H2O]+ and m/z 95.0493 [(M+H)-CO2]+, due to the loss of H2O and CO2. Compound 8 was identified as DL-catechin according to the similar parent ion at m/z 289.0721 [M-H] and fragment ions at 245.0468, 205.0492, and 109.0286 described by Li et al. [30]. Based on the molecular ion at m/z 335.0777 [M+FA-H], which was equal to MW 290, compound 11 was tentatively identified as (+)-epicatechin. Compound 12 exhibited a parent ion at m/z 319.0453 [M+H]+ as well as fragment ions at m/z 245.0468 [(M+H)-C3H6O2]+, 217.0505 [(M+H)-C3H6O2-CO]+, and 153.0187 [(M+H)-C7H2O5]+, due to the loss of 74 amu, 102 amu, and 166 amu. According to the similar fragment pattern, this compound was distinctly identified as myricetin [31]. Similarly, compound 13, which showed a molecular ion at m/z 303.0504 [M+H]+, with MS2 fragment ions at 229.0503 [(M+H)-C3H6O2]+, 153.0817 [(M+H)-C7H2O4]+, 137.0232 [(M+H)-C7H2O5]+, was easily identified as quercetin.
Compounds 15 and 18 were two isomers and tentatively identified as fisetin and kaempferol, according to the same precursor ion at m/z 287.0555 [M+H]+ with MS/MS fragment ions at m/z 213.0554 [(M+H)-C3H6O2]+, 137.0242 [(M+H)-C7H2O4]+, 121.0289 [(M+H)-C7H2O5]+, and MS/MS fragment ions at m/z 153.0185 [(M+H)-C7H2O3]+, 121.0289 [(M+H)-C7H2O5]+, respectively. By comparing the fragment patterns (MS/MS ions at m/z 271.0615 [M-H], 151.0030 and 119.0492) with the data from MassBank Europe, compound 19 was distinctly identified as (+/−)-naringenin.
In view of the molecular ion at m/z 465.1037 [M+H]+ and fragment ions at m/z 303.0498 [C15H10O7+H]+ and 285.0414 [(C15H10O7+H)-H2O]+, compound 9 was tentatively identified as quercetin 3-O-glucoside. Considering a precursor ion at m/z 611.1617 [M+H]+ and the MS/MS fragment ion at m/z 303.0501 [C15H10O7+H]+, compound 14 was easily identified as rutin. Compounds 16 and 17 were two isomers and identified as kaempferol 7-O-glucoside and quercitrin, because the former was characterized by the parent ion at m/z 449.1086 [M+H]+ and MS/MS fragment ions at 431.0988 [(M+H)-H2O]+, 287.0529 [C15H10O6+H]+. However, the latter exhibited the molecular ion m/z 447.0938 [M-H] and MS/MS fragment ions at m/z 300.0272 [C15H10O7-2H], 271.0249, 255.0298, the result being consistent with the fragment pattern of quercitrin from MassBank of North America.

3.3. Quantitative Analysis of Phenolic Composition

As shown in Table 3, the contents of gallic acid, DL-catechin, caffeic acid, populnin, quercetin, and kaempferol were much lower than other phenolics in all the peel/pulp from the four wampee varieties. Moreover, BP in the peel of Jixin wampee had significantly higher chlorogenic acid (2611.36 µg/g DW), gentisic acid (1423.05 µg/g DW), rutin (1197.04 µg/g DW), and myricetin (2499.72 µg/g DW) than in other samples, which resulted in higher TPC.
Chlorogenic acid was distributed over FP, CP, and BP of all the samples. In wampee peel, it was mostly concentrated in BP, less in FP, and least in CP, but it was most in BP and with similar content in FP and CP from the wampee pulp. It was found that gentisic acid and rutin almost distributed over FP, CP, and BP in all the peel and pulp samples. They were mostly concentrated in CP, less in BP, and least in FP. Isoquercitrin mainly existed in CP, and had similar content in FP and BP from almost all the peel and pulp samples. Quercitrin was much more abundant than other phenolics in BP from all the peel and pulp samples. In addition, it was also rich in FP from all peel and pulp samples and in peel CP, but it was not detected in CP of the pulp samples. o-Coumaric acid was rich in FP and CP from almost all peel and pulp samples, but it did not exist in all BP. Myricetin was rich and predominant in FP of wampee peel and pulp and also existed in BP of the peel of Seedless and Jixin wampee. However, it was not detected in CP and BP of the other peel and pulp samples.
Although many studies have measured the content of FP and phytochemical components [22,32,33], information remains lacking about the characterization and contents of FP, CP, and BP of different wampee varieties and different parts. Chang et al. [22] reported that rutin in FP of the mixture of peel and pulp from all ten wampee varieties was richer (>38.41 µg/g FW) than the other seven phytochemical components, including syringin, benzoic acid, 2-methoxycinnamic acid, kaempferol, hesperetin, nobiletin, and tangeretin, and kaempferol with low content was only detected in FP from three sour wampee varieties and less than 2.29 µg/g FW. The contents of rutin and kaempferol in FP were similar to those in the present work. In recent studies, fifteen flavonoids (taxifolin-3-O-rhamnoside and other flavone glycosides) and nine phenolic acids (o-coumaric acid and other chemicals) were identified as different metabolites in the juice extracted from the pulp of sweet, sweet–sour, and sour wampee samples by UPLC-MS/MS-based widely targeted metabolome analysis [32,33]. Most of the 24 components were different from the phenolic composition in this study, which may be due to differences in extraction methods, detection means, and genotypes.

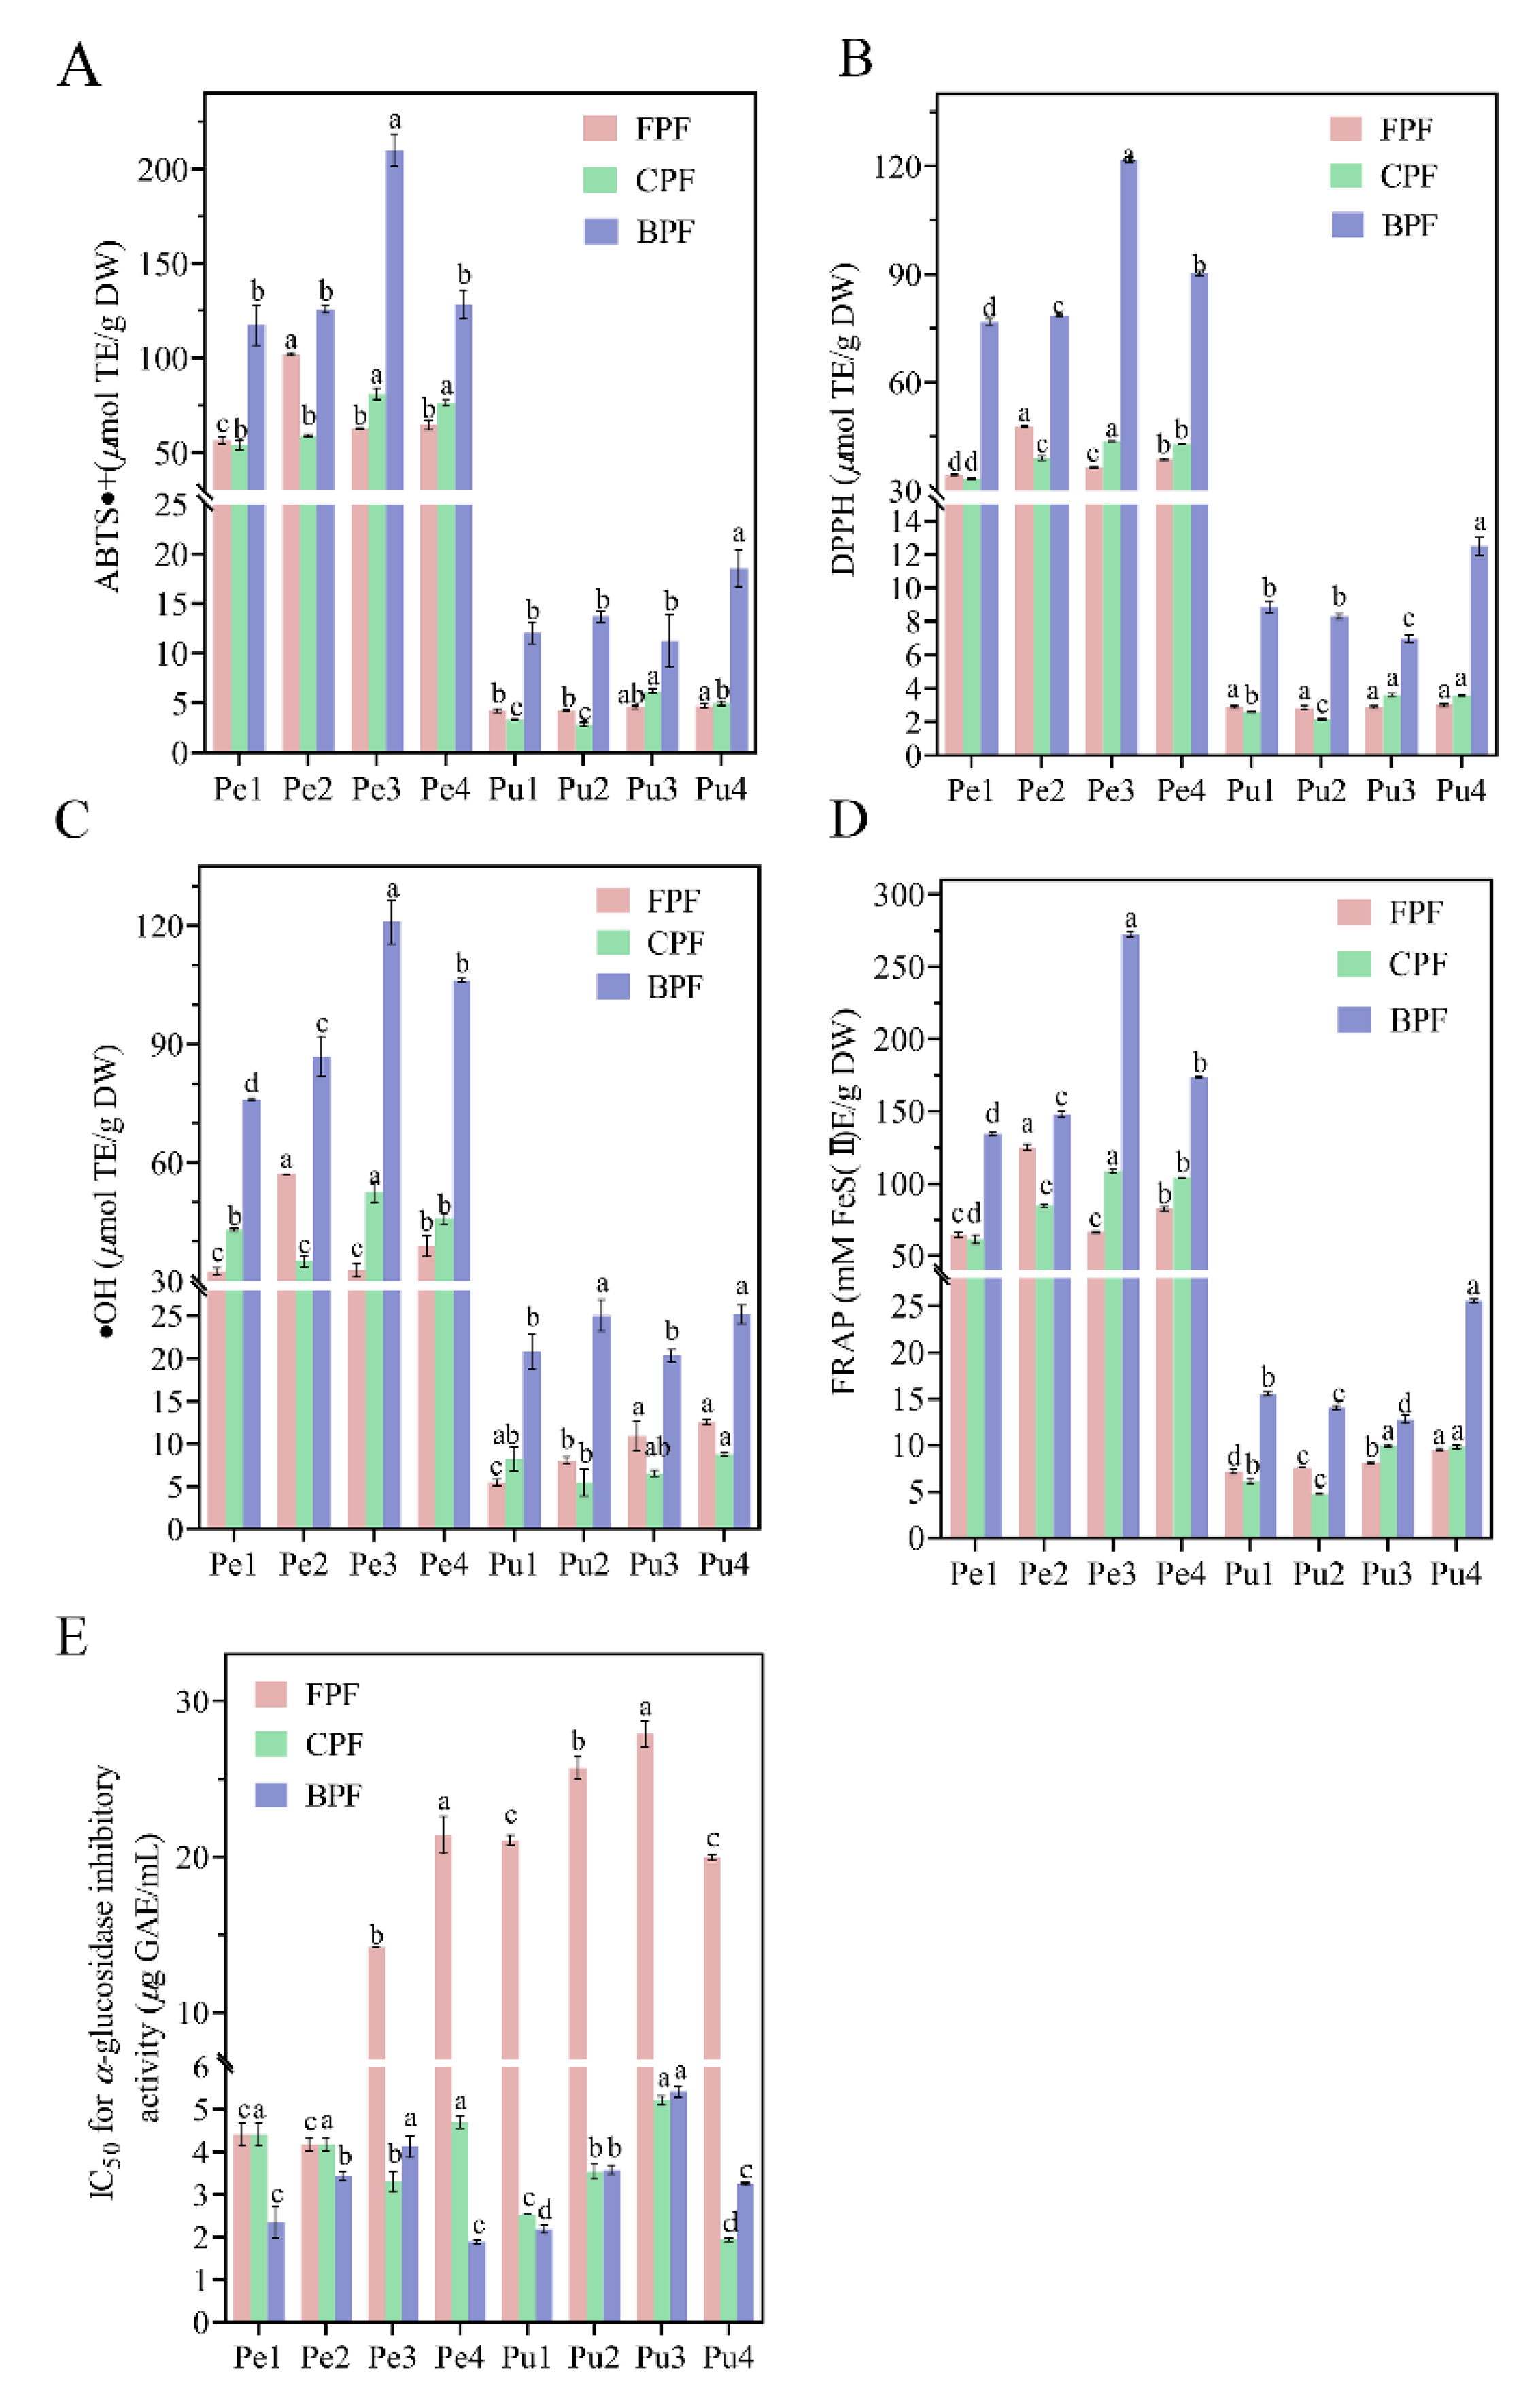
3.4. Antioxidant Activities

In this work, three radical scavenging models, ABTS·+, DPPH, and ·OH, as well as another total antioxidant capacity assay (FRAP), were used to measure antioxidant activities of FP, CP, and BP from the peel and pulp of the four wampee varieties, since at least two models should be employed for evaluating in vitro antioxidant capacities [34].
As shown in Figure 3A–E, antioxidant activities of FP, CP, and BP from the different wampee varieties and positions varied significantly. Regarding ABTS+ model, the antioxidant levels of FP, CP, and BP in peel of different wampee varieties were 56.32–101.93 µmol TE/g DW, 53.84–80.94 µmol TE/g DW, and 117.32–210.00 µmol TE/g DW, respectively; those of the pulp samples were in the ranges of 4.25–4.73 µmol TE/g DW, 2.85–4.96 µmol TE/g DW, and 11.26–18.56 µmol TE/g DW, respectively. For the DPPH assay, FP, CP, and BP from peel samples yielded antioxidant values of 34.49–47.81 µmol TE/g DW, 33.38–43.68 µmol TE/g DW, and 76.79–121.84 µmol TE/g DW, respectively; those from pulp samples showed the values of 2.85–3.02 µmol TE/g DW, 2.14–3.62 µmol TE/g DW, and 6.97–12.49 µmol TE/g DW, respectively. With regard to the results of ·OH analysis, the antioxidant values of FP, CP, and BP from peel of the four wampee varieties were 32.49–57.03 µmol TE/g DW, 35.05–52.54 µmol TE/g DW, and 76.03–120.94 µmol TE/g DW, respectively. However, those from pulp samples differed were 5.47–12.57 µmol TE/g DW, 5.48–8.76 µmol TE/g DW, and 20.32–25.18 µmol TE/g DW, respectively. In addition, FRAP values of FP, CP, and BP from the peel samples were in the ranges of 64.84–125.23 µmol TE/g DW, 61–108.77 µmol TE/g DW, and 134.60–272.56 µmol TE/g DW, respectively, while those from the pulp samples were in the ranges of 7.18–9.55 µmol TE/g DW, 4.79–9.82 µmol TE/g DW, and 12.78–25.60 µmol TE/g DW, respectively. More importantly, BP of Jixin wampee peel and BP of Heipi wampee pulp exhibited much higher antioxidant capacities in all the four models than other peel or pulp samples. Moreover, antioxidant activities of BP fractions from all peel or pulp samples were much higher than those of CP and FP fractions, and the latter two fractions from each of the samples showed roughly similar antioxidant values. The results indicated that the BP fractions of peel and pulp of the four wampee varieties were the main contributors to the antioxidant capacities.

3.5. α-Glucosidase Inhibitory Activity

Diabetes is one of the major causes of disability [35], and type 2 diabetes (T2D) accounts for 90% of all diabetes [36]. The global diabetes prevalence in 2019 was estimated to be 9.3% (463 million people), and this value is expected to rise to 10.2% (578 million) by 2030 and 10.9% (700 million) by 2045 [37]. Therefore, it is obvious that global health spending on diabetes will greatly increase. Until June 2019, metformin and insulin were approved as the only drugs for adult T2D by the U.S. Food and Drug Administration (FDA) [38]. However, metformin can induce gastrointestinal and cutaneous side effects and lactic acidosis [39], and insulin therapy may result in hypoglycemia and weight gain [40,41]. It is therefore urgent to find alternative products from natural compounds without side effects to manage T2D. Many studies have reported that polyphenol intake is related to decreasing the risk of insulin resistance and T2D [13].
It is shown in Figure 3E that FP, CP, and BP from peel and pulp of the four wampee samples exhibited outstanding inhibitory activity against α-glucosidase. Due to the lower IC50 value with higher α-glucosidase inhibition, FP of the pulp from Jixin wampee was the lowest α-glucosidase inhibitor (IC50 = 27.89 ± 0.83 µg GAE/mL), and BP of the peel from Heipi wampee was the highest α-glucosidase inhibitor (IC50 = 1.89 ± 0.04 µg GAE/mL) of all the samples. It is worth noting that all the pulp samples from the same phenolic fraction (FP, CP, or BP) displayed roughly similar IC50 values to those from the peel samples, but wide variations existed in their phenolic/flavonoid contents and antioxidant activities, as shown in Figure 2 and Figure 3A–D. The abundant flavonoid composition in all the peel and pulp samples may contribute to their strong α-glucosidase inhibition. Many studies have confirmed that flavonoid compounds, such as quercetin (IC50 = 15.71 µg/mL), myricetin (IC50 = 36.17 µg/mL), rutin (IC50 = 68.16 µg/mL), and quercitrin (IC50 = 113.27 µg/mL), have excellent inhibitory activity against α-glucosidase [19,42].

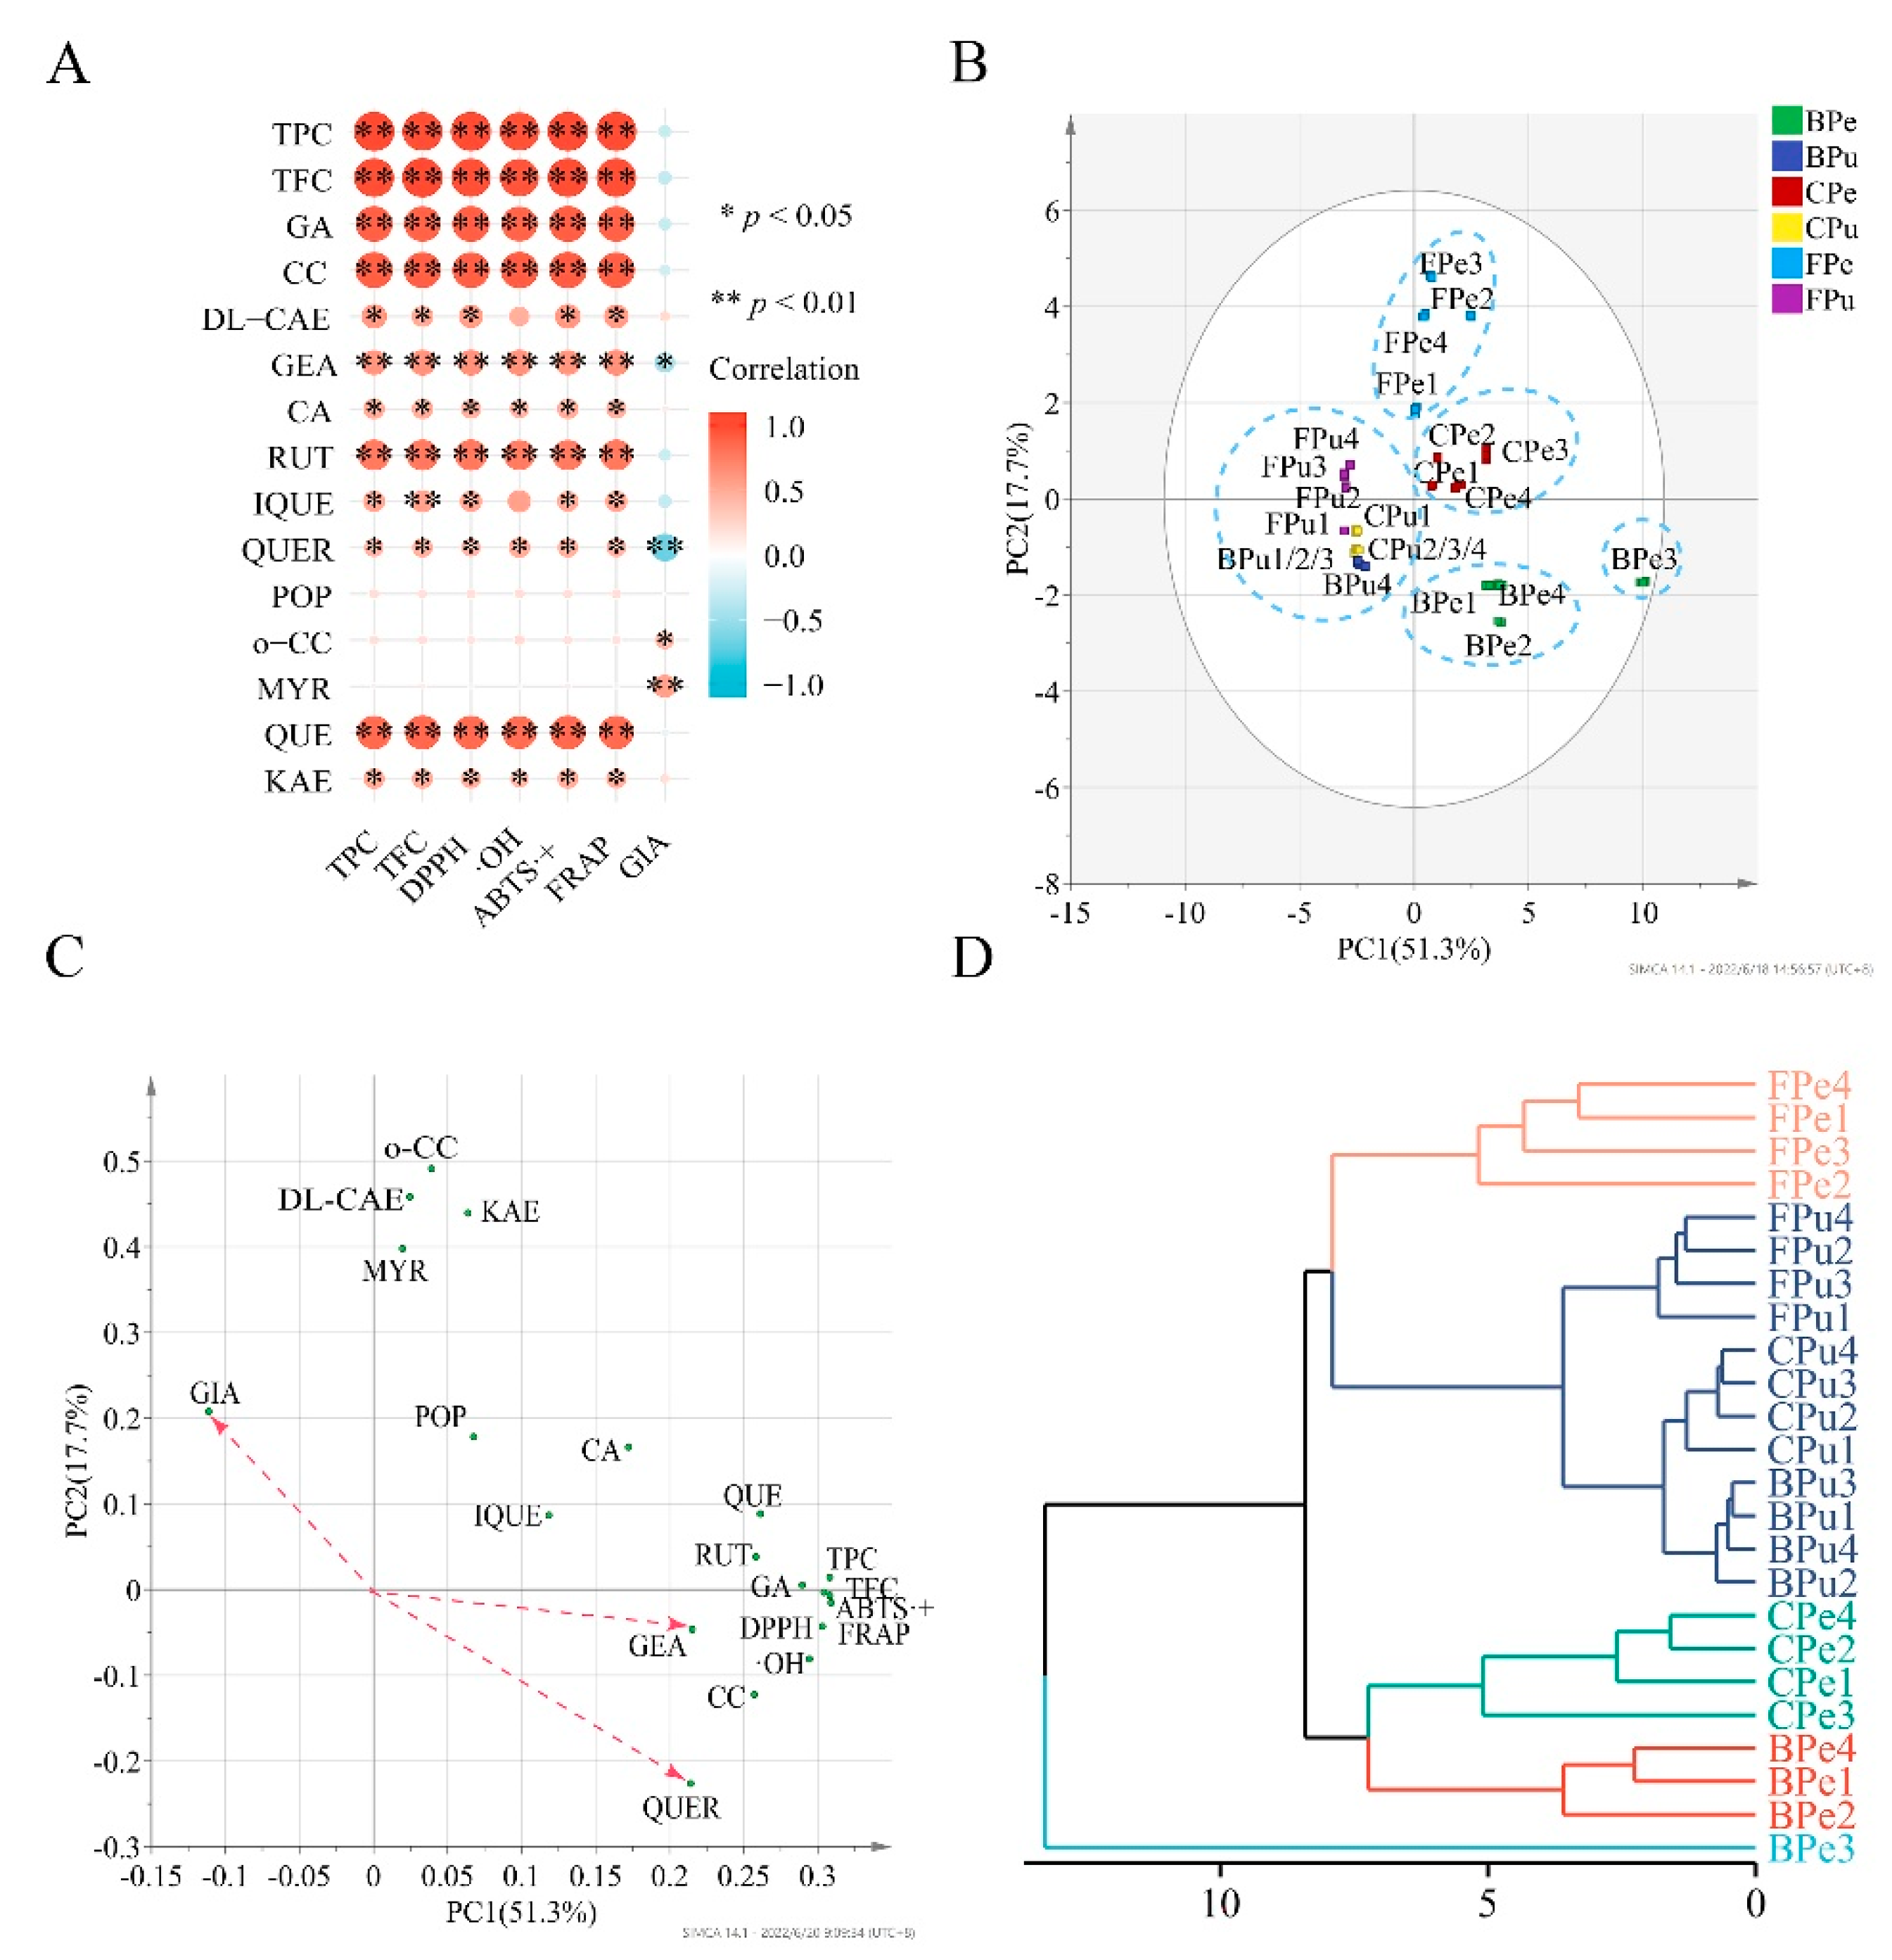
3.6. Correlation Analysis and Multivariate Analysis

In this work, Pearson correlation analysis was used to comprehensively explore the relationship between individual phenolic and TPC/TFC/bio-activities (ABTS+, DPPH, ·OH, and FRAP values and IC50 value of α-glucosidase inhibition) in FP, CP, and BP of peel and pulp from the four wampee varieties.
Correlation coefficients of TPC vs. TFC/ABTS+/DPPH/·OH/FRAP/α-glucosidase inhibition (GIA) were 0.983 (p < 0.01), 0.998 (p < 0.01), 0.995 (p < 0.01), 0.970 (p < 0.01), 0.997 (p < 0.01), and −0.291 (p > 0.05), respectively. TFC had similar correlation coefficients with ABTS·+ (r = 0.986, p < 0.01), DPPH (r = 0.977, p < 0.01), ·OH (r = 0.957, p < 0.01), FRAP (r = 0.984, p < 0.01), and GIA (r = −0.317, p > 0.05). It is obvious that the antioxidant activities significantly correlated with TPC and TFC, while GIA did not significantly correlate with them. Moreover, the four antioxidant activities showed significantly positive correlations with the contents of gallic acid, chlorogenic acid, DL-catechin, gentisic acid, caffeic acid, rutin, isoquercitrin, quercitrin, quercetin, and kaempferol and no significant correlation with the contents of populnin, o-coumaric acid, and myricetin. Nevertheless, except for gentisic acid (r = −0.489, p < 0.05), quercitrin (r = −0.691, p < 0.05), o-coumaric acid (r = 0.441, p < 0.05), and myricetin (r = 0.563, p < 0.05), other phenolic compounds in the wampee samples were not significantly correlated with GIA (Figure 4A).
Principal component analysis (PCA) and hierarchical cluster analysis (HCA) are widely used for classifying samples into different groups with different algorithms. TPC, TFC, individual phenolic, and bio-activities were used as variables in PCA and HCA, and Euclidean distance was applied in HCA. PC1 and PC2 explained 69% of the total variance in the data; hence, the two principal components can be used for dimensionality reduction. The PCA score plot shows sample–sample similarities; samples can be clustered into a group with high similarity if they are close together, while samples in different groups have high discrepancy. As shown in Figure 4B, peel FP samples, peel CP samples and pulp FP, CP, and BP samples of the four wampee varieties were severally close and separated into three groups. BP samples from the other three varieties’ peels had similar scores and were close together, except for BP of Jixin wampee peel. Therefore, all the samples were classified into five groups. It is interesting that the same result was found in HCA (Figure 4D).
The PCA loading plot displays the relationship among variables. The smaller an acute angle between two variables is, the higher positive correlation they show. However, the larger an obtuse angle between two variables is, the higher negative correlation they possess. A right angle between two variable vectors means they do not correlate. It is shown in Figure 4C that all the acute angles between TPC/TFC and ABTS+/DPPH/OH/FRAP were very small, and each of angles between the contents of populnin/o-coumaric acid/myricetin and ABTS+/DPPH/OH/FRAP was close to 90°. In addition, the obtuse angles between GIA and gentisic acid/quercitrin were the largest two and the acute angles between GIA and o-coumaric acid/myricetin were almost the two smallest. Therefore, the correlations between TPC/TFC/the contents of individual phenolic compounds and ABTS+/DPPH/OH/FRAP/GIA analyzed by PCA were roughly similar to those obtained with Pearson correlation analysis.

4. Conclusions

In this work, the contents and phenolic compositions of FP, CP, and BP fractions of peel and pulp from four diverse wampee varieties and their in vitro bio-activities, including antioxidant and α-glucosidase inhibitory activities, were reported. The results show that the contents of FP, CP, BP, TPC, and TFC and the antioxidant capacities of all peel samples were much higher than those of all pulp samples. Meanwhile, for peel/pulp from all the wampee varieties, BP/BF was the greatest fraction, accounting for over 50% of TPC/TFC. TPC and TFC in the wampee peel were 16.99–27.64 mg GAE/g DW and 8.90–15.75 mg RE/g DW, respectively, vs. 1.90–2.97 mg GAE/g DW and 1.15–1.55 mg RE/g DW in the wampee pulp. For BP fractions from the wampee peel, the antioxidant values in ABTS+, DPPH, OH, and FRAP models were in the ranges of 117.32–210.00 µmol TE/g DW, 76.79–121.84 µmol TE/g DW, 76.03–120.94 µmol TE/g DW, and 134.60–272.56 µmol TE/g DW, respectively. For BP fractions from the wampee pulp, corresponding values were 11.26–18.56 µmol TE/g DW, 6.79–12.49 µmol TE/g DW, 20.32–25.18 µmol TE/g DW, and 12.78–25.60 µmol TE/g DW, respectively. Chlorogenic acid, gentisic acid, and rutin were abundantly distributed over FP, CP, and BP in wampee peel and pulp. Isoquercitrin was the most abundant in CP of peel/pulp, and myricetin was had richest contents in FP of peel/pulp. Wampee peel showed stronger antioxidant capacities of ABTS+, DPPH, ·OH, and FRAP than the pulp, and BP of the peel/pulp had much higher antioxidant activities than FP and CP fractions. However, the same phenolic fractions (FP, CP, or BP) of the wampee peel displayed roughly similar IC50 values of α-glucosidase inhibition to those of the pulp samples. Moreover, by using Pearson correlation analysis and PCA, we found that TPC, TFC, and the contents of most of phenolic compounds in the wampee samples were significantly positively correlated with the antioxidant activities, whereas the contents of gentisic acid and quercitrin were significantly negatively correlated with IC50 values of α-glucosidase inhibition. Except for the BP fraction of Jixin wampee peel, all the other samples were categorized into four classes by PCA and HCA. Overall, BP in peel from all wampee varieties, especially from Jixin wampee, showed high antioxidant activities, and all phenolic fractions (FP, CP, and BP) of the peel/pulp from all wampee samples had excellent inhibitory activities against α-glucosidase. Findings from the present study provide a rationale for applying phenolics from wampee fruits.

Supplementary Materials

The following supporting information can be downloaded at: https://www.mdpi.com/article/10.3390/antiox11091831/s1, Figure S1: The total ionic chromatograms of free, conjugate, and bound phenolic fractions of wampee peel and pulp by UHPL-Q-Exactive HF-X.

Author Contributions

X.L. designed the experiments and analyzed the data. Y.S. and P.W. conducted the analytical experiments. X.H. supervised and wrote the manuscript. L.W. analyzed the data and helped to modify the manuscript. All authors have read and agreed to the published version of the manuscript.

Funding

This work was supported by the National Natural Science Foundation of China (32060513) and Hainan Provincial Natural Science Foundation of China (321RC1030 and 321RC1075).

Institutional Review Board Statement

Not applicable.

Informed Consent Statement

Not applicable.

Data Availability Statement

Data are contained within the article.

Conflicts of Interest

The authors declare no conflict of interest.

Abbreviations

Wwampee
Pepeel
Pupulp
DWdry weight
FPfree phenolic
CPconjugated phenolic
BPbound phenolic
FFfree flavonoid
CFconjugated flavonoid
BFbound flavonoid
TPCtotal phenolic content
TFCtotal flavonoid content
GAEgallic acid equivalents
RErutin equivalents
TETrolox equivalents

References

  1. Prasad, K.N.; Hao, J.; Yi, C.; Zhang, D.; Qiu, S.; Jiang, Y.; Zhang, M.; Chen, F. Antioxidant and anticancer activities of wampee (Clausena lansium (Lour.) Skeels) peel. J. Biomed. Biotechnol. 2009, 2009, 612805. [Google Scholar] [CrossRef] [PubMed]
  2. Fan, Y.; Sahu, S.K.; Yang, T.; Mu, W.; Wei, J.; Cheng, L.; Yang, J.; Liu, J.; Zhao, Y.; Lisby, M.; et al. The Clausena lansium (Wampee) genome reveal new insights into the carbazole alkaloids biosynthesis pathway. Genomics 2021, 113, 3696–3704. [Google Scholar] [CrossRef] [PubMed]
  3. Kumar, V.; Vallipuram, K.; Adebajo, A.C.; Reisch, J. 2,7-dihydroxy-3-formyl-1-(3′-methyl-2′-butenyl) carbazole from Clausena lansium. Phytochemistry 1995, 40, 1563–1565. [Google Scholar] [CrossRef]
  4. Adebajo, A.C.; Iwalewa, E.O.; Obuotor, E.M.; Ibikunle, G.F.; Omisore, N.O.; Adewunmi, C.O.; Obaparusi, O.O.; Klaes, M.; Adetogun, G.E.; Schmidt, T.J.; et al. Pharmacological properties of the extract and some isolated compounds of Clausena lansium stem bark: Anti-trichomonal, antidiabetic, anti-inflammatory, hepatoprotective and antioxidant effects. J. Ethnopharmacol. 2009, 122, 10–19. [Google Scholar] [CrossRef]
  5. Liu, H.; Li, C.-J.; Yang, J.-Z.; Ning, N.; Si, Y.-K.; Li, L.; Chen, N.-H.; Zhao, Q.; Zhang, D.-M. Carbazole alkaloids from the stems of Clausena lansium. J. Nat. Prod. 2012, 75, 677–682. [Google Scholar] [CrossRef] [PubMed]
  6. Li, W.-S.; Mcchesney, J.D.; El-Feraly, F.S. Carbazole alkaloids from Clausena lansium. Phytochemistry 1991, 30, 343–346. [Google Scholar] [CrossRef]
  7. Kong, F.; Su, Z.; Guo, X.; Zeng, F.; Bi, Y. Antidiabetic and lipid-lowering effects of the polyphenol extracts from the leaves of Clausena lansium (Lour.) Skeels on streptozotocin-induced type 2 diabetic rats. J. Food Sci. 2018, 83, 212–220. [Google Scholar] [CrossRef]
  8. Fan, R.; Peng, C.; Zhang, X.; Qiu, D.; Mao, G.; Lu, Y.; Zeng, J. A comparative UPLC-Q-Orbitrap-MS untargeted metabolomics investigation of different parts of Clausena lansium (Lour.) Skeels. Food Sci. Nutr. 2020, 8, 5811–5822. [Google Scholar] [CrossRef]
  9. Ao, H.; Jia, X.; Dong, L.; Zhang, R.; Liu, L.; Huang, F.; Wang, L.; Zhang, M. A new benzofuran glycoside from the fruit of Clausena lansium. Nat. Prod. Res. 2020, 36, 501–507. [Google Scholar] [CrossRef]
  10. Sanford, S.L.; Welfer, G.A.; Freudenthal, B.D.; Opresko, P.L. Mechanisms of telomerase inhibition by oxidized and therapeutic dNTPs. Nat. Commun. 2020, 11, 5288. [Google Scholar] [CrossRef]
  11. Hussain, T.; Tan, B.; Yin, Y.; Blachier, F.; Tossou, M.C.B.; Rahu, N. Oxidative stress and inflammation: What polyphenols can do for us? Oxid. Med. Cell. Longev. 2016, 2016, 7432797. [Google Scholar] [CrossRef] [PubMed]
  12. Spencer, J.P.E.; Abd El Mohsen, M.M.; Minihane, A.-M.; Mathers, J.C. Biomarkers of the intake of dietary polyphenols: Strengths, limitations and application in nutrition research. Brit. J. Nutr. 2007, 99, 12–22. [Google Scholar] [CrossRef] [PubMed]
  13. Chiva-Blanch, G.; Badimon, L. Effects of polyphenol intake on metabolic syndrome: Current evidences from human trials. Oxid. Med. Cell. Longev. 2017, 2017, 5812401. [Google Scholar] [CrossRef] [PubMed]
  14. Cardozo, L.F.M.F.; Pedruzzi, L.M.; Stenvinkel, P.; Stockler-Pinto, M.B.; Daleprane, J.B.; Leite, M.; Mafra, D. Nutritional strategies to modulate inflammation and oxidative stress pathways via activation of the master antioxidant switch Nrf2. Biochimie 2013, 95, 1525–1533. [Google Scholar] [CrossRef] [PubMed]
  15. Li, L.; Shewry, P.R.; Ward, J.L. Phenolic acids in wheat varieties in the HEALTHGRAIN Diversity Screen. J. Agri. Food Chem. 2008, 56, 9732–9739. [Google Scholar] [CrossRef]
  16. Gao, Y.; Ping, H.; Li, B.; Li, Y.; Zhao, F.; Ma, Z. Characterization of free, conjugated, and bound phenolics in early and late ripening kiwifruit cultivars. J. Sci. Food Agr. 2021, 101, 4743–4750. [Google Scholar] [CrossRef]
  17. Dou, Z.; Chen, C.; Fu, X. Bioaccessibility, antioxidant activity and modulation effect on gut microbiota of bioactive compounds from Moringa oleifera Lam. leaves during digestion and fermentation in vitro. Food Funct. 2019, 10, 5070–5079. [Google Scholar] [CrossRef]
  18. Zhu, H.; Zhang, J.; Li, C.; Liu, S.; Wang, L. Morinda citrifolia L. leaves extracts obtained by traditional and eco-friendly extraction solvents: Relation between phenolic compositions and biological properties by multivariate analysis. Ind. Crops Prod. 2020, 153, 112586. [Google Scholar] [CrossRef]
  19. Lin, X.; Chen, S.; Wang, R.; Li, C.; Wang, L. Fabrication, characterization and biological properties of pectin and/or chitosan-based films incorporated with noni (Morinda citrifolia) fruit extract. Food Hydrocolloids 2023, 134, 108025. [Google Scholar] [CrossRef]
  20. Wu, L.; Chen, Z.; Li, S.; Wang, L.; Zhang, J. Eco-friendly and high-efficient extraction of natural antioxidants from Polygonum aviculare leaves using tailor-made deep eutectic solvents as extractants. Sep. Purif. Technol. 2021, 262, 118339. [Google Scholar] [CrossRef]
  21. Cai, Y.; Wu, L.; Lin, X.; Hu, X.; Wang, L. Phenolic profiles and screening of potential α-glucosidase inhibitors from Polygonum aviculare L. leaves using ultra-filtration combined with HPLC-ESI-qTOF-MS/MS and molecular docking analysis. Ind. Crops Prod. 2020, 154, 112673. [Google Scholar] [CrossRef]
  22. Chang, X.; Ye, Y.; Pan, J.; Lin, Z.; Qiu, J.; Peng, C.; Guo, X.; Lu, Y. Comparative analysis of phytochemical profiles and antioxidant activities between sweet and sour wampee (Clausena lansium) fruits. Foods 2022, 11, 1230. [Google Scholar] [CrossRef] [PubMed]
  23. Sun, Y.; Deng, Z.; Liu, R.; Zhang, H.; Zhu, H.; Jiang, L.; Tsao, R. A comprehensive profiling of free, conjugated and bound phenolics and lipophilic antioxidants in red and green lentil processing by-products. Food Chem. 2020, 325, 126925. [Google Scholar] [CrossRef] [PubMed]
  24. Bei, Q.; Liu, Y.; Wang, L.; Chen, G.; Wu, Z. Improving free, conjugated, and bound phenolic fractions in fermented oats (Avena sativa L.) with Monascus anka and their antioxidant activity. J. Funct. Foods 2017, 32, 185–194. [Google Scholar] [CrossRef]
  25. Acosta-Estrada, B.A.; Gutiérrez-Uribe, J.A.; Serna-Saldívar, S.O. Bound phenolics in foods, a review. Food Chem. 2014, 152, 46–55. [Google Scholar] [CrossRef] [PubMed]
  26. Saura-Calixto, F. Dietary fiber as a carrier of dietary antioxidants: An essential physiological function. J. Agric. Food Chem. 2010, 59, 43–49. [Google Scholar] [CrossRef]
  27. Zhang, X.; Zhang, M.; Dong, L.; Jia, X.; Liu, L.; Ma, Y.; Huang, F.; Zhang, R. Phytochemical profile, bioactivity, and prebiotic potential of bound phenolics released from rice bran dietary fiber during in vitro gastrointestinal digestion and colonic fermentation. J. Agric. Food Chem. 2019, 67, 12796–12805. [Google Scholar] [CrossRef]
  28. Arruda, H.S.; Pereira, G.A.; de Morais, D.R.; Eberlin, M.N.; Pastore, G.M. Determination of free, esterified, glycosylated and insoluble-bound phenolics composition in the edible part of araticum fruit (Annona crassiflora Mart.) and its by-products by HPLC-ESI-MS/MS. Food Chem. 2018, 245, 738–749. [Google Scholar] [CrossRef]
  29. Wang, R.; He, R.; Li, Z.; Wang, L. LC-Q-Orbitrap-MS/MS characterization, antioxidant activity, and alpha-glucosidase-inhibiting activity with in silico analysis of extract from Clausena indica (Datz.) oliv fruit pericarps. Front. Nutr. 2021, 8, 727087. [Google Scholar] [CrossRef]
  30. Li, W.; Yang, R.; Ying, D.; Yu, J.; Sanguansri, L.; Augustin, M.A. Analysis of polyphenols in apple pomace: A comparative study of different extraction and hydrolysis procedures. Ind. Crops Prod. 2020, 147, 112250. [Google Scholar] [CrossRef]
  31. Bhagya, N.; Chandrashekar, K.R. Identification and quantification of cytotoxic phenolic acids and flavonoids in Ixora brachiata by UHPLC-DAD and UHPLC-ESI-MS/MS. Int. J. Mass. Spectrom. 2020, 450, 116290. [Google Scholar] [CrossRef]
  32. Yin, Q.-C.; Ji, J.-B.; Zhang, R.-H.; Duan, Z.-W.; Xie, H.; Chen, Z.; Hu, F.-C.; Deng, H. Identification and verification of key taste components in wampee using widely targeted metabolomics. Food Chem. X 2022, 13, 100261. [Google Scholar] [CrossRef] [PubMed]
  33. Yin, Q.; Zhang, R.; Wu, G.; Chen, Z.; Deng, H. Comparative metabolomics analysis reveals the taste variations among three selected wampee cultivars. Plant Food. Hum. Nutr. 2022, 77, 250–257. [Google Scholar] [CrossRef]
  34. Albishi, T.; John, J.A.; Al-Khalifa, A.S.; Shahidi, F. Phenolic content and antioxidant activities of selected potato varieties and their processing by-products. J. Funct. Foods 2013, 5, 590–600. [Google Scholar] [CrossRef]
  35. James, S.L.; Abate, D.; Abate, K.H.; Abay, S.M.; Abbafati, C.; Abbasi, N.; Abbastabar, H.; Abd-Allah, F.; Abdela, J.; Abdelalim, A.; et al. Global, regional, and national incidence, prevalence, and years lived with disability for 354 diseases and injuries for 195 countries and territories, 1990–2017: A systematic analysis for the Global Burden of Disease Study 2017. Lancet 2018, 392, 1789–1858. [Google Scholar] [CrossRef]
  36. Kan, C.; Pedersen, N.L.; Christensen, K.; Bornstein, S.R.; Licinio, J.; MacCabe, J.H.; Ismail, K.; Rijsdijk, F. Genetic overlap between type 2 diabetes and depression in Swedish and Danish twin registries. Mol. Psychiatr. 2016, 21, 903–909. [Google Scholar] [CrossRef]
  37. Saeedi, P.; Petersohn, I.; Salpea, P.; Malanda, B.; Karuranga, S.; Unwin, N.; Colagiuri, S.; Guariguata, L.; Motala, A.A.; Ogurtsova, K.; et al. Global and regional diabetes prevalence estimates for 2019 and projections for 2030 and 2045: Results from the International Diabetes Federation Diabetes Atlas, 9(th) edition. Diabetes Res. Clin. Pr. 2019, 157. [Google Scholar] [CrossRef]
  38. Bjornstad, P.; Hughan, K.; Kelsey, M.M.; Shah, A.S.; Lynch, J.; Nehus, E.; Mitsnefes, M.; Jenkins, T.; Xu, P.; Xie, C.; et al. Effect of surgical versus medical therapy on diabetic kidney disease over 5 years in severely obese adolescents with type 2 diabetes. Diabetes Care 2020, 43, 187–195. [Google Scholar] [CrossRef]
  39. Chen, X.; Guo, H.; Qiu, L.; Zhang, C.; Deng, Q.; Leng, Q. Immunomodulatory and antiviral activity of metformin and its potential implications in treating coronavirus disease 2019 and lung injury. Front. Immunol. 2020, 11, 2056. [Google Scholar] [CrossRef]
  40. Begg, D.P.; May, A.A.; Mul, J.D.; Liu, M.; D’Alessio, D.A.; Seeley, R.J.; Woods, S.C. Insulin detemir is transported from blood to cerebrospinal fluid and has prolonged central anorectic action relative to NPH insulin. Diabetes 2015, 64, 2457–2466. [Google Scholar] [CrossRef] [Green Version]
  41. Li, S.; Wang, J.; Zhang, B.; Li, X.; Liu, Y. Diabetes mellitus and cause-specific mortality: A population-based study. Diabetes Metab. J. 2019, 43, 319–341. [Google Scholar] [CrossRef] [PubMed]
  42. Li, S.; Wang, R.; Hu, X.; Li, C.; Wang, L. Bio-affinity ultra-filtration combined with HPLC-ESI-qTOF-MS/MS for screening potential α-glucosidase inhibitors from Cerasus humilis (Bge.) Sok. leaf-tea and in silico analysis. Food Chem. 2021, 373, 131528. [Google Scholar] [CrossRef] [PubMed]
Figure 1. Extraction procedures of free, conjugated, and bound phenolic fractions.
Antioxidants 11 01831 g001
Figure 2. Free, conjugated, and bound phenolic contents (A); total phenolic contents (B); the free, conjugated, and bound flavonoid contents (C); total flavonoid contents (D) in the peel and pulp of different wampee samples from South China. Different letters (a–d) indicate significant differences among free, conjugated, and bound phenolic fractions of wampee peel/pulp samples. Pe, wampee peel; Pu, wampee pulp; FP, free phenolic; CP, conjugated phenolic; BP, bound phenolic; FF, free flavonoid; CF, conjugated flavonoid; BF, bound flavonoid.
Antioxidants 11 01831 g002
Figure 3. ABTS·+ levels (A), DPPH values (B), ·OH levels(C), FRAP values (D), and IC50 values of α-glucosidase inhibitory activities (E) of free, conjugated, and bound phenolic fractions in the peel and pulp of different wampee samples from South China. Different letters (a–d) indicate significant differences among free, conjugated, and bound phenolic fractions of wampee peel/pulp samples. Pe, wampee peel; Pu, wampee pulp; FPF, free phenolic fraction; CPF, conjugated phenolic fraction; BPF, bound phenolic fraction.
Antioxidants 11 01831 g003
Figure 4. Correlation heatmap (A), PCA score plot (B), PC loading plot (C), and dendrogram (D) of the data matrix of the contents of individual phenolic, TPC, TFC, and bio-activities from free, conjugated, and bound phenolic fractions in the peel and pulp of different wampee samples from South China. TPC, total phenolic content; TFC, total flavonoid content; GA, gallic acid; CC, chlorogenic acid; DL-CAE, DL-catechin; GEA, gentisic acid; CA, caffeic acid; RUT, rutin; IQUE, isoquercitrin; QUER, quercitrin; POP, populnin; o-CC, o-coumaric acid; MYR, myricetin; QUE; quercetin; KAE, kaempferol; GIA, α-glucosidase inhibition; FPe/FPu, free phenolic fraction of wampee peel/pulp; CPe/CPu, conjugated phenolic fraction of wampee peel/pulp; BPe/BPu, bound phenolic fraction of wampee peel/pulp.
Antioxidants 11 01831 g004
Table 1. Species information of the four wampee samples from South China (n = 6).
Abbre.Collect
Location
TypeColorLength (mm)Width (mm)Single
Weight (g)
Photo
W1Yunfu,
Guangdong
Seedless wampeeBright yellow31.12 ± 2.78 ac25.24 ± 2.26 a10.62 ± 2.72 aAntioxidants 11 01831 i001
W2Danzhou,
Hainan
Wild
wampee
Dark
yellow
23.61 ± 2.71 c23.22 ± 1.93 ab7.15 ± 1.29 bAntioxidants 11 01831 i002
W3Haikou, HainanJixin
wampee
Light dark
yellow
31.14 ± 2.69 a21.83 ± 1.81 b7.63 ± 1.67 bAntioxidants 11 01831 i003
W4Qingzhou, GuangxiHeipi
wampee
Brown27.48 ± 2.94 b23.18 ± 2.19 ab8.38 ± 2.53 abAntioxidants 11 01831 i004
Different letters (a–c) indicate significant differences among different wampee varieties (p < 0.05).
Table 2. Identification of the main phenolic compounds in peel and pulp of the four wampee samples from South China by UHPLC-Q Exactive HF-X.
Peak No.Retention Time (Min)Compound NameFormulaMwMolecular Ion (m/z)MS/MS (m/z)ErrorReference
11.38o-Coumaric acidC9H8O3164165.0549 [M+H]+165.0549, 123.0444, 1.89Standard, MS/MS
21.63Gallic acidC7H6O5170169.0136 [M-H]169.0136, 125.0234−3.73Standard, MS/MS
31.95Gentisic acidC7H6O4154153.0185 [M-H]153.0185, 109.0283−5.14Standard, MS/MS
42.00EpigallocatechinC15H14O7306305.0669 [M-H]305.0669, 137.0229, 125.02340.91 MS/MS
52.18Chlorogenic acidC16H18O9354353.0883 [M-H]353.0883, 191.05431.42Standard, MS/MS
62.37(+/−)-TaxifolinC15H12O7304303.0514 [M-H]303.0514, 285.0435, 125.02331.29MS/MS
72.47m-Salicylic acidC7H6O3138139.0392 [M+H]+139.0392, 121.0284, 95.04931.73MS/MS
82.56DL-CatechinC15H14O6290289.0721 [M-H]289.0721, 245.0809, 205.0492, 109.02861.32Standard, MS/MS
92.96IsoquercitrinC21H20O12464465.1037 [M+H]+465.1037, 303.0498, 285.04141.97Standard, MS/MS
103.03Caffeic acidC9H8O4180179.0344 [M-H]-179.0344, 135.0441−2.91Standard, MS/MS
113.29(+)-EpicatechinC15H14O6290335.0777 [M+FA-H]-335.0777, 179.0342, 135.04411.55MS/MS
123.64MyricetinC15H10O8318319.0453 [M+H]+319.0453, 245.0468, 217.0505, 153.01871.88Standard, MS/MS
133.98QuercetinC15H10O7302303.0504 [M+H]+303.0504, 229.0503, 153.0817, 137.02321.76Standard, MS/MS
143.97RutinC27H30O16610611.1617 [M+H]+611.1617, 303.05011.81Standard, MS/MS
154.41FisetinC15H10O6286287.0555 [M+H]+287.0555, 213.0554, 137.0242, 121.02891.59MS/MS
164.52PopulninC21H20O11448449.1086 [M+H]+449.1086, 431.0988, 287.05291.77Standard, MS/MS
174.53QuercitrinC21H20O11448447.0938 [M-H]+447.0938, 300.0272, 271.0249, 255.02981.60Standard, MS/MS
185.27KaempferolC15H10O6286287.0555 [M+H]+287.0555, 153.0185, 121.02811.56Standard, MS/MS
195.64(+/−)-NaringeninC15H12O5272271.0615 [M-H]271.0615, 151.0030, 119.04921.06MS/MS
Table 3. Phenolic composition in free, conjugated, and bound fractions of peel and pulp of the four wampee samples from South China (n = 3).
Phenolic CompoundsStatusContents (µg/g DW)
Pe1Pe2Pe3Pe4Pu1Pu2Pu3Pu4
Gallic acid
(GA)
FP56.09 ± 1.01 b87.63 ± 0.83 a57.81 ± 4.23 b56.20 ± 1.40 b25.46 ± 0.05 c24.05 ± 0.19 cd22.23 ± 0.05 d26.20 ± 0.15 c
CP45.44 ± 1.65 b44.48 ± 0.02 b51.09 ± 0.77 a41.23 ± 0.70 c16.70 ± 0.32 e18.02 ± 0.03 e20.31 ± 0.04 d25.11 ± 0.43 c
BP102.93 ± 1.86 b68.96 ± 1.97 d215.43 ± 1.80 a97.68 ± 2.97 cNDNDNDND
TP204.47 ± 0.80 b201.08 ± 1.12 b324.32 ± 5.27 a195.10 ± 3.68 c42.16 ± 0.27 e42.07 ± 0.22 e42.53 ± 0.08 e51.31 ± 0.28 d
Chlorogenic acid
(CC)
FP316.72 ± 1.14 a270.71 ± 2.49 b236.04 ± 11.41 d255.95 ± 2.83 c59.15 ± 4.47 e64.27 ± 4.64 e58.17 ± 0.83 e66.28 ± 1.00 e
CP234.14 ± 10.93 a110.65 ± 5.98 d194.52 ± 7.14 b165.00 ± 8.19 c56.84 ± 0.61 f55.30 ± 0.76 f53.15 ± 0.20 f86.97 ± 1.68 e
BP626.39 ± 18.87 c832.93 ± 36.47 b2611.36 ± 27.81 a412.30 ± 9.71 d107.20 ± 0.81 f126.31 ± 0.67 ef112.65 ± 0.17 ef144.65 ± 5.08 e
TP1177.25 ± 30.94 b1214.29 ± 32.98 b3041.91 ± 46.35 a833.25 ± 1.31 c223.19 ± 4.27 e245.88 ± 3.21 e223.97 ± 0.46 e297.90 ± 5.76 d
Gentisic acid (GEA)FP251.29 ± 14.39 d280.42 ± 1.00 c445.50 ± 5.30 a357.52 ± 19.08 b141.54 ± 0.85 g192.69 ± 10.07 e119.14 ± 0.35 h177.92 ± 0.69 f
CP1287.14 ± 56.18 c1412.22 ± 5.30 b1905.12 ± 228.96 a1798.06 ± 160.06 a556.71 ± 25.60 d285.97 ± 2.48 g394.77 ± 20.01 f433.76 ± 1.12 e
BP713.60 ± 21.20 d1068.70 ± 47.70 b1423.05 ± 19.96 a921.54 ± 3.03 c385.18 ± 0.08 eND317.51 ± 0.42 f252.42 ± 1.06 g
TP2252.03 ± 20.59 d2761.34 ± 52.00 c3773.67 ± 214.31 a3077.13 ± 176.11 b1083.42 ± 24.84 e478.66 ± 12.55 h831.41 ± 19.94 g864.10 ± 0.75 f
Caffeic acid
(CA)
FP1.71 ± 0.01 b3.77 ± 0.49 a0.21 ± 0.08 c3.81 ± 0.11 aNDNDNDND
CPNDND8.93 ± 0.31 aNDNDNDNDND
BPNDND5.43 ± 0.45 aNDNDNDNDND
TP1.71 ± 0.01 c3.77 ± 0.49 b14.57 ± 0.68 a3.81 ± 0.11 bNDNDNDND
Rutin
(RUT)
FP276.61 ± 8.05 c813.88 ± 33.73 a227.27 ± 0.77 d395.19 ± 11.93 b30.35 ± 0.78 f8.37 ± 0.04 h22.74 ± 0.03 g36.41 ± 0.06 e
CP895.04 ± 6.70 b988.24 ± 4.92 a1048.47 ± 2.12 c1173.74 ± 96.77 d141.62 ± 8.94 h255.67 ± 2.30 g279.93 ± 15.23 f154.02 ± 0.34 e
BP609.19 ± 4.10 c659.99 ± 8.22 b1197.04 ± 39.47 a536.07 ± 0.43 d97.78 ± 2.79 f128.96 ± 1.05 e147.69 ± 4.05 e95.85 ± 0.44 f
TP1780.84 ± 10.65 c2462.11 ± 46.87 a2472.77 ± 40.82 a2015.00 ± 85.27 b269.75 ± 5.36 e392.99 ± 1.21 d450.36 ± 19.26 d286.28 ± 0.17 e
Isoquercitrin
(IQUE)
FP128.43 ± 7.33 b216.31 ± 5.46 a221.65 ± 0.15 a222.77 ± 5.93 a10.90 ± 0.40 e21.06 ± 0.91 d22.43 ± 0.10 d40.41 ± 0.02 c
CP1172.76 ± 8.93 c1295.64 ± 6.52 b1395.58 ± 17.67 a1363.47 ± 49.30 a179.10 ± 11.78 e329.47 ± 3.03 d361.52 ± 20.15 d195.58 ± 0.43 e
BP192.00 ± 1.07 d264.96 ± 2.82 b286.55 ± 9.23 a212.90 ± 0.76 cNDND25.20 ± 2.13 f37.51 ± 0.02 e
TP1493.18 ± 0.52 c1776.91 ± 14.80 b1903.78 ± 8.29 a1799.13 ± 56.00 b190.00 ± 11.38 g350.53 ± 2.13 e409.16 ± 22.39 d273.50 ± 0.43 f
Quercitrin
(QUER)
FP4510.19 ± 286.30 d20775.72 ± 107.48 a 15001.01 ± 193.94 c16552.39 ± 371.56 b518.29 ± 15.12 g896.19 ± 30.23 e826.66 ± 6.05 f887.27 ± 5.59 e
CP2558.98 ± 30.23 a578.75 ± 15.12 d790.38 ± 15.11 b639.22 ± 15.30 cNDNDNDND
BP66900.24 ± 1247.09 c124417.57 ± 1776.16 a90709.88 ± 2116.28 b21936.13 ± 744.58 d3463.24 ± 121.53 g3577.77 ± 12.85 g4419.79 ± 86.46 f8331.27 ± 48.37 e
TP73969.41 ± 1503.16 c145772.05 ± 1868.52 a106501.28 ± 1937.45 b39127.74 ± 357.91 d3981.52 ± 106.42 h4473.96 ± 17.38 g5246.45 ± 80.42 f9218.55 ± 53.97 e
Populnin
(POP)
FP2.20 ± 0.09 b5.57 ± 0.91 a1.81 ± 0.09 bNDNDNDNDND
CP34.20 ± 0.25 a16.06 ± 0.61 c16.96 ± 0.09 bc17.86 ± 1.00 b3.62 ± 0.24 dND1.74 ± 0.18 f2.93 ± 0.09 e
BPNDNDNDNDNDNDNDND
TP36.40 ± 0.16 a21.63 ± 0.30 b18.77 ± 0.01 c17.86 ± 1.00 c3.62 ± 0.24 dND1.74 ± 0.18 f2.93 ± 0.09 e
o-Coumaric acid
(o-CC)
FP8570.31 ± 276.71 d21464.95 ± 102.74 a15214.21 ± 194.52 b14089.54 ± 267.13 cND6493.58 ± 268.50 e5533.30 ± 6.85 f5999.06 ± 6.85 ef
CP8041.54 ± 210.96 c12621.03 ± 116.44 a12515.55 ± 63.01 a10345.67 ± 142.47 b5875.77 ± 327.40 dND5845.63 ± 321.92 d7716.88 ± 28.77 c
BPNDNDNDNDNDNDNDND
TP16611.86 ± 487.68 d34085.98 ± 13.70 a27729.76 ± 257.53 b24435.21 ± 409.59 c5875.77 ± 327.40 g6493.58 ± 268.50 g11378.93 ± 315.07 f13715.94 ± 35.62 e
Myricetin
(MYR)
FP12524.73 ± 137.64 c2323.11 ± 204.17 f17451.74 ± 16.67 a16729.17 ± 463.96 b619.87 ± 24.67 h4092.03 ± 34.20 e681.29 ± 2.72 g6524.66 ± 13.78 d
CPNDNDNDNDNDNDNDND
BP2185.55 ± 66.35 bND2499.72 ± 24.31 aNDNDNDNDND
TP14710.28 ± 71.29 c2323.11 ± 204.17 f19951.46 ± 7.63 a16729.17 ± 463.96 b619.87 ± 24.67 h4092.03 ± 34.20 e681.29 ± 2.72 g6524.66 ± 13.78 d
Quercetin
(QUE)
FP12.93 ± 0.10 a7.85 ± 0.69 c10.94 ± 0.22 b3.89 ± 0.07 dNDNDNDND
CP3.31 ± 0.05 c2.15 ± 0.04 c18.73 ± 1.95 a8.89 ± 0.73 bNDNDNDND
BP16.36 ± 0.52 b6.58 ± 0.12 d35.03 ± 0.88 a10.86 ± 0.01 cNDNDNDND
TP32.60 ± 0.37 b16.58 ± 0.61 d64.70 ± 2.61 a23.64 ± 0.81 cNDNDNDND
Kaempferol
(KAE)
FP5.59 ± 0.17 c34.93 ± 0.71 a2.04 ± 0.15 d26.17 ± 0.51 bNDNDNDND
CPND2.85 ± 0.18NDNDNDNDNDND
BPNDND4.26 ± 0.09NDNDNDNDND
TP5.59 ± 0.17 c37.78 ± 0.89 a6.30 ± 0.05 c26.17 ± 0.51 bNDNDNDND
Pe1, Pe2, Pe3, and Pe4 are the peel of W1, W2, W3, and W4, respectively; Pu1, Pu2, Pu3, and Pu4 are the pulp of W1, W2, W3, and W4, respectively. FP, CP, BP, and TP are free phenolic, conjugated phenolic, bound phenolic, and total phenolic, respectively. ND means not detected. Different letters (a–h) indicate there are statistically significant differences among different samples at the same status (p < 0.05).
Publisher’s Note: MDPI stays neutral with regard to jurisdictional claims in published maps and institutional affiliations.

