
In Patients with Chronic Kidney Disease Advanced Glycation End-Products Receptors Isoforms (sRAGE and esRAGE) Are Associated with Malnutrition

 , ,
, ,  ,
,
Abstract
:1. Introduction
2. Materials and Methods
2.1. Patients and Study Design
2.2. sRAGE, esRAGE and cRAGE Quantification
2.3. AGE Quantification
2.4. Interleukins Quantification
2.5. Nutritional Status
2.6. Statistical Analysis
3. Results
3.1. Population Characteristics
3.2. General Cohort Characteristics, Inflammation, and Nutritional Status
3.3. AGEs and RAGEs Isoforms and Nutritional Status
3.4. AGEs and RAGEs Isoforms Association with Inflammatory Markers
3.5. AGEs and RAGEs Isoforms Association with Malnutrition Development
4. Discussion
5. Conclusions
Supplementary Materials
Author Contributions
Funding
Institutional Review Board Statement
Informed Consent Statement
Data Availability Statement
Acknowledgments
Conflicts of Interest
References
- Stenvinkel, P.; Heimbürger, O.; Lindholm, B.; Kaysen, G.A.; Bergström, J. Are there two types of malnutrition in chronic renal failure? Evidence for relationships between malnutrition, inflammation and atherosclerosis (MIA syndrome). Nephrol. Dial. Transplant. 2000, 15, 953–960. [Google Scholar] [CrossRef] [PubMed] [Green Version]
- Yabuuchi, J.; Ueda, S.; Yamagishi, S.I.; Nohara, N.; Nagasawa, H.; Wakabayashi, K.; Matsui, T.; Yuichiro, H.; Kadoguchi, T.; Otsuka, T.; et al. Association of advanced glycation end products with sarcopenia and frailty in chronic kidney disease. Sci. Rep. 2020, 10, 17647. [Google Scholar] [CrossRef] [PubMed]
- Caldiroli, L.; Vettoretti, S.; Armelloni, S.; Mattinzoli, D.; Ikehata, M.; Molinari, P.; Alfieri, C.; Messa, P.; Castellano, G. Possible Benefits of a Low Protein Diet in Older Patients with CKD at Risk of Malnutrition: A Pilot Randomized Controlled Trial. Front. Nutr. 2022, 8, 782499. [Google Scholar] [CrossRef] [PubMed]
- Obi, Y.; Qader, H.; Kovesdy, C.P.; Kalantar-Zadeh, K. Latest consensus and update on protein-energy wasting in chronic kidney disease. Curr. Opin. Clin. Nutr. Metab. Care 2015, 18, 254–262. [Google Scholar] [CrossRef]
- Kalantar-Zadeh, K.; Kilpatrick, R.D.; Kuwae, N.; McAllister, C.J.; Alcorn, H., Jr.; Kopple, J.D.; Greenland, S. Revisiting mortality predictability of serum albumin in the dialysis population: Time dependency, longitudinal changes and population-attributable fraction. Nephrol. Dial. Transplant. 2005, 20, 1880–1888. [Google Scholar] [CrossRef] [Green Version]
- Fishman, S.L.; Sonmez, H.; Basman, C.; Singh, V.; Poretsky, L. The role of advanced glycation end-products in the development of coronary artery disease in patients with and without diabetes mellitus: A review. Mol. Med. 2018, 24, 59. [Google Scholar] [CrossRef]
- Bohlender, J.M.; Franke, S.; Stein, G.; Wolf, G. Advanced glycation end products and the kidney. Am. J. Physiol. Renal. Physiol. 2005, 289, F645–F659. [Google Scholar] [CrossRef]
- Molinari, P.; Caldiroli, L.; Dozio, E.; Rigolini, R.; Giubbilini, P.; Romanelli, M.M.C.; Messa, P.; Vettoretti, S. AGEs and sRAGE Variations at Different Timepoints in Patients with Chronic Kidney Disease. Antioxidants 2021, 10, 1994. [Google Scholar] [CrossRef]
- Miyata, T.; van Ypersele de Strihou, C.; Imasawa, T.; Yoshino, A.; Ueda, Y.; Ogura, H.; Kominami, K.; Onogi, H.; Inagi, R.; Nangaku, M.; et al. Glyoxalase I deficiency is associated with an unusual level of advanced glycation end products in a hemodialysis patient. Kidney Int. 2001, 60, 2351–2359. [Google Scholar] [CrossRef] [Green Version]
- Miyata, T.; Ueda, Y.; Horie, K.; Nangaku, M.; Tanaka, S.; Strihou, C.V.Y.D.; Kurokawa, K. Renal catabolism of advanced glycation end products: The fate of pentosidine. Kidney Int. 1998, 53, 416–422. [Google Scholar] [CrossRef] [Green Version]
- Kislinger, T.; Fu, C.; Huber, B.; Qu, W.; Taguchi, A.; Du Yan, S.; Hofmann, M.; Yan, S.F.; Pischetsrieder, M.; Stern, D.; et al. N(epsilon)-(carboxymethyl)lysine adducts of proteins are ligands for receptor for advanced glycation end products that activate cell signaling pathways and modulate gene expression. J. Biol. Chem. 1999, 274, 31740–31749. [Google Scholar] [CrossRef] [PubMed] [Green Version]
- Basta, G. Receptor for advanced glycation endproducts and atherosclerosis: From basic mechanisms to clinical implications. Atherosclerosis 2008, 196, 9–21. [Google Scholar] [CrossRef] [PubMed]
- Miyata, T.; Inagi, R.; Iida, Y.; Sato, M.; Yamada, N.; Oda, O.; Maeda, K.; Seo, H. Involvement of beta 2-microglobulin modified with advanced glycation end products in the pathogenesis of hemodialysis-associated amyloidosis. Induction of human monocyte chemotaxis and macrophage secretion of tumor necrosis factor-alpha and interleukin-1. J. Clin. Investig. 1994, 93, 521–528. [Google Scholar] [CrossRef] [PubMed]
- Suliman, M.E.; Heimbürger, O.; Barany, P.; Anderstam, B.; Pecoits-Filho, R.; Ayala, E.R.; Qureshi, A.R.T.; Fehrman-Ekholm, I.; Lindholm, B.; Stenvinkel, P. Plasma Pentosidine Is Associated with Inflammation and Malnutrition in End-Stage Renal Disease Patients Starting on Dialysis Therapy. J. Am. Soc. Nephrol. 2003, 14, 1614–1622. [Google Scholar] [CrossRef] [PubMed] [Green Version]
- Stinghen, A.E.M.; Massy, Z.A.; Vlassara, H.; Striker, G.E.; Boullier, A. Uremic Toxicity of Advanced Glycation End Products in CKD. J. Am. Soc. Nephrol. 2016, 27, 354–370. [Google Scholar] [CrossRef] [PubMed] [Green Version]
- Semba, R.D.; Arab, L.; Sun, K.; Nicklett, E.J.; Ferrucci, L. Fat mass is inversely associated with serum carboxymethyl-lysine, an advanced glycation end product, in adults. J. Nutr. 2011, 141, 1726–1730. [Google Scholar] [CrossRef]
- Dozio, E.; Vettoretti, S.; Caldiroli, L.; Nerini-Molteni, S.; Tacchini, L.; Ambrogi, F.; Messa, P.; Corsi Romanelli, M.M. Advanced Glycation End Products (AGE) and Soluble Forms of AGE Receptor: Emerging Role as Mortality Risk Factors in CKD. Biomedicines 2020, 8, 638. [Google Scholar] [CrossRef]
- Yanagisawa, K.; Makita, Z.; Shiroshita, K.; Ueda, T.; Fusegawa, T.; Kuwajima, S.; Takeuchi, M.; Koike, T. Specific fluorescence assay for advanced glycation end products in blood and urine of diabetic patients. Metabolism 1998, 47, 1348–1353. [Google Scholar] [CrossRef]
- Guerin-Dubourg, A.; Cournot, M.; Planesse, C.; Debussche, X.; Meilhac, O.; Rondeau, P.; Bourdon, E. Association between Fluorescent Advanced Glycation End-Products and Vascular Complications in Type 2 Diabetic Patients. Biomed. Res. Int. 2017, 2017, 7989180. [Google Scholar] [CrossRef]
- Kalantar-Zadeh, K.; Kopple, J.D.; Block, G.; Humphreys, M.H. A Malnutrition-Inflammation Score is correlated with morbidity and mortality in maintenance hemodialysis patients. Am. J. Kidney Dis. 2001, 38, 1251–1263. [Google Scholar] [CrossRef] [Green Version]
- Afşar, B.; Sezer, S.; Ozdemir, F.N.; Celik, H.; Elsurer, R.; Haberal, M. Malnutrition–Inflammation Score is a Useful Tool in Peritoneal Dialysis Patients. Perit. Dial. Int. J. Int. Soc. Perit. Dial. 2006, 26, 705–711. [Google Scholar] [CrossRef]
- Maroni, B.J.; Steinman, T.I.; Mitch, W.E. A method for estimating nitrogen intake of patients with chronic renal failure. Kidney Int. 1985, 27, 58–65. [Google Scholar] [CrossRef] [PubMed] [Green Version]
- Suliman, M.E.; Stenvinkel, P.; Bárány, P.; Heimbürger, O.; Anderstam, B.; Lindholm, B. Hyperhomocysteinemia and its relationship to cardiovascular disease in ESRD: Influence of hypoalbuminemia, malnutrition, inflammation, and diabetes mellitus. Am. J. Kidney Dis. 2003, 41, S89–S95. [Google Scholar] [CrossRef] [PubMed]
- Ikizler, T.A.; Cano, N.J.; Franch, H.; Fouque, D.; Himmelfarb, J.; Kalantar-Zadeh, K.; Kuhlmann, M.K.; Stenvinkel, P.; TerWee, P.; Teta, D.; et al. Prevention and treatment of protein energy wasting in chronic kidney disease patients: A consensus statement by the International Society of Renal Nutrition and Metabolism. Kidney Int. 2013, 84, 1096–1107. [Google Scholar] [CrossRef] [PubMed] [Green Version]
- Kalantar-Zadeh, K.; Kopple, J.D.; Block, G.; Humphreys, M.H. Association among SF36 quality of life measures and nutrition, hospitalization, and mortality in hemodialysis. J. Am. Soc. Nephrol. 2001, 12, 2797–2806. [Google Scholar] [CrossRef] [PubMed]
- Kopple, J.D.; Kalantar-Zadeh, K.; Mehrotra, R. Risks of chronic metabolic acidosis in patients with chronic kidney disease. Kidney Int. 2005, 67, S21–S27. [Google Scholar] [CrossRef] [PubMed] [Green Version]
- Nediani, C.; Dinu, M. Oxidative Stress and Inflammation as Targets for Novel Preventive and Therapeutic Approaches in Non-Communicable Diseases II. Antioxidants 2022, 11, 824. [Google Scholar] [CrossRef]
- A Flores, E.; Bistrian, B.R.; Pomposelli, J.J.; A Dinarello, C.; Blackburn, G.L.; Istfan, N. Infusion of tumor necrosis factor/cachectin promotes muscle catabolism in the rat. A synergistic effect with interleukin 1. J. Clin. Investig. 1989, 83, 1614–1622. [Google Scholar] [CrossRef]
- Kalantar-Zadeh, K.; Ikizler, T.; Block, G.; Avram, M.M.; Kopple, J.D. Malnutrition-inflammation complex syndrome in dialysis patients: Causes and consequences. Am. J. Kidney Dis. 2003, 42, 864–881. [Google Scholar] [CrossRef] [Green Version]
- Gabay, C.; Kushner, I. Acute-Phase Proteins and Other Systemic Responses to Inflammation. N. Engl. J. Med. 1999, 340, 448–454. [Google Scholar] [CrossRef]
- Wang, W.L.; Liang, S.; Zhu, F.L.; Liu, J.Q.; Chen, X.M.; Cai, G.Y. Association of the malnutrition-inflammation score with anthropometry and body composition measurements in patients with chronic kidney disease. Ann. Palliat. Med. 2019, 8, 596–603. [Google Scholar] [CrossRef] [PubMed]
- Cohen-Hagai, K.; Nacasch, N.; Sternschuss, A.; Ohana, M.; Wolach, B.; Benchetrit, S.; Gavrieli, R.; Zitman-Gal, T. Malnutrition and inflammation in hemodialysis patients: Comparative evaluation of neutrophil reactive oxygen formation. Nutrition 2020, 78, 110793. [Google Scholar] [CrossRef] [PubMed]
- Wautier, J.L.; Wautier, M.P.; Schmidt, A.M.; Anderson, G.M.; Hori, O.; Zoukourian, C.; Capron, L.; Chappey, O.; Yan, S.D.; Brett, J.; et al. Advanced glycation end products (AGEs) on the surface of diabetic erythrocytes bind to the vessel wall via a specific receptor inducing oxidant stress in the vasculature: A link between surface-associated AGEs and diabetic complications. Proc. Natl. Acad. Sci. USA 1994, 91, 7742–7746. [Google Scholar] [CrossRef] [PubMed] [Green Version]
- Wautier, M.-P.; Chappey, O.; Corda, S.; Stern, D.M.; Schmidt, A.M.; Wautier, J.-L. Activation of NADPH oxidase by AGE links oxidant stress to altered gene expression via RAGE. Am. J. Physiol. Endocrinol. Metab. 2001, 280, E685–E694. [Google Scholar] [CrossRef]
- Ramasamy, R.; Vannucci, S.J.; Du Yan, S.S.; Herold, K.; Yan, S.F.; Schmidt, A.M. Advanced glycation end products and RAGE: A common thread in aging, diabetes, neurodegeneration, and inflammation. Glycobiology 2005, 15, 16R–28R. [Google Scholar] [CrossRef]
- Payne, G.W. Effect of Inflammation on the Aging Microcirculation: Impact on Skeletal Muscle Blood Flow Control. Microcirculation 2006, 13, 343–352. [Google Scholar] [CrossRef]
- Sebeková, K.; Podracká, L.; Blazícek, P.; Syrová, D.; Heidland, A.; Schinzel, R. Plasma levels of advanced glycation end products in children with renal disease. Pediatric Nephrol. 2001, 16, 1105–1112. [Google Scholar] [CrossRef]
- Kim, T.N.; Park, M.S.; Lim, K.I.; Choi, H.Y.; Yang, S.J.; Yoo, H.J.; Kang, H.J.; Song, W.; Choi, H.; Baik, S.H.; et al. Relationships between sarcopenic obesity and insulin resistance, inflammation, and vitamin D status: The Korean Sarcopenic Obesity Study. Clin. Endocrinol. 2012, 78, 525–532. [Google Scholar] [CrossRef]
- Kislinger, T.; Tanji, N.; Wendt, T.; Qu, W.; Lu, Y.; Ferran, L.J., Jr.; Taguchi, A.; Olson, K.; Bucciarelli, L.; Goova, M.; et al. Receptor for Advanced Glycation End Products Mediates Inflammation and Enhanced Expression of Tissue Factor in Vasculature of Diabetic Apolipoprotein E–Null Mice. Arterioscler. Thromb. Vasc. Biol. 2001, 21, 905–910. [Google Scholar] [CrossRef] [Green Version]
- Basta, G.; Lazzerini, G.; Massaro, M.; Simoncini, T.; Tanganelli, P.; Fu, C.; Kislinger, T.; Stern, D.M.; Schmidt, A.M.; De Caterina, R. Advanced glycation end products activate endothelium through signal-transduction receptor RAGE: A mechanism for amplification of inflammatory responses. Circulation 2002, 105, 816–822. [Google Scholar] [CrossRef] [Green Version]
- Chavakis, T.; Bierhaus, A.; Al-Fakhri, N.; Schneider, D.; Witte, S.; Linn, T.; Nagashima, M.; Morser, J.; Arnold, B.; Preissner, K.T.; et al. The pattern recognition receptor (RAGE) is a counterreceptor for leukocyte integrins: A novel pathway for inflammatory cell recruitment. J. Exp. Med. 2003, 198, 1507–1515. [Google Scholar] [CrossRef] [PubMed]
- Li, L.-M.; Hou, D.-X.; Guo, Y.-L.; Yang, J.-W.; Liu, Y.; Zhang, C.-Y.; Zen, K. Role of MicroRNA-214–Targeting Phosphatase and Tensin Homolog in Advanced Glycation End Product-Induced Apoptosis Delay in Monocytes. J. Immunol. 2011, 186, 2552–2560. [Google Scholar] [CrossRef] [PubMed]
- Aparicio-Trejo, O.E.; Aranda-Rivera, A.K.; Osorio-Alonso, H.; Martínez-Klimova, E.; Sánchez-Lozada, L.G.; Pedraza-Chaverri, J.; Tapia, E. Extracellular Vesicles in Redox Signaling and Metabolic Regulation in Chronic Kidney Disease. Antioxidants 2022, 11, 356. [Google Scholar] [CrossRef] [PubMed]
- Pieniazek, A.; Brzeszczynska, J.; Kruszynska, I.; Gwozdzinski, K. Investigation of albumin properties in patients with chronic renal failure. Free Radic. Res. 2009, 43, 1008–1018. [Google Scholar] [CrossRef] [PubMed]
- Pieniazek, A.; Bernasinska-Slomczewska, J.; Gwozdzinski, L. Uremic Toxins and Their Relation with Oxidative Stress Induced in Patients with CKD. Int. J. Mol. Sci. 2021, 22, 6196. [Google Scholar] [CrossRef]
- Luketin, M.; Mizdrak, M.; Boric-Skaro, D.; Martinovic, D.; Tokic, D.; Vilovic, M.; Supe-Domic, D.; Kurir, T.T.; Bozic, J. Plasma Catestatin Levels and Advanced Glycation End Products in Patients on Hemodialysis. Biomolecules 2021, 11, 456. [Google Scholar] [CrossRef]
- Fukasawa, H.; Ishigaki, S.; Kinoshita-Katahashi, N.; Yasuda, H.; Kumagai, H.; Furuya, R. Plasma levels of the pro-inflammatory protein S100A12 (EN-RAGE) are associated with muscle and fat mass in hemodialysis patients: A cross-sectional study. Nutr. J. 2014, 13, 48. [Google Scholar] [CrossRef] [Green Version]
- Hörner, D.V.; Willingham, F.C.; Selby, N.M.; Taal, M.W. Impact of Dietetic Intervention on Skin Autofluorescence and Nutritional Status in Persons Receiving Dialysis: A Proof of Principle Study. J. Ren. Nutr. 2020, 30, 540–547. [Google Scholar] [CrossRef]
- Hörner, D.V.; Selby, N.; Taal, M. Factors Associated with Change in Skin Autofluorescence, a Measure of Advanced Glycation End Products, in Persons Receiving Dialysis. Kidney Int. Rep. 2020, 5, 654–662. [Google Scholar] [CrossRef] [Green Version]
- Hörner, D.V.; Selby, N.M.; Taal, M.W. Skin autofluorescence and malnutrition as predictors of mortality in persons receiving dialysis: A prospective cohort study. J. Hum. Nutr. Diet. 2020, 33, 852–861. [Google Scholar] [CrossRef]
- Shen, C.-Y.; Lu, C.-H.; Wu, C.-H.; Li, K.-J.; Kuo, Y.-M.; Hsieh, S.-C.; Yu, C.-L. The Development of Maillard Reaction, and Advanced Glycation End Product (AGE)-Receptor for AGE (RAGE) Signaling Inhibitors as Novel Therapeutic Strategies for Patients with AGE-Related Diseases. Molecules 2020, 25, 5591. [Google Scholar] [CrossRef] [PubMed]
- Prasad, K.; Tiwari, S. Therapeutic Interventions for Advanced Glycation-End Products and its Receptor-Mediated Cardiovascular Disease. Curr. Pharm. Des. 2017, 23, 937–943. [Google Scholar] [CrossRef] [PubMed]
- Kim, J.; Kim, C.S.; Moon, M.K.; Kim, J.S. Epicatechin breaks preformed glycated serum albumin and reverses the retinal accumulation of advanced glycation end products. Eur. J. Pharmacol. 2015, 748, 108–114. [Google Scholar] [CrossRef] [PubMed]
- Sanchis, P.; Rivera, R.; Berga, F.; Fortuny, R.; Adrover, M.; Costa-Bauza, A.; Grases, F.; Masmiquel, L. Phytate Decreases Formation of Advanced Glycation End-Products in Patients with Type II Diabetes: Randomized Crossover Trial. Sci. Rep. 2018, 8, 9619. [Google Scholar] [CrossRef] [PubMed] [Green Version]
- Houjeghani, S.; Kheirouri, S.; Faraji, E.; Jafarabadi, M.A. l-Carnosine supplementation attenuated fasting glucose, triglycerides, advanced glycation end products, and tumor necrosis factor-α levels in patients with type 2 diabetes: A double-blind placebo-controlled randomized clinical trial. Nutr. Res. 2018, 49, 96–106. [Google Scholar] [CrossRef]
- Matsui, T.; Nakamura, N.; Ojima, A.; Nishino, Y.; Yamagishi, S.I. Sulforaphane reduces advanced glycation end products (AGEs)-induced inflammation in endothelial cells and rat aorta. Nutr. Metab. Cardiovasc. Dis. 2016, 26, 797–807. [Google Scholar] [CrossRef]
- Dhar, A.; Dhar, I.; Bhat, A.; Desai, K.M. Alagebrium attenuates methylglyoxal induced oxidative stress and AGE formation in H9C2 cardiac myocytes. Life Sci. 2016, 146, 8–14. [Google Scholar] [CrossRef]
- Yamagishi, S.-I.; Matsui, T.; Ishibashi, Y.; Isami, F.; Abe, Y.; Sakaguchi, T.; Higashimoto, Y. Phytochemicals Against Advanced Glycation End Products (AGEs) and the Receptor System. Curr. Pharm. Des. 2017, 23, 1135–1141. [Google Scholar] [CrossRef]

| Variables | Overall Cohort (n = 117) |
|---|---|
| General characteristics | |
| Age, (years) | 80 ± 11 |
| Males/Females, n (%) | 82 (70)/35 (30) |
| Diabetes, n (%) | 65 (56) |
| BMI, (kg/m2) | 28 ± 5 |
| MIS | |
| Not Malnourished, n (%) | 37 (31) |
| At risk of malnutrition; n (%) | 51 (43) |
| Malnourished, n (%) | 30 (25) |
| eGFR, (mL/min/1.73 m2) | 25 ± 11 |
| Aetiology | |
| Nephroangiosclerosis, n (%) | 44 (38) |
| Glomerulonephritis, n (%) | 11 (9) |
| ADPKD, n (%) | 2 (2) |
| Diabetic Nephropathy, n (%) | 12 (10) |
| Other, n (%) | 48 (41) |
| Metabolic characteristics | |
| Uric Acid, (mg/dL) | 6.0 ± 1.5 |
| HbA1c, (mmol/mol) | 47 ± 11 |
| Total Cholesterol, (mg/dL) | 168 ± 37 |
| HDL-Cholesterol, (mg/dL) | 51 ± 15 |
| LDL- Cholesterol, (mg/dL) | 88 ± 32 |
| Triglycerides, (mg/dL) | 130 ± 54 |
| Albumin, (g/dL) | 4.0 ± 0.4 |
| Prealbumin, (mg/dL) | 28 ± 5 |
| Proteinuria 24 h (g/24 h) | 1.2 ± 1.6 |
| Inflammatory status and oxidative stress | |
| CRP, (mg/dL) | 0.4 ± 0.7 |
| TNF alpha, (pg/mL) | 15.3 ± 8.2 |
| IL-6, (pg/mL) | 4.2 ± 3.1 |
| MCP-1, (pg/mL) | 410 ± 176 |
| Variables [n.r.] | Not Malnourished (n = 37) | Risk of Malnutrition (n = 51) | Malnourished (n = 29) | p * |
|---|---|---|---|---|
| Males, n (%) | 30 (81) | 35 (69) | 18 (62) | 0.16 |
| Diabetes, n (%) | 17 (46) | 32 (63) | 16 (55) | 0.29 |
| Age (years) | 72 ± 17 | 77 ± 8 | 82 ± 5 | 0.002 |
| BMI, (kg/m2) | 28 ± 5 | 28.1 ± 5 | 26.7 ± 4.7 | 0.22 |
| eGFR, (mL/min/1.73 m2) | 27 ± 12 | 25 ± 11 | 21 ± 10 | 0.11 |
| Body composition and metabolic characteristics | ||||
| MIS | 3 [3–4] | 4 [3–5] | 10 [8–13] | <0.000 |
| nPCR (g/kg/24 h) | 0.8 ± 0.3 | 0.8 ± 0.2 | 0.65 ± 0.2 | 0.01 |
| Urinary creatinine (mg/24 h) [1000–2300] | 1064 ± 341 | 1128 ± 1303 | 775 ± 261 | 0.23 |
| Calories (Kcal/kg) | 22 ± 9 | 22 ± 6 | 21 ± 6 | 0.8 |
| HbA1c, (mmol/mol) [20–42] | 45 ± 8 | 50 ± 13 | 45 ± 10 | 0.11 |
| Total Cholesterol, (mg/dL) [<190] | 175 ± 37 | 166 ± 40 | 163 ± 31 | 0.76 |
| HDL-Cholesterol, (mg/dL) [m > 38, f > 42] | 58 ± 23 | 49 ± 15 | 53 ± 15 | 0.22 |
| LDL-Cholesterol, (mg/dL) [<115] | 92 ± 26 | 90 ± 36 | 84 ± 23 | 0.4 |
| Triglycerides, (mg/dL) [<150] | 127 ± 54 | 131 ± 49 | 128 ± 61 | 0.8 |
| Albumin, (g/dL) [3.4–4.8] | 4.2 ± 0.3 | 4.1 ± 0.4 | 3.8 ± 0.2 | 0.002 |
| Prealbumin, (mg/dL) [23–42] | 32 ± 5 | 27 ± 5 | 27 ± 6 | <0.0001 |
| Variables [n.r.] | Not Malnourished (n = 37) | Risk of Malnutrition (n = 51) | Malnourished (n = 29) | p * |
|---|---|---|---|---|
| CRP, (mg/dL) [<0.5] | 0.2 ± 0.1 | 0.6 ± 0.7 | 0.6 ± 1 | 0.02 |
| TNFα, (pg/mL) [14.6] | 12 ± 6 | 16 ± 8 | 15 ± 9 | 0.029 |
| IL-6, (pg/mL) [1.45] | 6 ± 16 | 4 ± 3 | 4 ± 3 | 0.76 |
| MCP-1, (pg/mL) [31.2–2000] | 422 ± 158 | 437 ± 142 | 410 ± 176 | 0.49 |
| Variables | Not Malnourished (n = 37) | Risk of Malnutrition (n = 51) | Malnourished (n = 29) | p |
|---|---|---|---|---|
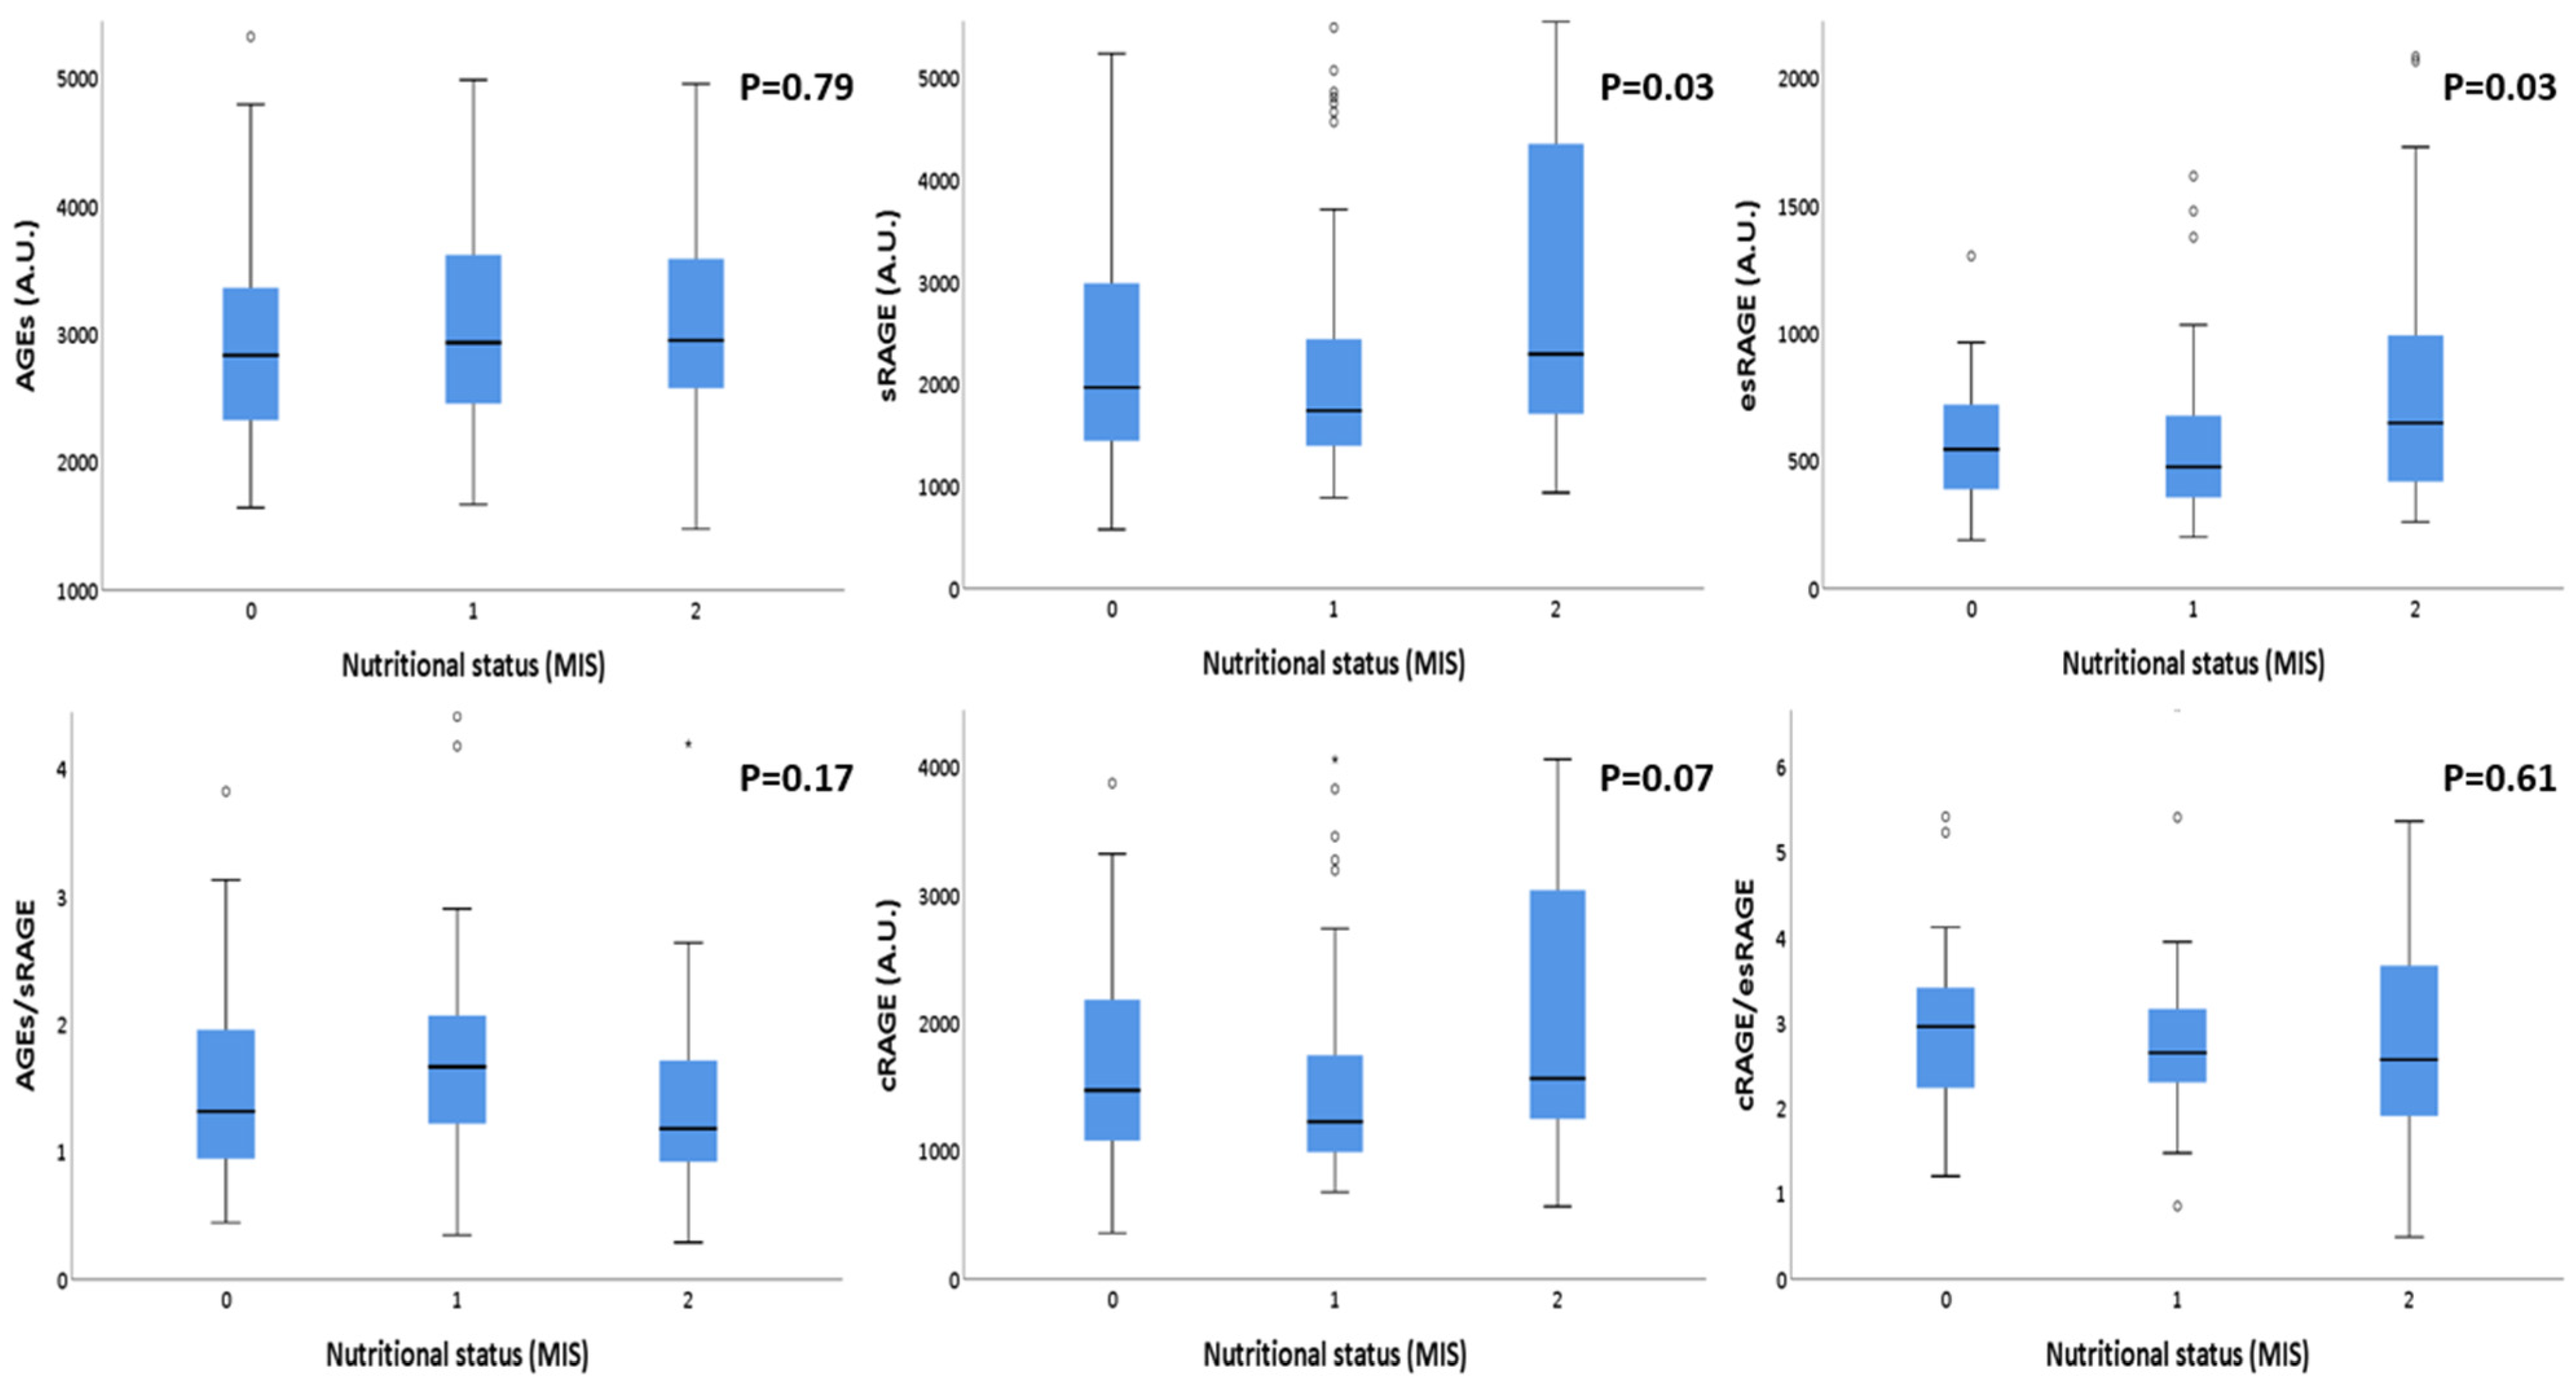
| AGEs (arbitrary unit) | 2960 ± 854 | 3031 ± 779 | 3079 ± 780 | 0.79 |
| sRAGE (pg/mL) | 2314 ± 1115 | 2158 ± 1236 | 2813 ± 1477 | 0.035 |
| esRAGE (pg/mL) | 545 [380–730] | 476 [355–680] | 648 [408–1049] | 0.033 |
| cRAGE (pg/mL) | 1704 ± 844 | 1558 ± 929 | 1996 ± 1049 | 0.07 |
| AGEs/sRAGE (arbitrary unit) | 1.6 ± 1 | 1.8 ± 0.9 | 1.5 ± 0.97 | 0.17 |
| cRAGE/esRAGE | 2.96 ± 0.9 | 2.8 ± 0.9 | 2.7 ± 1.1 | 0.61 |
| Nutritional Status | Variables | Odds Ratio | 95% Confidence Interval | p |
|---|---|---|---|---|
| Not Malnourished | AGEs (arbitrary unit) | 1.5 | (0.5–2.6) | 0.8 |
| sRAGE (arbitrary unit) | 0.41 | (0.29–0.86) | 0.035 | |
| CRP (mg/dL) | 0.08 | (0.01–0.12) | 0.001 | |
| Age (years) | 0.87 | (0.81–0.94) | 0.001 | |
| Sex (M) | 2.68 | (0.76–9.36) | 0.126 | |
| Sex (F) | 0.37 | (0.1–1.31) | ||
| At risk for Malnutrition | AGEs (arbitrary unit) | 1.3 | (0.81–1.95) | 0.926 |
| sRAGE (arbitrary unit) | 1.4 | (0.52–2.62) | 0.95 | |
| CRP (mg/dL) | 9.2 | (5.8–14.6) | 0.001 | |
| Age (years) | 1.04 | (0.99–1.09) | 0.106 | |
| Sex (M) | 0.56 | (0.48–3.73) | 0.229 | |
| Sex (F) | 1.85 | (0.26–2.1) | ||
| Malnourished | AGEs (arbitrary unit) | 0.56 | (0.46–1.53) | 0.97 |
| sRAGE (arbitrary unit) | 2.22 | (1.16–3.44) | 0.035 | |
| CRP (mg/dL) | 12.13 | (7.4–20.5) | 0.001 | |
| Age (years) | 1.41 | (1.05–1.23) | 0.001 | |
| Sex (M) | 0.37 | (0.1–1.31) | 0.126 | |
| Sex (F) | 2.7 | (0.76–9.34) | ||
| Not Malnourished | AGEs (arbitrary unit) | 1.5 | (0.5–2.6) | 0.8 |
| esRAGE (arbitrary unit) | 0.75 | (0.42–1.02) | 0.055 | |
| CRP (mg/dL) | 0.008 | (0.00–0.14) | 0.001 | |
| Age (years) | 0.87 | (0.8–0.94) | 0.001 | |
| Sex (M) | 2.5 | (0.7–8.9) | 0.160 | |
| Sex (F) | 0.4 | (0.11–1.44) | ||
| At risk for Malnutrition | AGEs (arbitrary unit) | 1.23 | (0.87–1.74) | 0.931 |
| esRAGE (arbitrary unit) | 1.32 | (0.45–3.1) | 0.95 | |
| CRP (mg/dL) | 9.5 | (5.6–15.9) | 0.002 | |
| Age (years) | 1.04 | (0.99–1.09) | 0.107 | |
| Sex (M) | 1.3 | (0.46–3.64) | 0.62 | |
| Sex (F) | 0.77 | (0.27–2.17) | ||
| Malnourished | AGEs (arbitrary unit) | 0.8 | (0.7–1.3) | 0.98 |
| esRAGE (arbitrary unit) | 1.33 | (0.98–2.38) | 0.055 | |
| CRP (mg/dL) | 11.9 | (6.8–20.6) | 0.001 | |
| Age (years) | 1.14 | (1.05–1.24) | 0.001 | |
| Sex (M) | 0.4 | (0.11–1.43) | 0.16 | |
| Sex (F) | 2.5 | (0.69–8.92) |
Publisher’s Note: MDPI stays neutral with regard to jurisdictional claims in published maps and institutional affiliations. |
© 2022 by the authors. Licensee MDPI, Basel, Switzerland. This article is an open access article distributed under the terms and conditions of the Creative Commons Attribution (CC BY) license (https://creativecommons.org/licenses/by/4.0/).
Share and Cite
Caldiroli, L.; Molinari, P.; Dozio, E.; Rigolini, R.; Giubbilini, P.; Romanelli, M.M.C.; Castellano, G.; Vettoretti, S. In Patients with Chronic Kidney Disease Advanced Glycation End-Products Receptors Isoforms (sRAGE and esRAGE) Are Associated with Malnutrition. Antioxidants 2022, 11, 1253. https://doi.org/10.3390/antiox11071253
Caldiroli L, Molinari P, Dozio E, Rigolini R, Giubbilini P, Romanelli MMC, Castellano G, Vettoretti S. In Patients with Chronic Kidney Disease Advanced Glycation End-Products Receptors Isoforms (sRAGE and esRAGE) Are Associated with Malnutrition. Antioxidants. 2022; 11(7):1253. https://doi.org/10.3390/antiox11071253
Chicago/Turabian StyleCaldiroli, Lara, Paolo Molinari, Elena Dozio, Roberta Rigolini, Paola Giubbilini, Massimiliano M. Corsi Romanelli, Giuseppe Castellano, and Simone Vettoretti. 2022. "In Patients with Chronic Kidney Disease Advanced Glycation End-Products Receptors Isoforms (sRAGE and esRAGE) Are Associated with Malnutrition" Antioxidants 11, no. 7: 1253. https://doi.org/10.3390/antiox11071253
APA StyleCaldiroli, L., Molinari, P., Dozio, E., Rigolini, R., Giubbilini, P., Romanelli, M. M. C., Castellano, G., & Vettoretti, S. (2022). In Patients with Chronic Kidney Disease Advanced Glycation End-Products Receptors Isoforms (sRAGE and esRAGE) Are Associated with Malnutrition. Antioxidants, 11(7), 1253. https://doi.org/10.3390/antiox11071253