Semi-Automatic Signature-Based Segmentation Method for Quantification of Neuromelanin in Substantia Nigra


Abstract

1. Introduction
2. Materials and Methods
2.1. Subjects
2.2. MR Parameters and Study Protocol
2.3. Segmentation of Brain and Brainstem
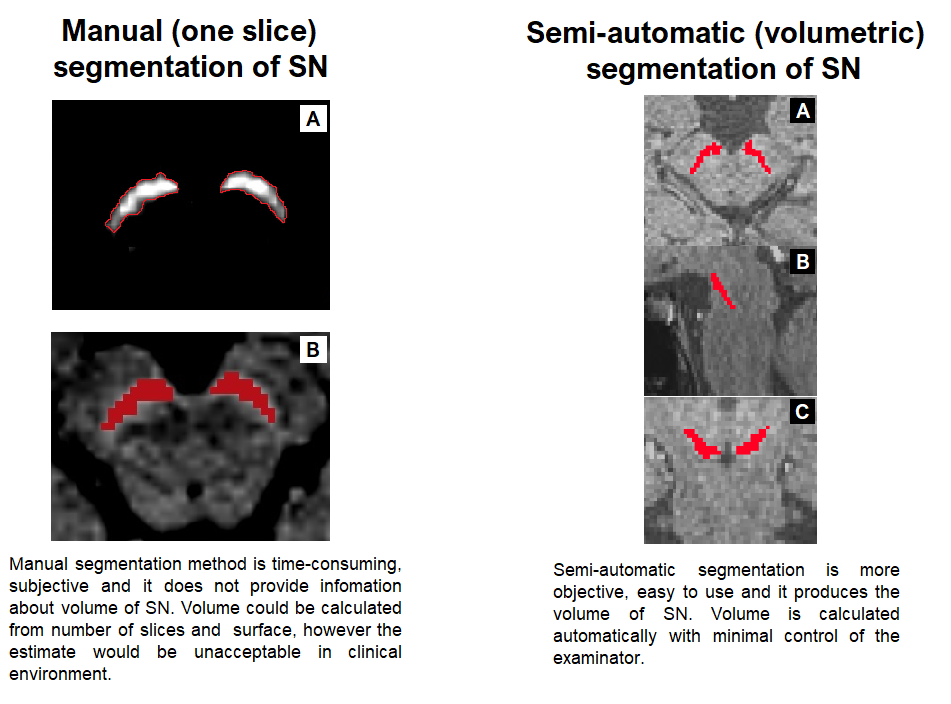
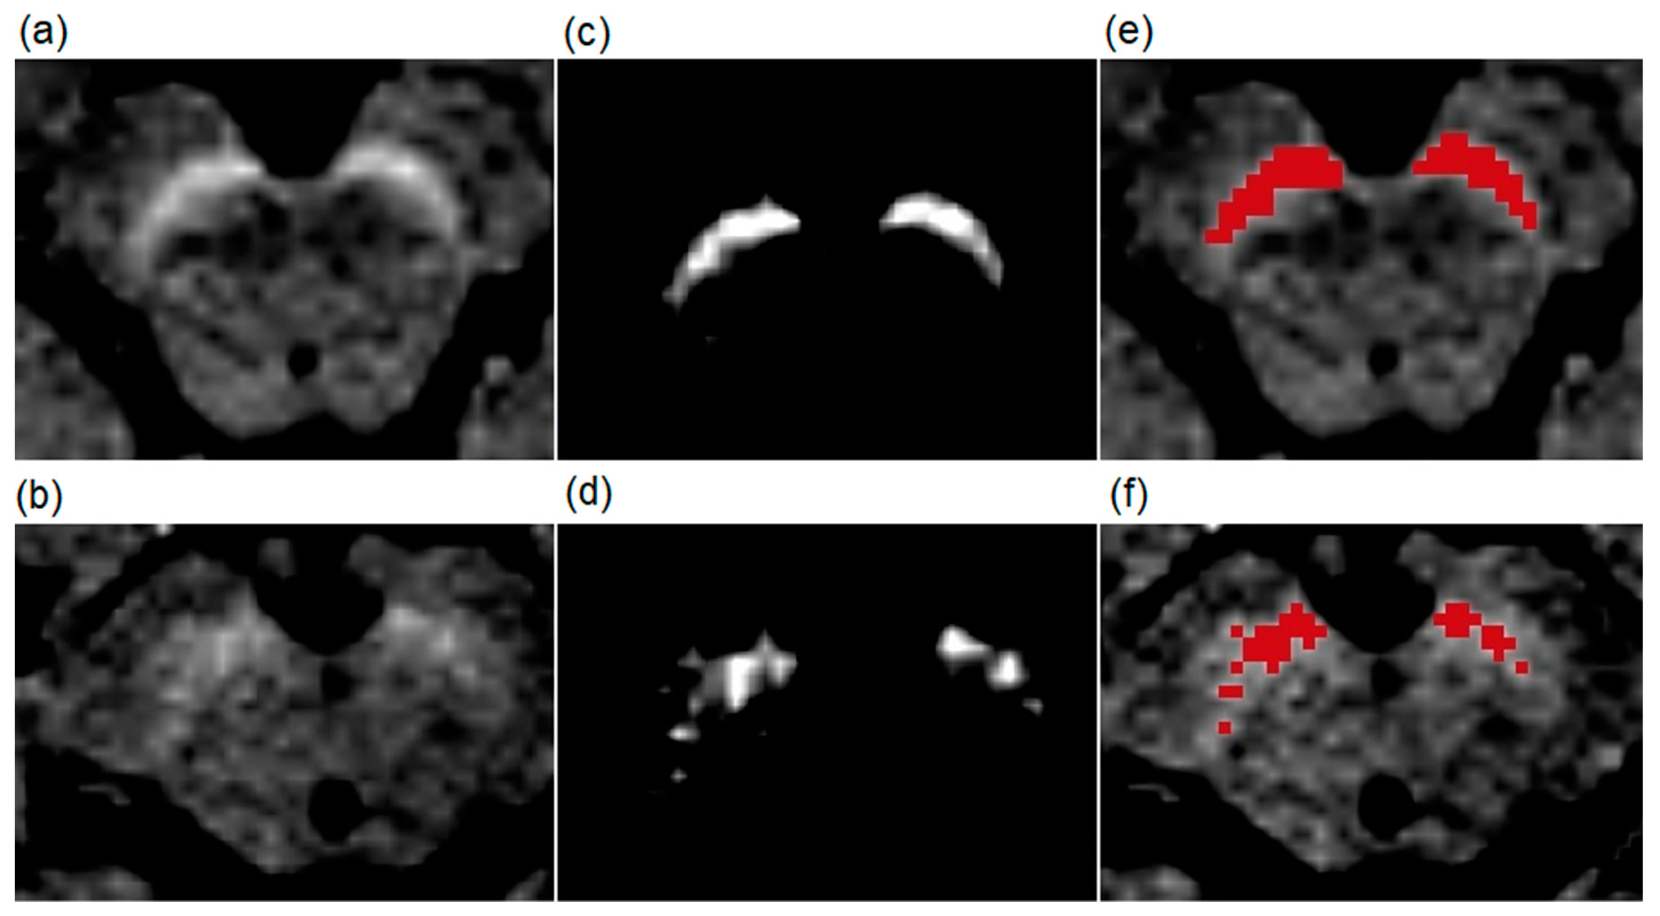
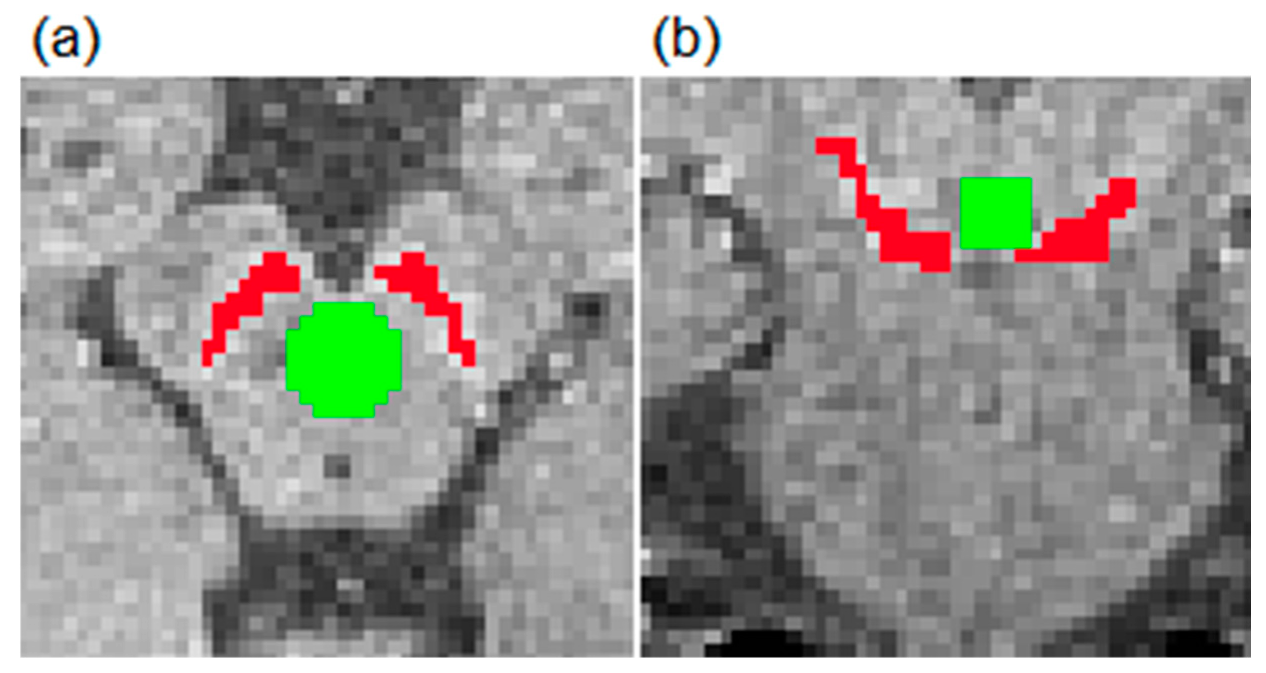
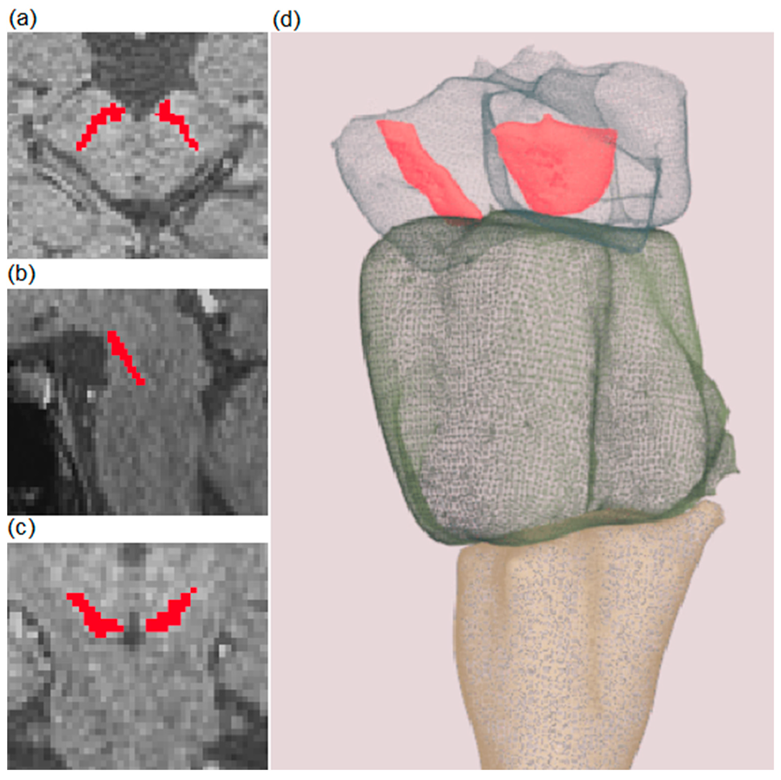
2.4. Segmentation of Substantia Nigra, Surface and Volumetric Analysis
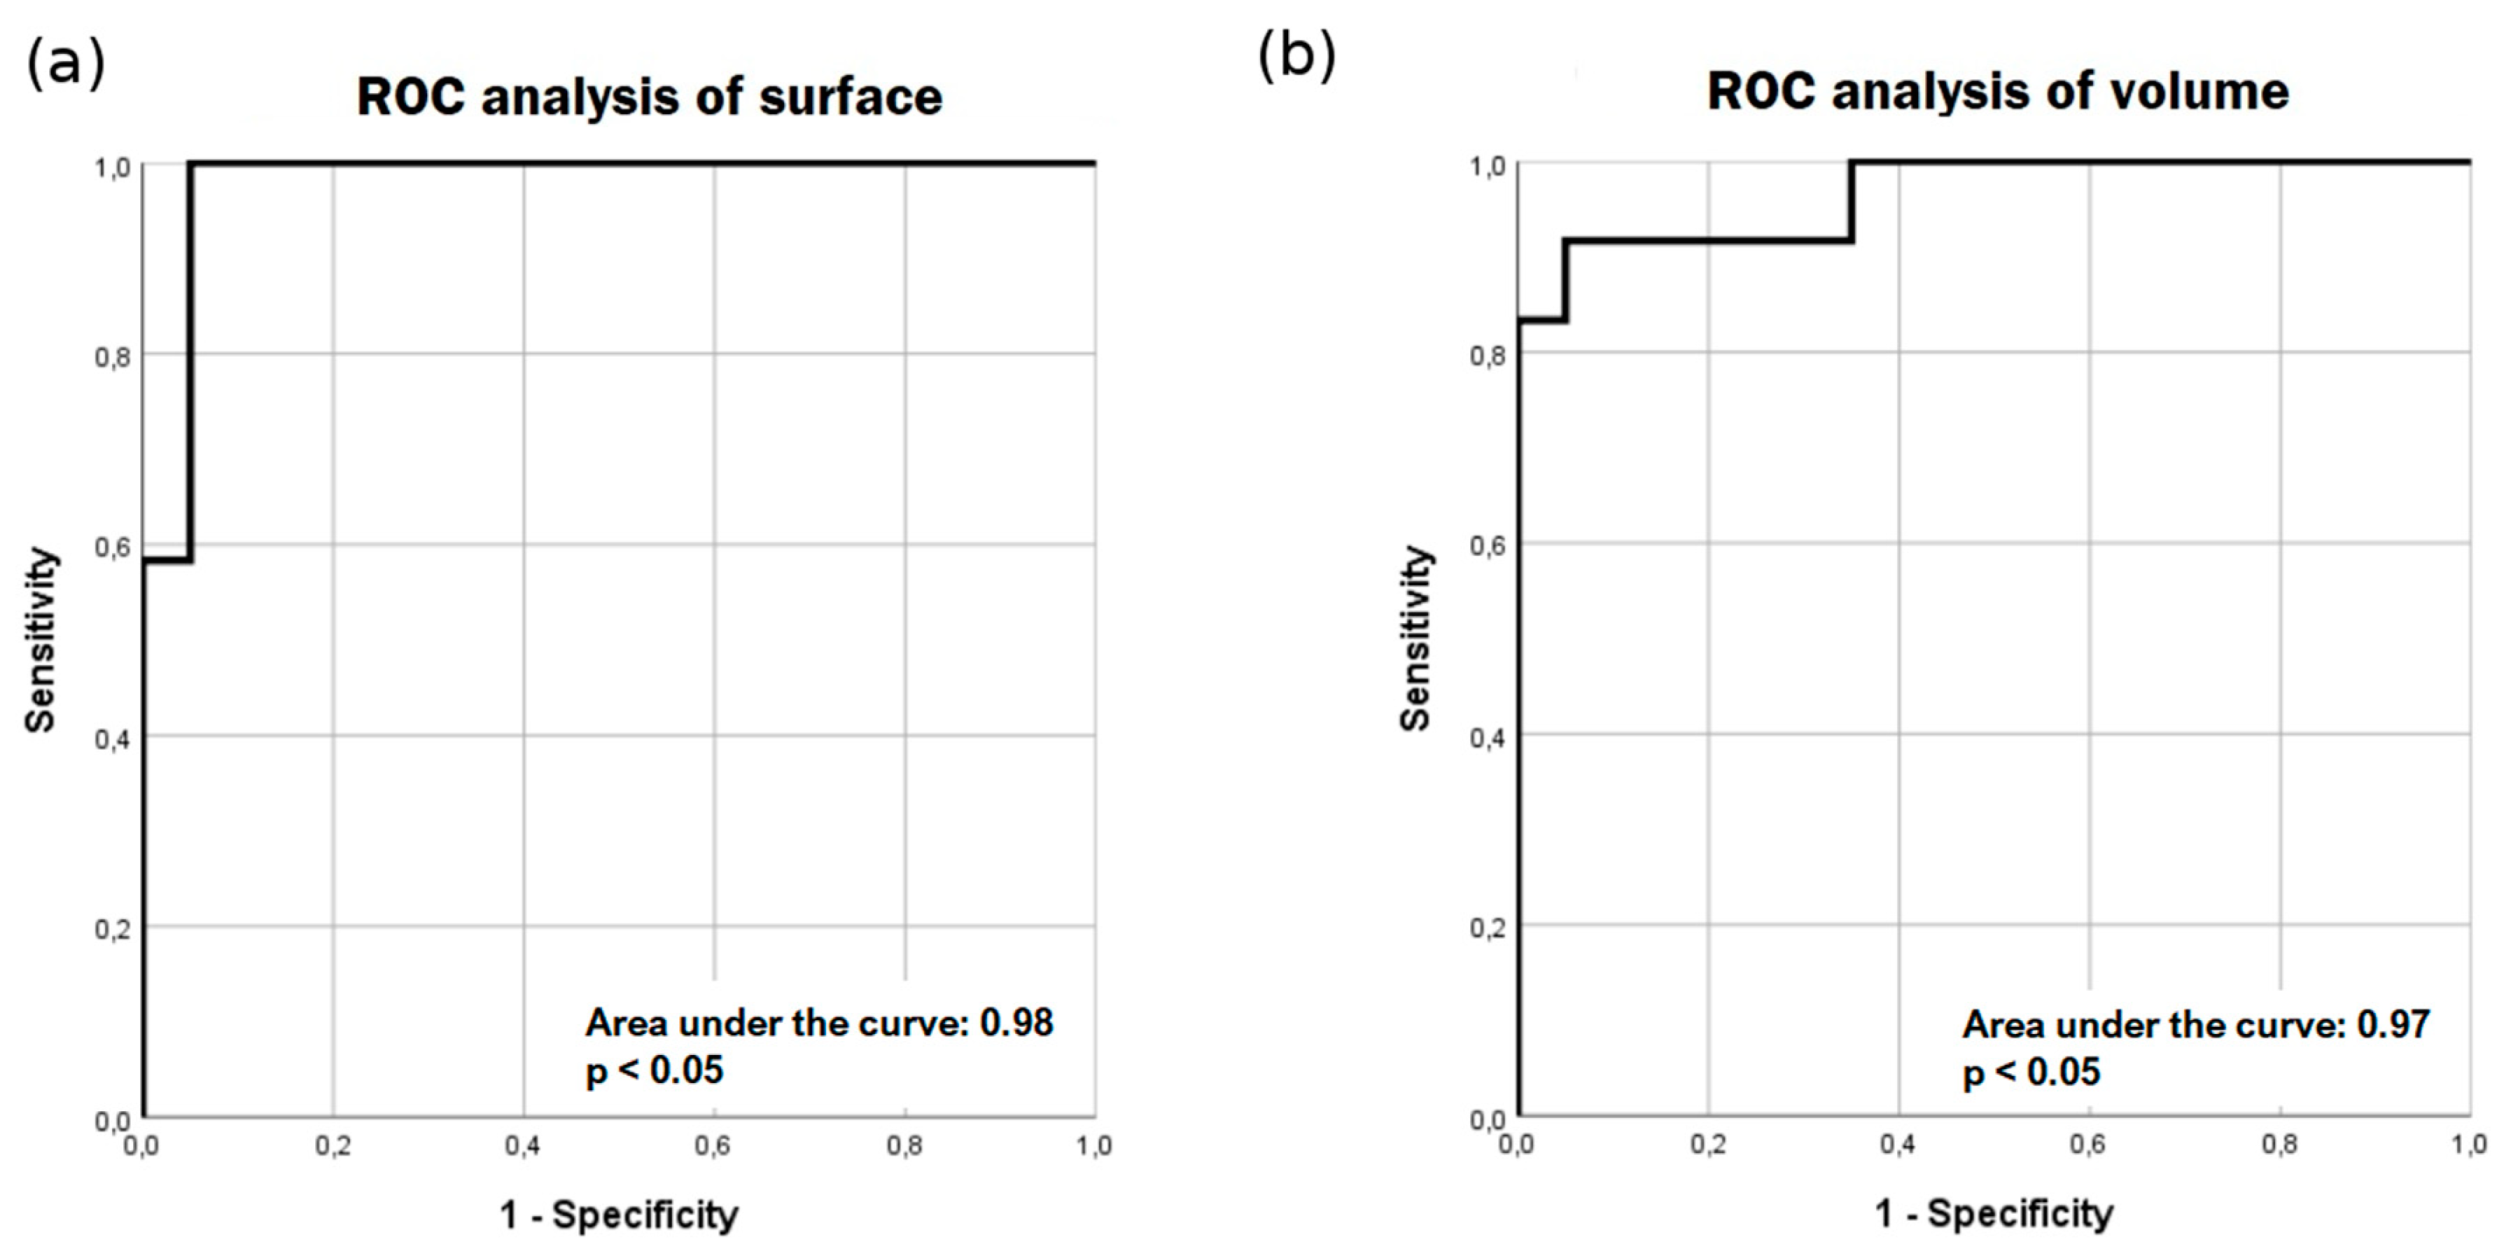
3. Results
4. Discussion
5. Conclusions
Supplementary Materials
Author Contributions
Funding
Acknowledgments
Conflicts of Interest
References
- Davie, C.A. A review of Parkinson’s disease. Br. Med. Bull. 2008, 86, 109–127. [Google Scholar] [CrossRef] [PubMed]
- Dickson, D.W. Parkinson’s disease and parkinsonism: Neuropathology. Cold Spring Harb. Perspect. Med. 2012, 2, 9258. [Google Scholar] [CrossRef] [PubMed]
- Rizzo, G.; Copetti, M.; Arcuti, S.; Martino, D.; Fontana, A.; Logroscino, G. Accuracy of clinical diagnosis of Parkinson disease: A systematic review and meta-analysis. Neurology 2016, 86, 566–576. [Google Scholar] [CrossRef] [PubMed]
- Pagano, G.; Niccolini, F.; Politis, M. Imaging in Parkinson’s disease. Clin. Med. (Lond.) 2016, 16, 371–375. [Google Scholar] [CrossRef] [PubMed]
- Burn, D.J.; Sawle, G.V.; Brooks, D.J. Differential diagnosis of Parkinson’s disease, multiple system atrophy, and Steele-Richardson-Olszewski syndrome: Discriminant analysis of striatal 18F-dopa PET data. J. Neurol. Neurosurg. Psychiatry 1994, 57, 278–284. [Google Scholar] [CrossRef]
- Ghaemi, M.; Hilker, R.; Rudolf, J.; Sobesky, J.; Heiss, W.D. Differentiating multiple system atrophy from Parkinson’s disease: Contribution of striatal and midbrain MRI volumetry and multi-tracer PET imaging. J. Neurol. Neurosurg. Psychiatry 2002, 73, 517–523. [Google Scholar] [CrossRef]
- Brooks, D.J.; Ibanez, V.; Sawle, G.V.; Quinn, N.; Lees, A.J.; Mathias, C.J.; Bannister, R.; Marsden, C.D.; Frackowiak, R.S. Differing patterns of striatal 18F-dopa uptake in Parkinson’s disease, multiple system atrophy, and progressive supranuclear palsy. Ann. Neurol. 1990, 28, 547–555. [Google Scholar] [CrossRef]
- Pirker, W.; Asenbaum, S.; Bencsits, G.; Prayer, D.; Gerschlager, W.; Deecke, L.; Brucke, T. [123I]beta-CIT SPECT in multiple system atrophy, progressive supranuclear palsy, and corticobasal degeneration. Mov. Disord. 2000, 15, 1158–1167. [Google Scholar] [CrossRef]
- Eerola, J.; Tienari, P.J.; Kaakkola, S.; Nikkinen, P.; Launes, J. How useful is [123I]beta-CIT SPECT in clinical practice? J. Neurol. Neurosurg. Psychiatry 2005, 76, 1211–1216. [Google Scholar] [CrossRef]
- Suwijn, S.R.; van Boheemen, C.J.; de Haan, R.J.; Tissingh, G.; Booij, J.; de Bie, R.M. The diagnostic accuracy of dopamine transporter SPECT imaging to detect nigrostriatal cell loss in patients with Parkinson’s disease or clinically uncertain parkinsonism: A systematic review. EJNMMI Res. 2015, 5, 12. [Google Scholar] [CrossRef]
- Lu, F.M.; Yuan, Z. PET/SPECT molecular imaging in clinical neuroscience: Recent advances in the investigation of CNS diseases. Quant. Imaging Med. Surg. 2015, 5, 433–447. [Google Scholar] [CrossRef] [PubMed]
- Fedorow, H.; Tribl, F.; Halliday, G.; Gerlach, M.; Riederer, P.; Double, K.L. Neuromelanin in human dopamine neurons: Comparison with peripheral melanins and relevance to Parkinson’s disease. Prog. Neurobiol. 2005, 75, 109–124. [Google Scholar] [CrossRef] [PubMed]
- Sulzer, D.; Zecca, L. Intraneuronal dopamine-quinone synthesis: A review. Neurotox. Res. 2000, 1, 181–195. [Google Scholar] [CrossRef] [PubMed]
- Haining, R.L.; Achat-Mendes, C. Neuromelanin, one of the most overlooked molecules in modern medicine, is not a spectator. Neural Regen. Res. 2017, 12, 372–375. [Google Scholar] [CrossRef]
- Sulzer, D.; Cassidy, C.; Horga, G.; Kang, U.J.; Fahn, S.; Casella, L.; Pezzoli, G.; Langley, J.; Hu, X.P.; Zucca, F.A.; et al. Neuromelanin detection by magnetic resonance imaging (MRI) and its promise as a biomarker for Parkinson’s disease. NPJ Parkinsons Dis. 2018, 4, 11. [Google Scholar] [CrossRef]
- Enochs, W.S.; Petherick, P.; Bogdanova, A.; Mohr, U.; Weissleder, R. Paramagnetic metal scavenging by melanin: MR imaging. Radiology 1997, 204, 417–423. [Google Scholar] [CrossRef]
- Duguid, J.R.; De La Paz, R.; DeGroot, J. Magnetic resonance imaging of the midbrain in Parkinson’s disease. Ann. Neurol. 1986, 20, 744–747. [Google Scholar] [CrossRef]
- Wang, J.; Li, Y.; Huang, Z.; Wan, W.; Zhang, Y.; Wang, C.; Cheng, X.; Ye, F.; Liu, K.; Fei, G.; et al. Neuromelanin-sensitive magnetic resonance imaging features of the substantia nigra and locus coeruleus in de novo Parkinson’s disease and its phenotypes. Eur. J. Neurol. 2018, 25, e949–e973. [Google Scholar] [CrossRef]
- Takahashi, H.; Watanabe, Y.; Tanaka, H.; Mihara, M.; Mochizuki, H.; Liu, T.; Wang, Y.; Tomiyama, N. Quantifying changes in nigrosomes using quantitative susceptibility mapping and neuromelanin imaging for the diagnosis of early-stage Parkinson’s disease. Br. J. Radiol. 2018, 91, 20180037. [Google Scholar] [CrossRef]
- Prasad, S.; Stezin, A.; Lenka, A.; George, L.; Saini, J.; Yadav, R.; Pal, P.K. Three-dimensional neuromelanin-sensitive magnetic resonance imaging of the substantia nigra in Parkinson’s disease. Eur. J. Neurol. 2018, 25, 680–686. [Google Scholar] [CrossRef]
- Fabbri, M.; Reimao, S.; Carvalho, M.; Nunes, R.G.; Abreu, D.; Guedes, L.C.; Bouca, R.; Lobo, P.P.; Godinho, C.; Coelho, M.; et al. Substantia Nigra Neuromelanin as an Imaging Biomarker of Disease Progression in Parkinson’s Disease. J. Parkinsons Dis. 2017, 7, 491–501. [Google Scholar] [CrossRef] [PubMed]
- Matsuura, K.; Maeda, M.; Tabei, K.I.; Umino, M.; Kajikawa, H.; Satoh, M.; Kida, H.; Tomimoto, H. A longitudinal study of neuromelanin-sensitive magnetic resonance imaging in Parkinson’s disease. Neurosci. Lett. 2016, 633, 112–117. [Google Scholar] [CrossRef] [PubMed]
- Xiang, Y.; Gong, T.; Wu, J.; Li, J.; Chen, Y.; Wang, Y.; Li, S.; Cong, L.; Lin, Y.; Han, Y.; et al. Subtypes evaluation of motor dysfunction in Parkinson’s disease using neuromelanin-sensitive magnetic resonance imaging. Neurosci. Lett. 2017, 638, 145–150. [Google Scholar] [CrossRef] [PubMed]
- Sasaki, M.; Shibata, E.; Tohyama, K.; Takahashi, J.; Otsuka, K.; Tsuchiya, K.; Takahashi, S.; Ehara, S.; Terayama, Y.; Sakai, A. Neuromelanin magnetic resonance imaging of locus ceruleus and substantia nigra in Parkinson’s disease. Neuroreport 2006, 17, 1215–1218. [Google Scholar] [CrossRef]
- Schwarz, S.T.; Rittman, T.; Gontu, V.; Morgan, P.S.; Bajaj, N.; Auer, D.P. T1-weighted MRI shows stage-dependent substantia nigra signal loss in Parkinson’s disease. Mov. Disord. 2011, 26, 1633–1638. [Google Scholar] [CrossRef]
- Pyatigorskaya, N.; Magnin, B.; Mongin, M.; Yahia-Cherif, L.; Valabregue, R.; Arnaldi, D.; Ewenczyk, C.; Poupon, C.; Vidailhet, M.; Lehericy, S. Comparative Study of MRI Biomarkers in the Substantia Nigra to Discriminate Idiopathic Parkinson Disease. AJNR Am. J. Neuroradiol. 2018, 39, 1460–1467. [Google Scholar] [CrossRef]
- Ohtsuka, C.; Sasaki, M.; Konno, K.; Koide, M.; Kato, K.; Takahashi, J.; Takahashi, S.; Kudo, K.; Yamashita, F.; Terayama, Y. Changes in substantia nigra and locus coeruleus in patients with early-stage Parkinson’s disease using neuromelanin-sensitive MR imaging. Neurosci. Lett. 2013, 541, 93–98. [Google Scholar] [CrossRef]
- Isaias, I.U.; Trujillo, P.; Summers, P.; Marotta, G.; Mainardi, L.; Pezzoli, G.; Zecca, L.; Costa, A. Neuromelanin Imaging and Dopaminergic Loss in Parkinson’s Disease. Front. Aging Neurosci. 2016, 8, 196. [Google Scholar] [CrossRef]
- Taniguchi, D.; Hatano, T.; Kamagata, K.; Okuzumi, A.; Oji, Y.; Mori, A.; Hori, M.; Aoki, S.; Hattori, N. Neuromelanin imaging and midbrain volumetry in progressive supranuclear palsy and Parkinson’s disease. Mov. Disord. 2018, 33, 1488–1492. [Google Scholar] [CrossRef]
- Schwarz, S.T.; Xing, Y.; Tomar, P.; Bajaj, N.; Auer, D.P. In Vivo Assessment of Brainstem Depigmentation in Parkinson Disease: Potential as a Severity Marker for Multicenter Studies. Radiology 2017, 283, 789–798. [Google Scholar] [CrossRef]
- Castellanos, G.; Fernandez-Seara, M.A.; Lorenzo-Betancor, O.; Ortega-Cubero, S.; Puigvert, M.; Uranga, J.; Vidorreta, M.; Irigoyen, J.; Lorenzo, E.; Munoz-Barrutia, A.; et al. Automated neuromelanin imaging as a diagnostic biomarker for Parkinson’s disease. Mov. Disord. 2015, 30, 945–952. [Google Scholar] [CrossRef]
- Ogisu, K.; Kudo, K.; Sasaki, M.; Sakushima, K.; Yabe, I.; Sasaki, H.; Terae, S.; Nakanishi, M.; Shirato, H. 3D neuromelanin-sensitive magnetic resonance imaging with semi-automated volume measurement of the substantia nigra pars compacta for diagnosis of Parkinson’s disease. Neuroradiology 2013, 55, 719–724. [Google Scholar] [CrossRef]
- Kashihara, K.; Shinya, T.; Higaki, F. Neuromelanin magnetic resonance imaging of nigral volume loss in patients with Parkinson’s disease. J. Clin. Neurosci. 2011, 18, 1093–1096. [Google Scholar] [CrossRef]
- Reimao, S.; Pita Lobo, P.; Neutel, D.; Guedes, L.C.; Coelho, M.; Rosa, M.M.; Azevedo, P.; Ferreira, J.; Abreu, D.; Goncalves, N.; et al. Substantia nigra neuromelanin-MR imaging differentiates essential tremor from Parkinson’s disease. Mov. Disord. 2015, 30, 953–959. [Google Scholar] [CrossRef]
- Matsusue, E.; Fujihara, Y.; Tanaka, K.; Aozasa, Y.; Shimoda, M.; Nakayasu, H.; Nakamura, K.; Ogawa, T. The utility of the combined use of (123)I-FP-CIT SPECT and neuromelanin MRI in differentiating Parkinson’s disease from other parkinsonian syndromes. Acta Radiol. 2018, 60, 8871. [Google Scholar] [CrossRef]
- Ohtsuka, C.; Sasaki, M.; Konno, K.; Kato, K.; Takahashi, J.; Yamashita, F.; Terayama, Y. Differentiation of early-stage parkinsonisms using neuromelanin-sensitive magnetic resonance imaging. Parkinsonism Relat. Disord. 2014, 20, 755–760. [Google Scholar] [CrossRef]
- Vovk, A.; Cox, R.W.; Stare, J.; Suput, D.; Saad, Z.S. Segmentation priors from local image properties: Without using bias field correction, location-based templates, or registration. NeuroImage 2011, 55, 142–152. [Google Scholar] [CrossRef]
- Selvaganesan, K.; Whitehead, E.; DeAlwis, P.M.; Schindler, M.K.; Inati, S.; Saad, Z.S.; Ohayon, J.E.; Cortese, I.C.M.; Smith, B.; Steven, J.; et al. Robust, atlas-free, automatic segmentation of brain MRI in health and disease. Heliyon 2019, 5, e01226. [Google Scholar] [CrossRef]
- Iglesias, J.E.; Van Leemput, K.; Bhatt, P.; Casillas, C.; Dutt, S.; Schuff, N.; Truran-Sacrey, D.; Boxer, A.; Fischl, B.; Alzheimer’s Disease Neuroimaging Initiative. Bayesian segmentation of brainstem structures in MRI. NeuroImage 2015, 113, 184–195. [Google Scholar] [CrossRef]
- Fischl, B.; Dale, A.M. Measuring the thickness of the human cerebral cortex from magnetic resonance images. Proc. Natl. Acad. Sci. USA 2000, 97, 11050–11055. [Google Scholar] [CrossRef]
- Fischl, B.; Salat, D.H.; Busa, E.; Albert, M.; Dieterich, M.; Haselgrove, C.; van der Kouwe, A.; Killiany, R.; Kennedy, D.; Klaveness, S.; et al. Whole brain segmentation: Automated labeling of neuroanatomical structures in the human brain. Neuron 2002, 33, 341–355. [Google Scholar] [CrossRef]
- Fischl, B.; Salat, D.H.; van der Kouwe, A.J.; Makris, N.; Segonne, F.; Quinn, B.T.; Dale, A.M. Sequence-independent segmentation of magnetic resonance images. NeuroImage 2004, 23 (Suppl. S1), S69–S84. [Google Scholar] [CrossRef]
- Fischl, B.; Sereno, M.I.; Dale, A.M. Cortical surface-based analysis. II: Inflation, flattening, and a surface-based coordinate system. NeuroImage 1999, 9, 195–207. [Google Scholar] [CrossRef]
- Fischl, B.; Sereno, M.I.; Tootell, R.B.; Dale, A.M. High-resolution intersubject averaging and a coordinate system for the cortical surface. Hum. Brain Mapp. 1999, 8, 272–284. [Google Scholar] [CrossRef]
- Fischl, B.; van der Kouwe, A.; Destrieux, C.; Halgren, E.; Segonne, F.; Salat, D.H.; Busa, E.; Seidman, L.J.; Goldstein, J.; Kennedy, D.; et al. Automatically parcellating the human cerebral cortex. Cerebral. Cortex 2004, 14, 11–22. [Google Scholar] [CrossRef]
- Dale, A.M.; Fischl, B.; Sereno, M.I. Cortical surface-based analysis. I. Segmentation and surface reconstruction. NeuroImage 1999, 9, 179–194. [Google Scholar] [CrossRef]
- Vovk, A.; Cox, R.W.; Suput, D.; Stare, J.; Saad, Z.S. Use of signatures to create probability maps of brain tissues in health and disease—A new diagnostic tool? Zdr. Vestn. 2011, 80, 476–482. [Google Scholar]
- Oikawa, H.; Sasaki, M.; Tamakawa, Y.; Ehara, S.; Tohyama, K. The substantia nigra in Parkinson disease: Proton density-weighted spin-echo and fast short inversion time inversion-recovery MR findings. AJNR Am. J. Neuroradiol. 2002, 23, 1747–1756. [Google Scholar]
- Lehericy, S.; Bardinet, E.; Poupon, C.; Vidailhet, M.; Francois, C. 7 Tesla magnetic resonance imaging: A closer look at substantia nigra anatomy in Parkinson’s disease. Mov. Disord. 2014, 29, 1574–1581. [Google Scholar] [CrossRef]
- Okuzumi, A.; Hatano, T.; Kamagata, K.; Hori, M.; Mori, A.; Oji, Y.; Taniguchi, D.; Daida, K.; Shimo, Y.; Yanagisawa, N.; et al. Neuromelanin or DaT-SPECT: Which is the better marker for discriminating advanced Parkinson’s disease? Eur. J. Neurol. 2019, 26, 1408–1416. [Google Scholar] [CrossRef]
- Kuya, K.; Ogawa, T.; Shinohara, Y.; Ishibashi, M.; Fujii, S.; Mukuda, N.; Tanabe, Y. Evaluation of Parkinson’s disease by neuromelanin-sensitive magnetic resonance imaging and (123)I-FP-CIT SPECT. Acta Radiol. 2018, 59, 593–598. [Google Scholar] [CrossRef]
- Kuya, K.; Shinohara, Y.; Miyoshi, F.; Fujii, S.; Tanabe, Y.; Ogawa, T. Correlation between neuromelanin-sensitive MR imaging and (123)I-FP-CIT SPECT in patients with parkinsonism. Neuroradiology 2016, 58, 351–356. [Google Scholar] [CrossRef]


| PD | HC | |
|---|---|---|
| Number | 20 | 12 |
| Age | 67.1 ± 4.8 | 64.0 ± 4.8 |
| Duration of PD | 3.7 ± 2.8 | / |
| HY | 2.1 ± 0.2 | / |
| MMSE | 29.8 ± 0.5 | 29.2 ± 1.1 |
| PD | HC | Group Comparison | |
|---|---|---|---|
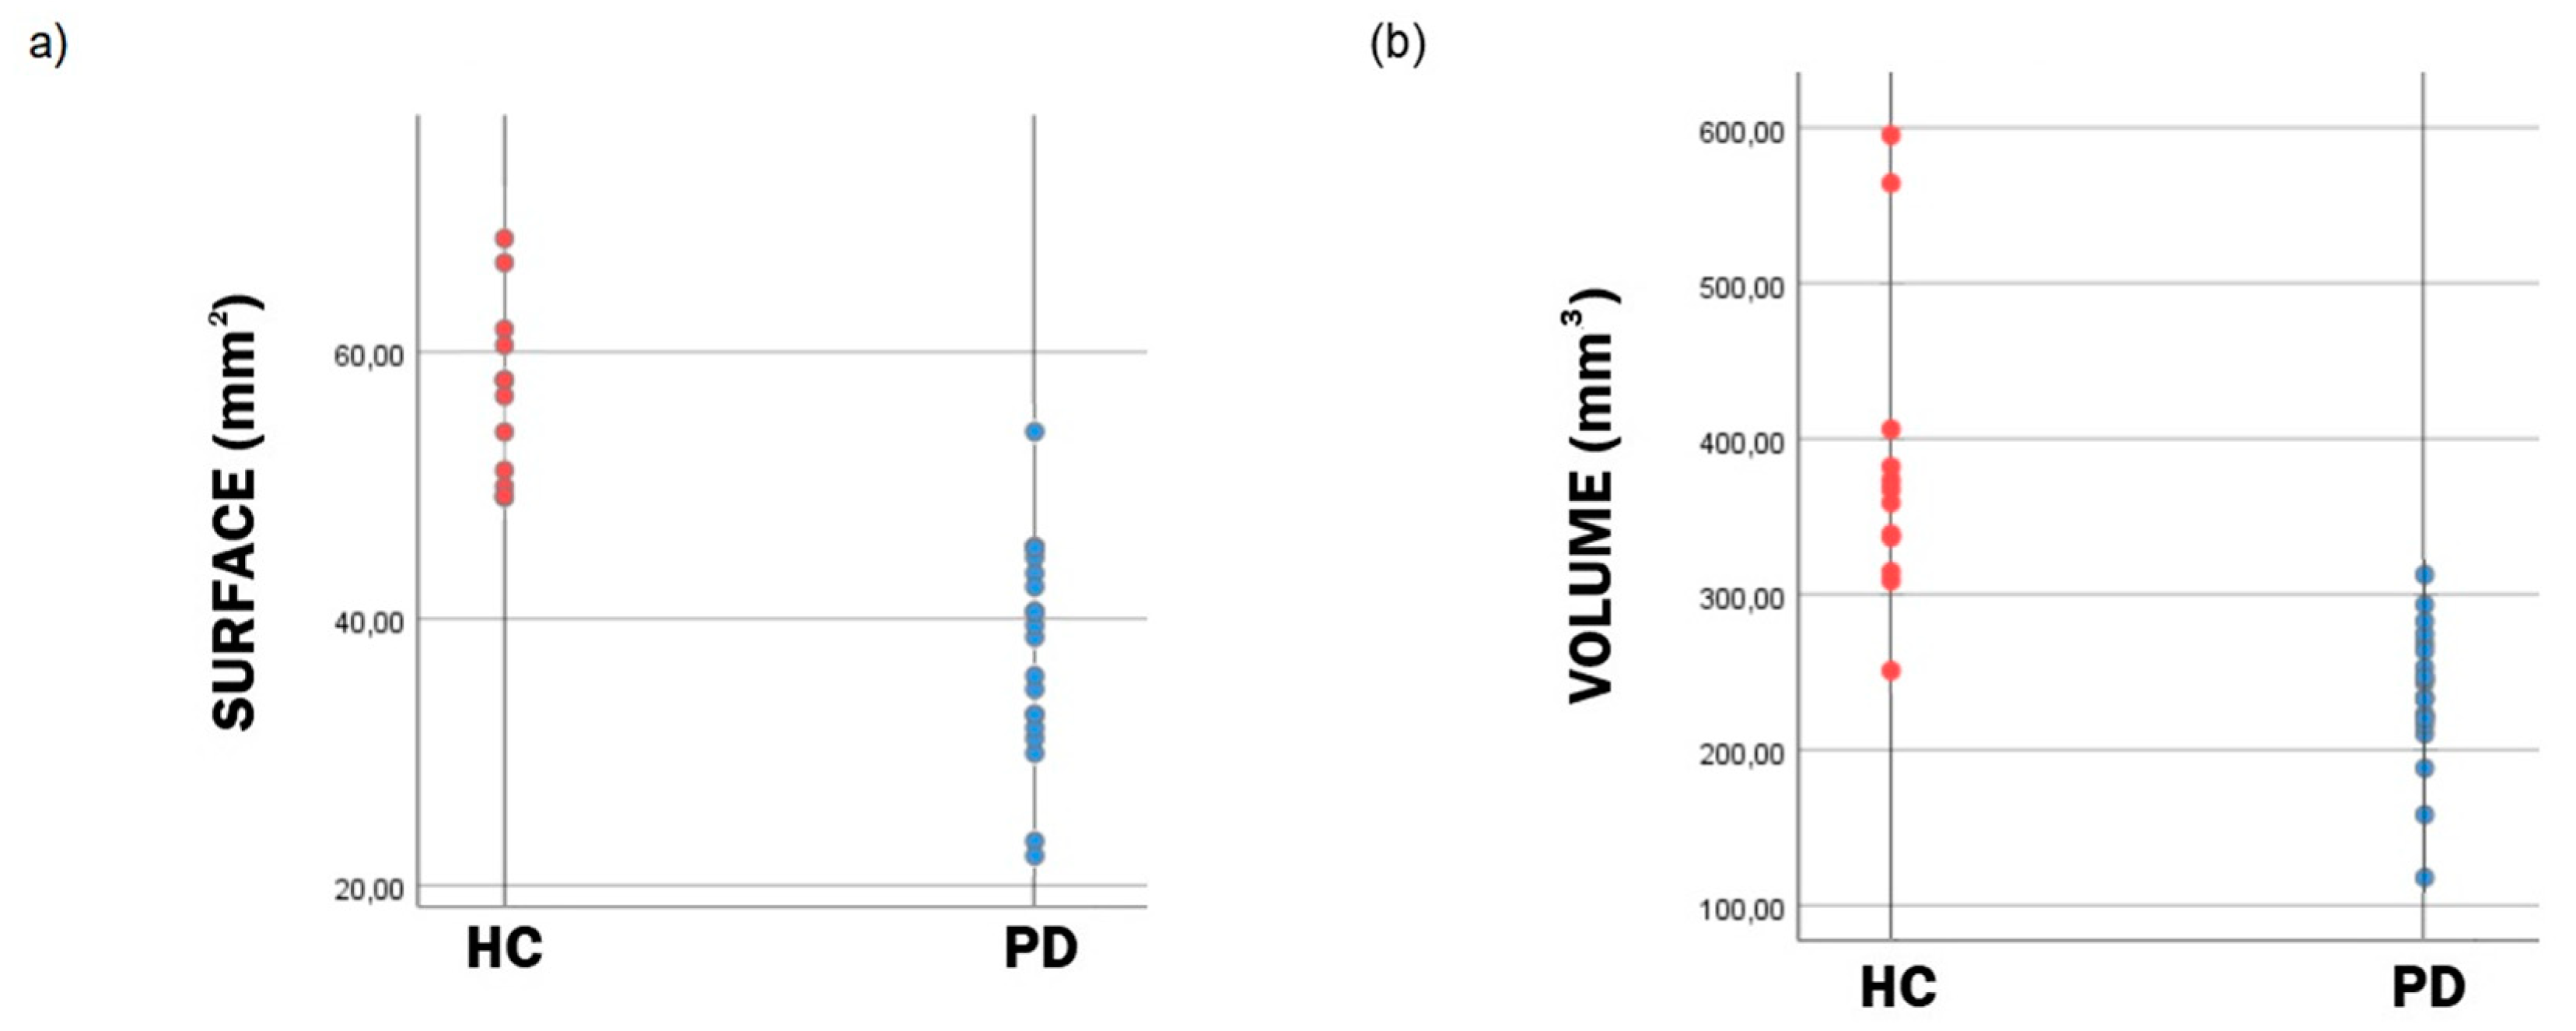
| Surface (mm2) | 37.7 ± 8.0 | 56.9 ± 6.6 | p = 0.0001 |
| Volume (mm3) | 235.1 ± 45.4 | 382.9 ± 100.5 | p = 0.002 |
| SInorm | 1.27 ± 0.04 | 1.28 ± 0.03 | p = 0.861 |
| PD | HC | Group Comparison | |
|---|---|---|---|
| MV (mm3) | 6244.8 ± 650 | 6391.1 ± 864.3 | p = 0.877 |
| Surface/MV | 6.1 ± 1.4 | 9.1 ± 1.7 | p = 0.001 |
| Volume/MV | 3.8 ± 0.7 | 6.0 ± 1.5 | p = 0.0004 |
© 2019 by the authors. Licensee MDPI, Basel, Switzerland. This article is an open access article distributed under the terms and conditions of the Creative Commons Attribution (CC BY) license (http://creativecommons.org/licenses/by/4.0/).
Share and Cite
Zupan, G.; Šuput, D.; Pirtošek, Z.; Vovk, A. Semi-Automatic Signature-Based Segmentation Method for Quantification of Neuromelanin in Substantia Nigra. Brain Sci. 2019, 9, 335. https://doi.org/10.3390/brainsci9120335
Zupan G, Šuput D, Pirtošek Z, Vovk A. Semi-Automatic Signature-Based Segmentation Method for Quantification of Neuromelanin in Substantia Nigra. Brain Sciences. 2019; 9(12):335. https://doi.org/10.3390/brainsci9120335
Chicago/Turabian StyleZupan, Gašper, Dušan Šuput, Zvezdan Pirtošek, and Andrej Vovk. 2019. "Semi-Automatic Signature-Based Segmentation Method for Quantification of Neuromelanin in Substantia Nigra" Brain Sciences 9, no. 12: 335. https://doi.org/10.3390/brainsci9120335
APA StyleZupan, G., Šuput, D., Pirtošek, Z., & Vovk, A. (2019). Semi-Automatic Signature-Based Segmentation Method for Quantification of Neuromelanin in Substantia Nigra. Brain Sciences, 9(12), 335. https://doi.org/10.3390/brainsci9120335