Abstract
Background/Objectives: Plasticity deficits play a key role in the pathophysiology of various psychiatric and neurological disorders. Paired associative stimulation (PAS) leverages Hebbian principles to induce synaptic plasticity in the human brain. By repeatedly pairing (1) the peripheral nerve stimulation of the median nerve with (2) transcranial magnetic stimulation over the primary motor cortex (M1) at different inter-stimulus intervals (25 ms; PAS-25, or 10 ms; PAS-10), corticospinal excitability can be increased (PAS-25, mimicking long-term potentiation (LTP)) or decreased (PAS-10, mimicking long-term depression (LTD)). However, variations in the number of pairings and inter-pair intervals lack consensus. The aim of the study was to evaluate four different PAS paradigms, i.e., PAS-10 and PAS-25 with both 180 versus 225 pairings each, to establish the most reliable PAS protocols for LTP- and LTD-like cortical changes. Methods: In a randomized, double-blind, crossover study, 14 healthy participants underwent PAS-10 and PAS-25 with 180 and 225 pairings. Excitability was assessed by quantifying the EMG response amplitude of a hand muscle to a single stimulus. Results: PAS-25 with 225 pairings produced a robust enhancement of corticospinal excitability, while PAS-25 with 180 pairings was less effective. Surprisingly, PAS-10 with both 180 and 225 pairings also increased excitability. Conclusions: While all four PAS paradigms enhanced M1 excitability, PAS-25 with 225 pairings induced the strongest group-level effects and was most time-efficient. Significant individual variability of PAS responses suggests that optimizing PAS parameters, including pairing number and interstimulus intervals, may be necessary for personalized approaches.
1. Introduction
Plasticity is the nervous systems’ ability to adapt and re-arrange synaptic connections and reorganize circuitry in response to internal or external stimuli, critical to cognitive, emotional, and behavioral functioning throughout the life span [1,2]. Plasticity encompasses processes such as neurogenesis, neurotrophic signaling, neurotransmitter modulation, and synaptic remodeling. These mechanisms are thought to be disrupted in the pathophysiology of, e.g., depression [3] and schizophrenia [4]. For example, in major depression, there is reduced memory function and hippocampal volume, potentially related to deficient growth factors and neurotrophic factor signaling and subsequent aberrant plasticity. Such impairments in plasticity may be partly restored by electroconvulsive therapy and ketamine treatment [5]. Moreover, in major depressive disorder, deficient connectivity within and between the default mode network and central executive network is thought to contribute to the pathophysiology [6,7]. Non-invasive brain stimulation treatments, such as repetitive transcranial magnetic stimulation (TMS), may counteract these deficits by modulating cortical plasticity, contributing to the antidepressant effect [6,7]. In schizophrenia, deficits in plasticity and cognition impair everyday functioning, and NMDA receptor acting agents as well as TMS-based treatments are proposed to alleviate these deficits [8,9]. Thus, research on brain plasticity has advanced our understanding of the pathophysiology of neurological and psychiatric disorders while driving innovative therapies. Expanding the knowledge of neural plasticity is essential for developing targeted treatments, making it crucial to define methods that effectively induce synaptic plasticity [10].
Paired associative stimulation (PAS) enables the assessment of synaptic plasticity in the human cortex by combining repetitive TMS and peripheral nerve stimulation (PnS) [11]. It involves the close-to-synchronous stimulation of a peripheral nerve, e.g., the right median nerve, paired with TMS stimulation of the corresponding area in the primary motor cortex, within a narrowly defined time window (the inter-stimulus interval). Depending on the inter-stimulus interval between the primary PnS and secondary TMS delivered stimulus, PAS enhances or inhibits corticospinal excitability [12]. Plasticity-induced changes of excitability are assessed by quantifying the EMG response amplitude of a muscle to a single stimulus. These changes are thought to be comparable to Hebbian synaptic plasticity, i.e., long-term potentiation (LTP) and long-term depression (LTD). PAS-induced LTP- and LTD-like responses demonstrate temporal specificity [12]: PAS LTP is induced at PnS-TMS inter-stimulus intervals around 25 ms (PAS-25). PAS LTD is typically induced at inter-stimulus intervals of 10 ms (PAS-10) [13]. These PAS changes rely on neurochemical properties mimicking those observed in in vitro LTP and LTD: dependence on NMDA- [14,15], GABA-B [16], dopamine- [17], and nicotinic [18,19] receptor functioning.
There are large methodological variations in PAS paradigms, particularly concerning the number and frequency of paired stimuli, across research settings. The original PAS study used 90 paired pulses with an inter-stimulus interval of 25 ms (PAS-25) with pairs presented at 0.1 Hz (i.e., pairs presented every 10 s), resulting in a robust increase in the post-PAS EMG response [11]. Altering the interval between pairings influences the protocol length [20], and a meta-analysis confirmed that 0.05 (i.e., pairs presented every 20 s) and 0.2 Hz (i.e., pairs presented every 5 s) inter-pair frequencies produced the most robust PAS LTP effects [21]. It was also demonstrated that seven of eight studies using 225 paired pulses found a significant PAS effect [21]. Other laboratories produced significant PAS-25 effects using 180 paired pulses at 0.1 Hz [9,22,23]. Moreover, delivering a higher number of paired pulses in lower-limb PAS interventions (e.g., 360 pairings instead of 180) tends to enhance cortico-spinal excitability [24]. It remains to be clarified how different stimulation parameters, such as the number of paired pulses and inter-pair intervals, specifically influence cortico-spinal excitability, and the lack of standardization may explain variable outcomes. To address this, the present study aimed to conduct a comparative analysis of four established PAS protocols: PAS-10 and PAS-25 with 180 paired pulses at 0.1 Hz (i.e., pairs presented every 10 s) and PAS-10 and PAS-25 with 225 paired pulses at 0.25 Hz (i.e., pairs presented every 4 s). These paradigms have been used in various studies to explore changes in plasticity to elucidate different neurological and psychiatric pathological mechanisms [25,26,27,28]. This study aimed to deepen the understanding of how distinct stimulation parameters affect neural plasticity.
2. Materials and Methods
2.1. Study Design
The study was carried out as a double-blinded (as regards to inter-stimulus intervals), randomized, crossover study consisting of a total of four test sessions, each separated by at least 7 days, see Figure 1A for experimental design. Subjects were randomly assigned to different PAS paradigms using a computerized chance generator such that the experimenter was blind to which paradigm the subject received. Randomization was handled using software written in C++ Visual Studio 2010. The same software controlled the delivery and timing of TMS and PnS pulses based on a randomized subject number.
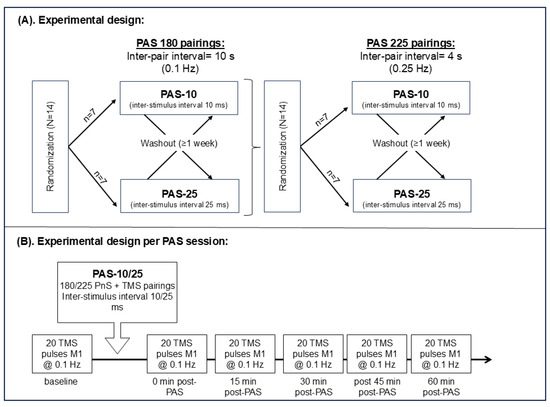
Figure 1.
(A) Experimental design consisting of two phases: (1) 180 PnS + TMS pairings and (2) of 225 PnS + TMS pairings, 14 healthy participants were randomized to receive either of PAS-10 (n = 7) or PAS-25 (n = 7) first and were after at least 1 week washed out and crossed over to receive the other treatment. (A,B) The 180 PnS + TMS pair was delivered every 10 s (i.e., @0.1 Hz) for a total of 30 min, while the 225 PnS + TMS pair was delivered every 4 s (i.e., @0.25 Hz) for a total of 15 min. (B) Baseline and post-PAS MEPs consisted of 20 single pulses (every 10 s, i.e., @0.1 Hz) targeting the primary motor cortex. Post-PAS MEPs were assessed at 0, 15, 30, 45, and 60 min after PAS. Abbreviations: PAS = paired associative stimulation, PnS = peripheral nerve stimulation, TMS = transcranial magnetic stimulation, and M1 = primary motor cortex.
2.2. Participants
Healthy controls were recruited via newspaper ads and advertisement at the University of Gothenburg, Sweden (Approved by the Ethical Review board of Gothenburg, Sweden). Fourteen healthy controls were included in the four PAS testing sessions, evaluating the effects of PAS-10 and PAS-25 using 180 and 225 pairings. Inclusion criteria were as follows: age 18–45 years, psychiatrically healthy (i.e., no DSM-IV axis I diagnosis, with the exception of a depressive episode in remission, ≥6 months), somatically healthy, and right-handedness (assessed by Oldfield Handedness Inventory [29]). Females had to use contraceptives or display a negative urine pregnancy test. Exclusion criteria were as follows: Use of tobacco ≤6 months, high alcohol consumption (AUDIT score ≥ 5 for females and ≥6 for males), use of narcotic drugs ≤ 6 months, and BMI > 27.
2.3. Transcranial Magnetic Stimulation:
TMS stimulation was delivered using a figure-of-eight coil, applying biphasic stimulations (duration 280 µs) in a posterior–anterior direction, connected to an eXimia TMS stimulator (Nexstim Ltd., Helsinki, Finland). The coil (outer diameter of each wing, 90 mm) was placed at a 45° angle from the midline of the head and flat against the skull of the subject. Navigated Brain Stimulation software (NBS, software version 3.2.1, Nexstim Ltd., Helsinki, Finland) was used to target and deliver stimulations at desired locations using a standard magnetic resonance image produced by the software. Subjects were fitted with tracking goggles, allowing a stereotactic camera connected to the system to track the subjects’ heads in real time using retroflective materials fitted onto the goggles as well as the coil.
2.4. Electromyography
To identify the cortical region corresponding to the abductor pollicis brevis muscle (APB), repeated single-pulse TMS stimulations were delivered to the motor cortex (M1). Each pulse elicited a MEP that was recorded with EMG using Ag–Ag/Cl surface electrodes with a measuring area of 95 mm2 (Ambu Neuroline 720, Ambu, Helsingborg, Sweden). The active electrode was placed over the muscle belly, and the reference electrode was placed over the interphalangeal joint of the thumb. A ground electrode was placed on the dorsal side of the hand. The recorded EMG was sampled at 3000 Hz and band-pass filtered (between 10 and 500 Hz).
2.5. Peripheral Nerve Stimulation
Electrical stimulation of the median nerve (PnS) of the hand was performed using a surface stimulation electrode at a fixed distance (Nihon Kohden NM-422B, Nihon Kohoden Corporation, Tokyo, Japan). The stimulator was placed over the ventral right forearm at the level of the wrist with the cathode proximally, corresponding to the median nerve, assessed by repeated PnS stimulations and observing muscle activity in the APB. The perceptual threshold for the PnS intensity was determined, with the lowest stimulation intensity perceived by the subject. During PAS, the PnS stimulation (stimulus width, 200 µs) intensity was set to 300% of the perceptual threshold.
2.6. Resting Motor Thresholds and PAS Stimulation Intensity
Starting at 50% TMS intensity, the motor cortex hotspot was located as the maximal EMG output. The resting motor threshold (RMT) was determined as the lowest stimulation intensity producing at least 50 µV EMG response in 5 out of 10 stimulations. PAS stimulation intensity was set to 120% of RMT, aiming to produce a response amplitude of ~0.7 to 1 mV peak-to-peak (mean of 20 stimulations).
2.7. PAS Testing
The PAS protocols involved repetitive delivery of two paired stimulations: (1) electrical stimulation of the right median nerve, followed by an interstimulus interval of 25 ms (for LTP [11]) and 10 ms (for LTD [15]); (2) a TMS pulse delivered to the left M1, hence PAS-25 and PAS-10. In total, four different PAS protocols were evaluated: (1) PAS-10 (180, [30]); (2) PAS-25 (180, [9]); (3) PAS-10 (225, [31]); (4) PAS-25 (225, [23]), see Table 1 for stimulation parameters.

Table 1.
Stimulation parameters of the four PAS paradigms.
The evaluation of 180 pairings (both PAS-10 and PAS-25) was carried out in the first phase of experiments, and 225 pairings (both PAS-10 and PAS-25) were evaluated in the second phase of experiments, see Figure 1A.
The PAS-10 or PAS-25 protocols were executed in a random order, determined by the software containing the randomization list. PAS sessions were separated by at least one week, and the two different paradigms (i.e., 180 vs. 225 paired PAS pulses) were tested one year apart due to logistic limitations. Plasticity induction was assessed as changes in TMS-induced MEP amplitudes: mean of 20 stimulations at 0.1 Hz at baseline and 0, 15, 30, 45, and 60 min post-PAS, see Figure 1B.
2.8. Attention
To gauge the subjects’ attention, they were instructed to focus their attention and to keep looking at the stimulated hand and recite the number of stimulations received at six predetermined time points during PAS. The difference between the number of stimulations delivered and the amount received was calculated for each participant at each time point, and the total mean of recited errors was calculated for each paradigm.
2.9. Statistics
To estimate the sample size required, an approximation in accordance with previous successful PAS studies, where sample sizes varied from nine [27] to 12 [22] healthy subjects, was made. After conducting a post hoc power analysis, the sample size was calculated using G*Power 3.1 for a repeated measure one-way ANOVA (rmANOVA) within subjects’ factors, using the following parameters: effect size f = 0.3 (equivalent of a Cohen’s d = 0.6), power (1 − β) = 0.8, and α = 0.05. This resulted in a final sample size of 14. Normality testing was carried out using the Kolmogorov–Smirnov analysis. Responders were defined by estimating the grand mean of all post-PAS measurements and dividing it by the baseline mean. A quotient > 1.0 was required for PAS-25 and <1.0 for PAS-10.
The primary aim was to assess change in mean MEP, comparing baseline to changes at different time points post-PAS (i.e., 0, 15, 30, 45, and 60 min) for the four different PAS protocols. LTD was defined as a decrease in mean MEP comparing baseline to cumulative post-PAS change in MEP (i.e., mean of post-PAS 0–60 min measures), while LTP was defined as an increase in mean MEP comparing baseline to post-PAS change in MEP (i.e., mean of post-PAS 0–60 min measures). To analyze the change in measured MEP amplitudes over time in each separate protocol, a linear model was applied to execute an rmANOVA, with the within-subjects factor time, in the whole study group, excluding non-responders. For data with a skewed distribution, Friedman’s test was applied for repeated measures, followed by the Wilcoxon post hoc test for paired comparisons of post-PAS time points. Post hoc Bonferroni corrected analysis or Wilcoxon test was performed for pairwise comparison between different time points and baseline when data were normally distributed. Variability testing between sessions was performed for RMT levels and cumulative post/pre ratios per paradigm using rmANOVA.
Relationships between baseline demographics, such as age, height, RMT, stimulus intensity, and PAS response, were analyzed in responders using Pearson and Spearman correlations.
The difference between the number of stimulations delivered and the number recited was calculated for each participant at each time point, and the total mean of the recited errors between sessions for each participant was calculated for each paradigm. The means were then compared between paradigms using the Mann–Whitney U test because the data distribution was skewed.
Data are expressed as normalized means ± standard error of the mean (SEM), unless stated otherwise. The alpha level was set to 0.05 in all tests. All analyses were performed using IBM SPSS (version 29.02).
2.10. Graphics
Figures were made using Excel, PowerPoint, and Adobe for pdf.
3. Results
3.1. Subject Demographics
Demographics of the total group and responder subgroups per paradigm are presented in Table 2. Responders were defined by estimating the grand mean of all post-PAS measurements and dividing it by the baseline mean. A quotient > 1.0 was required for PAS-25 and <1.0 for PAS-10. However, since only three subjects qualified as LTD responders (post/pre mean ratio < 1.0), no statistical analysis was computed on that sub-sample. Instead, it turned out that in both PAS-10 paradigms, 10 versus 12 participants qualified as LTP responders (i.e., a post/pre MEP mean > 1.0), see Table 2.
Table 2.
Demographics in all participants and in responders per PAS paradigm.
3.2. No Significant Difference in RMT Between Test Sessions
To assess the within-subject test–retest validity between sessions, a repeated measures analysis of the RMT was performed. No significant difference was found F(3;39) = 1380, p = 0.263.
3.3. PAS-10 with 180 or 225 Paired Pulses Did Not Result in Decreased but Increased Corticospinal Excitation
Repeated measures ANOVA did not detect any significant effects of PAS-10 with 180 pairings in the whole sample of subjects (N = 14), F(2.667;34.673) = 2.446, p = 0.087, Greenhouse–Geisser corrected (Figure 2).
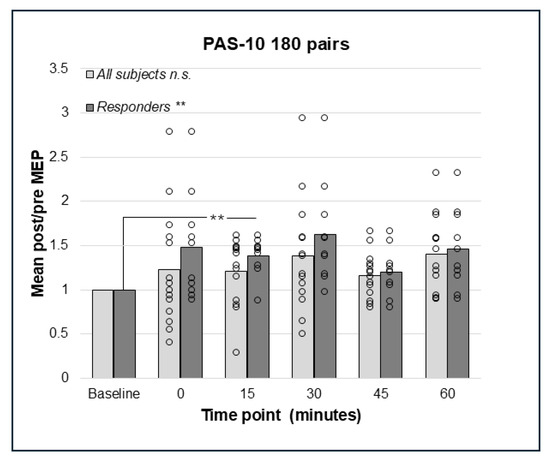
Figure 2.
Relative change in MEP response from baseline (mean post/pre ratio = 1.0) to 0, 15, 30, 45, and 60 min post-PAS for PAS-10 with 180 PnS + TMS pairings; bars represent responders and non-responders. No significant effects of PAS-10 with 180 pairings were found in the whole sample. In responders (n = 10), a significant overall effect of PAS-10 180 pairs; p = 0.002 was found, and post hoc pairwise comparisons showed a significant different between baseline and 15 min; p = 0.004. ** = p < 0.01. n.s. = non-significant.
Repeated measures analysis for PAS-10 and 225 paired pulses identified a statistically significant effect in the whole sample (N = 14); F(5;65) = 2.41, p = 0.046, such that there was an increase in post-PAS MEP amplitude. However, pairwise comparisons did not detect any significant differences between baseline and post-PAS MEPs (Figure 3). Thus, both PAS-10 paradigms increased cortico-spinal excitability (see Figure 2 and Figure 3), and the analysis of responders (post/pre mean ratio > 1.0) resulted in 10 (PAS-10 180 pairs, Figure 2) and 12 (PAS-10 225 pairs, Figure 3) responders, respectively. Repeated measures ANOVA in responders detected a significant enhancing effect of PAS-10 180 pairs (n = 10); F(5;45) = 4.63, p = 0.002 at 15 min; p = 0.004 (Figure 2). Regarding PAS-10 225 pairs, there was a similar effect in responders (n = 12): F(5;55) = 3.15, p = 0.014, at 15 min; p = 0.041 (Figure 3).
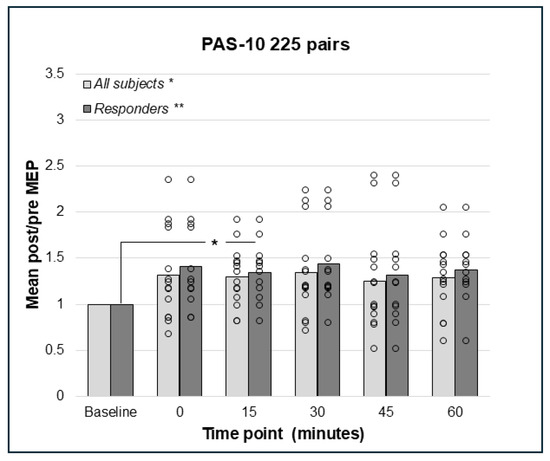
Figure 3.
Relative change in MEP response from baseline (mean post/pre ratio = 1.0) to 0, 15, 30, 45, and 60 min post-PAS for PAS-10 with 225 PnS + TMS pairings; bars represent responders and non-responders. A significant effect for PAS-10 and 225 paired pulses was found in the whole sample; p = 0.046, but no pairwise differences post-PAS. In responders (n = 12), there was a significant overall effect; p = 0.014, and post hoc pair wise comparisons showed a significant effect comparing baseline to 15 min; p = 0.041. * = p < 0.05, ** = p < 0.01.
3.4. PAS-25 with 180 and 225 Paired Pulses Resulted in a Significant Increase in the Corticospinal Excitation
Repeated measures ANOVA did not detect a significant effect on the cortico-spinal excitability of PAS-25 with 180 pairings in the whole sample (N = 14), F(3.03;39.39) = 2.57, p = 0.067, Greenhouse–Geisser corrected results (Figure 4). However, the analyses of responders only (n = 9) using rmANOVA detected a significant effect, F(5;40) = 4.09, p = 0.004, indicating enhanced cortico-spinal excitability. Bonferroni-corrected pairwise comparisons did not detect any significant effect between pre- and post-PAS MEPs; however, there was a trend towards a difference between baseline and post-PAS MEPs at 60 min (p = 0.055, Figure 4). For PAS-25, with 225 pairs, data for post-PAS testing at post 0 min for the whole sample and 30 min for responders were not normally distributed. The Friedman test identified no significant effect of PAS-25 with 225 pairs in the whole sample (N = 14); Chi2(5) = 10.44, p = 0.064 (Figure 5); however, there was a significant increase in MEP amplitudes post-PAS in responders (n = 9); Chi2(5) = 21.51, p < 0.001. Wilcoxon signed rank test detected significant differences between baseline and post-PAS post/pre mean ratios at 15 min (p = 0.015), 45 min (p = 0.008), and 60 min (p = 0.008) in responders, see Figure 5.
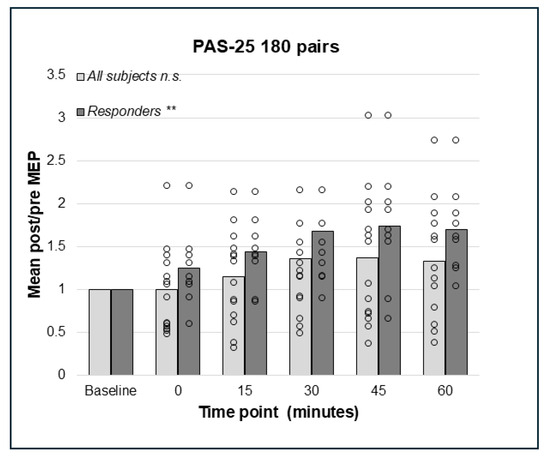
Figure 4.
Relative change in MEP response from baseline (mean post/pre ratio = 1.0) to 0, 15, 30, 45, and 60 min post-PAS for PAS-25 with 180 PnS + TMS pairings; bars represent responders and non-responders. No significant effects of PAS-25 with 180 pairings were found in the whole sample. In responders (n = 9), a significant overall effect of PAS-10 180 pairs; p = 0.004 was found, but post hoc pairwise comparisons were not significant. ** = p < 0.01. n.s. = non-significant.
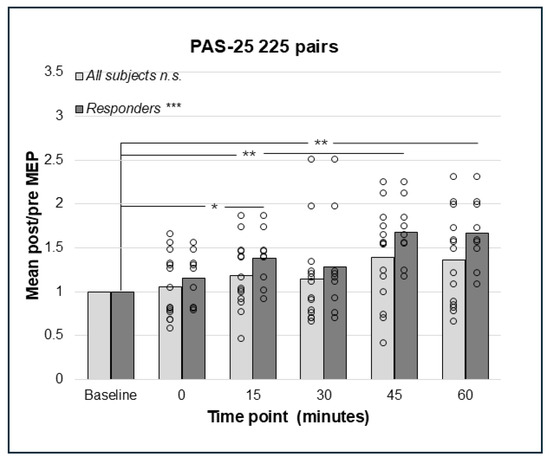
Figure 5.
Relative change in MEP response from baseline (mean post/pre ratio = 1.0) to 0, 15, 30, 45, and 60 min post-PAS for PAS-25 with 225 PnS + TMS pairings; bars represent responders and non-responders. No significant effect for PAS-25 and 225 paired pulses was found in the whole sample. In responders (n = 9), there was a significant overall effect; *** p < 0.001, and post hoc pair wise comparisons showed a significant effect comparing baseline to 15 min; * p = 0.015, 45 min; ** p = 0.008 and 60 min; p = 0.008. n.s. = non-significant.
Comparison of PAS outcomes between the four paradigms (PAS-10 and -25 with 180 versus 225 pairings) using paired samples t-tests detected no significant difference in mean post/pre ratios in the whole study group. This may at least partly be explained by the great variability in individual PAS responses between different PAS paradigms (see Figure 6).
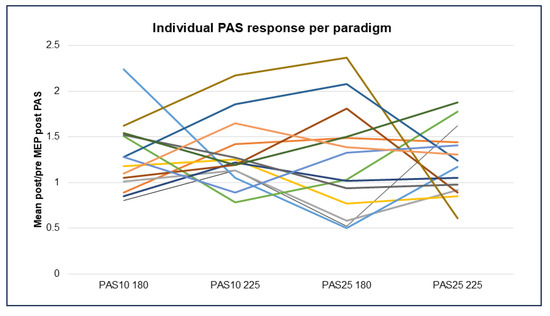
Figure 6.
Individual PAS response per healthy participant, where each participant is signified by a different colored line (N = 14) in each of the four PAS paradigms, represented by mean change in MEP response, comparing baseline to all post-PAS time points. Abbreviations: PAS = paired associative stimulation and MEP = motor evoked potential.
3.5. Attentional Measure
There was no statistical difference in the means of calculated discrepancy between recited and delivered stimuli during intervention between the PAS-180 and 225 paradigms analyzed using the Mann–Whitney U test (U = 82.5, p = 0.475).
4. Discussion
This small randomized, double-blinded, crossover method study, aimed at evaluating four different PAS paradigms, two for assessing LTD (PAS-10 with 180 and 225 pairings) and two for assessing LTP (PAS-25 with 180 and 225 pairings) in healthy participants. The results demonstrated increased corticospinal excitability as indicative of LTP in all four PAS paradigms. As such, the PAS-10 protocol did not induce the expected decrease in corticospinal excitability, and there was large individual variability in response to all four paradigms. Notably, the PAS-225 protocol achieved significant PAS-25 (i.e., increased corticospinal excitability/LTP-like effects) at the group level of responders and yielded significant changes from baseline to post-PAS measures, whereas PAS-25 180 pairs did not produce a significant effect at post-PAS measures. This indicates that PAS-25 with 225 pairs is the most robust.
4.1. PAS-25 with 225 Pairings
PAS-25 with 225 pairings significantly increased corticospinal excitability in responders, and the pairwise comparisons identified significant differences between baseline and 15, 45, and 60 min post-PAS. The post-PAS excitability is rarely uniform, as illustrated by the lack of significance at 0 and 30 min post-PAS herein. Variability in post-PAS increases often occurs; for example, in Kaneko et al. (2024), healthy participants displayed an increased cortical excitability after PAS-25 with 180 pairings at post 0 and 15 min but not at 30 min post-PAS [32]. Bidirectional and non-linear plasticity may occur as PAS-induced plasticity depends on bidirectional homeostatic plasticity mechanisms in which the direction of PAS effect is dependent upon previous excitability as the brain has a built-in system to maintain an optimal range of excitability [33]. PAS mimics spike-timing-dependent plasticity (STDP) in which plasticity changes may be delayed due to required molecular mechanisms, such as NMDA receptor activation and AMPA receptor recruitment [34]. As such, Fransteva et al. (2008) using PAS-25 with 180 pairings found an increased cortical facilitation at 30 and 60 min but not at 0 and 15 min post-PAS [9]. In addition, differences in PAS effects between studies are likely due to a range of individual differences [35] and different stimulation parameters, such as stimulation intensity and the number of PAS pairings [36].
The PAS protocols with 225 pairings yielded lower variance, compared to the PAS-180 pairings. The duration of PAS with 225 pairings was 15 min, while 180 pairings took 30 min. Previous studies established greater facilitation using shorter protocols [28]. This aspect of shorter interventions is worth considering as the subject’s attentional level significantly influences PAS-induced plasticity [20]. Our results did not reveal a significant difference in attention levels between PAS protocols, yet participants frequently reported that the longer PAS-180 paradigm, compared to the PAS-225 paradigm, was particularly taxing. This difference in perception could explain the greater variability in the data from the PAS-180 group. It is also possible that the 225 pairings option yields a stronger corticospinal excitability due to more pulses than 180; as such, a dose-response PAS-25 study found that 270 pairings induced more robust LTP-like effects than 90 and 180 pairings [36].
Taken together, PAS-25 with 225 pairings was the most reliable and well-tolerated LTP protocol, and the results were in line with the a priori hypothesis of enhanced corticospinal excitability.
4.2. PAS-10 Increased Corticospinal Excitability
Surprisingly, the overall effect of the supposed LTD-inducing paradigms (PAS-10 with 180 and 225 pairs) resulted in a significant increase in excitability. Wischnewski and Schutter (2016) [21] evaluated the magnitude of PAS effects in 89 studies and found larger effects for PAS LTP compared to PAS LTD. In total, 22 studies on LTD were included in the meta-analysis, and the comparably low number of PAS LTD studies using the same stimulation parameters as the current study limits comparison. One stimulation parameter influencing corticospinal excitability is TMS intensity (i.e., sub- versus supra threshold intensities) during PAS stimulation.
As PAS mimics STDP, the level of postsynaptic depolarization regulates NMDAR activation and the likelihood of postsynaptic spiking [34]. In patch clamp studies, a shift from LTD to LTP appears with increasing levels of postsynaptic depolarization during presynaptic input [34]. Increasing TMS intensity leads to increased excitatory input to postsynaptic corticospinal neurons, increasing the likelihood for LTP with supra-threshold intensities [37]. Using sub-threshold (<100% of RMT) TMS stimulation during PAS results in decreased corticospinal excitability, i.e., LTD [38]. In here, the supra-threshold TMS intensity of 120% of RMT during PAS was used, and it is thus possible that the excitatory input to postsynaptic corticospinal neurons resulted in enhanced corticospinal excitement and, hence, the unexpected LTP-like effects of PAS-10.
Taken together, the PAS-10-induced increase in corticospinal excitability in the present study may be due to supra-threshold TMS intensity during PAS. In general, the PAS-10 paradigm appears more volatile than the PAS-25/LTP paradigms and is far less studied; thus, the relatively low number of small studies calls for studies with greater power to establish the TMS parameters that produce a robust PAS-10 effect.
4.3. Patterns of Response in the Different PAS Paradigms
It has been established that not all healthy individuals display changes in cortico-spinal excitability due to PAS. In the present study, this was the case for 9 of 14 participants as PAS-25 responders. Minkova and colleagues (2019) [39] used PAS-25, 180 pairings, and established a 61% response rate, and the resting-state connectivity of the sensorimotor network was positively correlated with PAS response in responders. No other baseline predictor (i.e., age, sleep quality, or cognitive impairment) was found [39]. Lopez-Alfonzo and colleagues (2014) used PAS LTP (PAS-25, 200 pairings, response = grand mean > 1.0), resulting in response rates of 54% [35]. No predictive relationship of baseline measures (the time of day, age, stimulation intensity/resting motor thresholds, or baseline short-interval cortical inhibition) and PAS response were identified. Studies have established effects of attention [20], age [40], and the time of day for PAS facilitation [40]; however, no single variable seems sufficient to reliably predict PAS response.
Herein, a different pattern of responses was noted than expected as all PAS paradigms tended to be facilitatory. More individuals responded inhibitory to the PAS-25 paradigms than the PAS-10 paradigms (Figure 6). The PAS-25 180 pairings yielded the largest variance in responses. The PAS-10 with 225 pairings resulted in facilitation in 12 out of 14 patients, thus providing a robust increase in excitability post-PAS in most subjects but with a greater variance than PAS-25 with 225 pairings. Of note is that the test–retest reliability of PAS-25 has previously been demonstrated to be surprisingly low [41]. The present study suggests that the responses to different PAS paradigms are individual, thus blunting significant findings using group-based analysis.
5. Limitations
This study is primarily limited by the number of study participants (N = 14), especially since 14 to 29% of participants were non-responders in the different PAS paradigms. However, the majority of previous PAS studies (see [21] for a comprehensive review) tend to be in the lower range of participants (≤14 participants per treatment group). The number of non-responders in this study is in comparison with other PAS studies. Despite this, the limited participant number in this study contributes to the variability in responses between paradigms and limits the interpretation of the results; thus, larger trials are needed to establish the effect of the current study.
6. Conclusions and Future Direction
In this methodological study, PAS-25 delivering 225 paired pulses at 0.25 Hz, produced a significant enhancement of motor cortico-spinal excitability lasting up to 60 min in healthy controls, while supposedly PAS LTD-inducing protocols failed to decrease excitability. The small study sample limits the interpretation of the unexpected PAS-10 data; however, supra-threshold TMS intensity during PAS may explain the LTP-like effects. As there is no consensus as to what threshold is needed for LTD-like effects, additional comparative supra- versus sub-threshold studies are warranted. In general, there is a lack of adequately powered PAS LTD studies; thus, larger studies are required to elucidate the effects and underlying mechanisms of PAS LTD. The application of PAS-25, with 225 pairings, at 0.25 Hz is reliable, time-efficient, and user-friendly, promoting future studies of human cortical plasticity.
Author Contributions
Conceptualization, C.E.W., E.J., M.T. and K.H.; methodology, C.E.W., K.H., M.T. and J.S.; software, K.H.; formal analysis, K.H., C.E.W. and M.T.; resources, M.T. and J.S.; data curation, K.H.; writing—original draft preparation, K.H. and C.E.W.; writing—review and editing, C.E.W., K.H., E.J., M.T. and J.S.; supervision, C.E.W. and E.J.; project administration, C.E.W.; funding acquisition, E.J. and C.E.W. All authors have read and agreed to the published version of the manuscript.
Funding
This research was funded by the Swedish Brain Foundation (C.W.), the Petrus and Augusta Hedlund Foundation (M-2024-2287, C.W.), the LUA/ALF grant (723941) from the Sahlgrenska University Hospital (C.W. and E.J.), and the ALF grant (RÖ-986017, M.T.). This study has not been presented at any scientific congress.
Institutional Review Board Statement
The study was conducted according to the guidelines of the Declaration of Helsinki and approved by the Regional Ethics Committee of Gothenburg Dnr: 615-14, date of approval: 25 May 2016.
Informed Consent Statement
Informed consent was obtained from all subjects involved in the study. Written informed consent has been obtained from the participants.
Data Availability Statement
Data are stored at the Gothenburg University’s environment for Secure storage service (information class 3).
Acknowledgments
Mikael Elam has provided expertise in setting up the study, discussing scientific details of conducting neurophysiology experiments. Göran Pegenius aided in training researchers using the NexStim apparatus.
Conflicts of Interest
The authors declare no conflicts of interest.
Abbreviations
The following abbreviations are used in this manuscript:
| EMG | Electromyographic |
| M1 | Primary motor cortex |
| LTP | Long-term potentiation |
| LTD | Long-term depression |
| rTMS | Repetitive transcranial magnetic stimulation |
| PAS | Paired associative stimulation |
| PnS | Peripheral nerve stimulation |
| RMT | Resting motor threshold |
| STDP | Spike-timing-dependent plasticity |
References
- Kolb, B.; Harker, A.; Gibb, R. Principles of plasticity in the developing brain. Dev. Med. Child Neurol. 2017, 59, 1218–1223. [Google Scholar] [CrossRef] [PubMed]
- Froudist-Walsh, S.; López-Barroso, D.; Torres-Prioris, M.J.; Croxson, P.L.; Berthier, M.L. Plasticity in the Working Memory System: Life Span Changes and Response to Injury. Neuroscientist 2018, 24, 261–276. [Google Scholar] [CrossRef] [PubMed]
- Pittenger, C.; Duman, R.S. Stress, depression, and neuroplasticity: A convergence of mechanisms. Neuropsychopharmacology 2008, 33, 88–109. [Google Scholar] [CrossRef] [PubMed]
- Lewis, D.A.; González-Burgos, G. Neuroplasticity of Neocortical Circuits in Schizophrenia. Neuropsychopharmacology 2008, 33, 141–165. [Google Scholar] [CrossRef]
- Levy, M.J.F.; Boulle, F.; Steinbusch, H.W.; van den Hove, D.; Kenis, G.; Lanfumey, L. Neurotrophic factors and neuroplasticity pathways in the pathophysiology and treatment of depression. Psychopharmacology 2018, 235, 2195–2220. [Google Scholar] [CrossRef]
- Liston, C.; Chen, A.C.; Zebley, B.D.; Drysdale, A.T.; Gordon, R.; Leuchter, B.; Voss, H.U.; Casey, B.; Etkin, A.; Dubin, M.J. Default Mode Network Mechanisms of Transcranial Magnetic Stimulation in Depression. Biol. Psychiatry 2014, 76, 517–526. [Google Scholar] [CrossRef]
- Persson, J.; Struckmann, W.; Gingnell, M.; Fällmar, D.; Bodén, R. Intermittent theta burst stimulation over the dorsomedial prefrontal cortex modulates resting-state connectivity in depressive patients: A sham-controlled study. Behav. Brain Res. 2020, 394, 112834. [Google Scholar] [CrossRef]
- Sehatpour, P.; Kantrowitz, J.T. Finding the Right Dose: NMDA Receptor-Modulating Treatments for Cognitive and Plasticity Deficits in Schizophrenia and the Role of Pharmacodynamic Target Engagement. Biol. Psychiatry 2025, 97, 128–138. [Google Scholar] [CrossRef]
- Frantseva, M.V.; Fitzgerald, P.B.; Chen, R.; Möller, B.; Daigle, M.; Daskalakis, Z.J. Evidence for Impaired Long-Term Potentiation in Schizophrenia and Its Relationship to Motor Skill Leaning. Cereb. Cortex 2008, 18, 990–996. [Google Scholar] [CrossRef]
- Appelbaum, L.G.; Shenasa, M.A.; Stolz, L.; Daskalakis, Z. Synaptic plasticity and mental health: Methods, challenges and opportunities. Neuropsychopharmacology 2023, 48, 113–120. [Google Scholar] [CrossRef]
- Stefan, K.; Kunesch, E.; Cohen, L.G.; Benecke, R.; Classen, J. Induction of plasticity in the human motor cortex by paired associative stimulation. Brain J. Neurol. 2000, 123 Pt 3, 572–584. [Google Scholar] [CrossRef]
- Ziemann, U.; Iliać, T.V.; Pauli, C.; Meintzschel, F.; Ruge, D. Learning modifies subsequent induction of long-term potentiation-like and long-term depression-like plasticity in human motor cortex. J. Neurosci. 2004, 24, 1666–1672. [Google Scholar] [CrossRef]
- Suppa, A.; Quartarone, A.; Siebner, H.; Chen, R.; Di Lazzaro, V.; Del Giudice, P.; Paulus, W.; Rothwell, J.C.; Ziemann, U.; Classen, J. The associative brain at work: Evidence from paired associative stimulation studies in humans. Clin. Neurophysiol. 2017, 128, 2140–2164. [Google Scholar] [CrossRef] [PubMed]
- Stefan, K.; Kunesch, E.; Benecke, R.; Cohen, L.G.; Classen, J. Mechanisms of enhancement of human motor cortex excitability induced by interventional paired associative stimulation. J. Physiol. 2002, 543, 699–708. [Google Scholar] [CrossRef] [PubMed]
- Wolters, A.; Sandbrink, F.; Schlottmann, A.; Kunesch, E.; Stefan, K.; Cohen, L.G.; Benecke, R.; Classen, J. A temporally asymmetric Hebbian rule governing plasticity in the human motor cortex. J. Neurophysiol. 2003, 89, 2339–2345. [Google Scholar] [CrossRef] [PubMed]
- McDonnell, M.N.; Orekhov, Y.; Ziemann, U. Suppression of LTP-like plasticity in human motor cortex by the GABAB receptor agonist baclofen. Exp. Brain Res. 2007, 180, 181–186. [Google Scholar] [CrossRef]
- Monte-Silva, K.; Kuo, M.-F.; Thirugnanasambandam, N.; Liebetanz, D.; Paulus, W.; Nitsche, M.A. Dose-Dependent Inverted U-Shaped Effect of Dopamine (D2-Like) Receptor Activation on Focal and Nonfocal Plasticity in Humans. J. Neurosci. 2009, 29, 6124–6131. [Google Scholar] [CrossRef]
- Grundey, J.; Thirugnanasambandam, N.; Kaminsky, K.; Drees, A.; Skwirba, A.C.; Lang, N.; Paulus, W.; Nitsche, M.A. Neuroplasticity in Cigarette Smokers Is Altered under Withdrawal and Partially Restituted by Nicotine Exposition. J. Neurosci. 2012, 32, 4156–4162. [Google Scholar] [CrossRef]
- Thirugnanasambandam, N.; Grundey, J.; Adam, K.; Drees, A.; Skwirba, A.C.; Lang, N.; Paulus, W.; Nitsche, M.A. Nicotinergic Impact on Focal and Non-Focal Neuroplasticity Induced by Non-Invasive Brain Stimulation in Non-Smoking Humans. Neuropsychopharmacology 2011, 36, 879–886. [Google Scholar] [CrossRef]
- Stefan, K.; Wycislo, M.; Classen, J. Modulation of Associative Human Motor Cortical Plasticity by Attention. J. Neurophysiol. 2004, 92, 66–72. [Google Scholar] [CrossRef]
- Wischnewski, M.; Schutter, D.J. Efficacy and time course of paired associative stimulation in cortical plasticity: Implications for neuropsychiatry. Clin. Neurophysiol. 2016, 127, 732–739. [Google Scholar] [CrossRef] [PubMed]
- Rajji, T.K.; Liu, S.-K.; Frantseva, M.V.; Mulsant, B.H.; Thoma, J.; Chen, R.; Fitzgerald, P.B.; Daskalakis, Z.J. Exploring the effect of inducing long-term potentiation in the human motor cortex on motor learning. Brain Stimul. 2011, 4, 137–144. [Google Scholar] [CrossRef] [PubMed]
- Lu, M.-K.; Bliem, B.; Jung, P.; Arai, N.; Tsai, C.-H.; Ziemann, U. Modulation of preparatory volitional motor cortical activity by paired associative transcranial magnetic stimulation. Hum. Brain Mapp. 2009, 30, 3645–3656. [Google Scholar] [CrossRef]
- Alder, G.; Signal, N.; Olsen, S.; Taylor, D. A Systematic Review of Paired Associative Stimulation (PAS) to Modulate Lower Limb Corticomotor Excitability: Implications for Stimulation Parameter Selection and Experimental Design. Front. Neurosci. 2019, 13, 895. [Google Scholar] [CrossRef]
- Weise, D.; Schramm, A.; Stefan, K.; Wolters, A.; Reiners, K.; Naumann, M.; Classen, J. The two sides of associative plasticity in writer’s cramp. Brain 2006, 129, 2709–2721. [Google Scholar] [CrossRef]
- Morgante, F.; Espay, A.J.; Gunraj, C.; Lang, A.E.; Chen, R. Motor cortex plasticity in Parkinson’s disease and levodopa-induced dyskinesias. Brain 2006, 129, 1059–1069. [Google Scholar] [CrossRef]
- Lücke, C.; Heidegger, T.; Röhner, M.; Toennes, S.W.; Krivanekova, L.; Müller-Dahlhaus, F.; Ziemann, U. Deleterious Effects of a Low Amount of Ethanol on LTP-Like Plasticity in Human Cortex. Neuropsychopharmacology 2014, 39, 1508–1518. [Google Scholar] [CrossRef]
- Jung, P.; Ziemann, U. Homeostatic and Nonhomeostatic Modulation of Learning in Human Motor Cortex. J. Neurosci. 2009, 29, 5597–5604. [Google Scholar] [CrossRef]
- Oldfield, R.C. The assessment and analysis of handedness: The Edinburgh inventory. Neuropsychologia 1971, 9, 97–113. [Google Scholar] [CrossRef]
- Weise, D.; Schramm, A.; Beck, M.; Reiners, K.; Classen, J. Loss of topographic specificity of LTD-like plasticity is a trait marker in focal dystonia. Neurobiol. Dis. 2011, 42, 171–176. [Google Scholar] [CrossRef]
- Kang, J.-S.; Terranova, C.; Hilker, R.; Quartarone, A.; Ziemann, U. Deficient homeostatic regulation of practice-dependent plasticity in writer’s cramp. Cereb. Cortex 2011, 21, 1203–1212. [Google Scholar] [CrossRef] [PubMed]
- Kaneko, N.; Wada, M.; Nakajima, S.; Takano, M.; Taniguchi, K.; Honda, S.; Mimura, M.; Noda, Y. Neuroplasticity of the left dorsolateral prefrontal cortex in patients with treatment-resistant depression as indexed with paired associative stimulation: A TMS–EEG study. Cereb. Cortex 2024, 34, bhad515. [Google Scholar] [CrossRef] [PubMed]
- Müller, J.F.M.; Orekhov, Y.; Liu, Y.; Ziemann, U. Homeostatic plasticity in human motor cortex demonstrated by two consecutive sessions of paired associative stimulation. Eur. J. Neurosci. 2007, 25, 3461–3468. [Google Scholar] [CrossRef]
- Ngezahayo, A.; Schachner, M.; Artola, A. Synaptic Activity Modulates the Induction of Bidirectional Synaptic Changes in Adult Mouse Hippocampus. J. Neurosci. 2000, 20, 2451–2458. [Google Scholar] [CrossRef]
- López-Alonso, V.; Cheeran, B.; Río-Rodríguez, D.; Fernández-Del-Olmo, M. Inter-individual Variability in Response to Non-invasive Brain Stimulation Paradigms. Brain Stimul. 2014, 7, 372–380. [Google Scholar] [CrossRef]
- Elahi, B.; Hutchison, W.D.; Daskalakis, Z.J.; Gunraj, C.; Chen, R. Dose-response curve of associative plasticity in human motor cortex and interactions with motor practice. J. Neurophysiol. 2014, 111, 594–601. [Google Scholar] [CrossRef]
- Di Lazzaro, V.; Oliviero, A.; Profice, P.; Saturno, E.; Pilato, F.; Insola, A.; Mazzone, P.; Tonali, P.; Rothwell, J. Comparison of descending volleys evoked by transcranial magnetic and electric stimulation in conscious humans. Electroencephalogr. Clin. Neurophysiol. Mot. Control. 1998, 109, 397–401. [Google Scholar] [CrossRef]
- Cash, R.; Jegatheeswaran, G.; Ni, Z.; Chen, R. Modulation of the Direction and Magnitude of Hebbian Plasticity in Human Motor Cortex by Stimulus Intensity and Concurrent Inhibition. Brain Stimul. 2017, 10, 83–90. [Google Scholar] [CrossRef]
- Minkova, L.; Peter, J.; Abdulkadir, A.; Schumacher, L.V.; Kaller, C.P.; Nissen, C.; Klöppel, S.; Lahr, J. Determinants of Inter-Individual Variability in Corticomotor Excitability Induced by Paired Associative Stimulation. Front. Neurosci. 2019, 13, 841. [Google Scholar] [CrossRef]
- Sale, M.V.; Ridding, M.C.; Nordstrom, M.A. Factors influencing the magnitude and reproducibility of corticomotor excitability changes induced by paired associative stimulation. Exp. Brain Res. 2007, 181, 615–626. [Google Scholar] [CrossRef]
- Fratello, F.; Veniero, D.; Curcio, G.; Ferrara, M.; Marzano, C.; Moroni, F.; Pellicciari, M.; Bertini, M.; Rossini, P.; Degennaro, L. Modulation of corticospinal excitability by paired associative stimulation: Reproducibility of effects and intraindividual reliability. Clin. Neurophysiol. 2006, 117, 2667–2674. [Google Scholar] [CrossRef] [PubMed]
Disclaimer/Publisher’s Note: The statements, opinions and data contained in all publications are solely those of the individual author(s) and contributor(s) and not of MDPI and/or the editor(s). MDPI and/or the editor(s) disclaim responsibility for any injury to people or property resulting from any ideas, methods, instructions or products referred to in the content. |
© 2025 by the authors. Licensee MDPI, Basel, Switzerland. This article is an open access article distributed under the terms and conditions of the Creative Commons Attribution (CC BY) license (https://creativecommons.org/licenses/by/4.0/).