Thiamine Deficiency Causes Long-Lasting Neurobehavioral Deficits in Mice


Abstract
1. Introduction
2. Materials and Methods
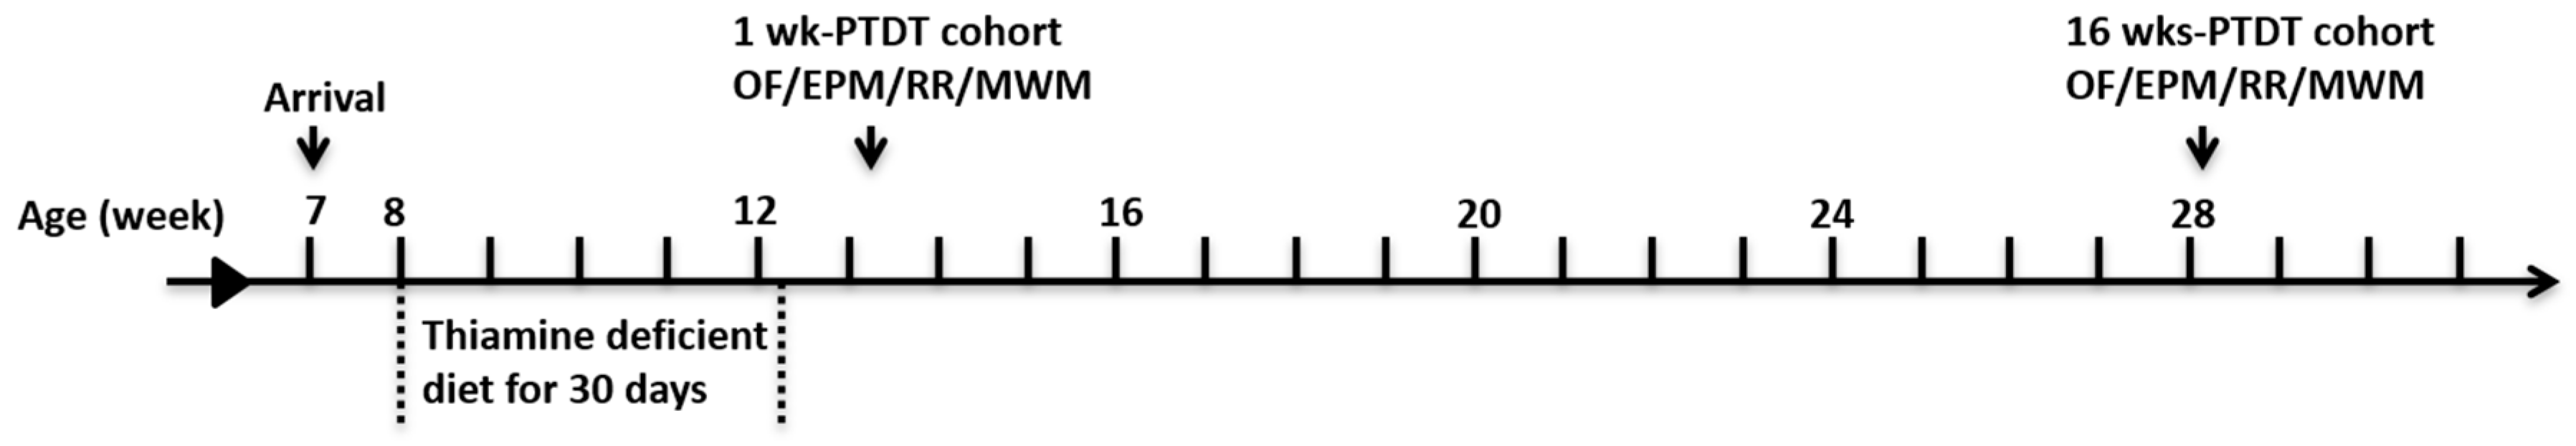
2.1. Models of Thiamine Deficiency
2.2. Open Field Test
2.3. Rotor Rod Test
2.4. Elevated Plus Maze
2.5. Morris Water Maze
2.6. Statistical Analysis
3. Results
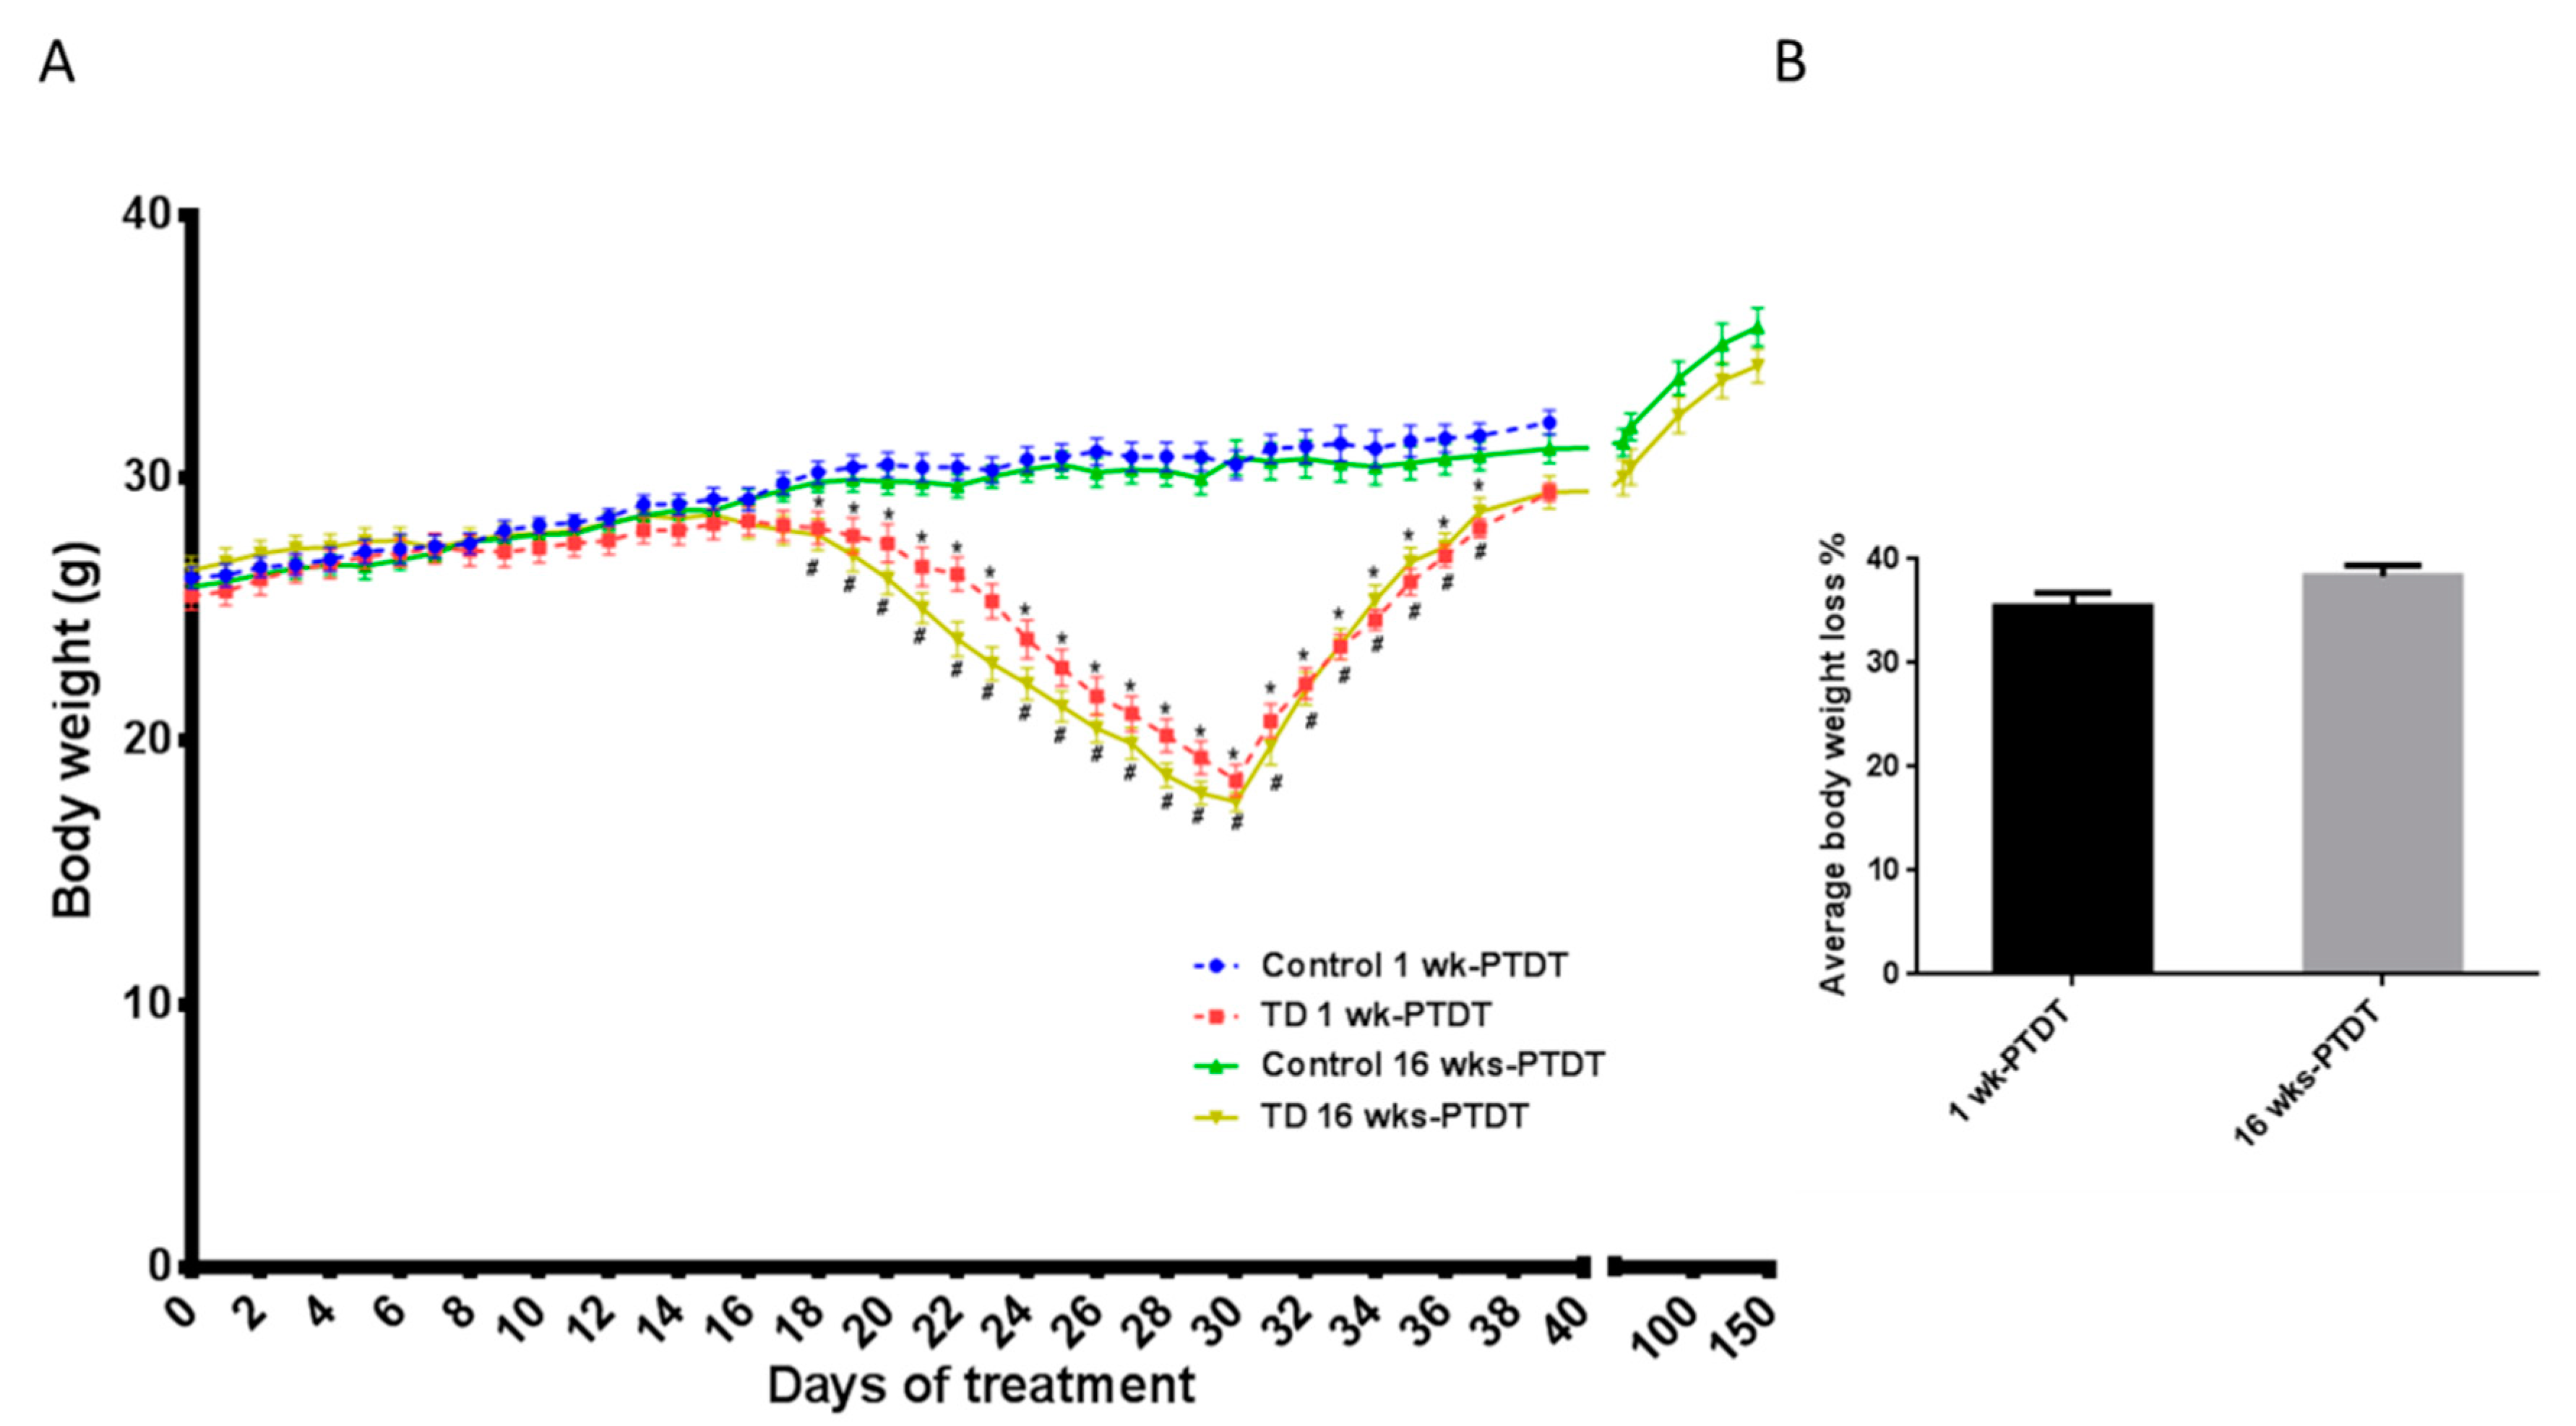
3.1. Body Weight
3.2. Open Field Test
3.3. Elevated Plus Maze Test
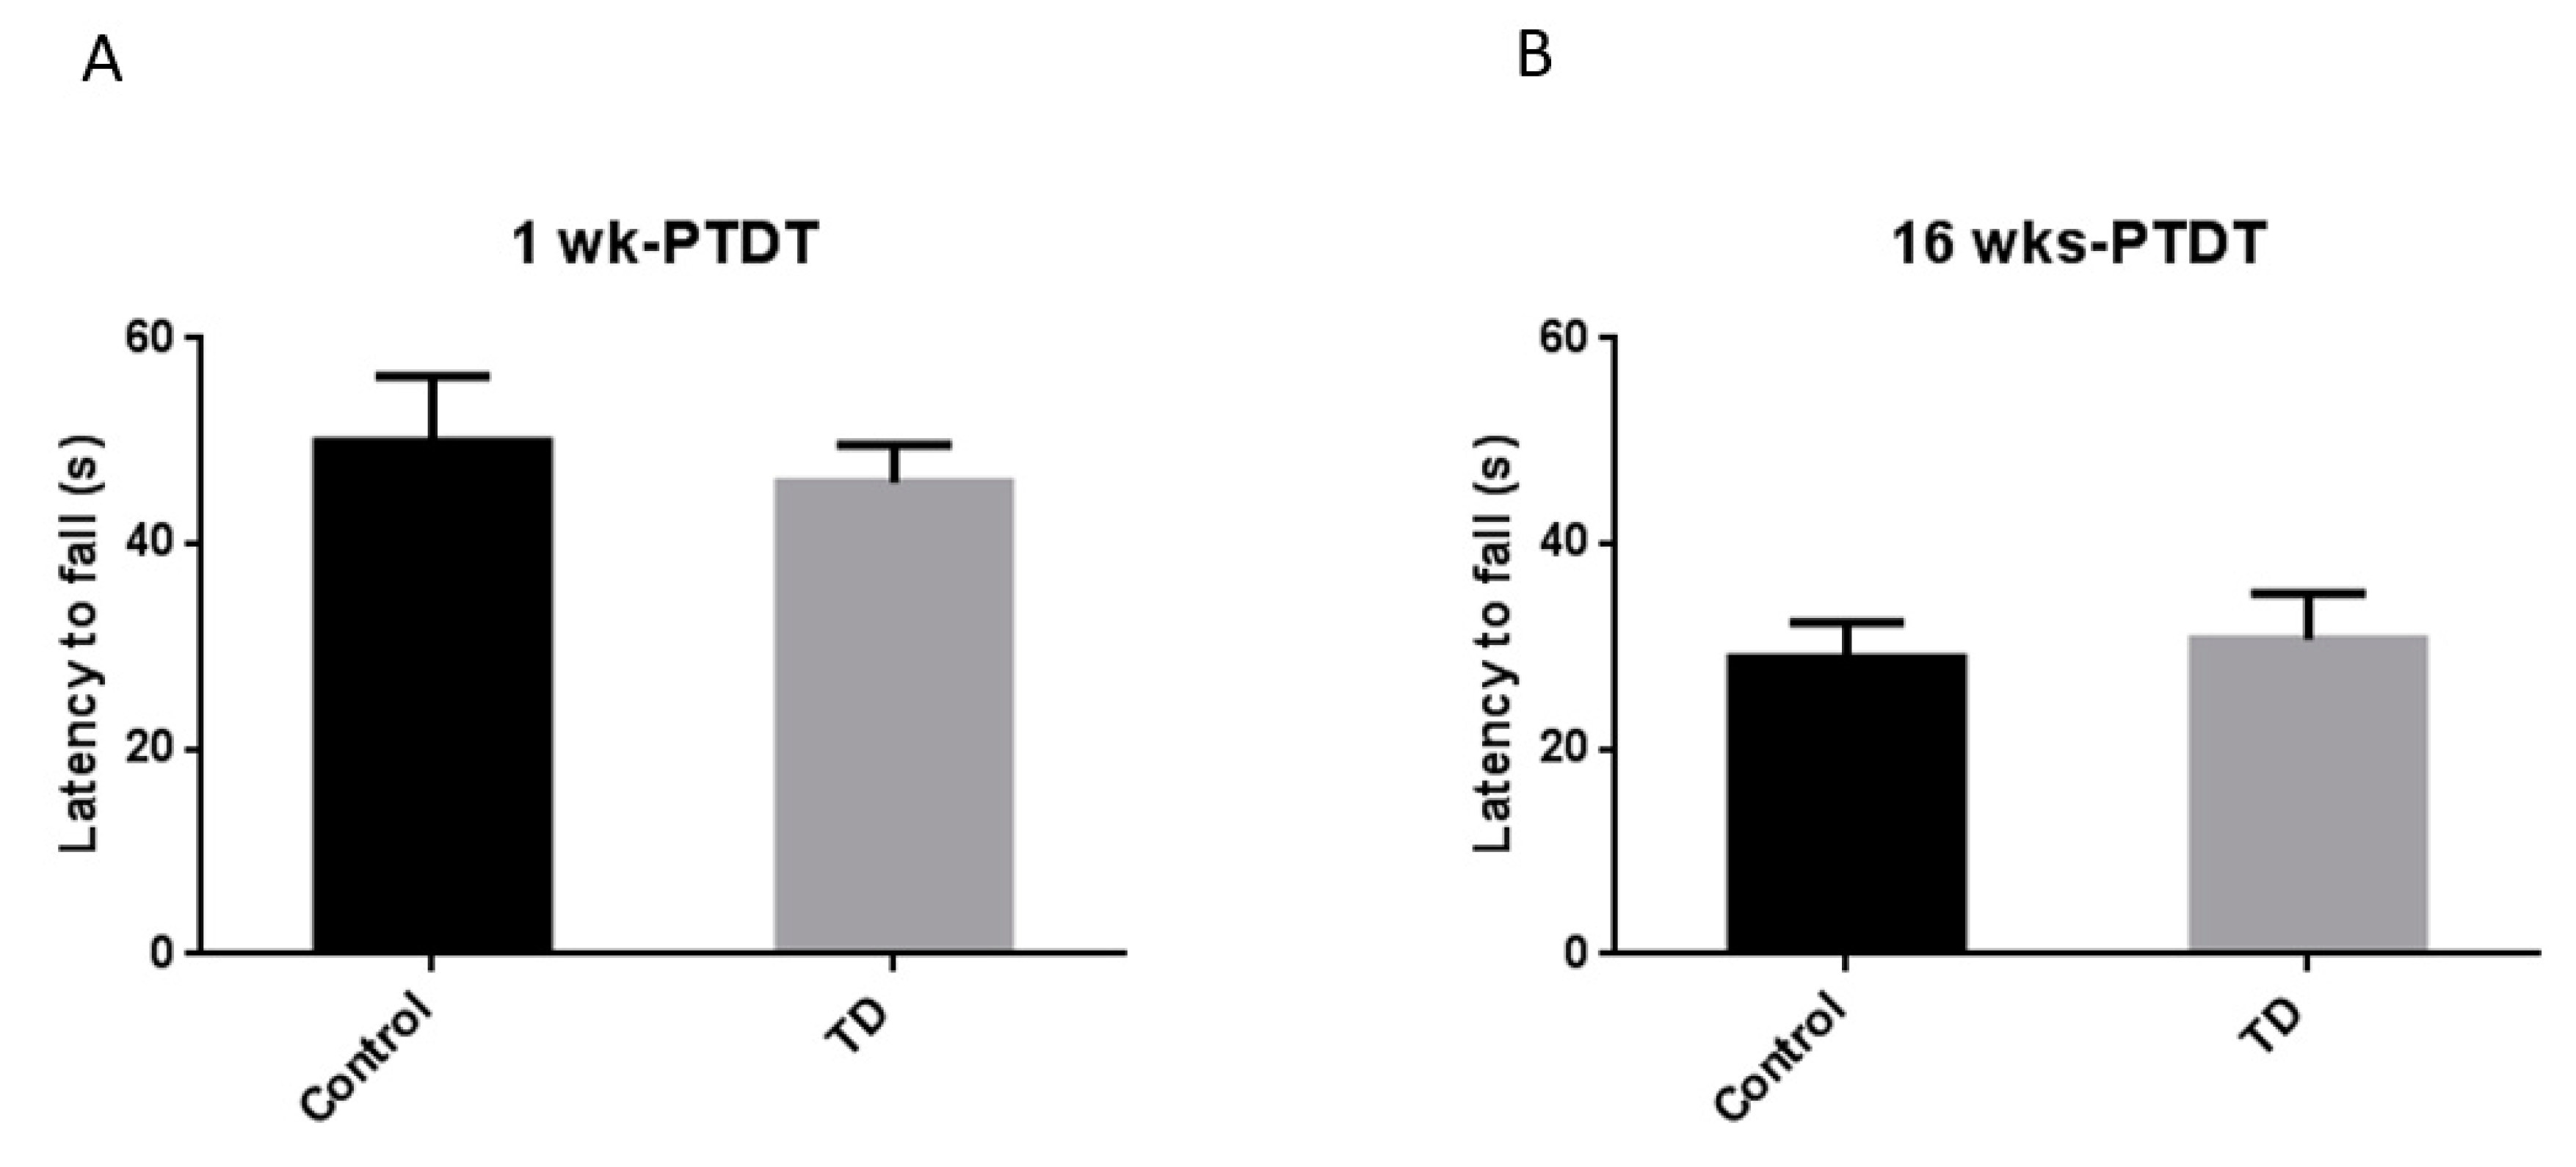
3.4. Rotor Rod Test
3.5. Morris Water Maze
4. Discussion
Author Contributions
Funding
Acknowledgments
Conflicts of Interest
Ethical Approval
References
- Vimokesant, S.L.; Hilker, D.M.; Nakornchai, S.; Rungruangsak, K.; Dhanamitta, S. Effects of betel nut and fermented fish on the thiamin status of northeastern Thais. Am. J. Clin. Nutr. 1975, 28, 1458–1463. [Google Scholar] [CrossRef] [PubMed]
- Boniol, S.; Boyd, M.; Koreth, R.; Burton, G.V. Wernicke encephalopathy complicating lymphoma therapy: Case report and literature review. South. Med. J. 2007, 100, 717–720. [Google Scholar] [CrossRef] [PubMed]
- Hiffler, L.; Rakotoambinina, B.; Lafferty, N.; Martinez Garcia, D. Thiamine deficiency in tropical pediatrics: New insights into a neglected but vital metabolic challenge. Front. Nutr. 2016, 3, 16. [Google Scholar] [CrossRef] [PubMed]
- Ahmed, M.; Azizi-Namini, P.; Yan, A.T.; Keith, M. Thiamin deficiency and heart failure: The current knowledge and gaps in literature. Heart Fail. Rev. 2015, 20, 1–11. [Google Scholar] [CrossRef]
- Koike, H.; Watanabe, H.; Inukai, A.; Iijima, M.; Mori, K.; Hattori, N.; Sobue, G. Myopathy in thiamine deficiency: Analysis of a case. J. Neurol. Sci. 2006, 249, 175–179. [Google Scholar] [CrossRef]
- Francini--Pesenti, F.; Brocadello, F.; Famengo, S.; Nardi, M.; Caregaro, L. Wernicke’s encephalopathy during parenteral nutrition. J. Parenter. Enter. Nutr. 2007, 31, 69–71. [Google Scholar] [CrossRef]
- Nardone, R.; Höller, Y.; Storti, M.; Christova, M.; Tezzon, F.; Golaszewski, S.; Trinka, E.; Brigo, F. Thiamine deficiency induced neurochemical, neuroanatomical, and neuropsychological alterations: A reappraisal. Sci. World J. 2013, 2013, 309143. [Google Scholar] [CrossRef]
- Vernau, K.; Napoli, E.; Wong, S.; Ross-Inta, C.; Cameron, J.; Bannasch, D.; Bollen, A.; Dickinson, P.; Giulivi, C. Thiamine Deficiency-Mediated Brain Mitochondrial Pathology in A laskan H uskies with Mutation in SLC19A3. 1. Brain Pathol. 2015, 25, 441–453. [Google Scholar] [CrossRef]
- Gibson, G.E.; Zhang, H. Abnormalities in oxidative processes in non-neuronal tissues from patients with Alzheimer’s disease. J. Alzheimer’s Dis. 2001, 3, 329–338. [Google Scholar] [CrossRef]
- Schwab, C.; Steele, J.C.; McGeer, P.L. Neurofibrillary tangles of Guam parkinson-dementia are associated with reactive microglia and complement proteins. Brain Res. 1996, 707, 196–205. [Google Scholar] [CrossRef]
- Ke, Z.-J.; Gibson, G.E. Selective response of various brain cell types during neurodegeneration induced by mild impairment of oxidative metabolism. Neurochem. Int. 2004, 45, 361–369. [Google Scholar] [CrossRef] [PubMed]
- Zhang, G.; Ding, H.; Chen, H.; Ye, X.; Li, H.; Lin, X.; Ke, Z. Thiamine nutritional status and depressive symptoms are inversely associated among older Chinese adults. J. Nutr. 2013, 143, 53–58. [Google Scholar] [CrossRef] [PubMed]
- McRee, R.C.; Terry-Ferguson, M.; Langlais, P.J.; Chen, Y.; Nalwalk, J.W.; Blumenstock, F.A.; Hough, L.B. Increased histamine release and granulocytes within the thalamus of a rat model of Wernicke’s encephalopathy. Brain Res. 2000, 858, 227–236. [Google Scholar] [CrossRef]
- Roland, J.J.; Savage, L.M. Blocking GABA-A receptors in the medial septum enhances hippocampal acetylcholine release and behavior in a rat model of diencephalic amnesia. Pharmacol. Biochem. Behav. 2009, 92, 480–487. [Google Scholar] [CrossRef] [PubMed][Green Version]
- Langlais, P.J.; Savage, L.M. Thiamine deficiency in rats produces cognitive and memory deficits on spatial tasks that correlate with tissue loss in diencephalon, cortex and white matter. Behav. Brain Res. 1995, 68, 75–89. [Google Scholar] [CrossRef]
- Hakim, A. The induction and reversibility of cerebral acidosis in thiamine deficiency. Ann. Neurol. Off. J. Am. Neurol. Assoc. Child Neurol. Soc. 1984, 16, 673–679. [Google Scholar] [CrossRef]
- Flint, R.W., Jr.; Hill, J.E.; Sandusky, L.A.; Marino, C.L. Use of the Pyrithiamine-Induced Thiamine Deficient Animal Model of Korsakoff’s Syndrome for Exploratory Research Activities in Undergraduate Physiological Psychology. J. Undergrad. Neurosci. Educ. 2007, 5, A35. [Google Scholar]
- Onodera, K. Abnormal behavior induced by thiamine deficiency in rats: Muricide and its behavioral and pharmacological characteristics. Nihon yakurigaku zasshi. Folia Pharmacol. Jpn. 1992, 100, 1–9. [Google Scholar] [CrossRef]
- Onodera, K.; Ogura, Y.; Kisara, K. Characteristics of muricide induced by thiamine deficiency and its suppression by antidepressants or intraventricular serotonin. Physiol. Behav. 1981, 27, 847–853. [Google Scholar] [CrossRef]
- Onodera, K.; Ogura, Y. Effects of histaminergic drugs on muricide induced by thiamine deficiency. Jpn. J. Pharmacol. 1984, 34, 15–21. [Google Scholar] [CrossRef]
- Nakagawasai, O.; Tadano, T.; Niijima, F.; Tan-No, K.; Kisara, K. Immunohistochemical estimation of rat brain somatostatin on avoidance learning impairment induced by thiamine deficiency. Brain Res. Bull. 2000, 51, 47–55. [Google Scholar] [CrossRef]
- Nakagawasai, O.; Tadano, T.; Hozumi, S.; Tan-No, K.; Niijima, F.; Kisara, K. Immunohistochemical estimation of brain choline acetyltransferase and somatostatin related to the impairment of avoidance learning induced by thiamine deficiency. Brain Res. Bull. 2000, 52, 189–196. [Google Scholar] [CrossRef]
- Bâ, A. Effects of thiamine deficiency on food intake and body weight increment in adult female and growing rats. Behav. Pharmacol. 2012, 23, 575–581. [Google Scholar] [CrossRef]
- Pawlik, F.; Bischoff, A.; Bitsch, I. Peripheral nerve changes in thiamine deficiency and starvation. Acta Neuropathol. 1977, 39, 211–218. [Google Scholar] [CrossRef]
- McLane, J.A.; Khan, T.; Held, I.R. Increased axonal transport in peripheral nerves of thiamine-deficient rats. Exp. Neurol. 1987, 95, 482–491. [Google Scholar] [CrossRef]
- Onodera, K.; Saito, T.; Itoh, M. Changes in blood pressure and heart rate following dietary-induced thiamine deficiency in muricide rats. Yakubutsu Seishin Kodo Jpn. J. Psychopharmacol. 1991, 11, 319–325. [Google Scholar]
- Liang, C. Bradycardia in thiamin deficiency and the role of glyoxylate. J. Nutr. Sci. Vitaminol. 1977, 23, 1–6. [Google Scholar] [CrossRef] [PubMed]
- Peskin, M.; Newton, G.; Brin, M. Thiamine deficiency, infantile manipulation and startle response in rats. J. Nutr. 1967, 91, 20–24. [Google Scholar] [CrossRef]
- Tadano, T.; Asao, T.; Aizawa, T.; Sakurada, S.; Abe, Y.; Yonezawa, A.; Ando, R.; Arai, Y.; Kinemuchi, H.; Kisara, K. Immunohistochemical determination of rat spinal cord substance P, and antinociceptive effect during development of thiamine deficiency. Brain Res. 1995, 696, 21–29. [Google Scholar] [CrossRef]
- Liu, M.; Alimov, A.P.; Wang, H.; Frank, J.A.; Katz, W.; Xu, M.; Ke, Z.J.; Luo, J. Thiamine deficiency induces anorexia by inhibiting hypothalamic AMPK. Neuroscience 2014, 267, 102–113. [Google Scholar] [CrossRef]
- Nakagawasai, O.; Tadano, T.; Hozumi, S.; Taniguchi, R.; Tan-No, K.; Esashi, A.; Niijima, F.; Kisara, K. Characteristics of depressive behavior induced by feeding thiamine-deficient diet in mice. Life Sci. 2001, 69, 1181–1191. [Google Scholar] [CrossRef]
- Dunn, T.B.; Morris, H.P.; Dubnik, C.S. Lesions of chronic thiamine deficiency in mice. J. Natl. Cancer Inst. 1947, 8, 139–155. [Google Scholar] [PubMed]
- Nakagawasai, O.; Yamadera, F.; Iwasaki, K.; Asao, T.; Tan-No, K.; Niijima, F.; Arai, H.; Tadano, T. Preventive effect of kami-untan-to on performance in the forced swimming test in thiamine-deficient mice: Relationship to functions of catecholaminergic neurons. Behav. Brain Res. 2007, 177, 315–321. [Google Scholar] [CrossRef] [PubMed]
- Nakagawasai, O.; Yamadera, F.; Iwasaki, K.; Arai, H.; Taniguchi, R.; Tan-No, K.; Sasaki, H.; Tadano, T. Effect of kami-untan-to on the impairment of learning and memory induced by thiamine-deficient feeding in mice. Neuroscience 2004, 125, 233–241. [Google Scholar] [CrossRef] [PubMed]
- Bennett, M.R.; Schwartz, W.J. Altered circadian rhythmicity is an early sign of murine dietary thiamine deficiency. J. Neurol. Sci. 1999, 163, 6–10. [Google Scholar] [CrossRef]
- Nakagawasai, O.; Tadano, T.; Tan-No, K.; Hozumi, S.; Taniguchi, R.; Niijima, F.; Asao, T.; Kinemuchi, H.; Arai, Y.; Yasuhara, H.; et al. Antinociceptive effect following dietary-induced thiamine deficiency in mice: Involvement of substance P and somatostatin. Life Sci. 2001, 69, 1155–1166. [Google Scholar] [CrossRef]
- Seibenhener, M.L.; Wooten, M.C. Use of the Open Field Maze to measure locomotor and anxiety-like behavior in mice. JoVE (J. Vis. Exp. ) 2015, e52434. [Google Scholar] [CrossRef]
- Inaba, H.; Kishimoto, T.; Oishi, S.; Nagata, K.; Hasegawa, S.; Watanabe, T.; Kida, S. Vitamin B1-deficient mice show impairment of hippocampus-dependent memory formation and loss of hippocampal neurons and dendritic spines: Potential microendophenotypes of Wernicke–Korsakoff syndrome. Biosci. Biotechnol. Biochem. 2016, 80, 2425–2436. [Google Scholar] [CrossRef]
- Walf, A.A.; Frye, C.A. The use of the elevated plus maze as an assay of anxiety-related behavior in rodents. Nat. Protoc. 2007, 2, 322. [Google Scholar] [CrossRef]
- Ramos, A. Animal models of anxiety: Do I need multiple tests? Trends Pharmacol. Sci. 2008, 29, 493–498. [Google Scholar] [CrossRef]
- Vorhees, C.V.; Williams, M.T. Morris water maze: Procedures for assessing spatial and related forms of learning and memory. Nat. Protoc. 2006, 1, 848. [Google Scholar] [CrossRef] [PubMed]
- Xu, W.; Hawkey, A.B.; Li, H.; Dai, L.; Brim, H.H.; Frank, J.A.; Luo, J.; Barron, S.; Chen, G. Neonatal ethanol exposure causes behavioral deficits in young mice. Alcoholism: Clinical and Experimental Research 2018, 42, 743–750. [Google Scholar] [CrossRef]
- Gould, T.D.; Dao, D.T.; Kovacsics, C.E. The Open Field Test, in Mood and Anxiety Related Phenotypes in Mice; Springer: Berlin/Heidelberg, Germany, 2009; pp. 1–20. [Google Scholar]
- Deacon, R.M. Measuring motor coordination in mice. JoVE (J. Vis. Exp.) 2013, e2609. [Google Scholar] [CrossRef] [PubMed]
- Norio, O.; Tsuneo, F.; Akito, H. Functional Limitations in Thiamine Deficiency Neuropathy: FIM Score Improvement With Treatment. J. Clin. Neuromuscul Dis. 2006, 7, 104–109. [Google Scholar] [CrossRef] [PubMed]
- Dhir, S.; Tarasenko, M.; Napoli, E.; Giulivi, C. Neurological, Psychiatric, and Biochemical Aspects of Thiamine Deficiency in Children and Adults. Front. Psychiatry 2019, 10, 207. [Google Scholar] [CrossRef] [PubMed]
- Dief, A.E.; Samy, D.M.; Dowedar, F.I. Impact of exercise and vitamin B1 intake on hippocampal brain-derived neurotrophic factor and spatial memory performance in a rat model of stress. J. Nutr. Sci. Vitaminol. 2015, 61, 1–7. [Google Scholar] [CrossRef]
- Medeiros, R.D.C.N.; Moraes, J.O.; Rodrigues, S.D.C.; Pereira, L.M.; da Silva Aguiar, H.Q.; de Cordova, C.A.S.; Júnior, A.Y.; de Cordova, F.M. Thiamine Deficiency Modulates p38 MAPK and Heme Oxygenase-1 in Mouse Brain: Association with Early Tissue and Behavioral Changes. Neurochem. Res. 2020, 45, 940–955. [Google Scholar] [CrossRef]
- de Cordova, F.M.; de Cordova, C.A.S.; Medeiros, R.D.C.N.; Moraes, J.O.; Rodrigues, S.D.C.; da Silva Aguiar, H.Q.; Pereira, L.M. Amprolium-induced thiamine deficiency in mice: Evaluation of a practical model by oral administration. Acta Vet. Bras. 2017, 11, 164–174. [Google Scholar] [CrossRef]
- Moraes, J.O.; Rodrigues, S.D.C.; Pereira, L.M.; Medeiros, R.D.C.N.; de Cordova, C.A.S.; de Cordova, F.M. Amprolium exposure alters mice behavior and metabolism in vivo. Anim. Model. Exp. Med. 2018, 1, 272–281. [Google Scholar] [CrossRef]
- Kulmala, J.P.; Korhonen, M.T.; Kuitunen, S.; Suominen, H.; Heinonen, A.; Mikkola, A.; Avela, J. Which muscles compromise human locomotor performance with age? J. R. Soc. Interface 2014, 11, 20140858. [Google Scholar] [CrossRef]
- Van Emmerik, R.E.; McDermott, W.J.; Haddad, J.M.; Van Wegen, E.E.H. Age-related changes in upper body adaptation to walking speed in human locomotion. Gait Posture 2005, 22, 233–239. [Google Scholar] [CrossRef] [PubMed]
- Moore, D.H., 2nd. A study of age group track and field records to relate age and running speed. Nature 1975, 253, 264–265. [Google Scholar] [CrossRef] [PubMed]
- Baker, A.B.; Tang, Y.Q. Aging performance for masters records in athletics, swimming, rowing, cycling, triathlon, and weightlifting. Exp. Aging Res. 2010, 36, 453–477. [Google Scholar] [CrossRef] [PubMed]
- Berthelot, G.; Len, S.; Hellard, P.; Tafflet, M.; Guillaume, M.; Vollmer, J.C.; Gager, B.; Quinquis, L.; Marc, A.; Toussaint, J.F. Exponential growth combined with exponential decline explains lifetime performance evolution in individual and human species. Age (Dordr) 2012, 34, 1001–1009. [Google Scholar] [CrossRef] [PubMed]
- O’Keeffe, S.T.; Tormey, W.P.; Glasgow, R.; Lavan, J.N. Thiamine deficiency in hospitalized elderly patients. Gerontology 1994, 40, 18–24. [Google Scholar] [CrossRef] [PubMed]
- Older, M.; Dickerson, J. Thiamine and the elderly orthopaedic patient. Age and ageing 1982, 11, 101–107. [Google Scholar] [CrossRef]
- O’Keeffe, S. Thiamine deficiency in elderly people. Age Ageing 2000, 29, 99–101. [Google Scholar] [CrossRef]
- Cornish, S.; Mehl-Madrona, L. The role of vitamins and minerals in psychiatry. Integr. Med. Insights 2008, 3, 33–42. [Google Scholar] [CrossRef]
- Nasution, A.H.; Lelo, A.; Effendy, E.; Wijaya, D.W. The Effect of Thiamine Administration on Catechol-O-Methyltransferase (COMT) Enzyme Level and Amsterdam Preoperative Anxiety and Information Scale (APAIS) Value in Patients with Preoperative Anxiety. J. Drug Alcohol. Res. 2019, 8, 1–6. [Google Scholar]
- Markova, N.; Bazhenova, N.; Anthony, D.C.; Vignisse, J.; Svistunov, A.; Lesch, K.P.; Bettendorff, L.; Strekalova, T. Thiamine and benfotiamine improve cognition and ameliorate GSK-3beta-associated stress-induced behaviours in mice. Prog. Neuropsychopharmacol. Biol. Psychiatry 2017, 75, 148–156. [Google Scholar] [CrossRef]
- Ikarashi, Y.; Iizuka, S.; Imamura, S.; Yamaguchi, T.; Sekiguchi, K.; Kanno, H.; Kawakami, Z.; Yuzurihara, M.; Kase, Y.; Takeda, S. Effects of yokukansan, a traditional Japanese medicine, on memory disturbance and behavioral and psychological symptoms of dementia in thiamine-deficient rats. Biol. Pharm. Bull. 2009, 32, 1701–1709. [Google Scholar] [CrossRef] [PubMed]
- Mitoma, H.; Manto, M.; Hampe, C.S. Time is Cerebellum; Springer: Berlin/Heidelberg, Germany, 2018. [Google Scholar]
- Kelly, P.J.; Stein, J.; Shafqat, S.; Eskey, C.; Doherty, D.; Chang, Y.; Kurina, A.; Furie, K.L. Functional recovery after rehabilitation for cerebellar stroke. Stroke 2001, 32, 530–534. [Google Scholar] [CrossRef] [PubMed]
- Konczak, J.; Schoch, B.; Dimitrova, A.; Gizewski, E.; Timmann, D. Functional recovery of children and adolescents after cerebellar tumour resection. Brain 2005, 128, 1428–1441. [Google Scholar] [CrossRef]
- Langlais, P.J.; Mandel, R.J.; Mair, R.G. Diencephalic lesions, learning impairments, and intact retrograde memory following acute thiamine deficiency in the rat. Behav. Brain Res. 1992, 48, 177–185. [Google Scholar] [CrossRef]
- Carvalho, F.M.; Pereira, S.R.; Pires, R.G.; Ferraz, V.P.; Romano-Silva, M.A.; Oliveira-Silva, I.F.; Ribeiro, A.M. Thiamine deficiency decreases glutamate uptake in the prefrontal cortex and impairs spatial memory performance in a water maze test. Pharmacol. Biochem. Behav. 2006, 83, 481–489. [Google Scholar] [CrossRef]
- Anderson, C.D.; Mair, R.G.; Langlais, P.J.; McEntee, W.J. Learning impairments after 6-OHDA treatment: A comparison with the effects of thiamine deficiency. Behav. Brain Res. 1986, 21, 21–27. [Google Scholar] [CrossRef]
- Mair, R.G.; Anderson, C.D.; Langlais, P.J.; McEntee, W.J. Thiamine deficiency depletes cortical norepinephrine and impairs learning processes in the rat. Brain Res. 1985, 360, 273–284. [Google Scholar] [CrossRef]
- Makino, M.; Takahashi-Ito, K.; Murasawa, H.; Pawlak, A.; Kashimoto, Y.; Kitano, Y. Memantine ameliorates learning and memory disturbance and the behavioral and psychological symptoms of dementia in thiamine-deficient mice. Pharmacol. Biochem. Behav. 2019, 183, 6–13. [Google Scholar] [CrossRef]
- Ciccia, R.M.; Langlais, P.J. An examination of the synergistic interaction of ethanol and thiamine deficiency in the development of neurological signs and long--term cognitive and memory impairments. Alcohol. Clin. Exp. Res. 2000, 24, 622–634. [Google Scholar] [CrossRef]
- Attias, J.; Raveh, E.; Aizer-Dannon, A.; Bloch-Mimouni, A.; Fattal-Valevski, A. Auditory system dysfunction due to infantile thiamine deficiency: Long-term auditory sequelae. Audiol. Neurotol. 2012, 17, 309–320. [Google Scholar] [CrossRef]
- Mimouni-Bloch, A.; Goldberg-Stern, H.; Strausberg, R.; Brezner, A.; Heyman, E.; Inbar, D.; Kivity, S.; Zvulunov, A.; Sztarkier, I.; Fogelman, R.; et al. Thiamine deficiency in infancy: Long-term follow-up. Pediatric Neurol. 2014, 51, 311–316. [Google Scholar] [CrossRef] [PubMed]
- Mair, R.G.; Anderson, C.D.; Langlais, P.J.; McEntee, W.J. Behavioral impairments, brain lesions and monoaminergic activity in the rat following recovery from a bout of thiamine deficiency. Behav. Brain Res. 1988, 27, 223–239. [Google Scholar] [CrossRef]


© 2020 by the authors. Licensee MDPI, Basel, Switzerland. This article is an open access article distributed under the terms and conditions of the Creative Commons Attribution (CC BY) license (http://creativecommons.org/licenses/by/4.0/).
Share and Cite
Li, H.; Xu, H.; Wen, W.; Wu, L.; Xu, M.; Luo, J. Thiamine Deficiency Causes Long-Lasting Neurobehavioral Deficits in Mice. Brain Sci. 2020, 10, 565. https://doi.org/10.3390/brainsci10080565
Li H, Xu H, Wen W, Wu L, Xu M, Luo J. Thiamine Deficiency Causes Long-Lasting Neurobehavioral Deficits in Mice. Brain Sciences. 2020; 10(8):565. https://doi.org/10.3390/brainsci10080565
Chicago/Turabian StyleLi, Hui, Hong Xu, Wen Wen, Liying Wu, Mei Xu, and Jia Luo. 2020. "Thiamine Deficiency Causes Long-Lasting Neurobehavioral Deficits in Mice" Brain Sciences 10, no. 8: 565. https://doi.org/10.3390/brainsci10080565
APA StyleLi, H., Xu, H., Wen, W., Wu, L., Xu, M., & Luo, J. (2020). Thiamine Deficiency Causes Long-Lasting Neurobehavioral Deficits in Mice. Brain Sciences, 10(8), 565. https://doi.org/10.3390/brainsci10080565