Methods for Sampling Biogas and Biomethane on Adsorbent Tubes after Collection in Gas Bags


Abstract
:1. Introduction
2. Materials and Methods
2.1. Analysis Method
2.2. Sampling Method
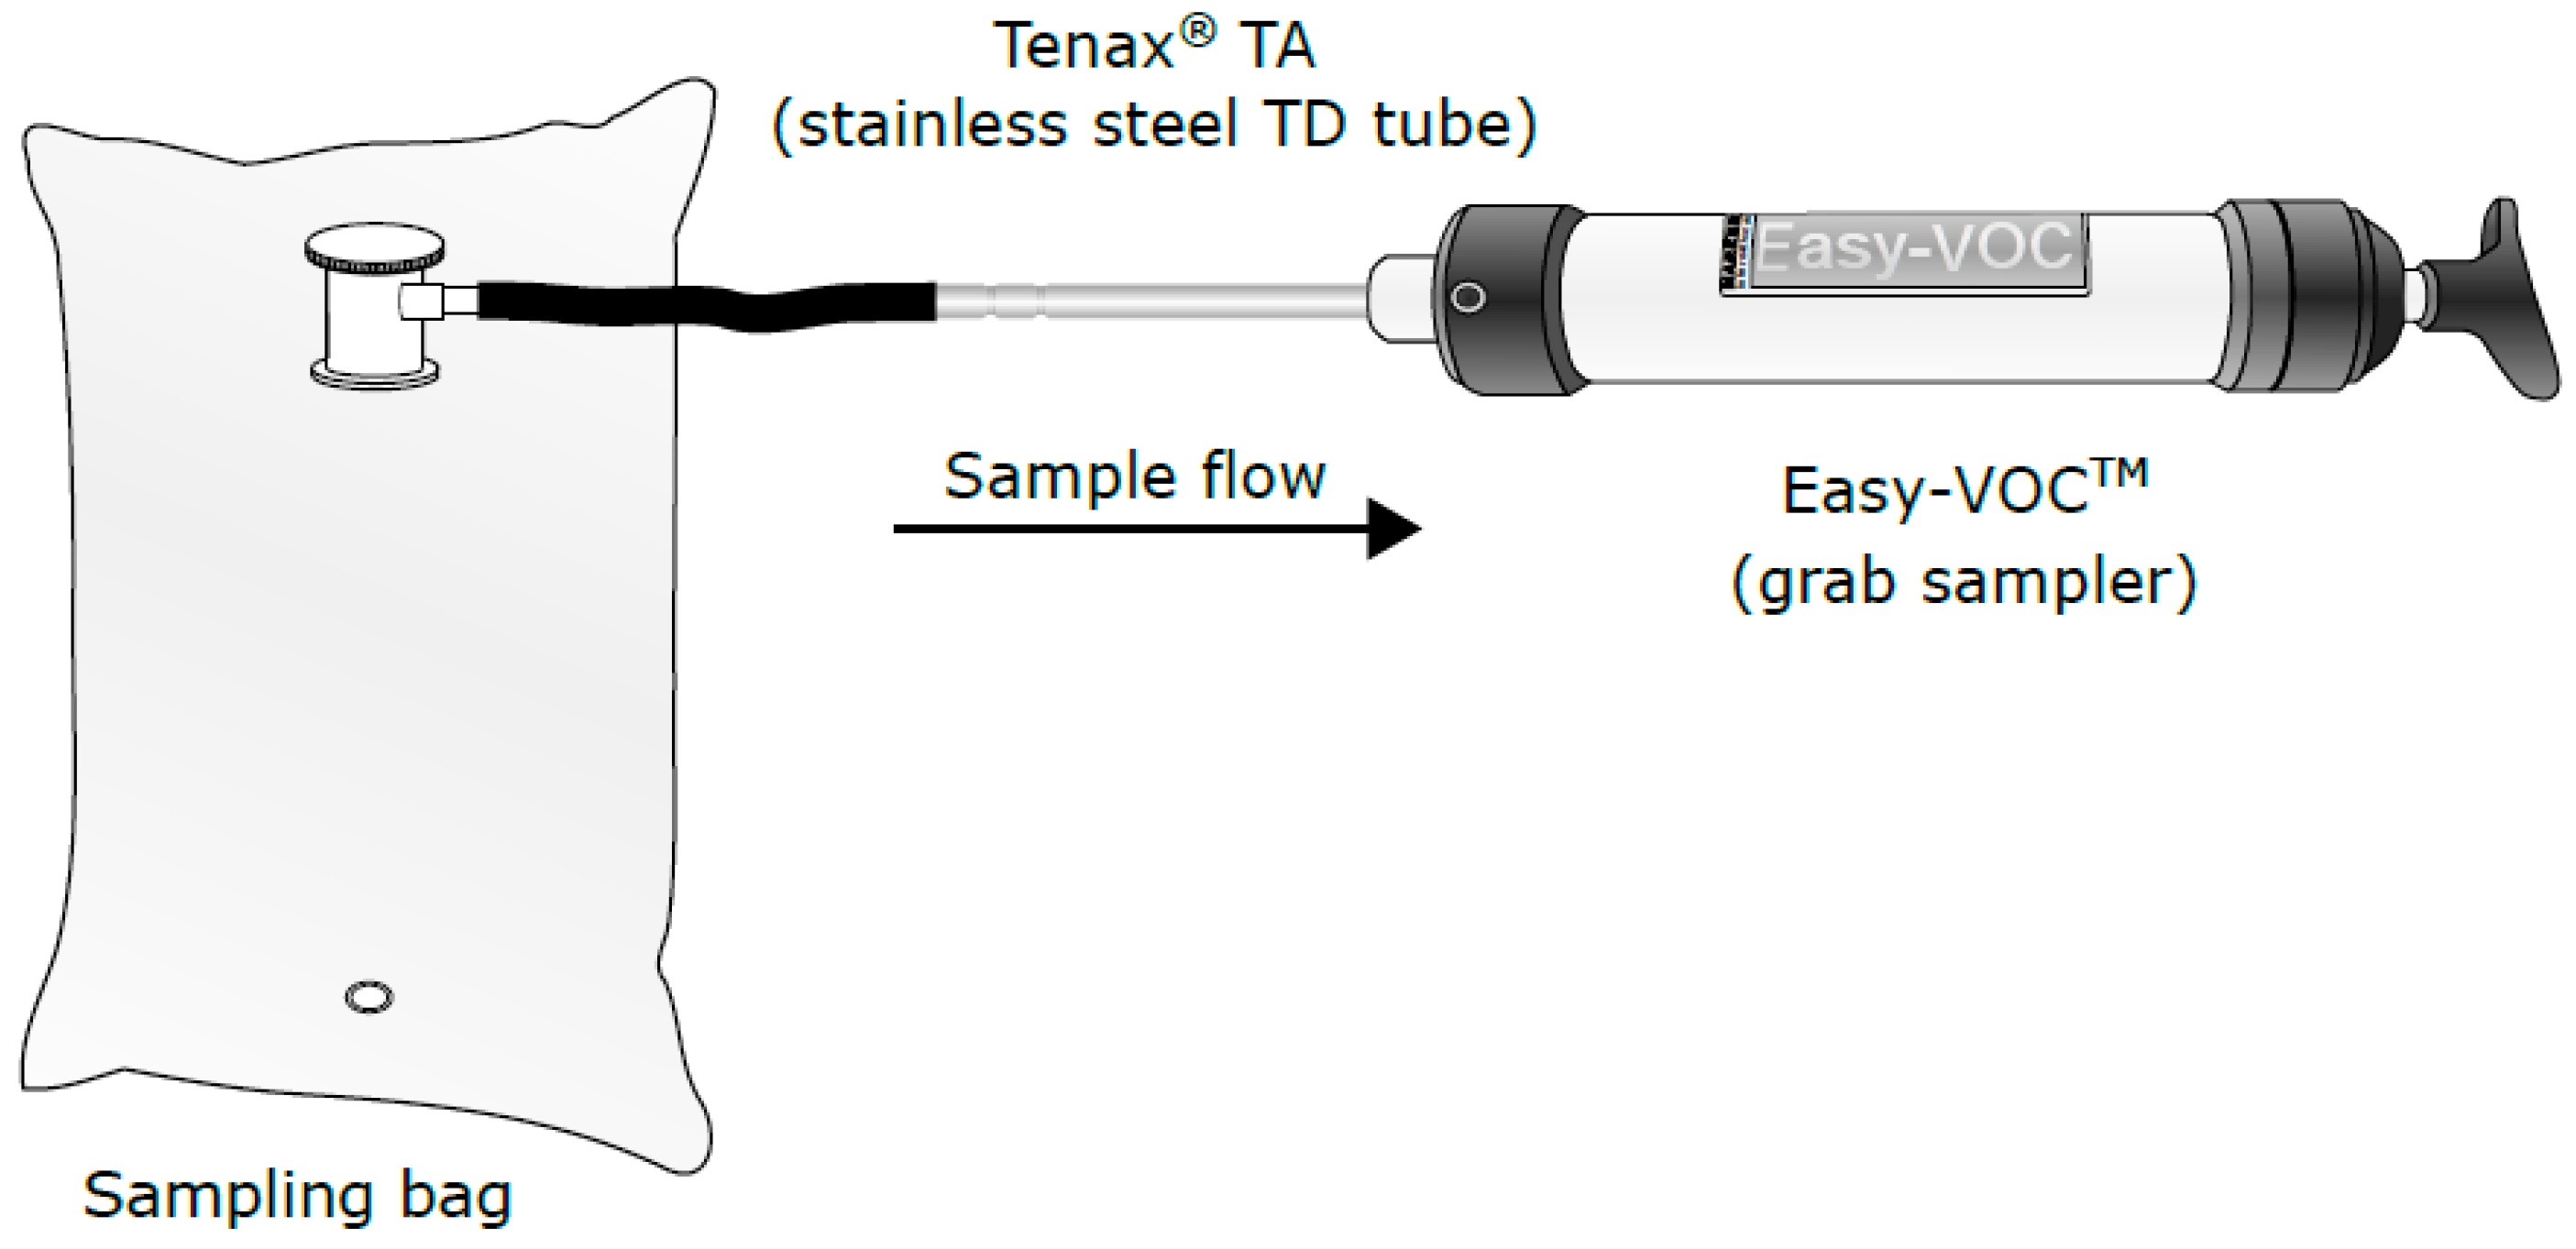
2.2.1. Method 1
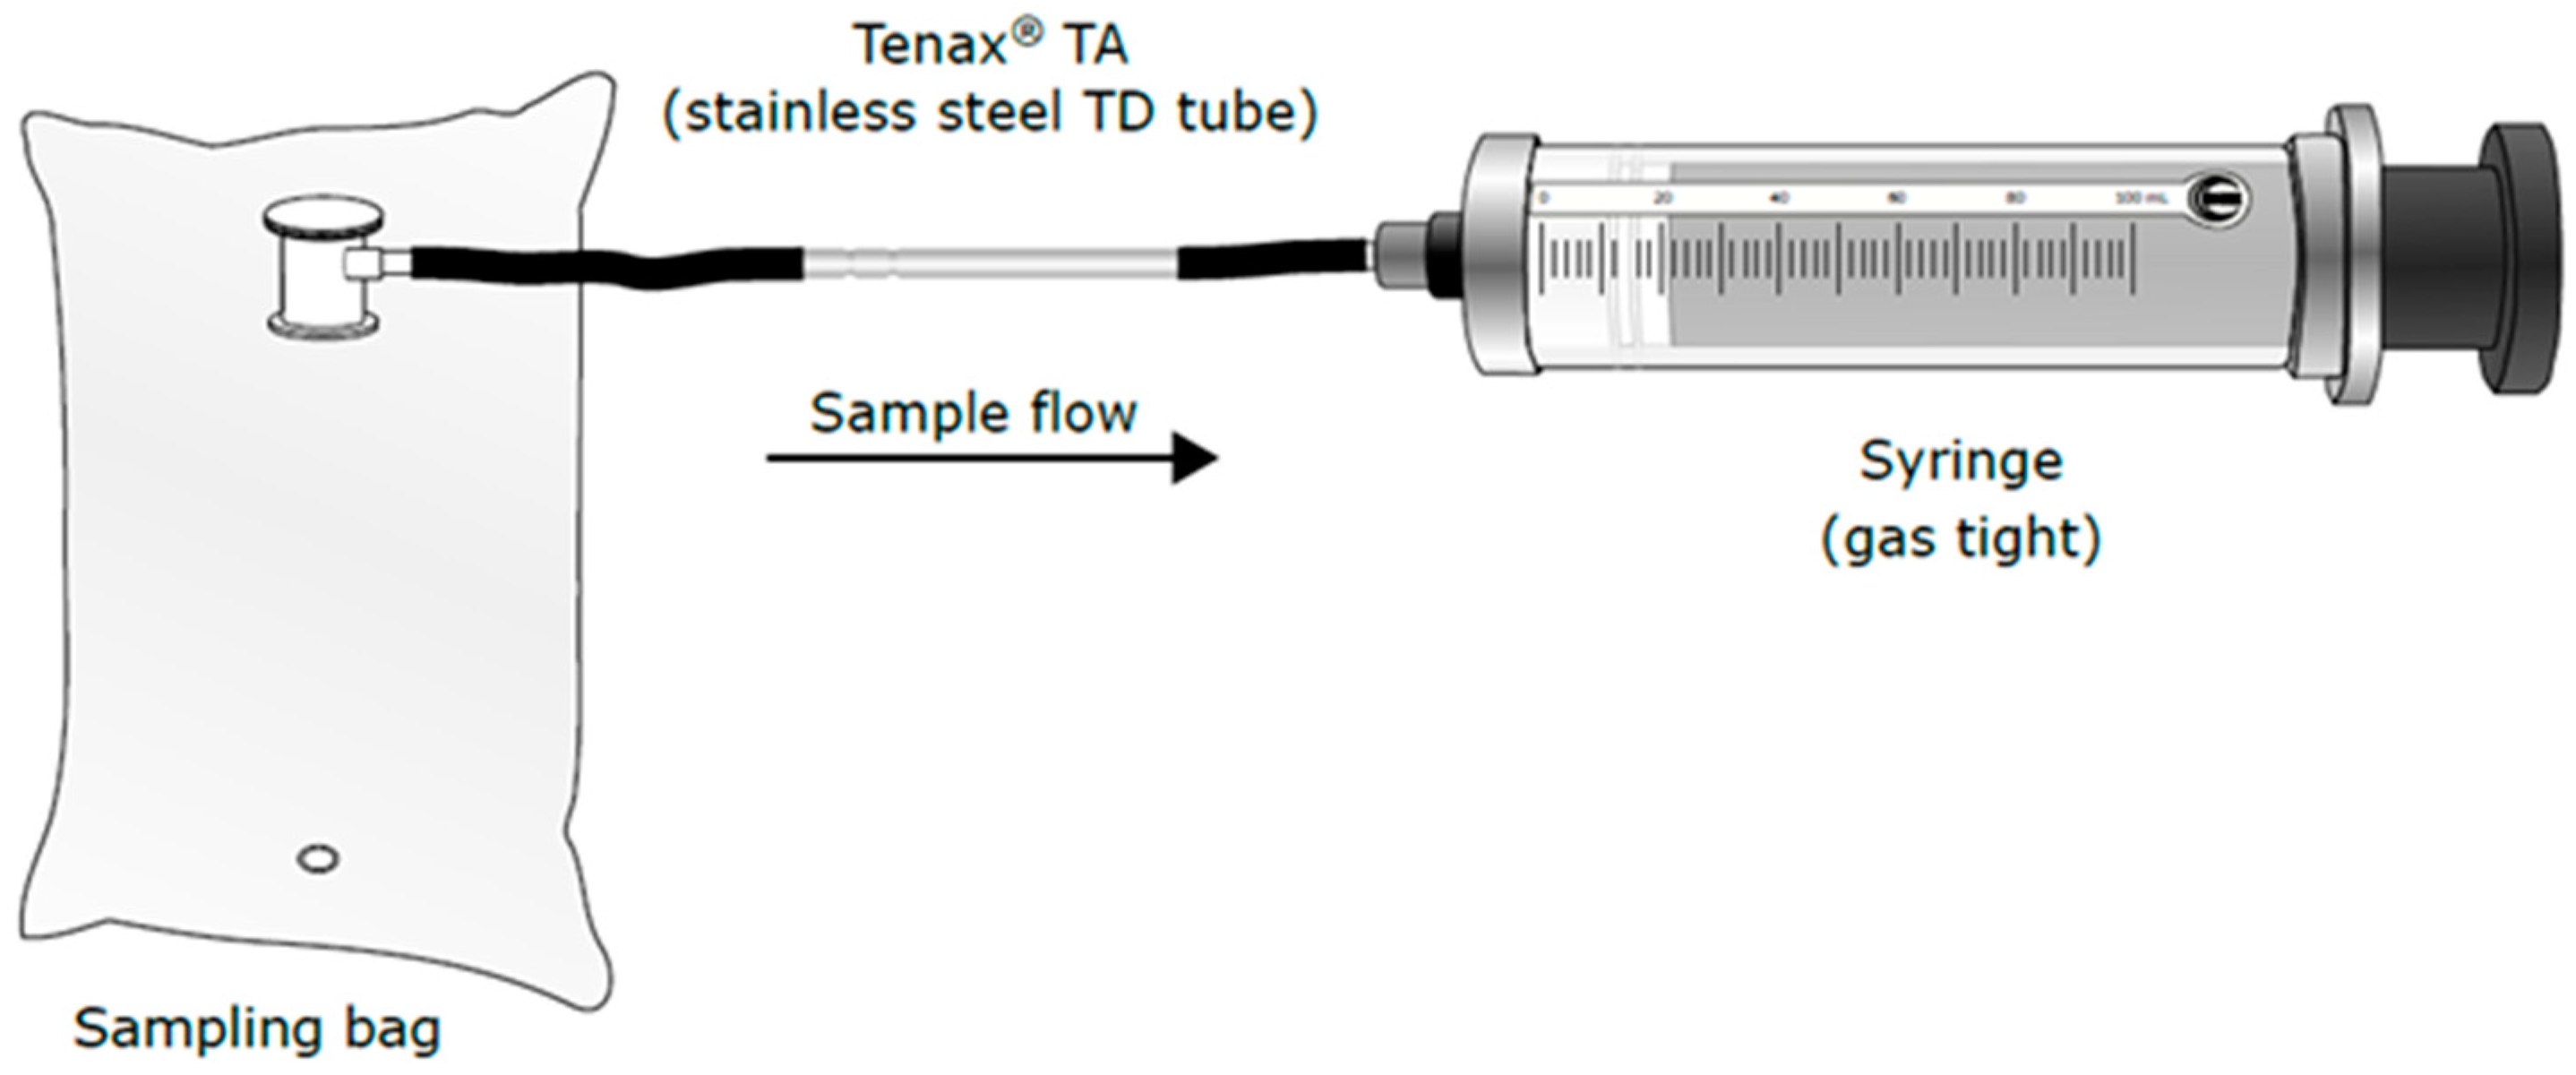
2.2.2. Method 2
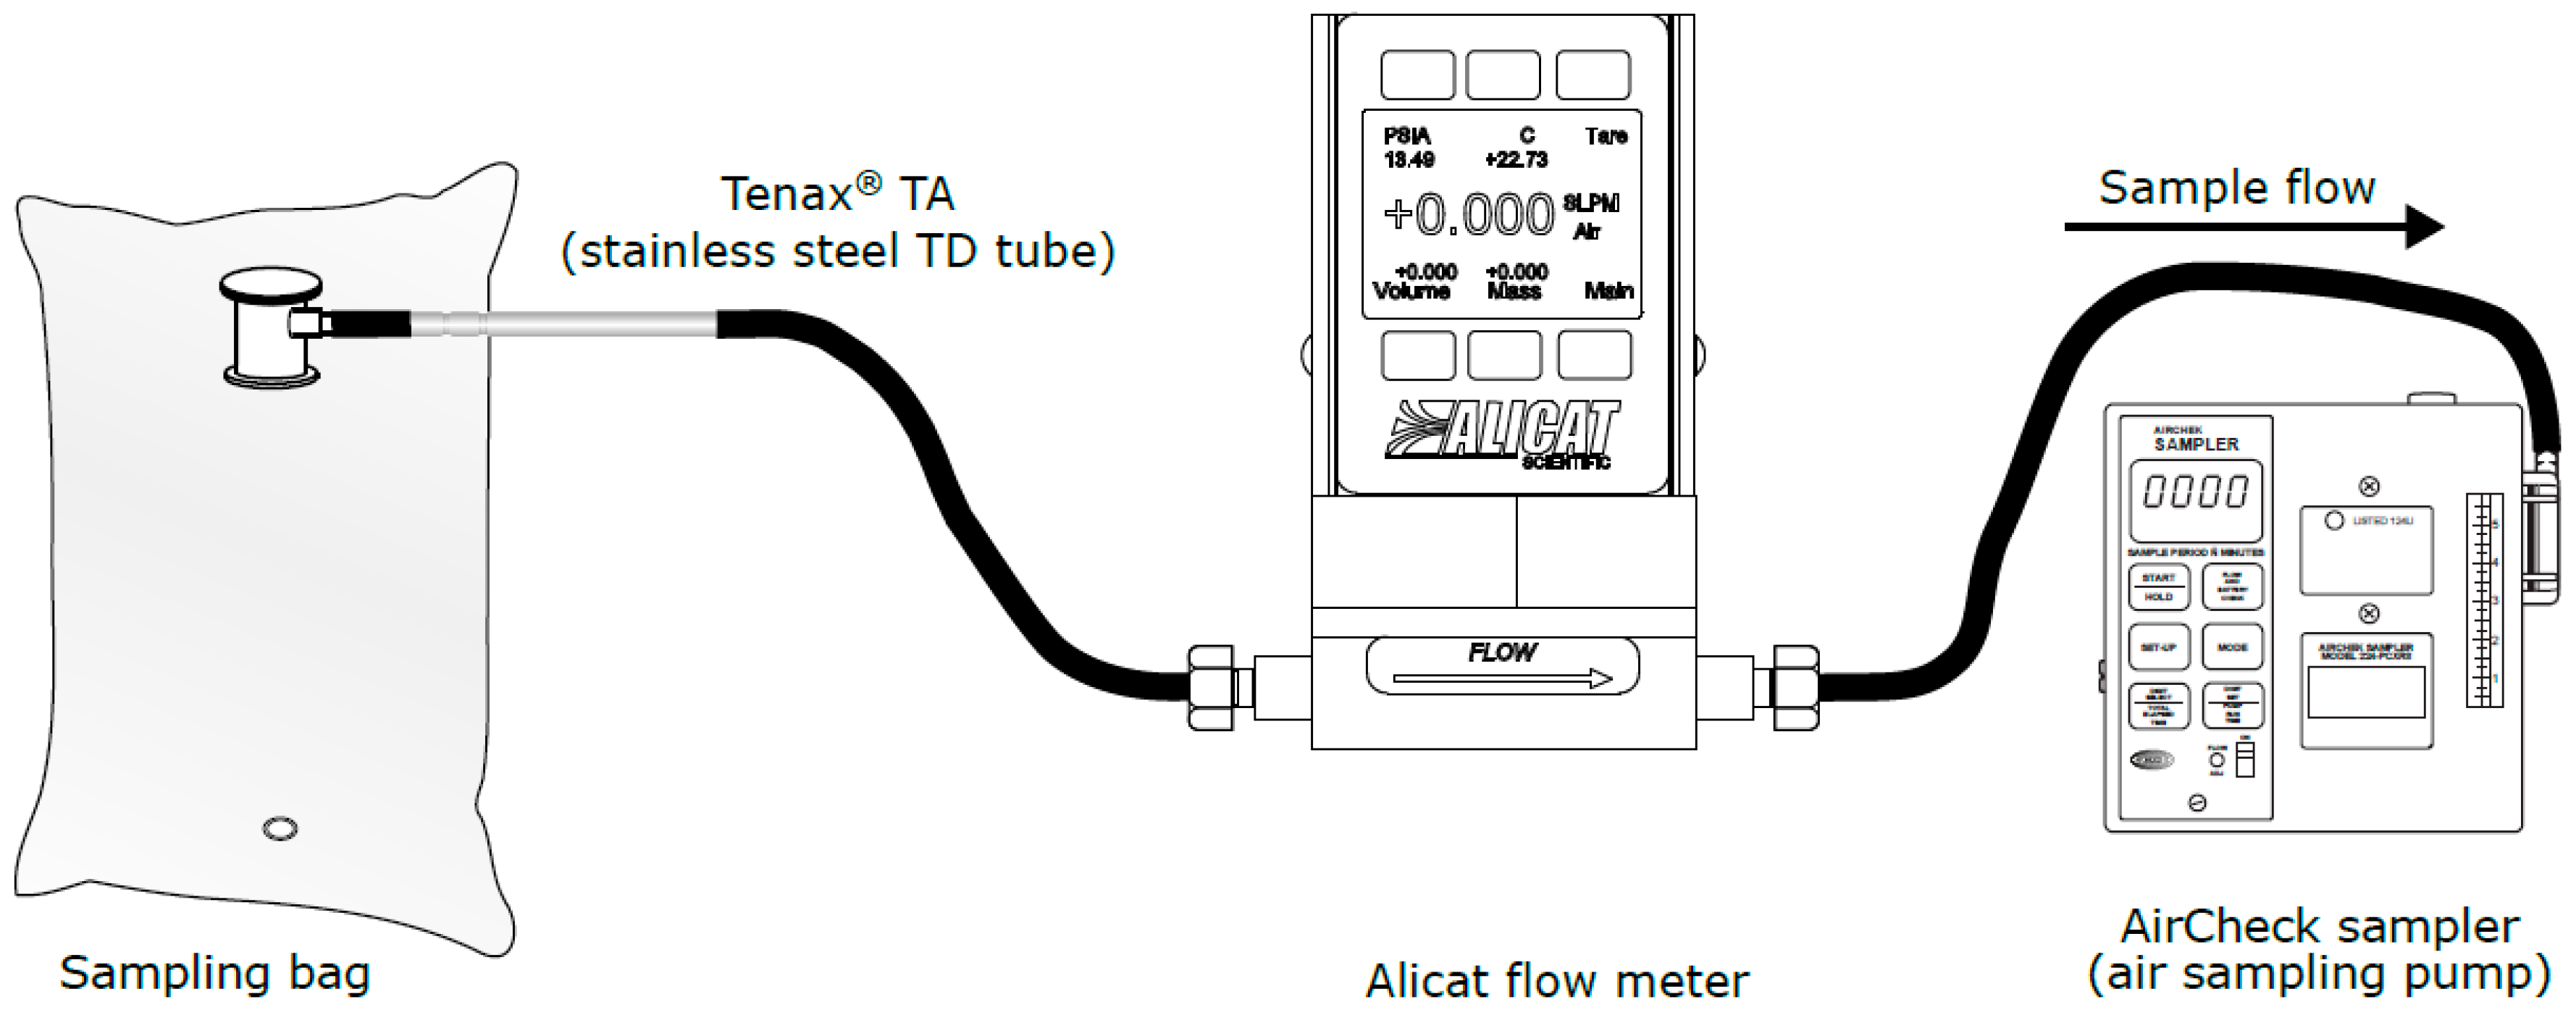
2.2.3. Method 3
3. Biogas and Biomethane Samples
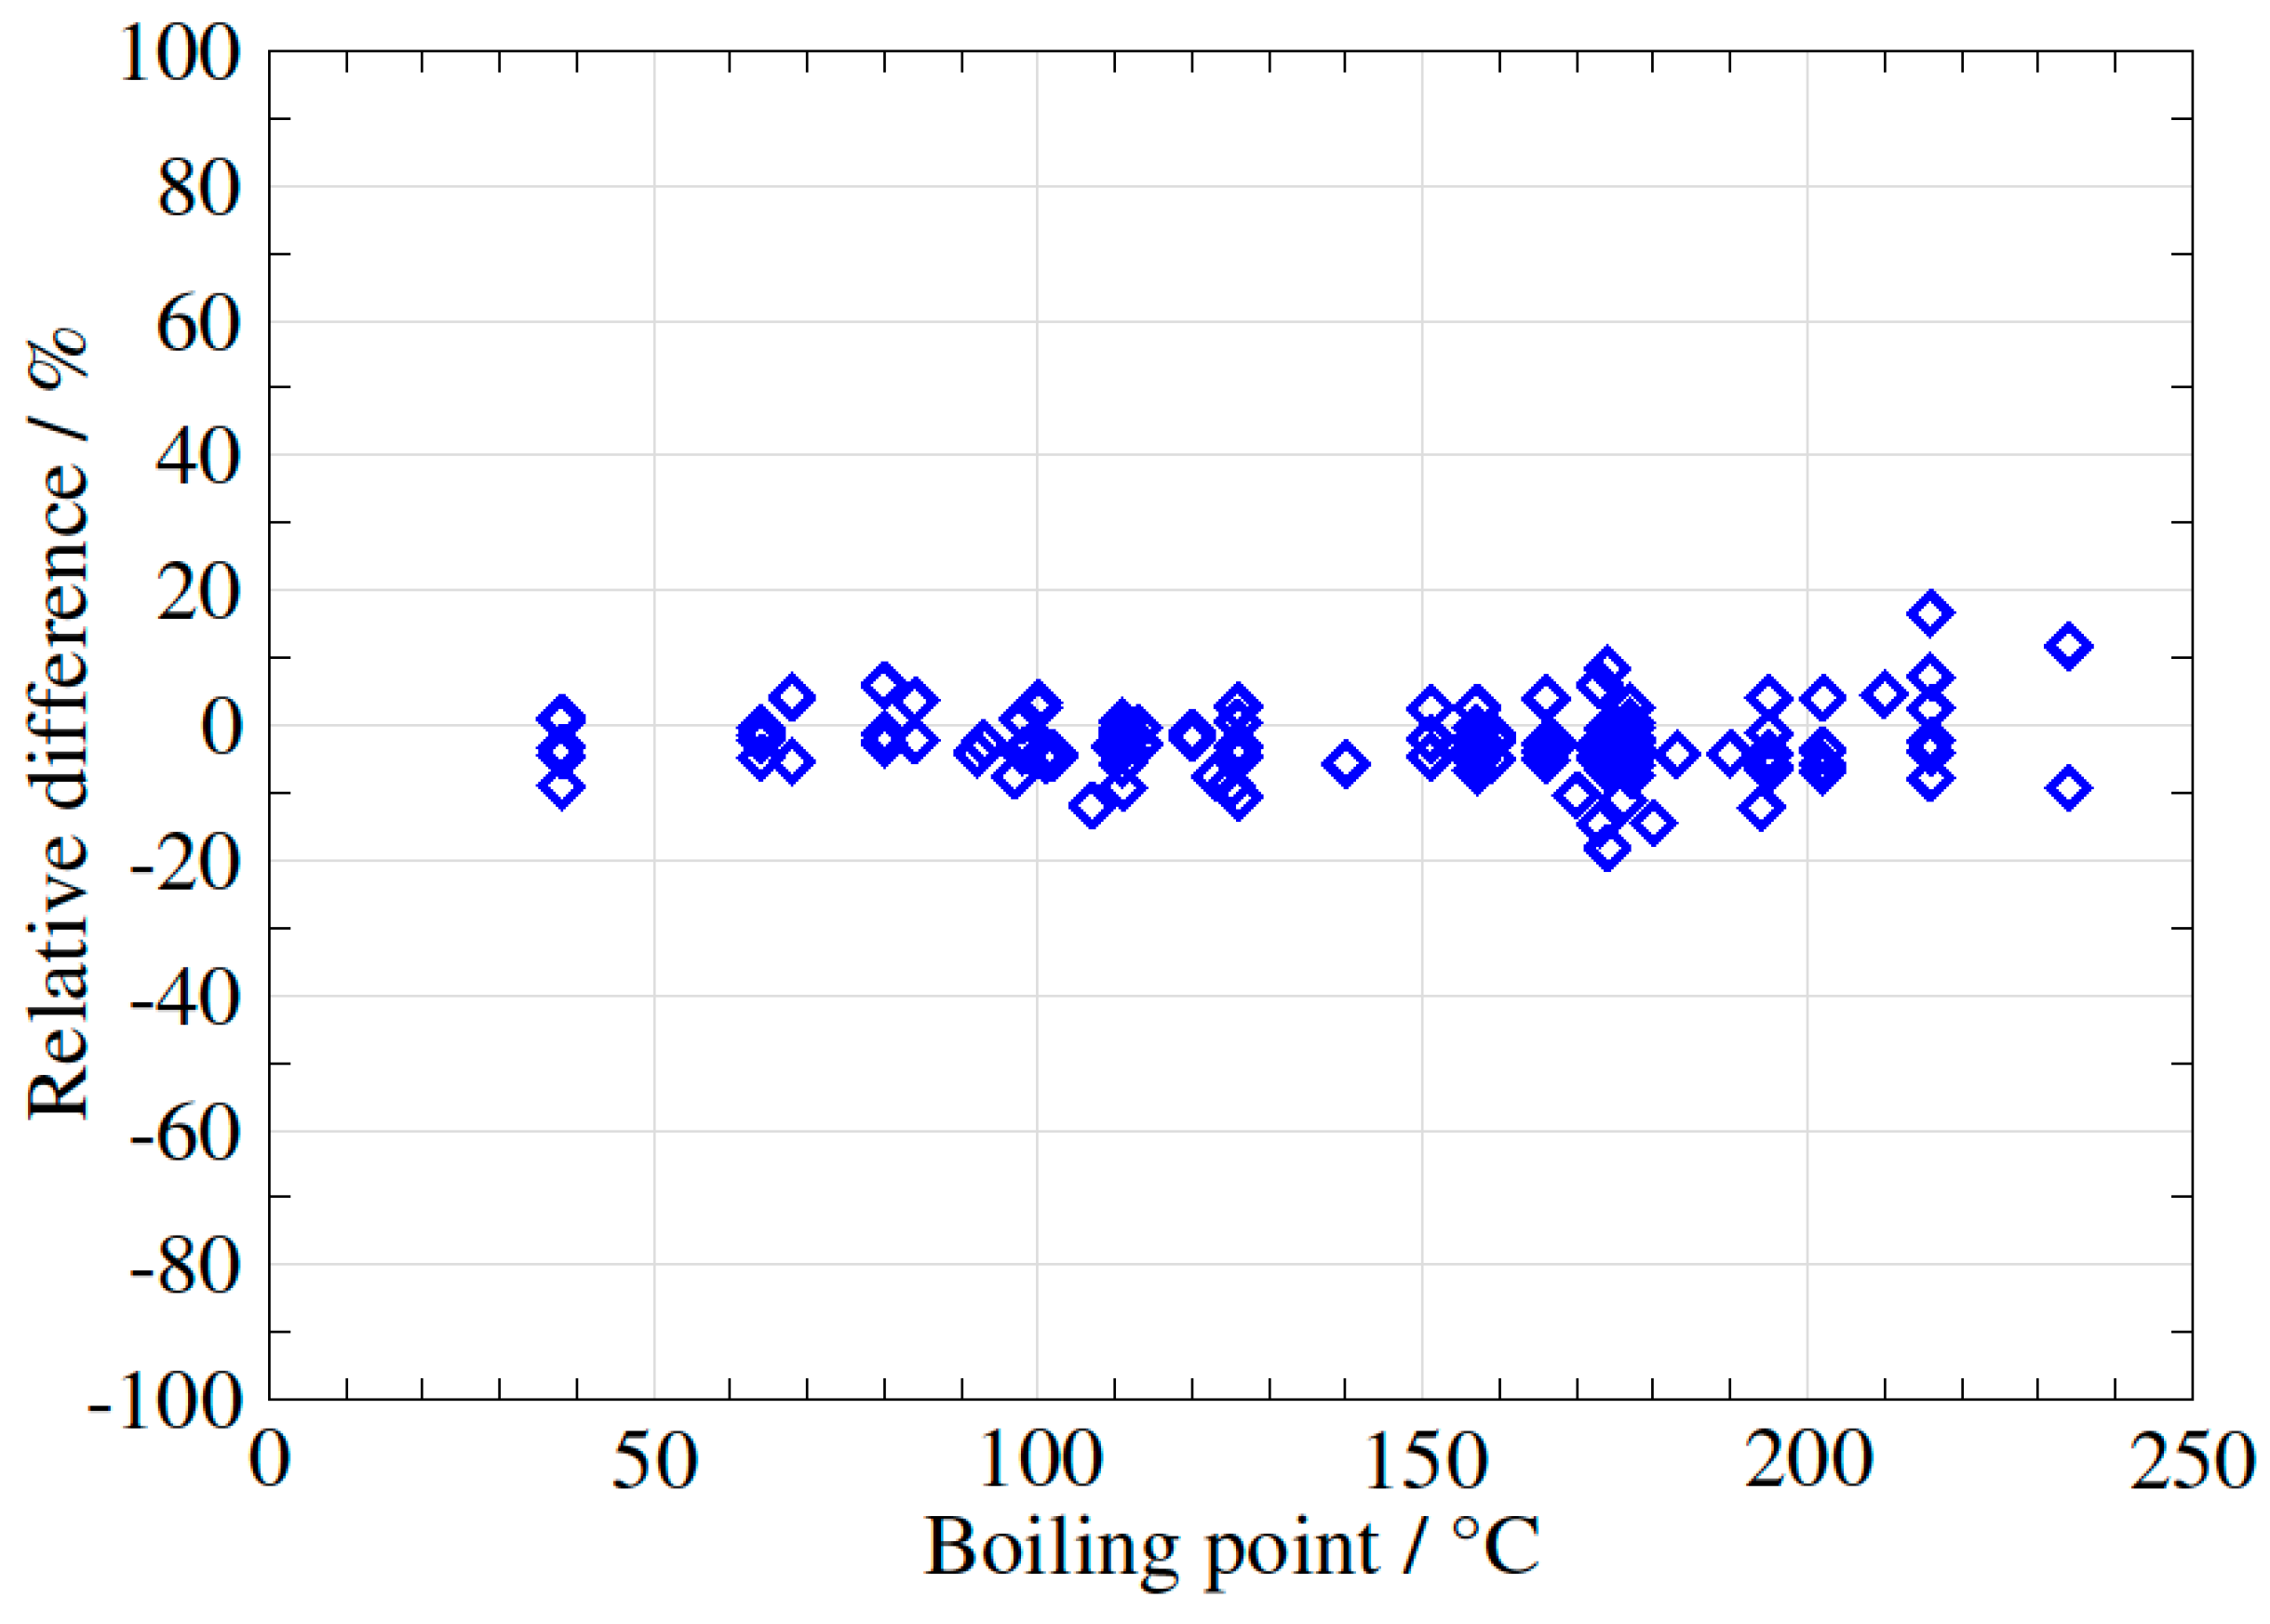
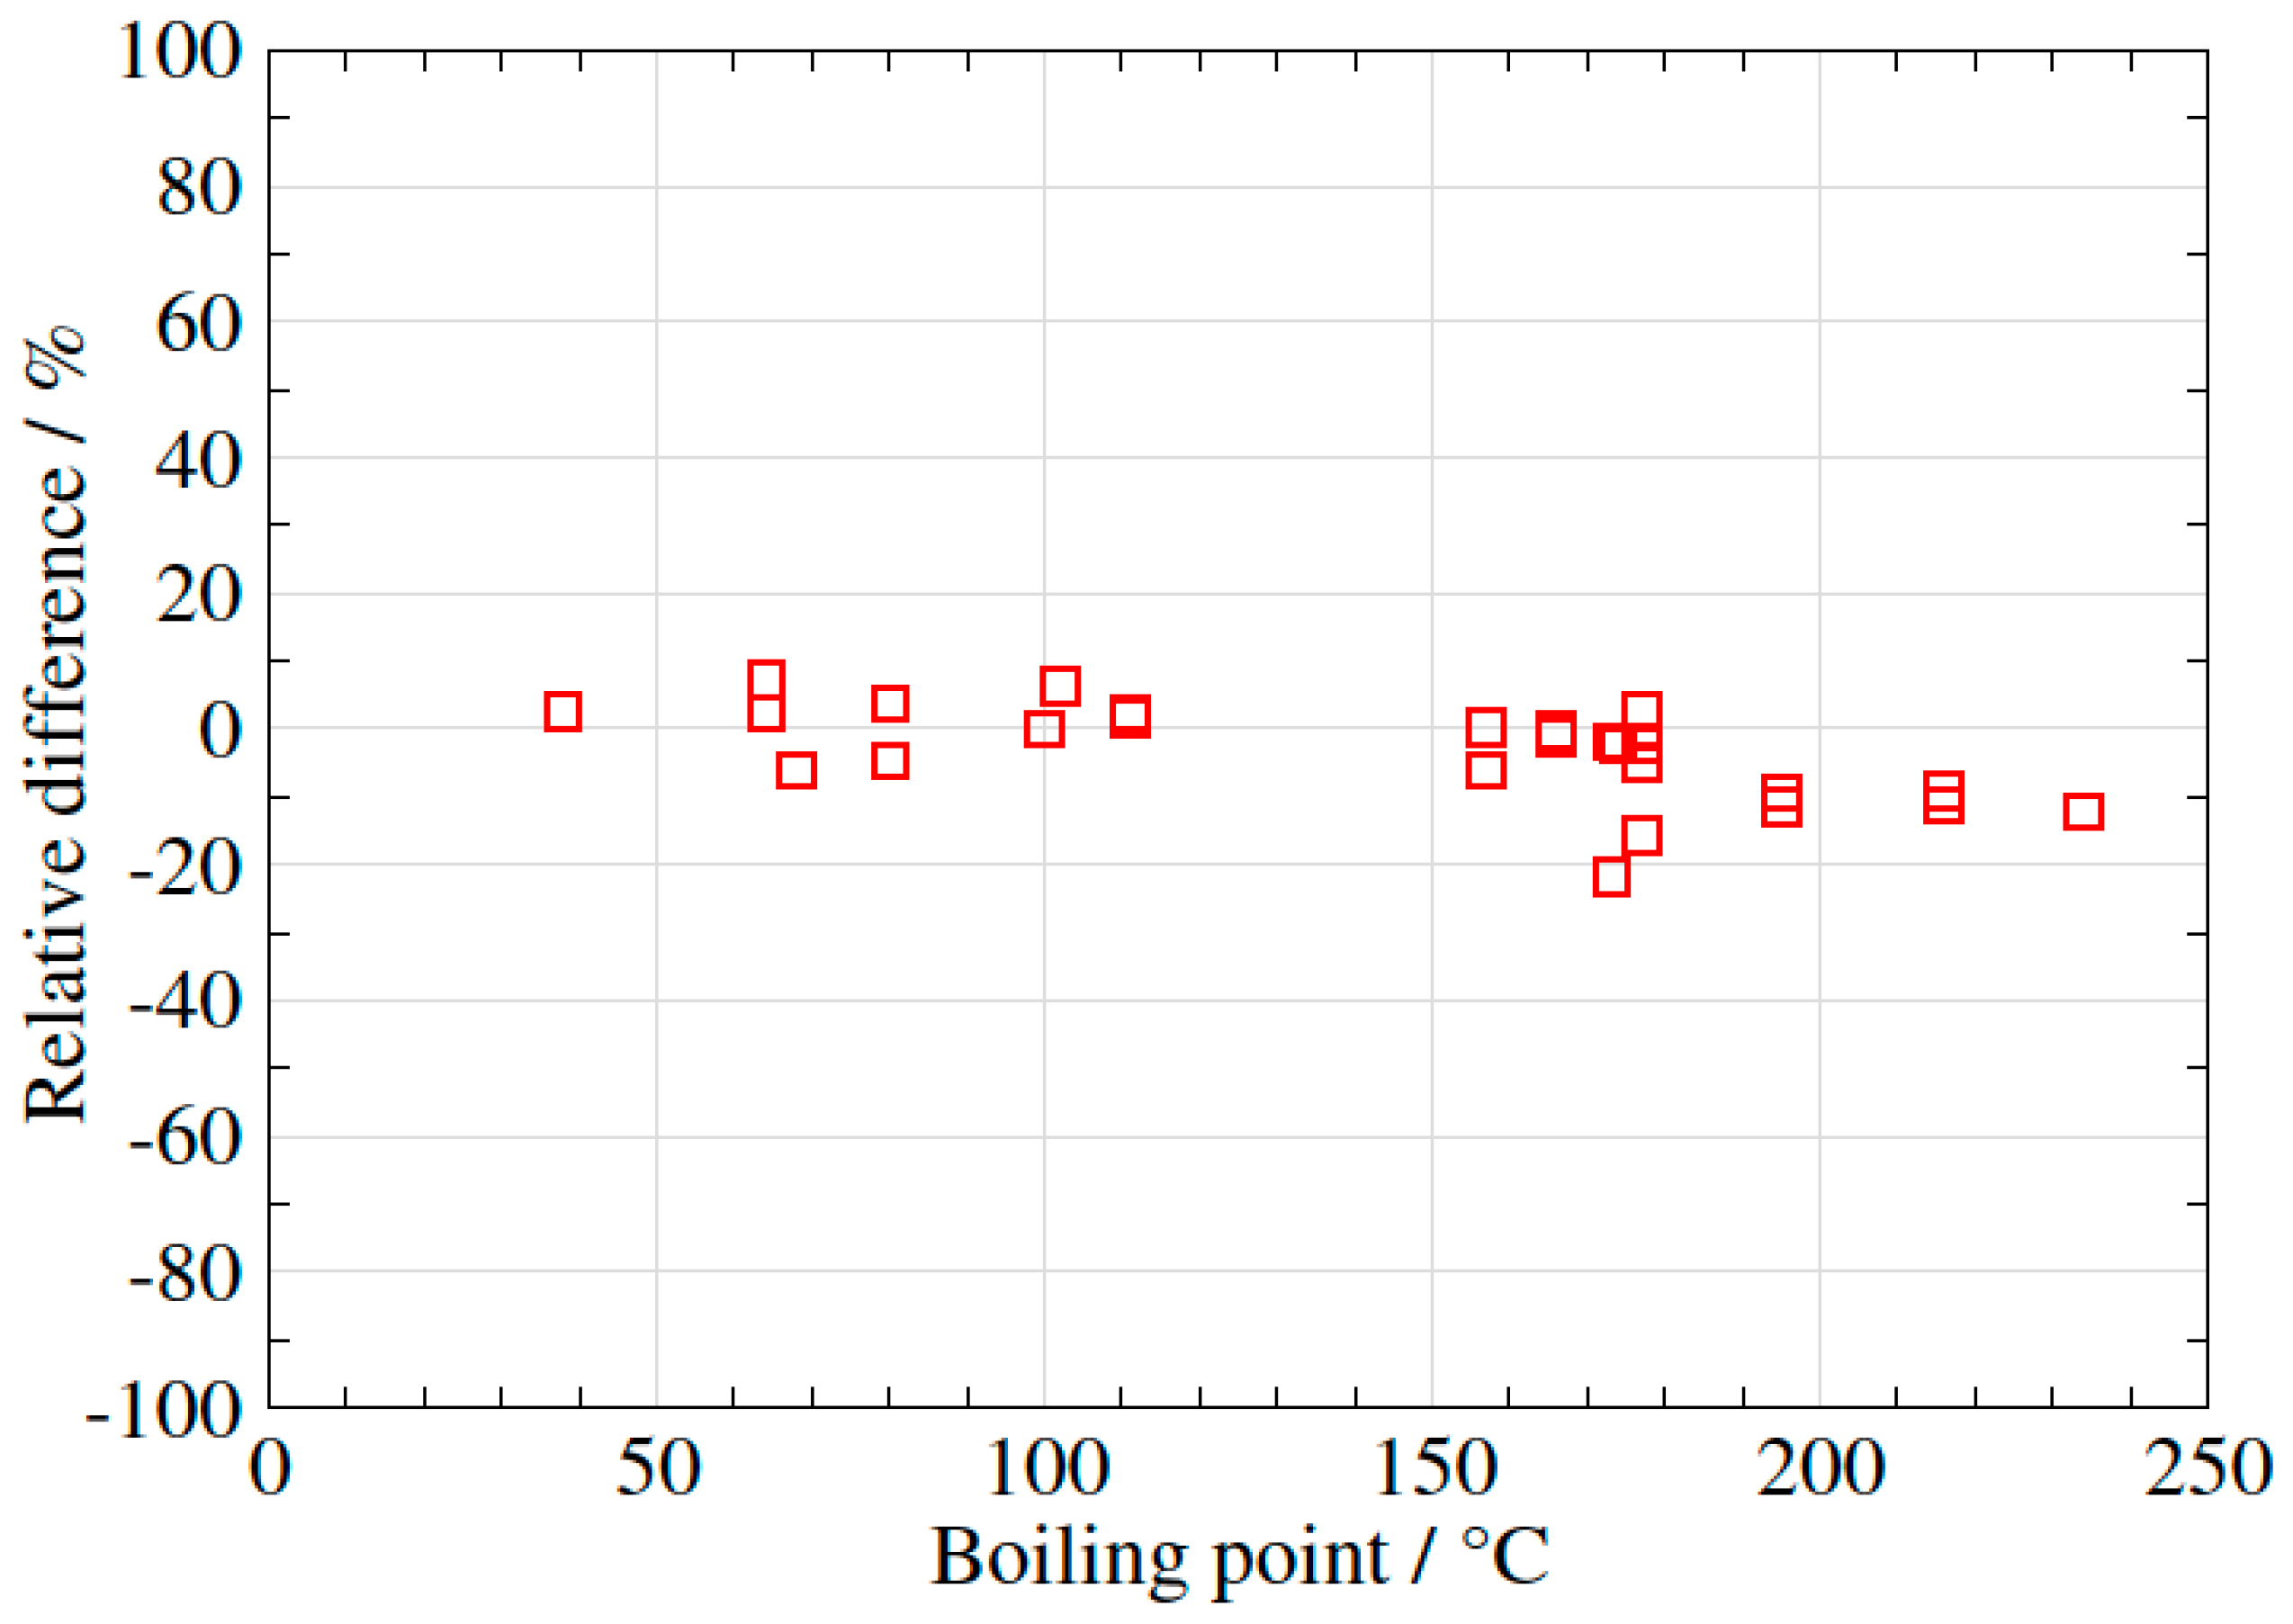
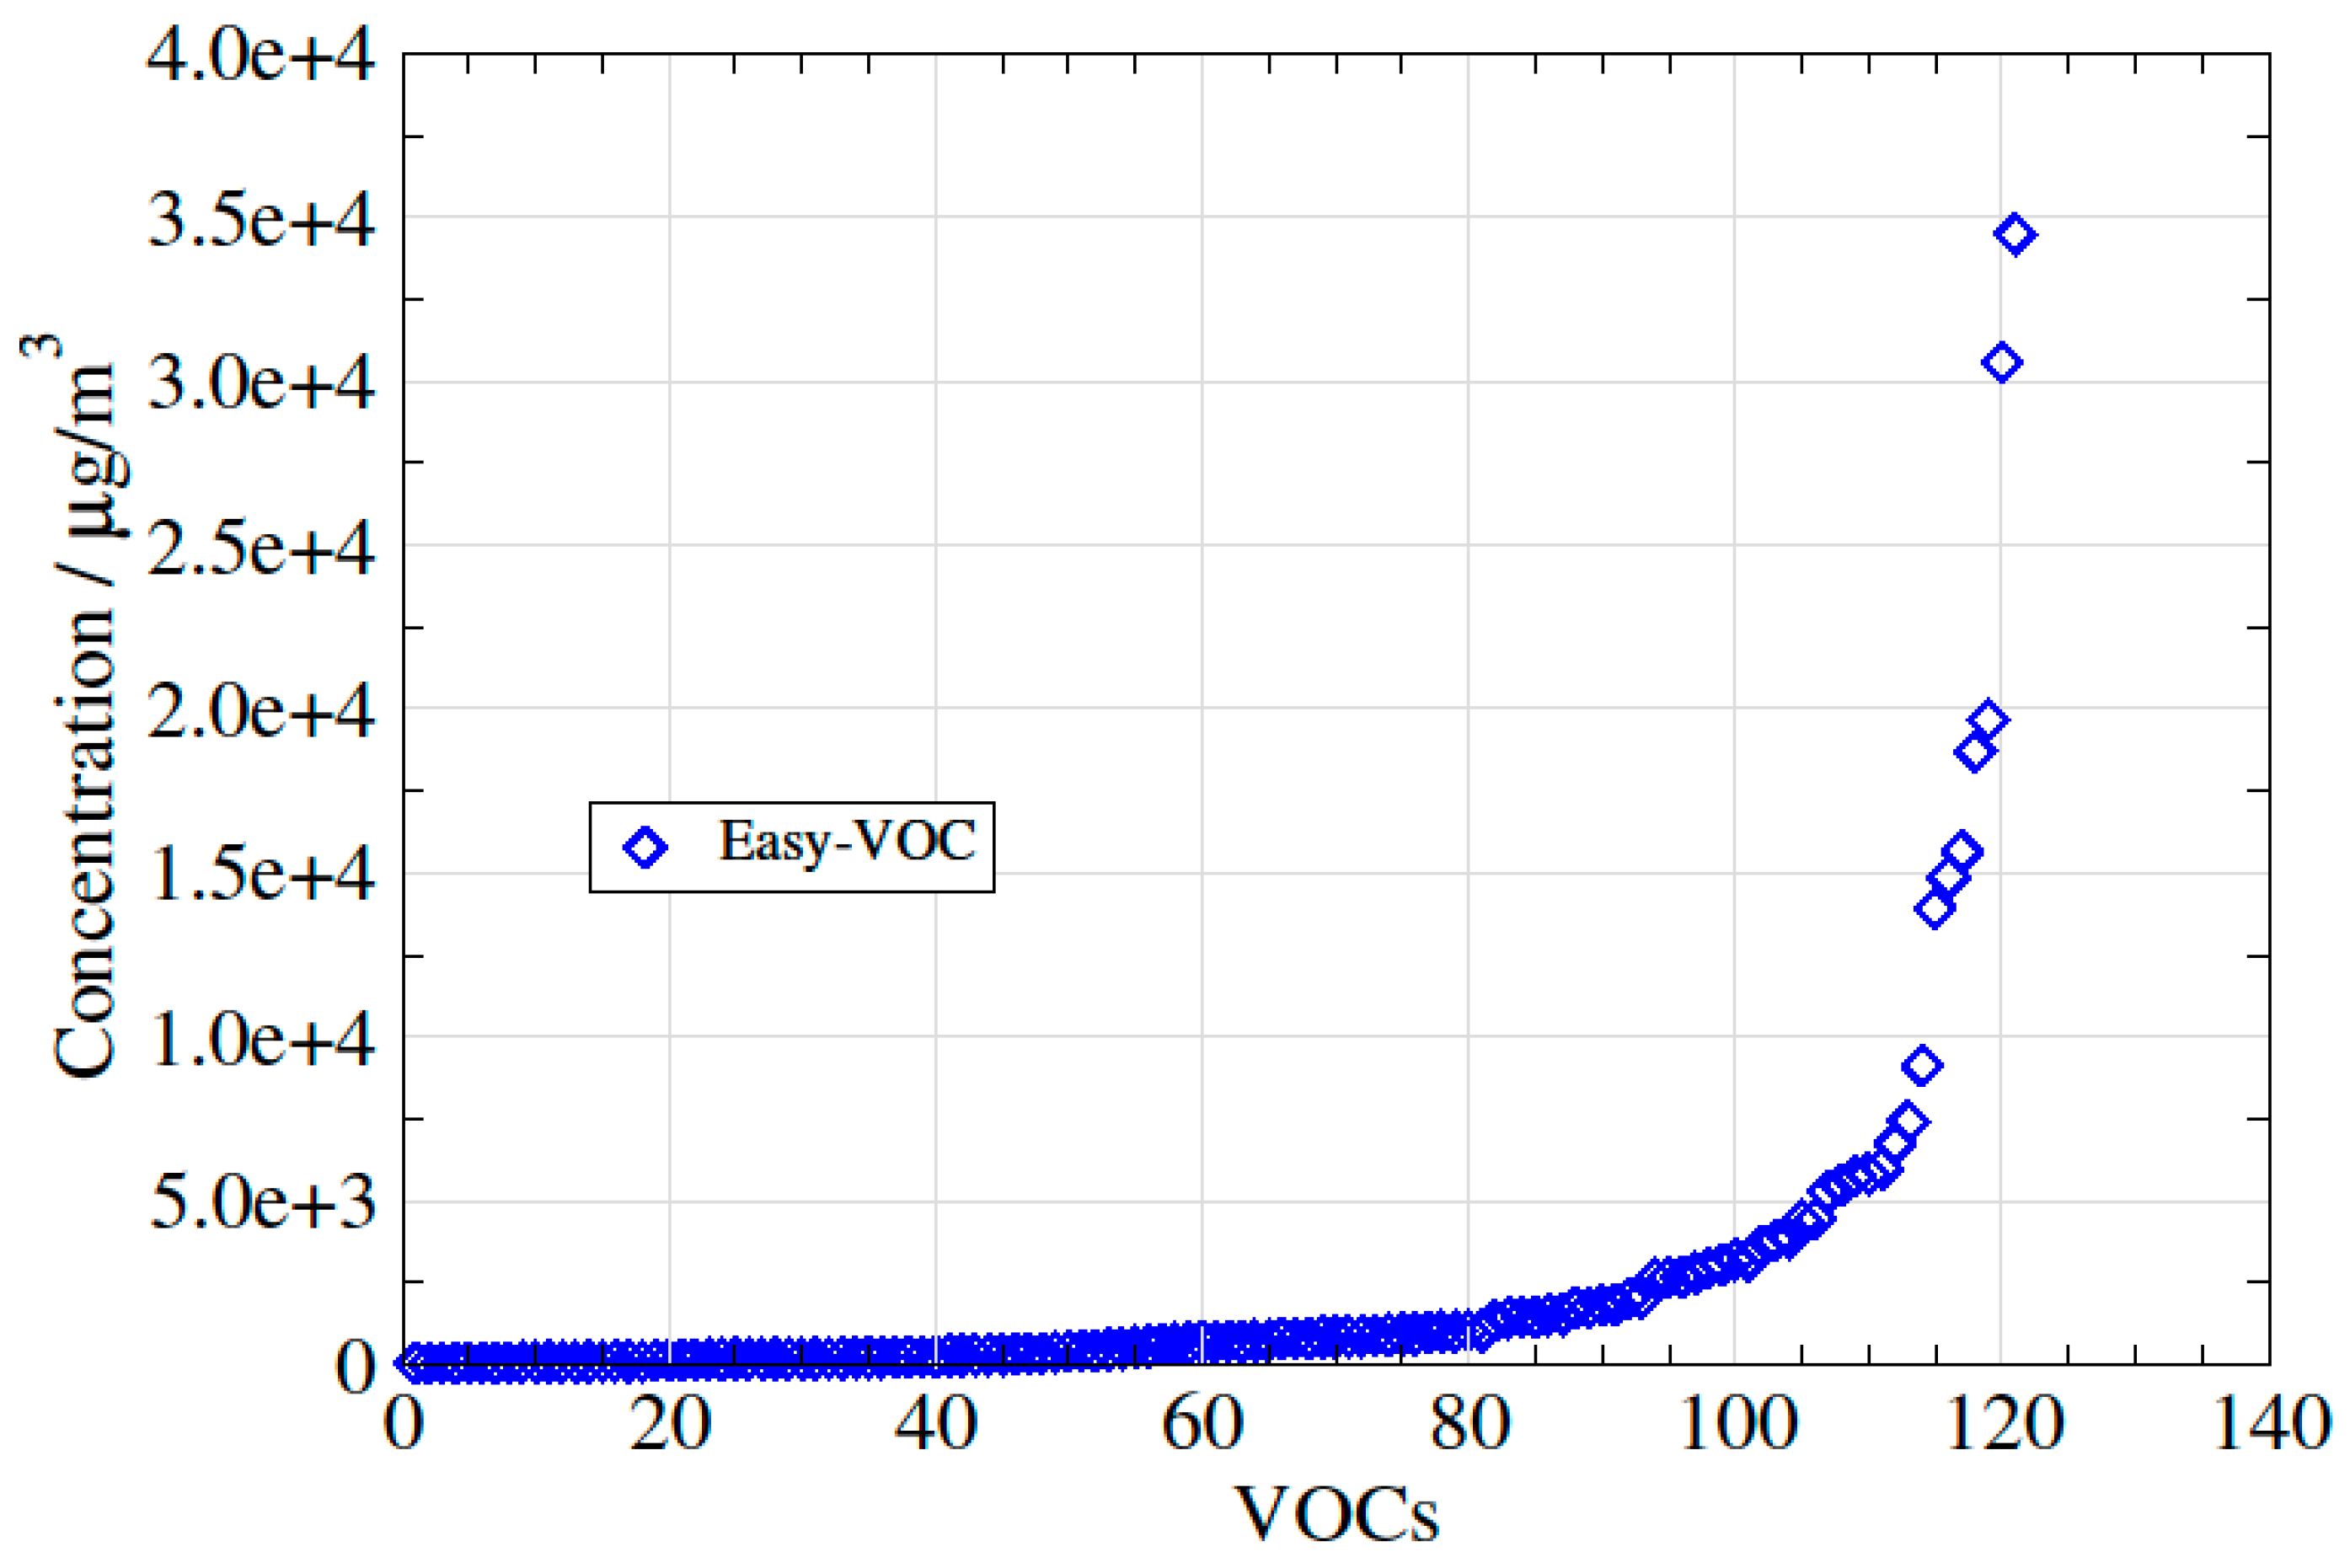
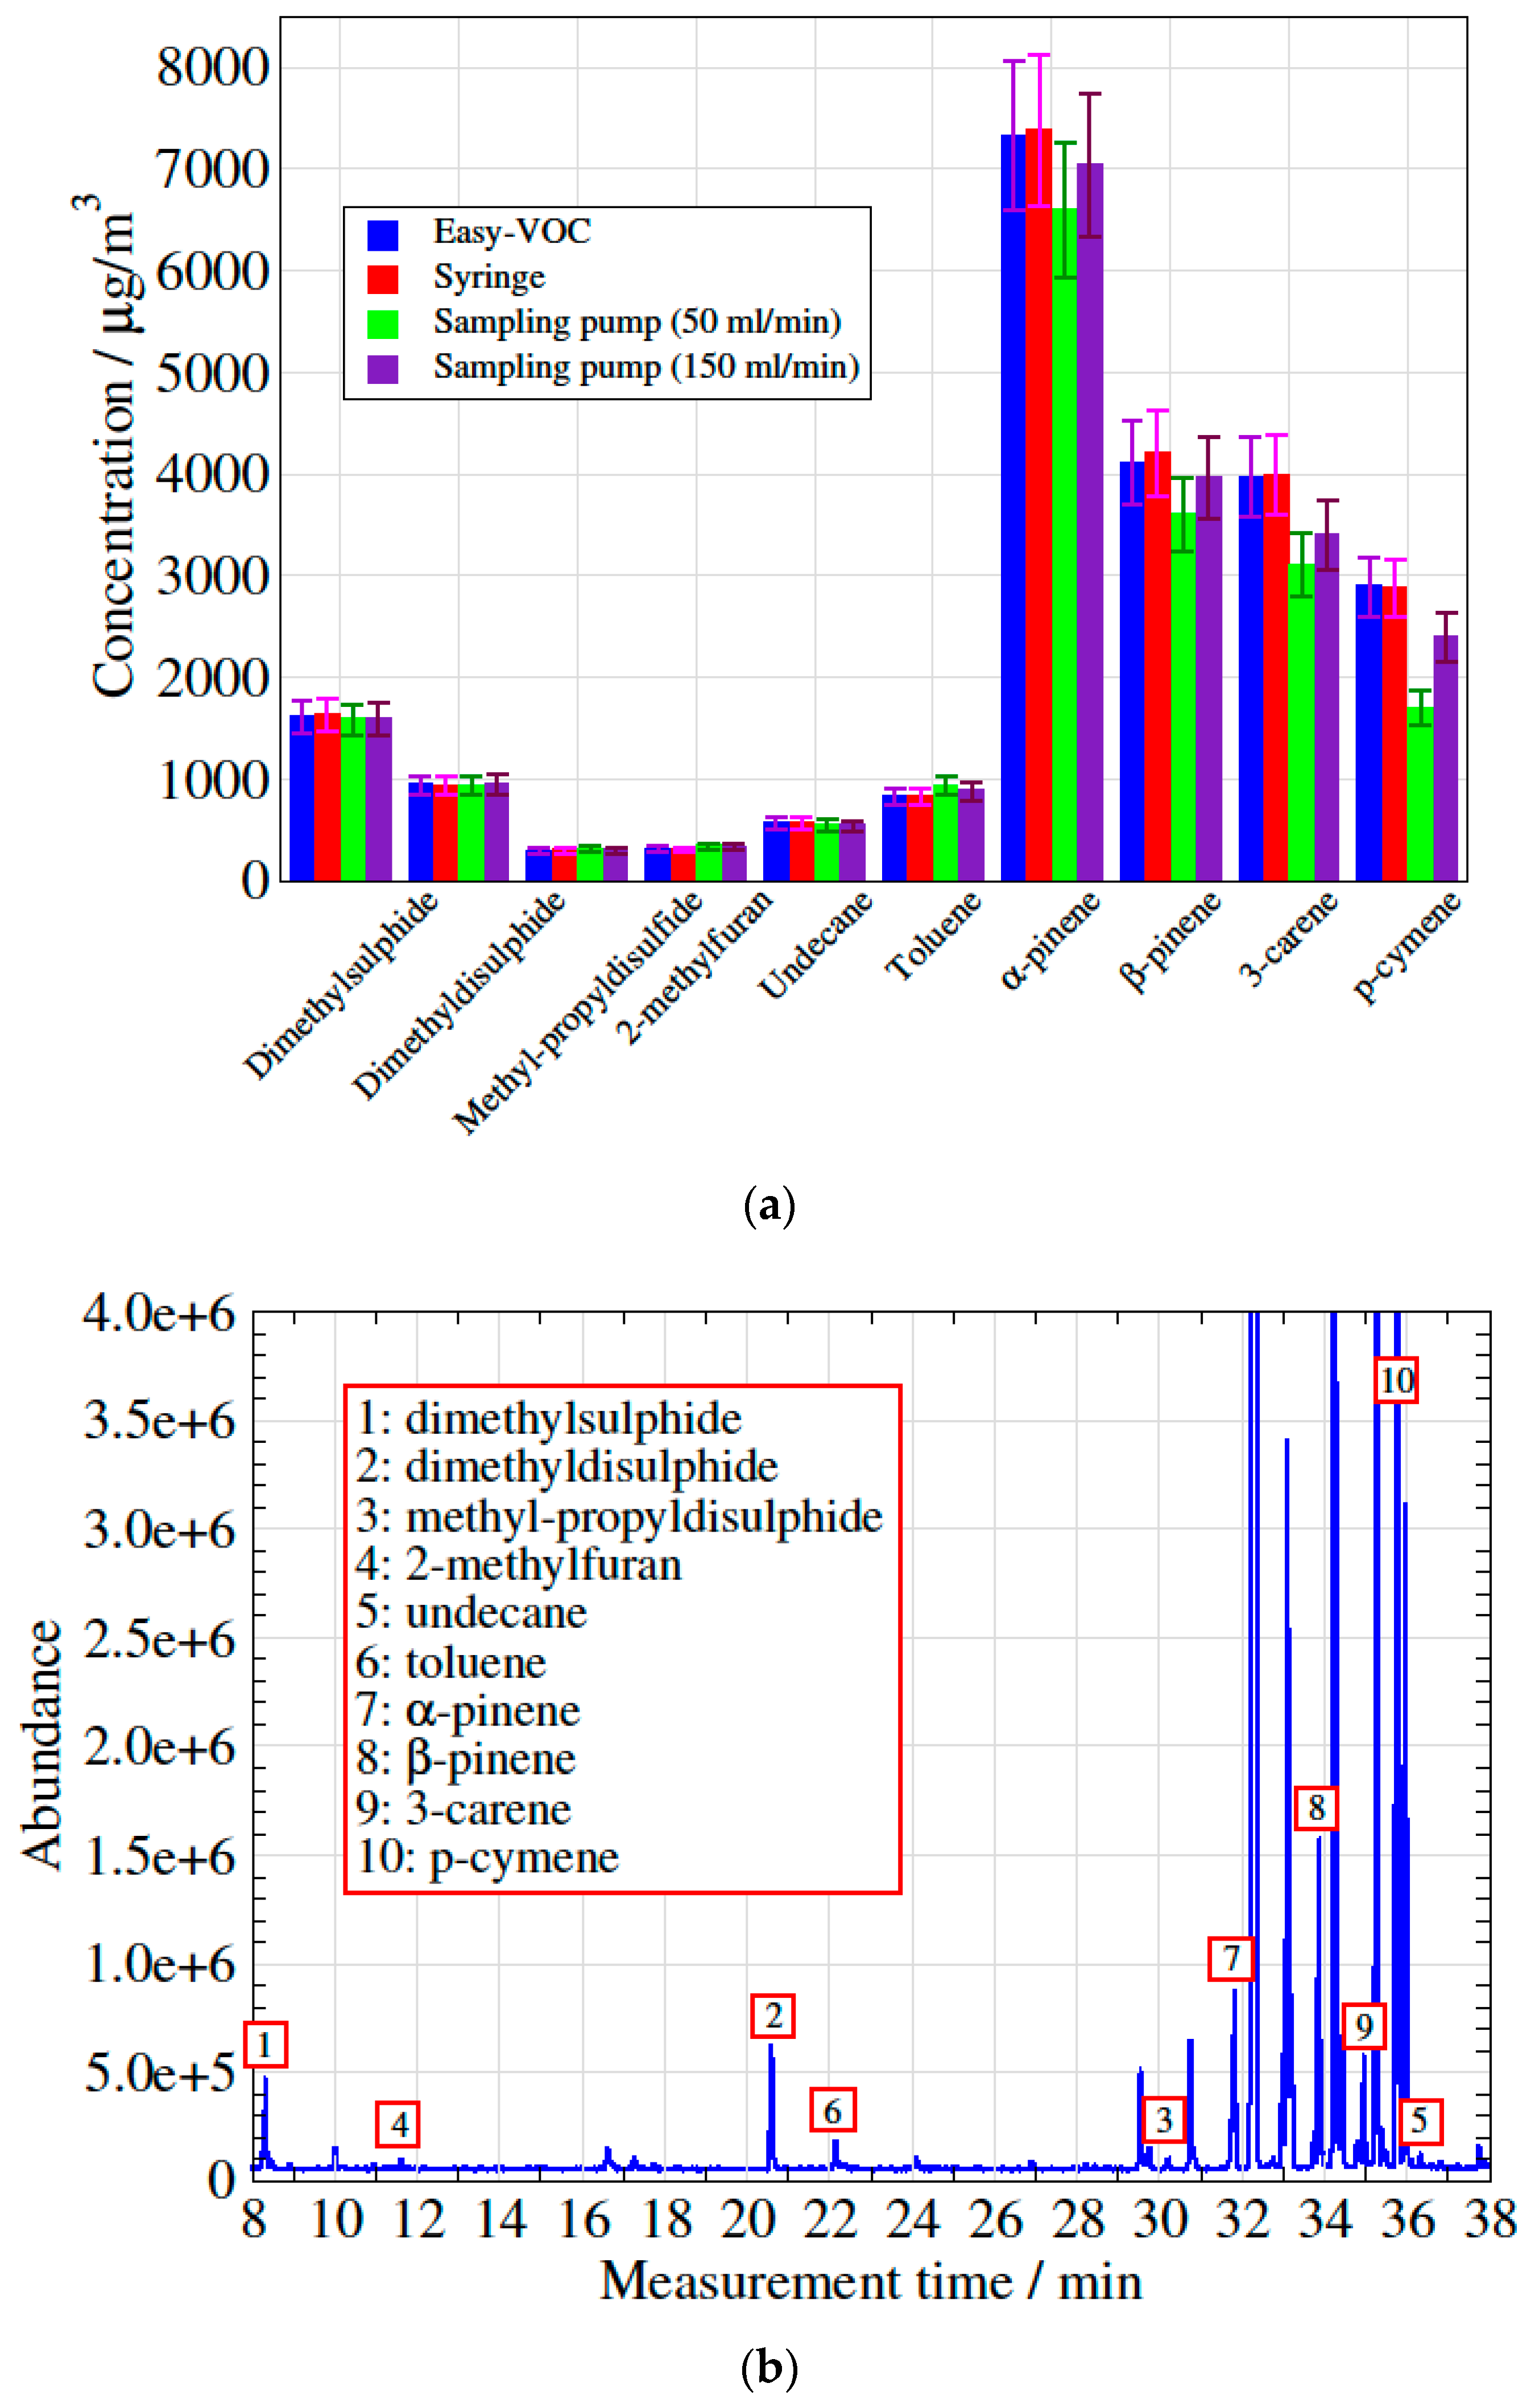
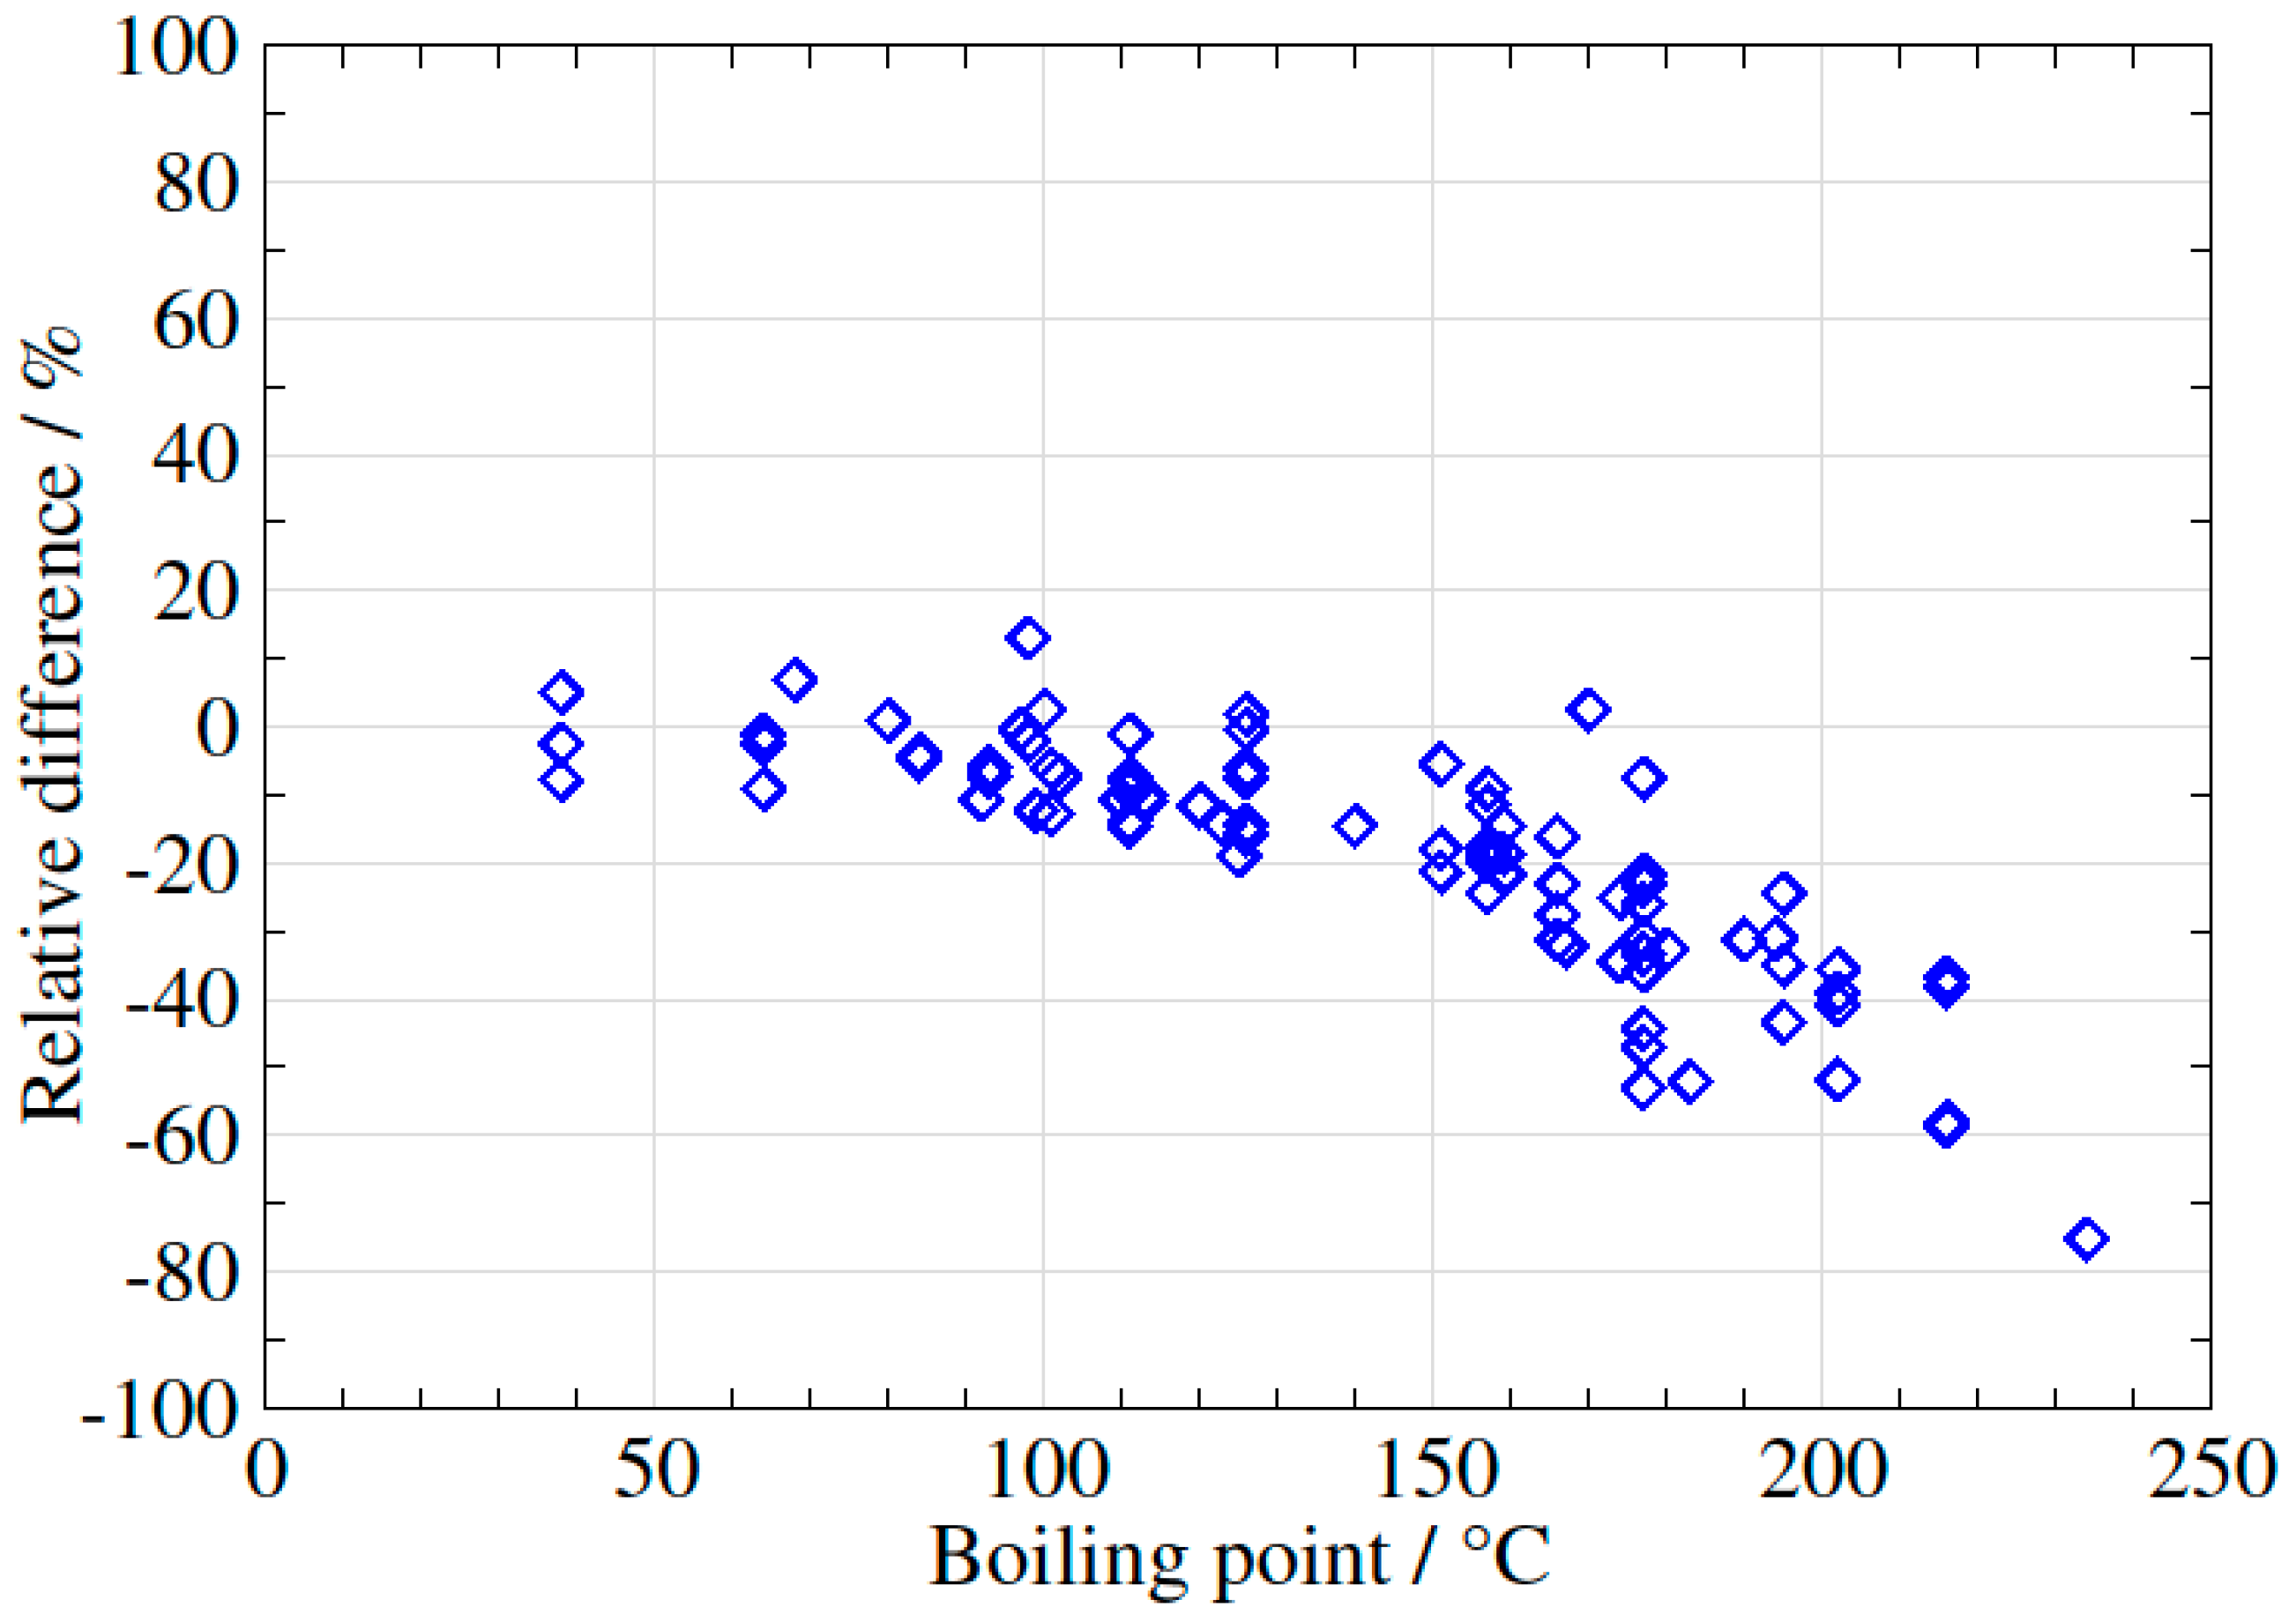
4. Results and Discussions
Standard Deviation
5. Conclusions
Author Contributions
Funding
Conflicts of Interest
References
- House, D. The Complete Biogas Handbook; Alternative House Information; OCLC: Dublin, OH, USA, 2010. [Google Scholar]
- Aebiom. A Biogas Road Map for Europe; Annual Report 2009; European Biomass Association: Brussels, Belgium, 2010. [Google Scholar]
- Arrhenius, K.; Johansson, U. Characterization of Contaminations in Biogas before and after Upgrading to Vehicle Gas; SGC Report No. 246; SGC: Malmö, Sweden, 2012. [Google Scholar]
- EN 16723-1:2016-Natural Gas and Biomethane for Use in Transport and Biomethane for Injection in the Natural Gas Network–Part 1: Specifications for Biomethane for Injection in the Natural Gas Network; DIN: Berlin, Germany, 2016.
- EN 16723-2:2017-Natural Gas and Biomethane for Use in Transport and Biomethane for Injection in the Natural Gas Network–Part 2: Automotive Fuels Specification; DIN: Berlin, Germany, 2016.
- Arrhenius, K.; Yaghooby, H.; Rosell, L.; Büker, O.; Culleton, L.; Bartlett, S.; Murugan, A.; Brewer, P.; Li, J.; van der Veen, A.M.H.; et al. Suitability of vessels and adsorbents for the short-term storage of biogas/biomethane for the determination of impurities–siloxanes, sulphur compounds, halogenated hydrocarbons, BTEX. Biomass Bioenergy 2017, 105, 127–135. [Google Scholar] [CrossRef]
- Arrhenius, K.; Brown, A.S.; van der Veen, A.M.H. Suitability of different containers for the sampling and storage of biogas and biomethane for the determination of trace-level impurities—A review. Anal. Chim. Acta 2016, 902, 22–32. [Google Scholar] [CrossRef] [PubMed]
- Polman, E.A.; Top, H.; Gerritsen, B.; Rekers, A. Development of Existing and New Measurement Technologies for Determination of the Gas Composition; EDGaR project number 100201910, GT15-0029; Energy Delta Gas Research (EDGaR): Groningen, The Netherlands, 2015. [Google Scholar]
- Ajhar, A.; Wens, B.; Stollenwerk, K.H.; Spalding, G.; Yuce, S.; Melin, T. Suitability of Tedlar gas sampling bags for siloxane quantification in landfill gas. Talanta 2010, 82, 92–98. [Google Scholar] [CrossRef] [PubMed]
- Mariné, S.; Pedrouzo, M.; Marcé, R.M.; Fonseca, I.; Borrull, F. Comparison between sampling and analytical methods in characterization of pollutants in biogas. Talanta 2012, 100, 145–152. [Google Scholar] [CrossRef] [PubMed]
- Arnold, M.; Kajolinna, T. Development of on-line measurement techniques for siloxanes and other trace compounds in biogas. Waste Manag. 2010, 30, 1011–1017. [Google Scholar] [CrossRef] [PubMed]
- Ghosh, A.; Seeley, S.K.; Nartker, S.R.; Seeley, J.V. Analysis of siloxanes in hydrocarbon mixtures using comprehensive two-dimensional gas chromatography. J. Chromatogr. A 2014, 1360. [Google Scholar] [CrossRef] [PubMed]
- Narros, A.; Del Peso, M.I.; Mele, G.; Vinot, M.; Fernandez, E.; Rodriguez, M.E. Determination of siloxanes in landfill gas by adsorption on Tenax tubes and TD-GCMS. In Sardinia 2009, Proceedings of the 12th International Waste Management and Landfill Symposium, S. Margherita di Pula, Cagliari, Italy, 5–9 October 2009; CISA Publisher: Lucca, Italy, 2009. [Google Scholar]
- Rasi, S.; Veijanen, A.S.; Rintala, J. Trace compounds of biogas from different biogas production plants. Energy 2007, 32, 1375–1380. [Google Scholar] [CrossRef]
- Badjagbo, K.; Héroux, M.; Aleee, M.; Moore, S.; Sauve, S. Quantitative Analysis of volatile methylsiloxanes in waste-to energy landfill biogases using Direct APCI-MS/MS. Environ. Sci. Technol. 2010, 44, 600–605. [Google Scholar] [CrossRef] [PubMed]
- Piechota, G.; Iglinski, B.; Buczkowski, R. Development of measurement techniques for determination main and hazardous components in biogas utilized for energy purposes. Energy Convers. Manag. 2013, 68, 219–226. [Google Scholar] [CrossRef]
- McGarvey, L.J.; Shorten, C.V. The effects of adsorption on the reusability of Tedlar Air sampling bags. AIHAJ–Am. Ind. Hyg. Assoc. 2000, 61, 375–380. [Google Scholar] [CrossRef]
- Rasi, S.; Lehtinen, J.; Rintala, J. Determination of organic silicon compounds in biogas from wastewater treatments plants, landfills, and co-digestion plants. Renew. Energy 2010, 35. [Google Scholar] [CrossRef]
- Kim, N.-J.; Chun, S.-K.; Cha, D.K.; Kim, C. Determination of siloxanes by solid-phase adsorption on activated carbon. Bull. Korean Chem. Soc. 2013, 34, 2353–2357. [Google Scholar] [CrossRef]
- Raich-Montiu, J.; Ribas-Font, C.; de Arespacochaga, N.; Roig-Torres, E.; Broto-Puig, F.; Crest, M.; Bouchy, L.; Cortina, J.L. Analytical methodology for sampling and analysing eight siloxanes and trimethylsilanol in biogas from different wastewater treatment plants in Europe. Anal. Chim. Acta 2014, 812. [Google Scholar] [CrossRef] [PubMed]
- Lamaa, L.; Ferronato, C.; Fine, L.; Jaber, F.; Chovelon, J.M. Evaluation of adsorbents for volatile methyl siloxanes sampling based on the determination of their breakthrough volume. Talanta 2013, 115, 881–886. [Google Scholar] [CrossRef] [PubMed]
- Brown, R.H.; Purnell, C.J. Collection and analysis of trace organic vapour pollutants in ambient atmospheres. The performance of Tenax-GC adsorbent tube. J. Chromatogr. A 1979, 178, 79–90. [Google Scholar] [CrossRef]
- MDHS 40(rev) Toluene in—Laboratory Method Using Pumped Porous Polymer Adsorbent Tubes, Thermal Desorption and Gas Chromatography; HIS Inc.: Bootle, UK, 1990.
- Scanlon, J.T.; Willis, D.E. Calculation of Flame Ionization Detector Relative Response factors using the Effective Carbon Number Concept. J. Chromatogr. Sci. 1995, 23, 333–340. [Google Scholar] [CrossRef]
- Ochiai, N.; Tsuji, A.; Nakamura, N.; Daishima, S.; Cardin, D.B. Stabilities of 58 volatile organic compounds in fused-silica-lined and SUMA polished canisters under various humidified conditions. J. Environ. Monit. 2002, 4, 879–889. [Google Scholar] [CrossRef] [PubMed]
- Hsieh, C.C.; Horng, S.H.; Liao, P.N. Stability of trace-level volatile organic compounds stored in canisters and Tedlar Bags. Aerosol Air Qual. Res. 2003, 3, 17–28. [Google Scholar] [CrossRef]


| Rel. Standard Deviation % | EasyVOC | Syringe | Sampling Pump | ||
|---|---|---|---|---|---|
| Flow rate (mL/min) | 500 | 150 | 300 | 50 | 150 |
| Dimethyl sulphide | 1.3 | 1.1 | 1.6 | 3.8 | 1.9 |
| Dimethyl disulphide | 1.5 | 0.7 | 0.8 | 2.9 | 2.5 |
| Methyl propyl disulphide | 6.2 | 1.4 | 2.1 | 4.6 | 2.4 |
| 2-methylfuran | 0.9 | 3.4 | 4.1 | 3.6 | 1.3 |
| Undecane | 3.4 | 0.3 | 2.8 | 6.4 | 3.1 |
| Toluene | 1.6 | 0.8 | 1.7 | 4.3 | 2.3 |
| α-pinene | 4.1 | 2.0 | 1.5 | 5.7 | 2.6 |
| β-pinene | 5.0 | 1.8 | 1.7 | 5.6 | 2.6 |
| 3-carene | 2.5 | 0.9 | 1.7 | 4.2 | 2.8 |
| p-cymene | 1.9 | 3.1 | 2.2 | 4.9 | 3.2 |
© 2019 by the authors. Licensee MDPI, Basel, Switzerland. This article is an open access article distributed under the terms and conditions of the Creative Commons Attribution (CC BY) license (http://creativecommons.org/licenses/by/4.0/).
Share and Cite
Arrhenius, K.; Fischer, A.; Büker, O. Methods for Sampling Biogas and Biomethane on Adsorbent Tubes after Collection in Gas Bags. Appl. Sci. 2019, 9, 1171. https://doi.org/10.3390/app9061171
Arrhenius K, Fischer A, Büker O. Methods for Sampling Biogas and Biomethane on Adsorbent Tubes after Collection in Gas Bags. Applied Sciences. 2019; 9(6):1171. https://doi.org/10.3390/app9061171
Chicago/Turabian StyleArrhenius, Karine, Andreas Fischer, and Oliver Büker. 2019. "Methods for Sampling Biogas and Biomethane on Adsorbent Tubes after Collection in Gas Bags" Applied Sciences 9, no. 6: 1171. https://doi.org/10.3390/app9061171
APA StyleArrhenius, K., Fischer, A., & Büker, O. (2019). Methods for Sampling Biogas and Biomethane on Adsorbent Tubes after Collection in Gas Bags. Applied Sciences, 9(6), 1171. https://doi.org/10.3390/app9061171