Abstract
In this paper, we introduce a simple sound signal diagnostic method to evaluate anterior cruciate ligament (ACL) injury before and after reconstructive surgery. Sixty-five recruited participants were divided into control (n = 27) and experimental (n = 38) groups. Dynamic time warping of sound signals was applied to evaluate the healthy and injured limbs before surgery with those after surgery via analysis of variance and Z-test analysis. In the control group, the average differences among three sensing points ranged from 7.7 ± 3.4 to 18.9 ± 10.6, over the frequency range of 250 Hz to 4 kHz. In the experimental group, the average differences were between 6.2 ± 2.8 and 57.4 ± 21.3. The greatest significant wavelet coefficient difference was observed in the range of 125–250 Hz. Our preliminary results demonstrate that the proposed approach produces significant signal variations at the ACL test point (TPACL) with regard to identifying ACL injury, with swing cycles conducted within the 4-kHz band of 1–7 wavelet coefficients. Thus, wavelet analysis of knee sound can be used to evaluate the recovery status after single ACL reconstruction surgery. After a 1-year follow-up of the 38 patients with ACL injury, the frequency band difference among sensing points was reduced from 274% to approximately 600%.
1. Introduction
The knee joint, the most complex joint in the human body, includes the anterior cruciate ligament (ACL), lateral collateral ligament (LCL), medial collateral ligament (MCL), and posterior cruciate ligament (PCL) for stabilization during movement. Movement is promoted by nerve signals to the skeletal leg muscles that are transferred via tendons attached to the knee.
The knee joint is exposed to a reaction force when the lower limbs perform floor exercises. Momentarily exposing the knee joint to excessive or uneven reaction forces that cannot be absorbed by the musculoskeletal system may make the knee joint unstable, thus worsening any ligament or tendon injury [1,2].
A knee joint injury limits movement and physical activity. Swelling and pain with an acute knee injury can be alleviated by ice-pack application and/or anti-inflammatory drugs. Walking with a crutch may also reduce the load on the knee joint. After these acute symptoms pass, some patients mistakenly think that the injured knee-joint has recuperated, while in fact the knee joint is still damaged. Further use of the knee without a full recovery can lead to degenerative arthritis over time. To resolve knee joint instability, the human body attempts to adapt itself to the situation. This further weakens the knee joint, resulting in progressive wear and tear, and eventually, the onset of osteoarthritis (OA). Although medications can be used to control inflammation and acute pain symptoms, more serious knee ligament injuries may require ligament reconstruction surgery to treat lower extremity discomfort or improve biomechanical performance to restore knee joint stability and exercise ability [3].
Knee joint ligament injuries occur often in sports, traffic accidents, and with serious falls. Sixty percent of knee joint injuries involve the ACL [4]. The Lachman test is used for clinical investigation of the ACL [5], with a predictive value approaching 91.7% for tears or partial tears; however, the average correct diagnostic rate using the Anterior Drawer test is only 66.8%. Hence, the Lachman test is often the preferred diagnostic approach. The average predictive accuracy for clinical investigation of MCL rupture through abduction and valgus stress tests is 76.5%. Fewer patients present with LCL damage compared with ACL cases. Thus, the rate of LCL injuries is lowest among the four types; the average predictive accuracy is 25% for LCL rupture, with adductor stress testing and gonyectyposis assessment. Hence, other clinical approaches to diagnose MCL and LCL ruptures are required to improve the diagnostic accuracy of an ACL injury.
Ligament damage affects the daily lives of those afflicted. The necessity of ligament reconstruction surgery depends on the patient’s age, working environment, activity interests, habits, and the ability to navigate the short-term postoperative loss of movement during recovery [6]. If the patient refuses to undergo surgery or a muscle rehabilitation program and is unwilling to wear kneepads or alter body movements, other conservative treatment methods can be used; however, only 9% of motor function is recovered [7]. In orthopedic clinics, the need for ligament reconstruction surgery is determined by the recovery of the injured tibia, the amount of displacement of the femur, and joint function; in addition, a physical examination is used to assess the overall health of the patient [8].
In [9,10], the results showed that ACL reconstruction surgery cannot fully restore the dynamic function of the knee joint and may actually increase the likelihood of degenerative joint disease. A study involving 45 patients with healthy ACLs and 45 patients who had undergone ACL reconstruction surgery was conducted to confirm the effects of early OA with lower extremity biomechanical changes following ACL reconstruction surgery [11]; the results showed that in patients with lower limb injury, the body’s natural compensatory mechanism is activated, resulting in an increased load on the other, undamaged knee. However, the results could not prove that the increased load causes OA after surgery, as torque changes can also lead to OA.
In [12,13,14], differences between the injured leg and the healthy leg under preoperative and postoperative surgical examinations were evaluated in terms of the constant velocity attained with ACL reconstruction. The efficiency of ACL reconstruction with postoperative surgery was investigated in [15]; the experimental results showed that time-frequency analysis of various knee joint features can be used to evaluate the status of the knee joint and rehabilitation progression. In [16], researchers evaluated the applicability and efficiency of ACL reconstruction rehabilitation using a special whole-body vibration muscle exercise; rehabilitation was evaluated and given a Lysholm score at weeks 2, 5, 8, and 11, with respect to the original ACL length and velocity. In [17,18,19,20,21], the rehabilitation efficiency of ACL reconstruction was evaluated based on a visual analogue scale, Lysholm score, and a numerical rating of the applicability and pain of the knee joint; the results indicated that the inclusion of stability indicators in the recovery diagnostic tool provides an accurate representation of the reconstruction process.
Many studies e.g., [22,23,24] have proven the feasibility of using noninvasive sound detection methods for identifying knee joint disorders. In [25], the knee pathology was identified and diagnosed based on a noninvasive approach using sound signals in 6 patients with non-normal known knee pathologies and in 11 patients with suspected knee injury; the patients were ultimately divided into two groups consisting of (1) those with a damaged meniscus or ACL tear that required a clinical diagnosis by a physician and surgical treatment and (2) those with degenerative arthritis. Rangayyan’s research group at the University of Calgary [26] extracted a fractal scaling index and average sound amplitude by analyzing the joint vibration data of 75 participants with knee joint injuries; they identified degenerative arthritis using vibroarthrographic signal data and Kolmogorov–Smirnov analysis results.
Currently, magnetic resonance imaging (MRI), X-ray imaging, and computed tomography are used to examine internal joints in a non-invasive procedure. The gold standard method for determining the extent of damage to the knee joint is arthroscopic examination. However, arthroscopy cannot be used for early detection or postoperative analysis of rehabilitation progression. Moreover, the arthroscopic exam is an invasive procedure conducted under general anesthesia with associated surgical risks.
Sound is produced in the soft tissue of normal, uninjured knees due to air pressure variations that occur when the knee joint is rubbed or squeezed during buckling or straightening. In the presence of an existing injury, the lower limb produces abnormal sounds during cyclic bending action [27,28]. Abnormal murmurs in the joints on clinical examination may indicate joint disorders.
The purpose of this study was to provide scientific data to help physicians assess the rehabilitation progression following knee ligament reconstruction surgery. Based on the vibration and sound generated with bending and swinging of the injured knee joint, the recorded sound signals from audio sensing and inertial sensing modules, respectively, were used to assess the rehabilitation progression of the knee joint. Three testing sites around the knee joint corresponding to the ACL, MCL, and LCL were monitored. The sound signals were transformed into discrete wavelets, from which characteristic parameters were extracted for data analysis. Statistical analysis of the data was used to determine the extent of the joint injury. By tracking the status of patients before and after surgery, the patient’s own sound signals can be used to evaluate the rehabilitation status of the joint.
2. Methods
2.1. Experimental Design
The purpose of this study was to assess the feasibility of developing hardware and software systems for postoperative evaluation of the anterior ligament of a single lower limb knee joint. Assessment of the medical effectiveness of this tool is not within the scope of this research. The experimental results were reviewed and approved by our institutional review board. The status of all participants was confirmed by an orthopedic specialist using standard inspection procedures.
The total number of study participants was 65. The participants were divided into control and experimental groups. The control group included 27 participants (C1–C27), none of whom had a medical history of ligament injury or were constrained in terms of their daily activities or interests. All of these participants underwent a physical examination conducted by an orthopedic surgeon using the pivot test. The experimental group included 38 participants (E1–E38) diagnosed as having ligament injury through a clinical physical examination and MRI. The experimental group of patients consisted of graduate students and/or working professionals. Most of the patients had received their ACL injuries from sports accidents. The ages of participants ranged from 20–50 years. Given that chondromalacia patella symptoms may be attributable to advanced age in older patients, we attempted to exclude these patients from the trial. To provide a comparison with healthy lower limbs, we focused on patients with a single-limb ACL injury [29,30,31].
2.2. Signal Capturing
In [32,33,34], researchers used sound vibration signals to evaluate the degree of recovery for patellofemoral pain syndrome, OA, and skeletal muscle damage, respectively. In the current study, the receiver positions of the collected signals were based on those used in [32,33,34] and the recommendations of a clinical orthopedic specialist. Figure 1a–c shows a schematic diagram of the measurement process, a photograph of the device, and a diagram of the flexion-to-extension swing measurement, respectively. A custom-designed electro-stethoscope (LongYue 09SOAL, New Taipei City, Taiwan) was used as a stethoscope microphone to capture the sound signals from the ACL, MCL, and LCL, with associated test points (TPs) denoted by TPACL, TPMCL, and TPLCL, respectively. To improve the accuracy of signal analyses, a six-axis inertia configuration was used to obtain the same swing angle and speed (MPU-6050, InvenSense Inc., San Jose, CA, USA). The swing speed was evaluated using inertial sensors with an electronic metronome to reduce human error. Signals processed by a digital convertor in a microcontroller unit (Arduino Uno, Scarmagno, Italy) were transmitted to a computer for processing via a USB 2.0 port.
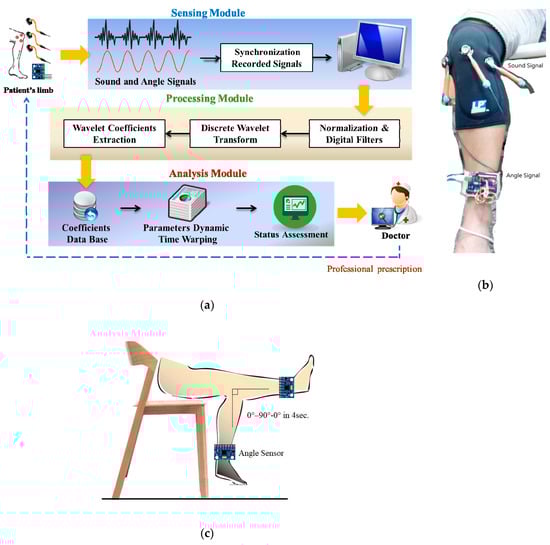
Figure 1.
System architecture and measuring method: (a) data processing procedure in the three modules, (b) photograph showing the three sound sensor positions and angle sensor, and (c) 4-s swing cycle from flexion to extension to flexion (0° to 90° to 0°, respectively).
2.3. Signal Measurement
According to pedestrian walking speed data, the normal walking pace of adults is 3–5 km/h, and the step distance is 50–70 cm [35]; the step cycle is 2 s. For a patient with an injured limb, in which fast swinging of the limb is not possible, the step cycle increases to 4 s. To maintain consistency during the test, the study participant assumed a sitting posture to free the lower limbs. The examiner then moved the participant’s limb. The participant then swung the lower limb passively and cyclically five times from 0° to 90° in 4 s. The resulting vibration sound signals were recorded and analyzed. For each cycle, knee joint vibration signals were collected by nursing staff after the participant rested for 30 s.
For the analysis, we attempted to identify an appropriate base of wavelets and wavelet coefficients from the sound signals that best-represented the knee joint ligament. Symlet-5, Symlet-6, Symlet-7, Daubechies-8, Daubechies-9, and Daubechies-10 are commonly applied wavelet basis functions that are characterized by sudden drastic variations. These six wavelet functions were applied in the study; signals below 30 Hz were filtered out. If the signal energy of a specific band was much lower than those of the other bands, the band was not processed. Wavelet coefficients from 1 to 7 were used to execute dynamic time warping (DTW) to calculate the difference between parameter values.
2.4. Assessment of Recovery
Knee joint injury can be further aggravated by overuse of the injured limb, which has an influence on the biomechanics of the lower extremity. This change may cause injury of the tissue around the healthy limb and reduce body coordination. In this study, Audacity digital audio editing and recording software was used to filter the sound signals and remove noise. The distance measure of the feature vector was identified using DTW. We compared the differences between the experimental and control groups in terms of the average values of sample data; the results were verified by a Z-test. The Z-value, defined below, can be used to determine the difference between the mean values of two groups, in our case, the experimental and control groups:
where with respect to the first and second groups, x1 and x2 represent the average values, s1 and s2 represent the standard variances, and n1 and n2 represent the total numbers of the groups, respectively.
In accordance with the definition of the Z-test, an absolute value of the resultant Z-value, |Z|, of less than 1.96 indicates no difference between the two groups; |Z| > 1.96 indicates a confidence level of less than 95%, and |Z| > 2.25 indicates a confidence level of less than 99.9% with a highly significant difference.
3. Results and Discussion
3.1. Swing Cycle Analysis and Comparison
The measured signals in the two lower limbs of participants at TPACL, TPMCL, and TPLCL, were decomposed using a discrete wavelet transform (DWT) with the DWT wavelet coefficients of Symlet-7. Average Z-values were obtained from the sound signals of the 27 participants in the control group and the 38 patients in the experimental group to test the significance of the differences in sound wavelet coefficients among the six wavelet basis functions during two swing cycles. According to the experimental results, the |Z| value of the patients at TPACL was 0.14, i.e., less than 1.96. The |Z| values at TPMCL and TPLCL of the control group varied from 2.80 to 6.68, i.e., greater than 1.96. The results also showed that the |Z| values at TPACL for 2- and 4-s swing cycles were significantly different.
3.2. Wavelet Basis Function
The six wavelet basis functions are commonly applied in analyses. The signal frequency was set to a range from 30 Hz to 4 kHz, and the exploded rating was set to 7. Therefore, each of the extracted wavelet features had seven bands of information and data. To find the optimal parameters, we compared the differences between the calculated wavelet basis functions and the results of the decomposed frequency bands. This generated a considerably large amount of data. In general, analysis of variance (ANOVA) can be considered as a Z-test extension of multiple sets. In this study, ANOVA was used to test the significances of the differences among the wavelet basis functions associated with DTW from swing cycle signals. The F-values and critical values of all wavelet bases were calculated and assessed for significant differences.
The F-values for the control and experimental groups were compared with respect to a control threshold determined from a look-up table. The maximum F-value was observed in E2 at TPMCL. For a swing cycle of 2 s, the F-value remained below the critical value. Regardless of the presence of an ACL injury, the six wavelet basis functions of the collected signals did not differ significantly, with little change in the observed signals.
3.3. Wavelet Coefficient Band Comparison
According to decomposition and the researched range of the signal level, the seven bands associated with the wavelet coefficients could be distinguished between 31.25 Hz and 4 kHz. To further determine the differences in the frequency bands of the signals, the samples of the control and experimental groups were compared using DTW calculation results with wavelet coefficients for the two limbs for each decomposition. The differences in the two samples were assessed with the Z-test.
We calculated the average values of TPMCL, TPACL, and TPLCL for the experimental and control groups in various signal bands using a 4-s cycle and compared them; moreover, we compared the two groups to determine the differences in the Symlet-7 coefficients derived for injured and healthy limbs. The results are presented in Figure 2.
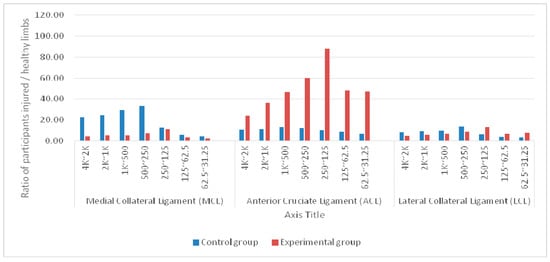
Figure 2.
Average differences in signal bands at the medial collateral ligament (MCL), anterior cruciate ligament (ACL), and lateral collateral ligament (LCL) sensing points of injured and healthy limbs between control (n = 27) and experimental (n = 38) groups before surgery.
In the control group, the TPMCL value was significantly greater than the TPACL and TPLCL values at 250 Hz to 4 kHz. The largest difference occurred between 250 and 500 Hz. The greatest difference between the wavelength coefficients of the two limbs was 306%. The TPACL value was greater than the TPMCL and TPLCL values in the two bands under 125 Hz. Overall, the differences in the wavelet coefficients of the three sensing points of the two limbs were between 112% and 306%.
In the experimental group, the TPACL value was significantly greater than the TPMCL and TPLCL values in the seven frequency bands. The lower the frequency, the greater the difference. The differences in the bands ranged from 490% to 1694%.
The two samples had significant differences in all data levels of the groups. The data level of the control group was significantly greater than that of the experimental group, indicating that physiological differences exist between a limb with injured knee-joint ligaments and a healthy limb.
The differences between the participants without ACL injury and those with ACL injury were assessed using the sound signal wavelet coefficients. In this study, none of the patients had LCL or MCL injury. The TPMCL and TPLCL values had significantly lower variations compared with the TPACL values. Therefore, to reduce the amount of data to be processed, samples involving patients with single-limb ACL injury were observed using the TPACL sensing point.
3.4. Swing Angles in Analyses of Sound Changes
To observe the swing angle and the variations in sound signals, we used a six-axis inertial measurement unit to capture angle signals. In both the experimental and control groups, the knee joints were assessed at the ACL sensing point. The swing cycle was 4 s. Patients with left-knee ACL rupture exhibited the maximum amplitude in the sound signal change generated when the knee joint movement was changed from flexion to extension (0–90°); the actual changes in angle were 30–90°. Bending from extension back to flexion (90–0°) also affected the amplitude. For the experimental group, the patients’ right knees were not diagnosed as ACL rupture. In accordance with the signal waveform, the signal amplitude was most obvious during the knee movement from flexion to extension. The amplitude variations from extension to flexion were smaller.
When the sound signals are being recorded, the maximum angle of action may be limited, e.g., when the patient cannot fully extend the knee and has a maximum angle of 60° as opposed to 90°. Thus, the maximum bending angle of the joint can also be captured using the swing-angle measurement described. As such, the complete bending angle variation of the injured knee joint can be determined before and after treatment.
3.5. Ligament after Recovery Assessment
The collected data were divided into control group data (C1–C27) and experimental group data (E1–E38). Table 1, Table 2 and Table 3 list the average data from the two groups. Similar to the results obtained before ligament surgery, the postoperative values derived at TPMCL and TPLCL revealed significantly lower variation, compared with the average value derived at TPACL. The average value of the experimental group was significantly greater than that of the control group. The highest level of this difference was nearly 10.1 times, whereas the lowest was approximately 2.6 times. The sound signals of the two limbs were comparable after ACL reconstruction. Thus, the wavelet coefficients derived through DTW can serve as a basis for assessing postoperative recovery.

Table 1.
Object average data of medial collateral ligament between the control and experimental groups.
Table 2.
Object average data of anterior cruciate ligament between the control and experimental groups.
Table 3.
Object average data of lateral collateral ligament between the control and experimental groups.
In both the experimental and control groups, the knee wavelet coefficients derived at TPMCL, TPACL, and TPLCL were compared at 1 month, 2 months, 3 months, 6 months, and 1 year postoperatively. Figure 3, Figure 4, Figure 5 and Figure 6 present the average differences in the knee wavelet coefficients for each band.
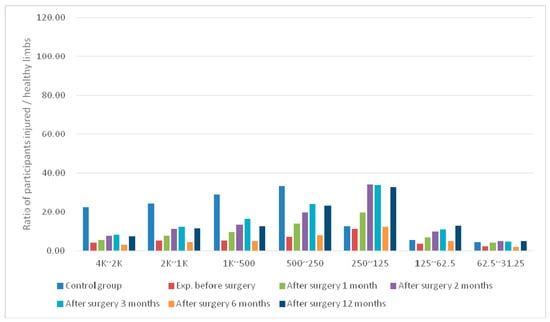
Figure 3.
Average differences in signal bands at the MCL sensing point of postoperative knees in the experimental group.
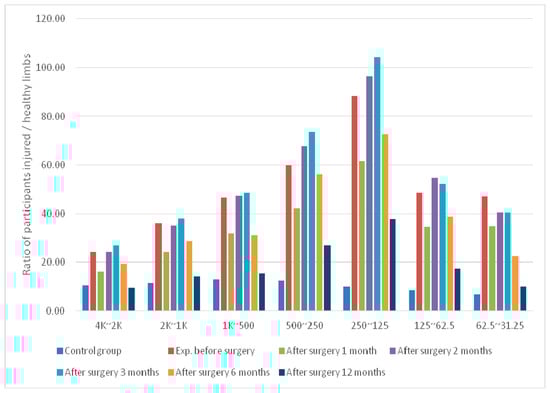
Figure 4.
Average differences in signal bands at the ACL sensing point of postoperative knees in the experimental group.
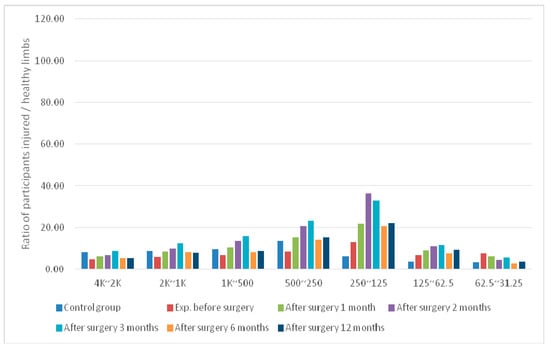
Figure 5.
Average differences in signal bands at the LCL sensing point of postoperative knees in the experimental group.
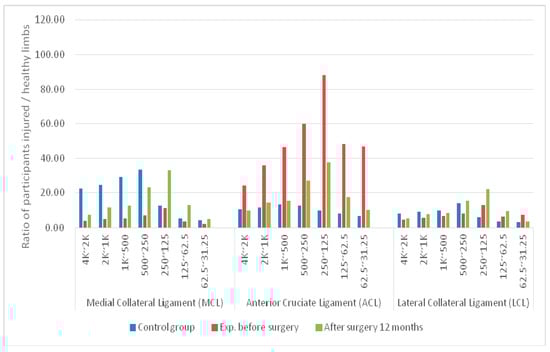
Figure 6.
Average differences in signal bands at the MCL, ACL, and LCL sensing points of two limbs between control and experimental groups before surgery and 1 year after surgery.
For the experimental group at TPMCL, the mean difference in the knee wavelet coefficient derived before surgery increased nearly two-fold at 1 month postoperatively. One year after surgery, the wavelet coefficient difference of the bands had increased to 0.74–2.44.
For the experimental group at TPACL, the mean difference in the knee wavelet coefficients before surgery was significantly lower (1.67 times) than that at 1 month postoperatively. However, the differences in the bands increased after 2–3 months postoperatively. The differences in the wavelet coefficients at 1 year postoperatively had decreased to a value similar to that obtained 1 month after surgery. The values decreased by at least 2.74-fold compared with those derived before surgery.
For the experimental group, the mean difference in the wavelet coefficients at TPLCL decreased slightly compared with those at 1 month postoperatively. The difference increased at 3 months and 1 year postoperatively. The values decreased by 1.1-fold compared with the difference in bands before surgery.
Tissues form a normal link between the bones after ACL reconstruction surgery to reduce the rate of wear and tear between the bones. As such, the analysis results described here can be used as an indicator of the degree of ligament stabilization during recovery. Additionally, the results revealed that the differences in the signal performance of the injured limb gradually decreased with recovery. After 1 month postoperatively, the difference decreased rapidly. This was attributed to healing of the surgical wound. Internal residual water and blood secretions have a similar lubricating function and reduce the coefficient of friction. The difference increased slightly, then gradually stabilized over time. Thus, the screening tool presented in this work shows great potential in its ability to monitor the rehabilitation progression following treatment/surgery of the knee joint. Here we present our preliminary results. Further testing of this tool by professionals in the field is required.
4. Conclusions and Future Work
The purpose of this study was to develop an assessment tool to enable clinicians to monitor knee injury rehabilitation progression in patients. This tool is currently available for patients with a single ACL injury and involves sound signal recording of the knee joint, signal processing, calculation, and statistical analyses. As indicated by the actual verification processes conducted by Z-test analyses, the difference between 2-s and 4-s swing cycles was not significant. The 2-s swing cycle involved swinging at a pace that was too fast to cause friction or noise; thus, we recommend using a 4-s swing cycle. In this research, we compared six commonly used wavelet basis functions with ANOVA; significant differences were found in the sound signals of the lower limb when the movement changed from flexion to extension by a change in the swing angle from 30° to 90°.
Our preliminary results demonstrate that the proposed approach produces significant signal variations at the ACL measurement location (TPACL); this was especially evident with swing cycles conducted within the 4-kHz band of 1–7 wavelet coefficients. Thus, TPACL evaluation provides a preliminary assessment of the rehabilitation progression following ACL injury and treatment. Additionally, this tool is expected to be applicable to other joint disorders and their treatments.
Author Contributions
C.C.T., C.H.L. and T.F.L. developed the research contents based on the analysis and simulations and drafted the manuscript. Y.C.W, M.C.C. and S.W.C. provided academic feedback on the study and revised the manuscript. W.L.Y. directed the research process and supervised the overall work. All authors read and approved the final manuscript.
Funding
The authors acknowledge that this research was sponsored by the Chang Gung Memorial Hospital Joint Research Program funding (CMRPG3E1701, IRB 104-3646B).
Acknowledgments
Wen-Ling Yeh and Chiu-Ching Tuan made equal contributions to the manuscript. This manuscript was edited by Wallace Academic and Textcheck Editing.
Conflicts of Interest
The authors declare no conflicts of interest.
References
- Boden, B.P.; Dean, G.S.; Feagin, J.A., Jr.; Garrett, W.E., Jr. Mechanisms of anterior cruciate ligament injury. Orthopedics 2000, 23, 573–578. [Google Scholar] [CrossRef] [PubMed]
- Waldén, M.; Hägglund, M.; Magnusson, H.; Ekstrand, J. Anterior Cruciate Ligament Injury in Elite Football: A Prospective Three-cohort Study. Knee Surg. Sports Traumatol. Arthrosc. 2011, 19, 11–19. [Google Scholar] [CrossRef] [PubMed]
- Malinzak, R.A.; Colby, S.M.; Kirkendall, D.T.; Yu, B.; Garrett, W.E. A Comparison of Knee Joint Motion Patterns between Men and Women in Selected Athletic Tasks. Clin. Biomech. 2001, 16, 435–445. [Google Scholar] [CrossRef]
- Zaffagnini, S.; Grassi, A.; Marcheggiani Muccioli, G.M.; Tsapralis, K.; Ricci, M.; Bragonzoni, L.; Della Villa, S.; Marcacci, M. Return to sport after anterior cruciate ligament reconstruction in professional soccer players. Knee 2014, 3, 731–735. [Google Scholar] [CrossRef] [PubMed]
- Malanga, G.A.; Andrus, S.; Nadler, S.F.; McLean, J. Physical Examination of the Knee: A Review of the Original Test Description and Scientific Validity of Common Orthopedic Tests. Arch. Phys. Med. Rehabil. 2003, 84, 592–603. [Google Scholar] [CrossRef] [PubMed]
- Boni, D.M.; Herriott, G.E. Hamstring tendon graft for anterior cruciate ligament reconstruction. AORN J. 2002, 76, 610–615. [Google Scholar] [CrossRef]
- Lephart, S.M.; Perrin, D.H.; Fu, F.H.; Gieck, J.H.; McCue, F.C.; Irrgang, J.J. Relationship Between Selected Physical Characteristics and Functional Capacity in the Anterior Curciate Ligament-Insufficient Athlete. J. Orthop. Sports Phys. Ther. 1992, 16, 174–181. [Google Scholar] [CrossRef] [PubMed]
- Yu, B.; Garrett, W.E. Mechanisms of non-contact ACL Injuries. Br. J. Sports Med. 2007, 47, 47–51. [Google Scholar] [CrossRef] [PubMed]
- Scanlan, S.F.; Chaudhari, A.M.; Dyrby, C.O.; Andriacchi, T.P. Differences in tibial rotation during walking in ACL reconstructed and healthy contralateral knees. J. Biomech. 2010, 43, 1817–1822. [Google Scholar] [CrossRef] [PubMed]
- Webster, K.E.; Feller, J.A. The Knee Adduction Moment in Hamstring and Patellar Tendon Anterior Cruciate Ligament Reconstructed knees. Knee Surg. Sports Traumatol. Arthrosc. 2012, 20, 2214–2219. [Google Scholar] [CrossRef] [PubMed]
- Zabala, M.E.; Favre, J.; Scanlan, S.F.; Donahue, J.; Andriacchi, T.P. Three-dimensional Knee Moments of ACL Reconstructed and Control Subjects during Gait, Stair Ascent, and Stair Descent. J. Biomech. 2013, 46, 515–520. [Google Scholar] [CrossRef] [PubMed]
- Akhpashev, A.A.; Novikova, L.V.; Agzamov, D.S.; Orudzhev, F.K. The isokinetic evaluation of the knee joint function following the autoplastic correction of its anterior cross-shaped ligament. Vopr. Kurortol. Fizioter. Lech. Fiz. Kult. 2016, 93, 38–41. [Google Scholar] [CrossRef] [PubMed]
- Drapsin, M.; Lukac, D.; Rasovic, P.; Drid, P.; Klasnja, A.; Lalic, I. Isokinetic profile of subjects with the ruptured anterior cruciated ligament. Vojnosanit. Pregl. 2016, 73, 631–635. [Google Scholar] [CrossRef] [PubMed]
- Jacopetti, M.; Pasquini, A.; Costantino, C. Evaluation of strength muscle recovery with isokinetic, squat jump and stiffness tests in athletes with ACL reconstruction: A case control study. Acta Biomed. 2016, 87, 76–80. [Google Scholar] [PubMed]
- Czaplicki, A.; Kuniszyk-Jóźkowiak, W.; Jaszczuk, J.; Jarocka, M.; Walawski, J. Using the discrete wavelet transform in assessing the effectiveness of rehabilitation in patients after ACL reconstruction. Acta Bioeng. Biomech. 2017, 19, 139–146. [Google Scholar] [PubMed]
- Berschin, G.; Sommer, B.; Behrens, A.; Sommer, H.M. Whole Body Vibration Exercise Protocol versus a Standard Exercise Protocol after ACL Reconstruction: A Clinical Randomized Controlled Trial with Short Term Follow-Up. J. Sports Sci. Med. 2014, 13, 580–589. [Google Scholar] [PubMed]
- Boer, B.C.; Hoogeslag, R.A.G.; Brouwer, R.W.; Demmer, A.; Huis, R.M. Self-reported functional recovery after reconstruction versus repair in acute anterior cruciate ligament rupture (ROTOR): A randomized controlled clinical trial. BMC Musculoskelet. Disord. 2018, 19, 127. [Google Scholar] [CrossRef] [PubMed]
- Eraslan, A.; Ulkar, B. Glucosamine supplementation after anterior cruciate ligament reconstruction in athletes: A randomized placebo-controlled trial. Res. Sports Med. 2015, 23, 14–26. [Google Scholar] [CrossRef] [PubMed]
- Qi, Y.; Fan, Y.; Sun, H. Clinical Study of Internal Tension-Relieving Technique in Arthroscopic Assisted Anterior Cruciate Ligament Reconstruction. Zhongguo Xiu Fu Chong Jian Wai Ke Za Zhi. 2016, 30, 138–142. [Google Scholar] [PubMed]
- Aliyev, R. Additive Effects of Deep Oscillation in Rehabilitation after Anterior Cruciate Ligament Reconstruction. Physikalische Medizin Rehabilitationsmedizin Kurortmedizin 2014, 24, 183–190. [Google Scholar]
- Ogrodzka-Ciechanowicz, K.; Czechowska, D.; Chwala, W.; Slusarski, J.; Gadek, A. Stabilometric indicators as an element of verifying rehabilitation of patients before and after reconstruction of anterior cruciate ligament. Acta Bioeng. Biomech. 2018, 20, 101–107. [Google Scholar] [PubMed]
- Mu, T.; Nandi, A.K.; Rangayyan, R.M. Strict 2-surface Proximal Classification of Knee-joint Vibroarthrographic Signals. In Proceedings of the 2007 29th Annual International Conference of the IEEE Engineering in Medicine and Biology Society, Lyon, France, 22–26 August 2007; pp. 4911–4914. [Google Scholar]
- Rangayyan, R.M.; Wu, Y. Analysis of Vibroarthrographic Signals with Features Related to Signal Variability and Radial-basis Functions. Ann. Biomed. Eng. 2009, 37, 156–163. [Google Scholar] [CrossRef] [PubMed]
- Umapathy, K.; Krishnan, S. Modified Local Discriminant bases Algorithm and Its Application in Analysis of Human Knee Joint Vibration Signals. IEEE Trans. Biomed. Eng. 2006, 3, 517–523. [Google Scholar] [CrossRef] [PubMed]
- Kim, K.S.; Seo, J.H.; Song, C.G. An Acoustical Evaluation of Knee Sound for Non-invasive Screening and Early Detection of Articular Pathology. J. Med. Syst. 2012, 36, 715–722. [Google Scholar] [CrossRef] [PubMed]
- Yang, S.; Cai, S.; Zheng, F.; Wu, Y.; Liu, K.; Wu, M.; Zou, Q.; Chen, J. Representation of fluctuation features in pathological knee joint vibroarthrographic signals using kernel density modeling method. Med. Eng. Phys. 2014, 36, 1305–1311. [Google Scholar] [CrossRef] [PubMed]
- Tashman, S.; Collon, D.; Anderson, K.; Kolowich, P.; Anderst, W. Abnormal rotational knee motion during running after anterior cruciate ligament reconstruction. Am. J. Sports Med. 2004, 32, 975–983. [Google Scholar] [CrossRef] [PubMed]
- Rangayyan, R.M.; Wu, Y. Analysis of Knee-Joint Vibroarthrographic Signals Using Statistical Measures. In Proceedings of the 20th IEEE International Symposium on Computer-Based Medical Systems, Maribor, Slovenia, 20–22 June 2007; pp. 377–382. [Google Scholar]
- Chi, S.W. Assess Recovery for Postoperative Ligament by Detection of Knee Sound Signals Based on Wavelet Coefficient. Master’s Thesis, National Taipei University of Technology, Taipei, Taiwan, 2015. [Google Scholar]
- Chiang, Y.T.; Lu, C.H.; Tuan, C.C.; Lee, T.F.; Huang, Y.C.; Chen, M.C. Non-invasive Detection of Sound Signals for Diagnosis of Ligament Injuries around Knee based on Mel-frequency Cepstrum. In Proceedings of the 8th International Conference on Advanced Information Technologies, Taichung, Taiwan, 18–19 April 2014; pp. 1940–1949. [Google Scholar]
- Chiang, Y.T. Non-invasive Detection of Knee Sound Signals for Ligament Diagnosis Based on Mel-Frequency Cepstrum. Master’s Thesis, National Taipei University of Technology, Taipei, Taiwan, 2014. [Google Scholar]
- Baczkowicz, D.; Majorczyk, E. Joint motion quality in vibroacoustic signal analysis for patients with patellofemoral joint disorders. BMC Musculoskelet. Disord. 2014, 15, 426. [Google Scholar] [CrossRef] [PubMed]
- Shieh, C.S.; Tseng, C.D.; Chang, L.Y.; Lin, W.C.; Wu, L.F.; Wang, H.Y.; Chao, P.J.; Chiu, C.L.; Lee, T.F. Synthesis of vibroarthrographic signals in knee osteoarthritis diagnosis training. BMC Res. Notes 2016, 9, 352. [Google Scholar] [CrossRef] [PubMed]
- Teague, C.N.; Hersek, S.; Töreyin, H.; Millard-Stafford, M.L.; Jones, M.L.; Kogler, G.F.; Sawka, M.N.; Inan, O.T. Novel Methods for Sensing Acoustical Emissions From the Knee for Wearable Joint Health Assessment. IEEE Trans. Biomed. Eng. 2016, 63, 1581–1590. [Google Scholar] [CrossRef] [PubMed]
- Carey, N. Establishing Pedestrian Walking Speeds. Project Report, Portland State University, ITE Student Chapter. 2005. Available online: https://www.westernite.org/datacollectionfund/2005/psu_ped_summary.pdf (accessed on 2 October 2014).
© 2019 by the authors. Licensee MDPI, Basel, Switzerland. This article is an open access article distributed under the terms and conditions of the Creative Commons Attribution (CC BY) license (http://creativecommons.org/licenses/by/4.0/).