Abstract
Shrimp waste and its charcoal derivatives were evaluated for the removal of crystal violet. Activation was conducted at 500 °C with phosphoric acid at the 1:2 and 1:3 ratios. Activated charcoals were more porous and had a more roughly surface containing mainly C, O, Ca N, and P. Equilibrium adsorption data were fitted using seven kinetic and six isotherms models. Activation created acidic moieties (>4700 µmol/g) and reduced the point of zero charge (<2.5). Freundlich isotherm best described the uptake of the dye onto the adsorbents suggesting a heterogeneous adsorption, whereas the Bangham and Avrami models best described the kinetics of adsorption process. An endothermic and spontaneous physisorption was responsible for the sorption phenomena in most adsorbents. The high removal of crystal violet was attributed to the high ionization capacity of the adsorbent coupled with the high external surface area (>44 m2/g). The best adsorption capacity (208 mg/g) was found for the activated and charred materials, whereas the lowest one (3.9 mg/g) was found for the pyrolyzed material. This research creates the possibility to deal with two environmental problems: (i) the reuse of shrimp waste and (ii) the removal of water pollutants such as crystal violet.
1. Introduction
Different types of dyes are used in various applications such as textiles, ceramics, printing, and paper production. In particular, the textile industry generates large amounts of wastewater containing dye molecules which threats humans and other living organisms [1]. Since dyes possess complex chemical structures they are non-biodegradable [2]. It is estimated that around fourteen thousand metric tons of textile dyes are thrown into the environment each year, causing serious damage to the environment [3]. A special case corresponds to the alkaline dyes. For instance, crystal violet (CV) causes eye irritation and cornea damage upon contact with the eye tissue. Further, CV ingestion generates nausea, vomiting, respiratory distress, diarrhea, and abdominal pain [4]. CV also prevents the penetration of sunlight into the water stream, reducing both the photosynthetic activity and the dissolution of oxygen [3]. The high residence time of CV in water is due to its resistance to physical, chemical, and biological degradation, and hence it is highly harmful for aquatic organisms, since just 1 ppm inhibits the photosynthesis of aquatic plants [4].
Several technologies such as electrochemical treatment, precipitation, ion exchange, reverse osmosis, and evaporation have been reported to remove dyes from water sources. However, the adsorption-based systems are one of the most attractive alternatives due to their easy implementation, versatility, and rapid kinetics [5]. Therefore, many adsorption materials have been studied for the removal of dyes. Carbon nanotubes and graphene are among the preferred adsorbents for removing pollutants from waters [6]. Nevertheless, the use of these adsorbents is inconvenient due to their high production costs. On the contrary, low cost and environmentally friendly activated charcoals can be obtained from lignocellulosic feedstock such as coconut shells and palm seeds, achieving a high carbon content and low amount of ash [7,8]. Likewise, they could also be obtained from other sources such as minerals and lignite.
Activated charcoal is an amorphous material whose main component is carbon, and it is considered macroscopically as an allotropic form of graphite. Activated charcoal has a high surface area, microporous structure, and a heterogeneous surface chemistry, mainly composed of carboxylic, phenol, ketone, quinone, hydroquinone, and aldehyde moieties. The adsorption properties in turn, depend on the source and activation method [9]. The physical or thermal activation can be carried out in presence of water vapor, CO2, or air. Conversely, the chemical activation requires lower temperatures and an activation agent which inhibits the production of undesirable volatile substances.
In recent years, many adsorbents have been obtained from different sources and treatments to remove alkaline dyes such as CV (Table 1). Most of these treatments imply milling, pyrolysis, and chemical methods such as oxidation and polymerization. However, the adsorption capacity of the resulting products varies depending on the source and processing employed. For instance, one of the most successful methods relies on complexation of corn cob with ethylenediaminetetraacetic acid (EDTA) improving the CV adsorption capacity to 185.2 mg g−1 [10]. Another less expensive method employs natural zeolites as effective adsorbents with an adsorption capacity of 177.8 mg g−1 [11]. However, other studies report very low adsorption capacities with zeolites and commercial activated charcoal of 10.7 [12] and <50.1 mg g−1 [13,14]. This suggests that the actual crystalline and chemical composition of the adsorbent impacts the adsorption process. Therefore, it is worthwhile to search for new inexpensive materials for CV adsorption.

Table 1.
Comparison of the adsorption capacities of various adsorbents for crystal violet (CV) dye.
Annually, the world production of crustacean waste ranges from six to eight million tons, being China, Indonesia, Thailand, and India the countries with the highest production rate resulting in a large quantity of shrimp and crabs waste [15]. Thus, the conversion of such waste into activated charcoals could decrease the need for waste disposal, making these materials a value-added product with potential applications for the treatment of polluted water.
Few attempts have been conducted for the adsorption of dyes with shrimp waste. For instance, shell waste was extracted from Penaeus indicus to adsorb the acid blue anionic dye 25 [3]. This adsorption was favored in the small particle size fraction and acidic pH. Another study describes the removal of mixtures of two dyes (direct red 80 and direct blue 71) by shell waste from two different shrimp species (Aristaeomorpha foliacea and Aristeus antennatus) attaining a removal greater than 90% [22]. A similar study reported chitin and chitosan nanowhiskers derived from shrimp waste for the adsorption of crystal violet which was specially favored at alkaline pH [23]. However, comparative studies of raw shrimp waste and its activated charcoals are still pendant. Therefore, it is worthwhile to undertake the study of adsorption kinetics and adsorption isotherms of shrimp waste, its pyrolyzed material and activated charcoals for the removal of pollutants such as crystal violet as compared to a commercial activated charcoal.
2. Materials and Methods
2.1. Preparation of Raw Adsorbent from Shrimp Waste
Shrimp waste was collected from the Pacific coast of Tumaco (Columbia), dried in an oven (Memmert, Schawabach, Germany) at 150 °C for 30 min and milled in a cutting mill (Willey Arthur Thomas Co, Philadelphia, PA, USA). Subsequently, it was depigmented with sodium hypochlorite (15% w/v) for five days, neutralized with 1.0 M HCl, filtered under vacuum, dried at 100 °C, and passed through # 200 mesh (75 μm) sieve. This material was subjected to successive washes with distilled water, followed by sonication at 40 °C for 30 min (Elmasonic E 15H, Elma GmbH & Co, Berlin, Germany) with occasional stirring. The resulting powder was labeled as shrimp waste (SW).
2.2. Pyrolysis of Shrimp Waste
Approximately, 187 g of SW was submitted to pyrolysis at 500 °C in an electric muffle (KSY-6D-16B, Electric Furnace Factory, France) coupled with nitrogen pumping at a rate 2.9 °C/min for 2 h. Subsequently, the pyrolyzed material was passed through a #200 (75 μm) sieve and labeled as a charred material (CM).
2.3. Activation of Shrimp Waste and Charred Material with Phosphoric Acid
SW was mixed with phosphoric acid at a 1:2 ratio followed by pyrolysis conducted under the same conditions described in the pyrolysis process except for conducting a heating time of 1 h. Activated adsorbents were then neutralized with 0.1 N KOH in order to eliminate the residual acid, followed by washings with distilled water and vacuum filtration. Subsequently, the material was tray-dried in an oven at 100 °C for 48 h and passed through #200 mesh sieve. This material was named as AC1. In a separate experimental condition, the same procedure was carried out using the pyrolyzed material (CM) as precursor and activated with phosphoric acid at a 1:3 adsorbent-to-acid ratio and labeled as AC2. Previous studies determined these ratios as optimal for having the highest removal of CV [24].
2.4. Experiments
2.4.1. Physicochemical Characterization of Adsorbents
The moisture content was determined using a moisture balance (OHAUS, MB200, Parsippany, NJ, USA), at 100 °C for 5 min. Bulk density (ρbulk) was obtained on 2 g sample and measuring the volume using a 10 mL graduated glass cylinder (BrecKnell Model MBS-300, Fairmont, WA, USA). True density (ρtrue) was determined by gas pycnometry using a Helium pycnometer (Micromeritics, reference AccuPyC II 1340, Norcross, GA, USA). The total powder porosity was obtained from the equation:
ε = [1 − (ρbulk/ρtrue)] × 100%
The specific surface area (SBET) was found using a sorption system (ASAP 2020 PLUS, Norcross, GA, USA) at relative pressures ranging from 0.02 to 0.25. The samples were degassed for 240 min at 350 °C under vacuum conditions. The pH and conductivity measurements were made on a 5% adsorbent dispersion using a combo digital pH and conductivity meter (EC600, Extech Instruments, Nashua, NH, USA) at room temperature.
2.4.2. Morphology and Elemental Analysis (SEM/EDX)
They were performed using a scanning electron microscope (SEM, Joel 6490LV, Peabody, MA, USA) at an accelerated voltage of 20 kV. Samples were fixed on aluminum sample holders with adhesive tape and coated with a 5 nm gold layer using a vacuum chamber (Desk IV, Denton Vacuum, Moorestown, NJ, USA) operated at 50 mm Hg for 10 min, 300 W, and Ar atmosphere. X-rays were detected by linear surface scanning for 90 s at an accelerated voltage of 15 kV and 10 mm depth of field.
2.4.3. Functional Moieties (Boehm Titration) and Zero Point Charge (PZC) Analyses
Approximately, 0.1 g of each adsorbent was mixed separately with 10 mL of 0.1 M NaOH, 0.05 M Na2CO3, and 0.05 M NaHCO3 solutions to determine the acidic groups. In turn, 0.1 M HCl was used to determine alkaline sites. Solutions were then stirred for 24 h. Subsequently, 5 mL aliquots were taken and filtered with a 0.45 μm filter. The hydroxyl and carbonate groups were titrated with 0.1 M HCl solution using phenolphthalein and bromocresol green as indicators, respectively. Conversely, acidic groups were titrated with 0.05 M NaOH solution employing phenolphthalein as indicator [25].
On the other hand, the zero point charge (PZC) was found dispersing 10 mg of each adsorbent in 10 mL of different aqueous solutions having different pH values (1–3, 5, 6, 8, 10, and 12). The subsequent zeta potential readings were made on a ZetaSizer (Nano-ZS90 nano Series, Malvern Instruments Ltd., Worcestershire, UK) at 633 nm. The quantifications were performed in triplicate at 25 °C. Samples were analyzed between 12 to 16 cycles and 4 mV.
2.4.4. Fourier-Transform Infrared characterization (FT-IR)
Spectra were obtained in a Fourier-transform infrared (FT-IR) spectrophotometer (IRAffinity-1, Shimadzu Corporation, Kyoto, Japan) operated in a range between 4000 and 400 cm−1, 16 scans and a resolution of 4 cm−1. Samples were mixed with KBr in an agate mortar and compressed to pellets using a single tablet press (060804 Compac, Idemec, Itagüí, Columbia).
2.4.5. Equilibrium Adsorption Studies
25 mL of CV at the 3.34 × 10⁻⁵, 1.67 × 10⁻⁵, 8.34 × 10⁻⁶, 3.34 × 10⁻⁶, 1.67 × 10⁻⁶, and 6.68 × 10⁻⁷ M concentrations were employed with 20 mg of adsorbent and 30 rpm for 60 min followed by settling for 60 min. Samples were then centrifuged at 1550 rpm for 15 min and passed through a 0.45 µm filter before each absorbance reading. Tests were carried out at media pH (6.5–7.5) and room temperature (25 °C) in triplicate. The adsorption data were then adjusted to the Langmuir, Langmuir-like, Freundlich, Sips, Redlich-Peterson, and Evolich models. The amount of CV adsorbed was calculated from:
where, C0, and Ce correspond to the initial and equilibrium CV concentration (mg/L), respectively. The Langmuir (Equation (3)) and Langmuir-like isotherms (Equation (4)) assume a surface with homogeneous binding sites, equivalent sorption energies, and no interactions between adsorbed species [26].
where, Ce corresponds to the equilibrium concentration of dye (mg/L); Qe is the quantity of dye adsorbed onto the adsorbent at equilibrium (mg/g); K2 corresponds to the maximum monolayer adsorption capacity of adsorbent (mg/g) which can be correlated with the variation of the suitable area and porosity of the adsorbent; K1 is the Langmuir adsorption constant (L/mg); and C0 corresponds to the initial concentration of CV. RL is a dimensionless equilibrium parameter that explains the favorability of adsorption process. RL is calculated using Equation (5), the adsorption is unfavorable when RL > 1, linear when RL = 1, favorable when 0 < RL < 1, and irreversible when RL = 0. The Freundlich isotherm [27] is an empirical model not limited to monolayer coverage alone, but also describes multilayer adsorption. It is applicable to adsorption processes that occur on heterogonous surfaces showing an exponential distribution of active sites and their energies. The model is expressed as follows:
where, K and 1/n correspond to the adsorption capacity (L/mg) and the adsorption intensity, respectively. The later indicates the relative distribution of the energy and the heterogeneity of the adsorbent sites. N values lower than one designate a cooperative adsorption, whereas values larger than one indicate a more heterogeneity in the surface and a favorable adsorption. Likewise, the Elovich isotherm (Equation (7)) assumes that adsorption increase exponentially with adsorption sites implying a multilayer adsorption [28,29].
where, A and K correspond to the maximum sorption capacity and sorption constant, respectively. Conversely, the Redlich-Peterson isotherm (Equation (8)) is a mix of the Langmuir and Freundlich isotherms. The numerator comes from the Langmuir isotherm and approaches to the Henry region at infinite dilution [30]. Therefore, the mechanism of adsorption does not follow an ideal monolayer adsorption [31]. At high liquid-phase concentrations of the adsorbate, it reduces to the Freundlich equation. It is applicable in either homogenous or heterogeneous systems due to its versatility. The model is expressed as follows:
where, A corresponds to the Redlich-Peterson isotherm constant (Lg−1), B is a constant (Lmg−1), and β is an exponent that lies between zero and one. Similarly, the Sips isotherm (Equation (9)) combines the Langmuir and Freundlich isotherms, altogether. This model predicts adsorption on heterogeneous surfaces, thereby avoiding the limitation of increased adsorbate concentration normally associated with the Freundlich model [32]. Thus, at low adsorbate concentration this model reduces to the Freundlich model, but at high concentration of adsorbate, it predicts the Langmuir model (monolayer adsorption). The model is given by the following expression:
where, N corresponds to the isotherm model constant (Lg−1), N is the Sips isotherm exponent, and K is the Sips isotherm model constant (Lg−1).
Adsorption = 100 * (C0 − Ce)/C0
2.4.6. Adsorption Kinetic Studies
The kinetic study was conducted at 25, 40, and 70 °C by mixing 50 mL of 3 × 10⁻⁵ M CV solution with 10 mg of each adsorbent at 30 rpm, followed by aliquots sampling at 1, 2, 4, 7, 10, 15, 20, 30, and 60 min. Tests were carried out at media pH (6.5–7.5). Samples were then centrifuged at 1550 rpm for 30 min (Precision Scientific CO Ref. 10-T-5, Chicago, IL, USA), passed through a 0.45 μm filter, followed by absorbance measurements at 590 nm using a UV/VIS spectrophotometer (UV5, Mettler Toledo LabX® ready, Lagacher Greifensee, Switzerland). A negative control was carried out with no CV and subjected to the same experimental conditions. The adsorption data were adjusted to the pseudo-first (Lagergren), pseudo-second, and pseudo-third orders, and the Avrami, Bangham, Esquivel, and Weber-Morris models. The pseudo first-order model (Equation (10)) postulates that the speed of occupation of the adsorption sites is related to the number of vacant sites as follows [33]:
where, Qe is the amount of adsorbate removed at equilibrium (mg/g), Qt corresponds to the amount of adsorbate removed (mg/g) at time t (min), and K is the pseudo-first order equilibrium constant (1/min). In contrast, the pseudo-second order adsorption kinetics assumes that the occupation speed of the adsorption sites is proportional to the square of unoccupied active adsorption sites as follows:
where, K corresponds to the pseudo-second order adsorption constant (mg/g/min) [34]. Likewise, the pseudo-third order adsorption model (Equation (12)) is expressed as:
where, K corresponds to the pseudo-third order adsorption constant [35]. The Elovich model is expressed by:
where, Qt corresponds to the quantity of dye adsorbed at time t (mg/g), α is a constant related to chemisorption rate and β is a constant which depicts the extent of surface coverage. The Avrami kinetic model (Equation (14)) has been applied in reaction and crystallization kinetics [36]. This model is expressed as follows:
where, K and n correspond to the Avrami constant and the exponent of time related to the change in mechanism of adsorption, respectively. Further, the Esquivel model (Equation (15)) was expressed by:
where, K corresponds to the Esquivel constant. The non-linear fitting was accomplished using the Statgraphics® Centurion XVI software using the Marquardt’s Percent error function [37]. It is used to analyze the fitting degrees of isotherms and kinetic models with experimental data.
2.4.7. Adsorption Mechanism
Adsorbate pore diffusion activities were investigated using the Bangham and Weber models. The Weber-Morris model (Equation (16)) was determined using the following equation:
where, corresponds to the rate constant for intraparticle diffusion (mg g−1 min−1/2), whereas is a constant that indicates the thickness of the boundary layer. A linear fit suggest that two or more steps govern the adsorption process including intraparticle diffusion. If the plot passes through the origin then intraparticle diffusion is the only rate-limiting step [38]. In addition, the Bangham or also called power model (Equation (17)) is depicted as follows:
where, K is the model constant and α is a constant that is usually less than unity if adsorption kinetic data fit well into a power function model [39].
2.4.8. Thermodynamic Studies
The effect of temperature on the dye adsorption onto the adsorbents was found by the thermodynamic parameter (energy of activation, Ea) that explains the feasibility, spontaneity, and nature of adsorbate-adsorbent interactions applying the Arrhenius model:
where, T corresponds to the temperature, R is the gas constant, and K is obtained from the best kinetic model. A plot of lnK versus 1/T should give a linear plot where Ea and pre-exponential factor (A) can be calculated from the slope and intercept, respectively [40]. These parameters were determined following the same kinetics procedure at three temperatures (25, 40, and 70 °C) and pH of 7.2 using a heating plate coupled with magnetic stirring (Gehaka, MS7-H550-S, São Paulo, Brazil).
3. Results and Discussion
3.1. Characterization of the Adsorbents
Table 2 lists the physical properties and elemental composition of the adsorbents. SW submitted to a direct charring rendered a lowest yield due to pyrolysis of residual low molecular weight sugars, peptides, and amine compounds. It was also expected that pyrolysis released gases such as CO, CO2, H2O, H2, and CH4 [41]. Phosphoric acid acted as an activator which affected the total porosity of the samples. Further, AC2 having an adsorbent-to-phosphoric acid ratio of 1:3 rendered a lower porosity as compared to AC1 having a 1:2 ratio. This indicates that low levels of phosphoric acid are desirable for creating a porous structure in SW. Previous attempts to produce activated charcoals using other activated agents such as NaOH and ZnCl2 failed giving rise to a massive degradation of SW and very low yields (<40%) [24]. Moreover, the pyrolysis and activation processes increased the true density of the adsorbents, but this variable was not reflected in a major increase of bulk density. Therefore, pyrolysis, per se, did not lead to a great increase in total porosity (Table 2), but rather decreased the total pore volume of SW, which was reflected on a lower SBET (Table 3). Further, the commercial material (CAC) showed the lowest density and largest moisture content.
Table 2.
Physical properties and elemental analysis of the adsorbents.
Table 3.
Relationship between moieties, physical properties and CV adsorption.
The pyrolysis process reduced the amount of carbon and triggered the complete disappearance of N, probably due to the formation of volatile compounds such as NO, NO2, and N2O5 [42]. In fact, heating at 500 °C and acidic activation promoted the evolution of H and O from SW to H2O and H2, rather than CO, CO2, and hydrocarbons leading to a net reduction of oxygen [43]. Upon activation, the carbon content slightly increased, whereas the oxygen content was reduced accordingly. These changes are certainly related to breaking of the least stable chemical bonds present in the adsorbents, promoting the removal of some atoms as gaseous compounds and consequently, contributed to the rearrangement of the carbon structure. Interestingly, the acidic activation caused a major increase in the content of phosphorous most probably in form of phosphate moieties, whereas the content of calcium as CaCO3 and CaO was reduced. On the other hand, CAC essentially exhibited carbon and oxygen, and traces of other elements as compared to the shrimp-based adsorbents.
The Boehm titration quantifies functional groups on the surface of each adsorbent based on a selective neutralization using a series of alkalis and acid solutions. These results suggest that acidic moieties prevailed on the surface of most adsorbents except for SW and CM (Table 3). In fact, the process of pyrolysis increased the total alkalinity of SW due to the reduction of surface phenol groups. This phenomenon was more remarkable for CM possibly due to the partial transformation of CaCO3 to CaO. Likewise, a subsequent activation with H3PO4 removed any trace of alkaline functional groups due to the increase in phenol, carboxylic, and phosphoric moieties, especially when the starting material was CM. In fact, the acidity of AC2 was attributed only to the phosphoric and phenol moieties. Further, chemical activation caused a pH decrease and increase in conductivity. This phenomenon is mainly explained by the emerging presence of phosphate and phenol moieties.
Conversely, CAC exhibited phenol and alkaline moieties at a 4:1 ratio, but this adsorbent was less acidic than the activated materials (i.e., AC1 and AC2) due to the lack of phosphate moieties. Thus, CV adsorption in this commercial adsorbent is mostly explained by the largest surface area which in turn was responsible for the large moisture content. On the other hand, the PZC values indicate that all adsorbents have a net negative charge on the particle surface and thus, they are able to interact with the positively charged molecules of CV in several degrees.
SW had an innate high surface area due to the roughly surface composed by proteins, chitin, and minerals. Pyrolysis of SW destroyed this structure once volatile gases such as NO2 were formed resulting in a product with a complete absence of N and a low surface area. This area increased moderately upon acidic activation as occurred for AC2. Likewise, activation of SW also increased the surface area as happened for AC1 suggesting a crucial NO2 role on the formation of a pore structure and hence a higher surface area. Interestingly, CM had the lowest surface area and the highest alkalinity which were reflected in a low CV adsorption. Conversely, the activation treatment increased the acidity of adsorbents rather than the surface area improving CV adsorption. This phenomenon could be explained by two main factors: (a) the high content of acidic moieties (i.e., carboxylic, carbonyl, and phosphate) and (b) an improvement of SBET. In fact, the pyrolyzed product showed approximately half of SW SBET, hence it exhibited a lower CV adsorption. Moreover, functionalization of the SW surface especially with carboxyl and phosphate moieties was essential for enhancing the adsorption capability. In turn, these acidic moieties contributed to the low PZC values. The PZC is the pH value where the net surface charge in the adsorbent particle is neutral. The lower the PZC value, the wider the pH range for the removal of a cationic adsorbate such as CV. Therefore, in a pH media higher than the PZC the adsorbent has a net negative surface charge and it is expected to attract the positively charged CV molecules by electrostatic attractions. Further, adsorbents that did not experience an acidic activation (i.e., SW and CM) showed PZC values larger than 2.0 and therefore, they showed inferior removal efficiencies of 85–95% due to a lower ability for creating electrostatic interactions with CV.
At neutral pH CV (pKa1 = 5.31; pKa2 = 8.64) is partially ionized and at this pH the adsorption process is still influenced by the negative surface charge of the adsorbents. This suggests that CV adsorption was governed by a physical process, where hydrogen bonds and π-π interactions seems to prevail.
The morphological features of the adsorbents are shown in Figure 1. As compared to the raw SW, CM had a rougher surface, and upon acidic activation the surface becomes more eroded and rougher showing big holes and cavities with tiny lumps. In fact, acidic activation of SW and CM increased the carbon and phosphorous content resulting in gas release and breaking of C-O-C and C-C bonds leading to the formation of a microporous structure. Further, the CM sample exhibited crystalline CaO particles on the surface and showed tiny mesopores (black dots) which contributed to the resulting low SBET. On the other hand, CAC exhibited a rough surface mainly formed by micropores.
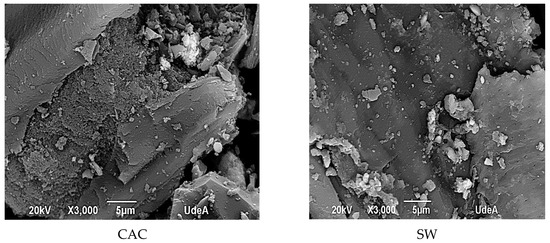
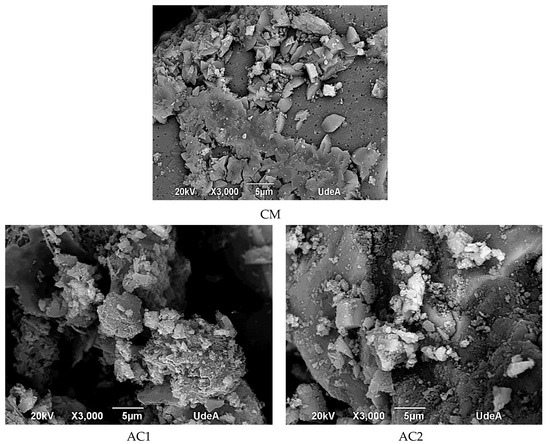
Figure 1.
Surface characteristics of the adsorbents.
3.2. FT-IR Characterization
Figure 2 depicts the FT-IR spectra of the adsorbents. SW shows bands at 3400 cm−1 and 3255 cm−1 attributed to OH and NH2 stretching, respectively. Further, the bands at 2900 cm−1, 2918 cm−1, and 2850 cm−1 are ascribed to CH symmetric stretching. On the other hand, the signal at 1652 cm−1 is attributed to C = O stretching from the N-acetyl glucosamine subunits of chitin. Further, the signal at 1560 cm−1 is attributed to the in-plane deformation of the secondary amide of the acetylamine group. Other bands at 1423 cm−1 and 1311 cm−1 are due to the CH deformation and flexion of CH2. Bands at 1064 cm−1, 870 cm−1, and 713 cm−1 corresponds to C-O-C ring stretching (chitin ring), glycosidic bond stretching, and out-of-plane -OH stretching, respectively. The bands between 400 and 700 cm−1 are due to C-C stretching. The elimination of proteins by pyrolysis was confirmed by the absence of a signal at 1560 cm−1. Further, bands at 1419 cm−1 and 1056 cm−1 were amplified due to the CH deformation and C-O-C ring stretching vibrations, respectively [44]. In general, acidic activation produced changes in the adsorption bands between 900 and 1400 cm−1 due to C-H vibrations and loss of oxygen on the surface of the adsorbents. Further, the emerging band at 1100 cm−1 is ascribed to the incorporation of the new phosphate moiety. Interestingly, bands around the region of 1050–1070 cm−1 decreased upon activation of SW. In fact, these bands completely disappeared when the pyrolyzed sample (CM) was activated with phosphoric acid and a new band at 1100 cm−1 appeared. Further, a small signal at 1625–1641 cm−1 emerged due to the C = O stretching possibly attributed to ketones, aldehydes, lactones, or carboxylic acids formed during combustion [45].
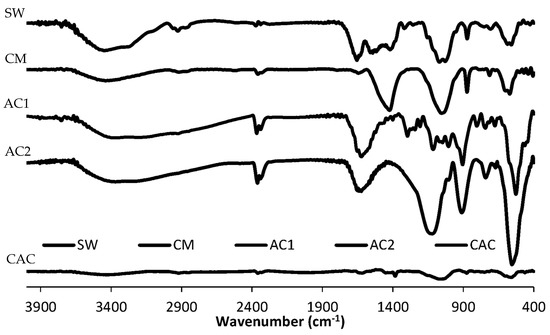
Figure 2.
Fourier-transform infrared (FT-IR) spectra showing the effect of pyrolysis and acidic activation on shrimp waste.
Likewise, activated charcoals (AC1 and AC2) showed a wide band around 3300 cm−1 corresponding to the -OH stretching vibration attributed to the presence of carboxylic, phenolic, and alcohol groups. This signal is very small in magnitude in the activated charcoals due to the action of phosphoric acid. This finding agrees with the decrease of O in the activated materials as described in the elemental analysis (Table 1). Furthermore, the acidic activation caused the absence of the band at 2920 cm−1 attributed to C–H stretching of aliphatic carbon, but created a strong band at ~900 cm−1 ascribed to the glycoside bond stretching. Further, the peak at 1630 cm−1 corresponds to aromatic C = C and suggests the existence of aromatic rings in the activated charcoals.
On the other hand, CAC shows bands at 3420 cm−1 due to OH stretching, adsorbed water, or hydrogen bonds interaction of OH groups derived from alcohols and phenols. The signals at 2918 cm−1 and 2848 cm−1 are attributed to symmetric stretching of CH. The signal at 1620 cm−1 can be assigned to C=O and C-O stretching of phenolic esters, carboxylic acids or conjugated ketone structures.
3.3. Adsorption Kinetics and Adsorption Isotherms
Table 4 lists the adsorption kinetics parameters where the Avrami and Bangham models exhibited the best fit to the data (r2 > 0.9942) (Figure 3a,b). In contrast, other kinetic models did not show a good fit to the experimental data. CM and CAC showed the lowest and largest magnitude of adsorption, respectively, as shown by their Qe and n values. Likewise, the predicted Qe values were very close to the experimental data as seen by the Avrami model. Further, CAC and CM revealed the largest and lowest magnitude of CV interaction with the sorption sites as resulted from the “n” values. Although this model was initially developed to follow the progress of chemical reactions and crystallization processes, this study proves that could be applied in adsorption processes taking place with multiple mechanisms. Likewise, the Bangham model indicates that pore diffusion mechanism is one of those steps taking place during the adsorption process.
Table 4.
Adsorption kinetic parameters of CV.
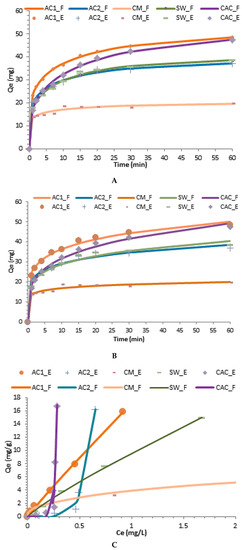
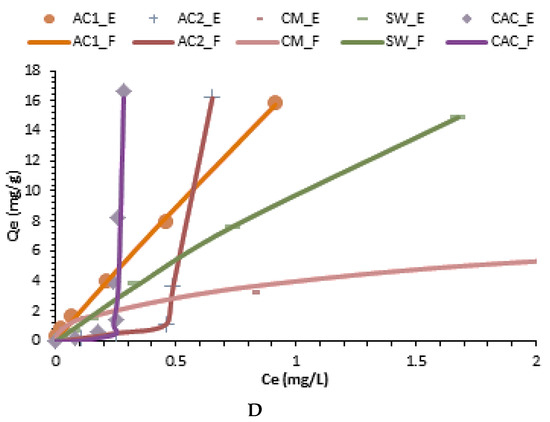
Figure 3.
Best kinetic and isotherm fitting models for crystal violet adsorption. (A) Banghan model; (B) Avrami model; (C) Freundlich model; (D) Langmuir-like model; E and F subscripts indicate experimental and fitted data, respectively.
On the other hand, the adsorption isotherms parameters at equilibrium are listed in Table 5 and Figure 3c,d proved that CAC, AC2, and CM had a good fit to the Freundlich model, whereas AC1 and SW, presented a good fit to the Langmuirian and combined models. Thus, it is expected in SW a combination of homogeneous and heterogeneous areas on the surface with multilayer formation. For this reason, data fitted those hybrid models (i.e., Sips, Evolich and Redlich-Peterson) that combine the assumptions of the Langmuir and Freundlich models. Conversely, the pyrolysis process made the surface mainly heterogeneous and thus CAC, CM, and AC2 samples had a better fit to the Freundlich model. Interestingly, AC1 showed the best fit to the Langmuir-like model and thus, this material follows the assumptions (i) the active adsorption sites are energetically homogeneous, (ii) there is no interaction of CV adhered to the adjacent adsorption sites, (iii) there is a monolayer formation of CV on the AC1 surface, and (iv) the formation of non-polar interactions between the non-polar CV sites and the AC1 surface, resulting in loss of water structure around the non-polar CV sites, generating also hydrophobic bonds with AC1 (Khb). The essential characteristics of the Langmuir isotherm can be expressed by a dimensionless equilibrium parameter, also known as the separation factor (RL) which rendered values lower than 0.21 indicating a favorable adsorption process. However, this result is more significant for AC1 and SW which rendered a Langmurian and combined behavior. Conversely, it is expected in CAC, AC2, and CM the presence of energetically heterogeneous adsorption sites with the formation of several layers of CV on their surface. Thus, sites having a higher energy are occupied first, as well as the possible formation of CV multilayers adsorbed on the surface of these adsorbents.
Table 5.
Equilibrium adsorption and thermodynamic parameters for CV on several adsorbents.
The Freundlich model for AC2, CM, and CAC predicts a maximum adsorption capacity of 207.8 mg g−1, 3.9 mg g−1, and 5 × 10⁷, respectively, whereas the same model predicts an adsorption capacity of ~17 and 9.6 mg g−1 for AC1, and SW, respectively. Further, CAC showed the largest value mainly explained by its large SBET. Interestingly, the adsorption capacity of AC2 was higher than those reported using modified rice husk (24.5 mg g−1) [46], chitosan nanowhiskers (59.5 mg g−1) [23], corn cob complexes (59.5 mg g−1) [10], and other adsorbents listed in Table 1.
Ea was calculated from of the Avrami k constant. It is defined as the minimum energy needed for adsorption to take place. It is accepted that when this value is lower than 17.6 kJ/mol the process is designated as physisorption, whereas higher values are characteristic of chemisorption [47]. Further, adsorbents showed a decrease in the rate constant (K) as the temperature increased hindering the interaction forces between the surface functional groups of these adsorbents and CV. Further, the increase in temperature increased the number of collisions, resulting in desorption rather than adsorption mostly favoring the diffusion rate of the adsorbate across the external boundary layer. Further, a low Ea was associated with a low PZC and a large ionization degree allowing for a rapid and spontaneous physisorption process, especially in AC1 and AC2. Interestingly, CM presented the highest Ea suggesting a chemisorption process although further thermodynamics studies need to be conducted in order to corroborate this finding. Thus, it has been reported a chemisoprtion process (Ea of 32.2 kJ/mol) only for the adsorption of cadmium (II) on chitosan extracted from the Penaus monodon shells [48].
K1 (mL/mg) and K2 (mg/g), affinity and capacity constants of the adsorption sites, respectively; KHB (mg/g), hydrophobic binding constant which represents hydrophobic bonds between the non-polar adsorbate sites and the surface of the adsorbent; Kf, maximum adsorption capacity constant (mg/g); and n affinity constant of the adsorbent. Other parameters are explained in the experimental section; adsorbent load: 20 mg. temperature, 25 °C. The pH employed was 7.5, 7.2, 6.5, 7.0, and 7.2 for SW, CM, AC1, AC2, and CAC, respectively.
3.4. Adsorption Mechanism
The adsorption power of the materials submitted to acid activation is attributed to their complex surfaces, being composed of hydrophobic regions (basal carbon surface) and a wide variety of Polar Regions containing oxygen functional groups. Thus, CV was either adsorbed on a particular moiety on the surface or non-specifically on the non-polar surface of the basal carbon by hydrophobic interactions. As the energy applied to the system increased, the structuring of the hydrogen bonds formed breaks down due to the increase in molecular movement and thus the kinetics rate decreased. Conversely, CAC is expected to interact with CV mainly by hydrophobic bonds, followed by hydrogen bonding and ion-ion interactions. In this commercial material the large surface area also played a major role in adsorption.
4. Conclusions
Shrimp waste, and its activated charcoals were successful adsorbents for CV. The heat treatment (500 °C under N2 atmosphere) and activation with phosphoric acid eased the formation of mainly acidic moieties (phosphate) on the surface and caused the volatilization of N2. The low PZC of the adsorbents (<2.5) allowed for the formation of electrostatic attractions with CV and hence eased the adsorption process. The values (<17.6 kJ/mol) confirmed an endothermic physisorption process in all adsorbents except for CM. Increasing temperature led to a reduced adsorption capacity. These adsorbents can be a viable alternative to produce filters for the removal of basic dyes in wastewater treatment plants of textile industries. They also contributed to the solution of two environmental issues: (i) the removal of water pollutants and (ii) the reuse of this abundant crustacean waste.
Author Contributions
J.R. designed the research project, acquired the funding and wrote the original draft preparation, D.S. collected samples, conducted experiments, and analyzed samples, J.S.-A. and A.M. collected samples and conducted experiments; R.A.T.-P. conceptualized, reviewed, and edited the paper.
Funding
The authors are grateful to Colciencias for providing the financial resources for the execution of this study through the Grant No. 111571551545 and contract No. 036-2016. Authors thank CODI for their sustainability strategy 2018–2019 of University of Antioquia.
Conflicts of Interest
The authors declare no conflict of interest. The funders had no role in the design of the study; in the collection, analyses, or interpretation of data; in the writing of the manuscript, or in the decision to publish the results.
References
- de Menezes, E.W.; Lima, E.C.; Royer, B.; de Souza, F.E.; dos Santos, B.D.; Gregório, J.R.; Costa, T.M.H.; Gushikem, Y.; Benvenutti, E.V. Ionic silica based hybrid material containing the pyridinium group used as an adsorbent for textile dye. J. Colloid Interface Sci. 2012, 378, 10–20. [Google Scholar] [CrossRef]
- Yemendzhiev, H.; Alexieva, Z.; Krastanov, A. Decolorization of synthetic dye reactive blue 4 by mycelial culture of white-rot fungi trametes versicolor 1. Biotechnol. Biotechnol. Equip. 2009, 23, 1337–1339. [Google Scholar] [CrossRef]
- Daneshvar, E.; Sohrab, M.S.; Kousha, M.; Bhatnagar, A.; Aliakbarian, B.; Converti, A.; Norrström, A. Shrimp shell as an efficient bioadsorbent for acid blue 25 dye removal from aqueous solution. J. Taiwan Inst. Chem. Eng. 2014, 45, 2926–2934. [Google Scholar] [CrossRef]
- Otero, M.; Rozada, F.; Calvo, L.F.; García, A.I.; Morán, A. Elimination of organic water pollutants using adsorbents obtained from sewage sludge. Dyes Pigments 2003, 57, 55–65. [Google Scholar] [CrossRef]
- Anastopoulos, I.; Kyzas, G.Z. Composts as biosorbents for decontamination of various pollutants: A review. Water Air Soil Pollut. 2015, 226, 61. [Google Scholar] [CrossRef]
- Xu, J.; Cao, Z.; Zhang, Y.; Yuan, Z.; Lou, Z.; Xu, X.; Wang, X. A review of functionalized carbon nanotubes and graphene for heavy metal adsorption from water: Preparation, application, and mechanism. Chemosphere 2018, 195, 351–364. [Google Scholar] [CrossRef]
- Hu, Z.; Srinivasan, M.P.; Ni, Y. Novel activation process for preparing highly microporous and mesoporous activated carbons. Carbon 2001, 39, 877–886. [Google Scholar] [CrossRef]
- González, P. Activated carbon from lignocellulosics precursors: A review of the synthesis methods. characterization techniques and applications. Renew. Sustain. Energy Rev. 2018, 82, 1393–1414. [Google Scholar] [CrossRef]
- Asimbaya, C.; Rosas, N.; Endara, D.; Guerrero, V.H. Obtención de Carbón Activado a partir de Residuos Lignocelulósicos de Canelo. Laurel y Eucalipto. Rev. Politécnica 2015, 36, 24. [Google Scholar]
- Wang, H.; Lai, X.; Zhao, W.; Chen, Y.; Yang, X.; Meng, X. Efficient removal of crystal violet dye using EDTA/graphene oxide functionalized corncob: A novel low cost adsorbent. RSC Adv. 2019, 9, 21996–22003. [Google Scholar] [CrossRef]
- Sarabadan, M.; Bashiri, H.; Mousavi, S.M. Removal of crystal violet dye by an efficient and low cost adsorbent: Modeling, kinetic, equilibrium and thermodynamic studie. Korean J. Chem. Eng. 2019, 36, 1575–1586. [Google Scholar] [CrossRef]
- Kusumastuti, E.; Santosa, S.J. Adsorption of Crystal Violet Dye Using Zeolite. A Synthesized from Coal Fly Ash. IOP Conf. Ser. Mater. Sci. Eng. 2017, 172, 1–9. [Google Scholar]
- Yakout, S.M.; Hassan, M.R.; Abdeltawab, A.A.; Aly, M.I. Sono-sorption efficiencies and equilibrium removal of triphenylmethane (crystal violet) dye from aqueous solution by activated charcoal. J. Clean. Prod. 2019, 234, 124–131. [Google Scholar] [CrossRef]
- Abbas, M.; Harrache, Z.; Trari, M. Removal of gentian violet in aqueous solution by activated. carbon equilibrium, kinetics, and thermodynamic study. Adsorpt. Sci. Technol. 2019, 37, 566–589. [Google Scholar] [CrossRef]
- Cheba, B.A.; Zaghloul, T.I.; EL-Mahdy, A.R. Demineralized crab and shrimp shell power: Cost effective medium for bacillus Sp. R2 growth and chitinase production. Procedia Manuf. 2018, 22, 413–419. [Google Scholar] [CrossRef]
- Mashkoor, F.; Nasar, A.; Inamuddin, I.; Asiri, A.M. Exploring the reusability of synthetically contaminated wastewater containing crystal violet dye using Tectona grandis sawdust as a very low cost adsorbent. Sci. Rep. 2018, 8, 8314. [Google Scholar] [CrossRef]
- Wathukarage, A.; Herath, I.; Iqbal, M.C.M.; Vithanage, M. Mechanistic understanding of crystal violet dye sorption by woody biochar: Implications for wastewater treatment. Environ. Geochem. Health 2019, 41, 1647–1661. [Google Scholar] [CrossRef]
- Radhy, N.D.; Jasim, L.S. Synthesis of Graphene Oxide/Hydrogel Composites and Their Ability for Efficient Adsorption of Crystal Violet. J. Pharm. Sci. Res. 2019, 11, 456–463. [Google Scholar]
- Dandil, S.; Sahbaz, D.A.; Acikgoz, C. High performance adsorption of hazardous triphenylmethane dye-crystal violet onto calcinated waste mussel shells. Water Qual. Res. J. 2019, 54, 249–256. [Google Scholar] [CrossRef]
- Sadraei, R.; Paganini, M.C.; Calza, P.; Magnacca, G. An Easy Synthesis for Preparing Bio-Based Hybrid Adsorbent Useful for Fast Adsorption of Polar Pollutants. Nanomaterials 2019, 9, 731. [Google Scholar] [CrossRef]
- Gupta, T.B.; Lataye, D.H. Removal of crystal violet and methylene blue dyes using acacia nilotica sawdust activated carbon. Indian J. Chem. Technol. 2019, 26, 52–68. [Google Scholar]
- Fabbricino, M.; Pontoni, L. Use of non-treated shrimp-shells for textile dye removal from wastewater. J. Environ. Chem. Eng. 2014, 4, 4100–4106. [Google Scholar] [CrossRef]
- Pedroso, S.D.; Pollon, N.Z.; Nascimento, L.C.; Fátima, A.M.; Luiz, D.G. Preparation of chitin nanowhiskers and its application for crystal violet dye removal from wastewaters. Environ. Sci. Pollut. Res. Int. 2019, 26, 28548–28557. [Google Scholar]
- Suarez, D. Assessment of the Decontaminating Action of Shrimp Exoskeletons and Pyrolyzed Materials to Reduce Their Environmental Impact. Master’s Thesis, University of Antioquia, Medellin, Colombia, 2019; 114p. [Google Scholar]
- Boehm, H.P. Surface oxides on carbon and their analysis: A critical assessment. Carbon 2002, 40, 145–149. [Google Scholar] [CrossRef]
- Langmuir, I. The constitutional and fundamental properties of solids and liquids. J. Am. Chem. Soc. 1916, 38, 2221–2295. [Google Scholar] [CrossRef]
- Freundlich, H.M.F. Over the adsorption in solution. Z. Phys. Chem. 1906, 57, 385–470. [Google Scholar]
- Sureshkumar, M.V.; Namasivayam, C. Adsorption behavior of direct red 12B and rhodamine B from water unto surfactant-modified coconut coir pith. Colloid Surf. A Physicochem. Eng. Asp. 2008, 317, 277–283. [Google Scholar] [CrossRef]
- Aharoni, C.; Ungarish, M. Kinetics of activated chemisorptions. Part I: The non-Elovichian part of the isotherm. J. Chem. Soc. Faraday Trans. 1976, 72, 265–268. [Google Scholar] [CrossRef]
- Davoundinejad, M.; Gharbanian, S.A. Modelling of adsorption isotherm of benzoic compounds onto GAC and introducing three new isotherm models using new concept of adsorption effective surface (AEC). Acad. J. 2013, 18, 2263–2275. [Google Scholar]
- Brouers, F.; Al-Musawi, T.J. On the optimal use of isotherm models for the characterization of biosorption of lead onto algae. J. Mol. Liq. 2015, 212, 46–51. [Google Scholar] [CrossRef]
- Jeppu, G.P.; Clement, T.P. A modified Langmuir-Freundlich isotherm model for simulating pH-dependent adsorption effects. J. Contam. Hydrol. 2012, 129, 46–53. [Google Scholar] [CrossRef]
- Lagergren, S.; Svenska, B.K. On the theory of so-called adsorption of materials, Royal Swed. Acad. Sci. Doc. 1898, 24, 1–13. [Google Scholar]
- Anastopoulos, I.; Kyzas, G.Z. Agricultural peels for dye adsorption: A review of recent literature. J. Mol. Liq. 2014, 200, 381–389. [Google Scholar] [CrossRef]
- Kyzas, G.Z.; Lazaridis, N.K.; Mitropoulos, A.C. Removal of dyes from aqueous solutions with untreated coffee residues as potential low-cost adsorbents: Equilibrium; reuse and thermodynamic approach. Chem Eng J. 2012, 190, 148–159. [Google Scholar] [CrossRef]
- Avrami, M. Kinetics of phase change: Transformation-time relations for random distribution of nuclei. J. Chem. Phys. 1940, 8, 212–224. [Google Scholar] [CrossRef]
- Marquardt, D. An algorithm for least-squares estimation of nonlinear parameters. J. Soc. Ind. Appl. Math. 1963, 11, 431–441. [Google Scholar] [CrossRef]
- Weber, W.J.; Morris, J.C. Kinetics of adsorption on carbon from solution. J. Sanit. Eng. Div. 1963, 89, 31–59. [Google Scholar]
- Antonija, K.; Natlija, V.; Dam, H.; Davor, K. Lignocellulosic materials as dye adsorbents: Adsorption of methylene blue and congo red on brewers spent grain. Croat. Chim. Acta 2018, 91, 53–64. [Google Scholar]
- Kyzas, G.Z.; Matis, K.A. Nanoadsorbents for pollutants removal: A Review. J. Mol. Liq. 2015, 203, 59–168. [Google Scholar] [CrossRef]
- Bastidas, M.; Buelvas, L.; Márquez, M.; Rodríguez, K. Producción de Carbón Activado a partir de Precursores Carbonosos del Departamento del César. Colombia. Inf. Technol. 2010, 21, 87–96. [Google Scholar] [CrossRef]
- Wang, L.; Wang, Z.; Cheng, X.; Zhang, M.; Qin, Y.; Ma, C. In situ DRIFTS study of the NO + CO reaction on Fe-Co binary metal oxides over activated semi-coke supports. R. Soc. Chem. Adv. 2017, 7, 7695–7710. [Google Scholar] [CrossRef]
- Lin, L.; Zhai, S.R.; Xiao, Z.Y.; Song, Y.; AnDa, Q.; Song, X.W. Dye adsorption of mesoporous activated carbons produced from NaOH-pretreated rice husks. Bioresour. Technol. 2013, 136, 437–443. [Google Scholar] [CrossRef]
- Hesas, R.H.; Arami-Niya, A.; Daud, W.M.; Sahu, J.N. Preparation and characterization of activated carbon from apple waste by microwave-assisted phosphoric acid activation: Application in methylene blue adsorption. BioResources 2013, 8, 2950–2966. [Google Scholar]
- Yakout, S.M.; Sharaf El-Deen, G. Characterization of activated carbon prepared by phosphoric acid activation of olive stones. Arab. J. Chem. 2016, 9, S1155–S1162. [Google Scholar] [CrossRef]
- Chakraborty, S.; Chowdhury, S.; Saha, P.D. Adsorption of Crystal Violet from aqueous solution onto NaOH-modified rice husk. Carbohydr. Polym. 2011, 86, 1533–1541. [Google Scholar] [CrossRef]
- Gopi, S.; Pius, A. Enhanced adsorption of crystal violet by synthesized and characterized chitin nano whiskers from shrimp shell. J. Water Process Eng. 2016, 14, 1–8. [Google Scholar] [CrossRef]
- Cahyaningrum, S.E.; Amaria, A. Utilization of penaus monodon shrimp shell waste as adsorbent of cadmium (ii) in water medium. Indones. J. Chem. 2019, 5, 130–134. [Google Scholar] [CrossRef]
© 2019 by the authors. Licensee MDPI, Basel, Switzerland. This article is an open access article distributed under the terms and conditions of the Creative Commons Attribution (CC BY) license (http://creativecommons.org/licenses/by/4.0/).