Article

A Three-Class Classification of Cognitive Workload Based on EEG Spectral Data

by
Małgorzata Plechawska-Wójcik
1,*,
Mikhail Tokovarov
1,
Monika Kaczorowska
1 and
Dariusz Zapała
2
1
Institute of Computer Science, Faculty of Electrical Engineering and Computer Science, Lublin University of Technology, 20618 Lublin, Poland
2
Department of Experimental Psychology, The John Paul II Catholic University of Lublin, 20950 Lublin, Poland
*
Author to whom correspondence should be addressed.
Appl. Sci. 2019, 9(24), 5340; https://doi.org/10.3390/app9245340
Submission received: 9 September 2019 / Revised: 31 October 2019 / Accepted: 30 November 2019 / Published: 6 December 2019
(This article belongs to the Special Issue Signals in Health Care)

Abstract

:
Evaluation of cognitive workload finds its application in many areas, from educational program assessment through professional driver health examination to monitoring the mental state of people carrying out jobs of high responsibility, such as pilots or airline traffic dispatchers. Estimation of multilevel cognitive workload is a task usually realized in a subject-dependent way, while the present research is focused on developing the procedure of subject-independent evaluation of cognitive workload level. The aim of the paper is to estimate cognitive workload level in accordance with subject-independent approach, applying classical machine learning methods combined with feature selection techniques. The procedure of data acquisition was based on registering the EEG signal of the person performing arithmetical tasks divided into six intervals of advancement. The analysis included the stages of preprocessing, feature extraction, and selection, while the final step covered multiclass classification performed with several models. The results discussed show high maximal accuracies achieved: ~91% for both the validation dataset and for the cross-validation approach for kNN model.

1. Introduction

Cognitive workload is defined as a quantitative measure of the amount of mental effort needed to perform a task [1]. In our research, we distinguish the terms “cognitive workload” and “mental fatigue”, whereas mental fatigue is defined as a psychological state related to the loss of work capacity [2] “triggered by prolonged periods of demanding cognitive activity” [3].
Assessment of human mental effort is an important, but not trivial task. Research on cognitive workload gives an opportunity to understand the process of mental fatigue, including analyzing the influence of different complexity tasks on mental effort and concentration level. What is more, estimation of mental effort may be helpful in adjusting learning techniques and cognitive sources, as well as in understanding the human performance of different level tasks and information processing capabilities.
Evaluation of cognitive workload used to be performed with subjective measures, for example, based on interviews or questionnaires, where participants assessed the amount of mental effort they put into a task [4]. These approaches, however, depend on the subjective opinion of participants, gathered on the basis of psychophysiological measurement [5,6] or subjective scales [7], and usually do not assure reliable, comparable results.
An alternative approach covers monitoring the cognitive workload changes with neurophysiological measures such as Galvanic Skin Response (GSR) [8], electroencephalogram (EEG), pupillometry, or cardiogram (ECG) [9,10].
Brain activity measurement was proven to be effective in visualizing cognitive state changes. Widely used approach of cognitive workload level estimation takes advantage of the EEG signals [11]. One of the most popular types of features extracted from EEG signals is power spectrum [12].
According to Klimesch [13] and Andreassi [14], theta (θ) and alpha (α) oscillations are sensitive to task difficulty. More recent results show an increase of theta oscillations in the frontal region and decrease in parietal region [15]. Alpha and theta variations were also analyzed by Putze et al. in their paper [16], where EEG, GSR, and breathing rate were combined to estimate mental fatigue among drivers in a driving simulator performing a secondary cognitive task. Frontal theta power was also proved to be positively related to working memory engagement and attentional control in a study of different difficulty tasks combined with practice [17,18].
Holm et al. [15] proposed the EEG-based measure of the overall brain load. It was determined as a θ(Fz)/α(Pz) ratio, where Fz and Pz are electrodes. In [19] the mental state of individuals was analyzed on the basis of changes in EEG power spectral density, especially in the theta and alpha bands, where the average classification accuracy reached, respectively, 79% and 78%. The classifier applied was based on SVM. The results show that both the alpha and theta powers decrease in central and posterior regions with the increase of the level of difficulty.
Jaquess et al. examined the mental workload during a novel and complex cognitive-motor task with two levels of difficulty, realized by participants over several days [20]. Greater engagement of working memory was correlated with the theta band synchrony. The level of task difficulty was positively related to alpha desynchrony as well as to the theta/alpha ratio. No interaction was found between task difficulty and particular practice days for both the theta and alpha power.
Other approaches propose cognitive workload measurement based on Event Related Potentials (ERPs) and the P300 component [21] or on spatial filters, such as Common Spatial Pattern (CSP) [22]. Di Flumeri et al. presented in their paper [23] a modified version of the LDA algorithm applied to assess drivers’ workload based on EEG alpha and theta bands and Eye-Tracking (ET) data. Authors reached classification performance of about 75%.
Other applied classification techniques applied to the problem of cognitive workload classification are artificial neural networks. In [24] Wilson et al. performed two-class classification based on Artificial Neural Networks (ANNs), achieving 86% of accuracy, whereas in [25], the same authors reported 98.5% accuracy achieved with the model built on EEG data in combination with heart rate, respiration, and eye movement measures. Baldwin et al. applied ANNs [26] for distinguishing among three working-memory classes reaching averaged results of about 85%. However, these results were achieved for subject-specific analysis, where the classifier was trained for each subject and session. Mahmoud et al. in [27] presented a four-class linear classifier, obtaining average classification accuracy equal to 93.4%. However, these results were achieved also separately for each subject.
Other classifications technique applied in the cognitive workload research cover SVM [28] and random forest classifiers [29]. ANNs were also used by Zarjam et al. in [30], where the authors classified seven levels of cognitive workload with features extracted on the basis of wavelet entropy, achieving 83% classification accuracy. In [31], Grimes et al. reported 99% classification accuracy for two classes and 88% for four classes (both results achieved for eight subjects). In [32], Yu et al. presented classification of four levels of cognitive workload with a linear probabilistic support vector machine (LIPSVM) at the level of 87%. Mahmoud et al. in [27] classified four cognitive levels achieving the accuracy equal to 92% using linear classification. The feature extraction procedure was based on statistical features.
The main approach presented in the modern scientific literature is based on subject-specific cognitive workload [33], which is caused by high inter-subject variability of EEG signals. There are many examples of implementing subject-specific classification model for assessment of cognitive workload level in the literature [34,35,36]. Researchers also report higher classification performance for the within subject approach [37,38]. Nevertheless, there is a clear need for developing a universal classifier that would be able to distinguish among several levels of cognitive workload of any person, regardless of external and internal conditions such as the age, time of day, or habits of an examined person. Using data from only one subject does not ensure good generalization, neither for other subjects nor even for other sessions of the same subject in other days and conditions [39]. Developing a subject-independent classifier requires analysis of broader datasets, which allows extracting more universal features, which in consequence can lead to better understanding of the processes occurring in human brain.
As it was previously noted, most of available researches focus on a subject-dependent approach [40,41,42,43,44]. However, the need in subject-independent research has drawn the attention of researchers. Nevertheless, only a few publications presenting subject-independent approach based on classical EEG analysis [33,45,46] can be found.
The literature review (Table 1) revealed that the many researches focus on only two classes of cognitive workload [40,41,42,47]. However, multiclass approach, especially three-class [33,48,49], is gaining popularity. Although some researchers attempt to distinguish amongst more classes, the resulting classification accuracy is usually lower in the case. The literature overview shows that typical number of participants is close to 10 subjects. Eleven participants took part in the presented experiment.
The main aim of the paper was to perform subject-independent evaluation of multilevel cognitive workload, ensuring the best accuracy using possibly lowest number of EEG-based features with the use of classical methods of machine learning, i.e., SVM, kNN, decision trees. Several models of multiclass classification were tested. During the evaluation, several methods of feature selection were applied. The dataset used in the experiment was gathered in accordance with the self-developed data acquisition procedure.
The mentioned classification models were chosen after initial testing of classification accuracy. Such models, such as linear, quadratic discriminant analysis and logistic regression were discarded due to the low values of accuracy, obtained applying these models. Moreover, the literature shows extensive use of classifiers applied in the current research: SVM [40,41,42,50], kNN [50,51,52], decision trees [50,51].
The rest of the paper is structured in the following way. Section 2 presents the experiment structure, where the data acquisition protocol and the equipment applied are described in detail. Section 3 covers the whole process of data processing, starting with preprocessing, including signal filtering and artifact removal, through feature extraction and feature selection, ending with a description of the classification models applied. Section 4 contains the obtained results, whereas the discussion concluding the paper is presented in Section 5.

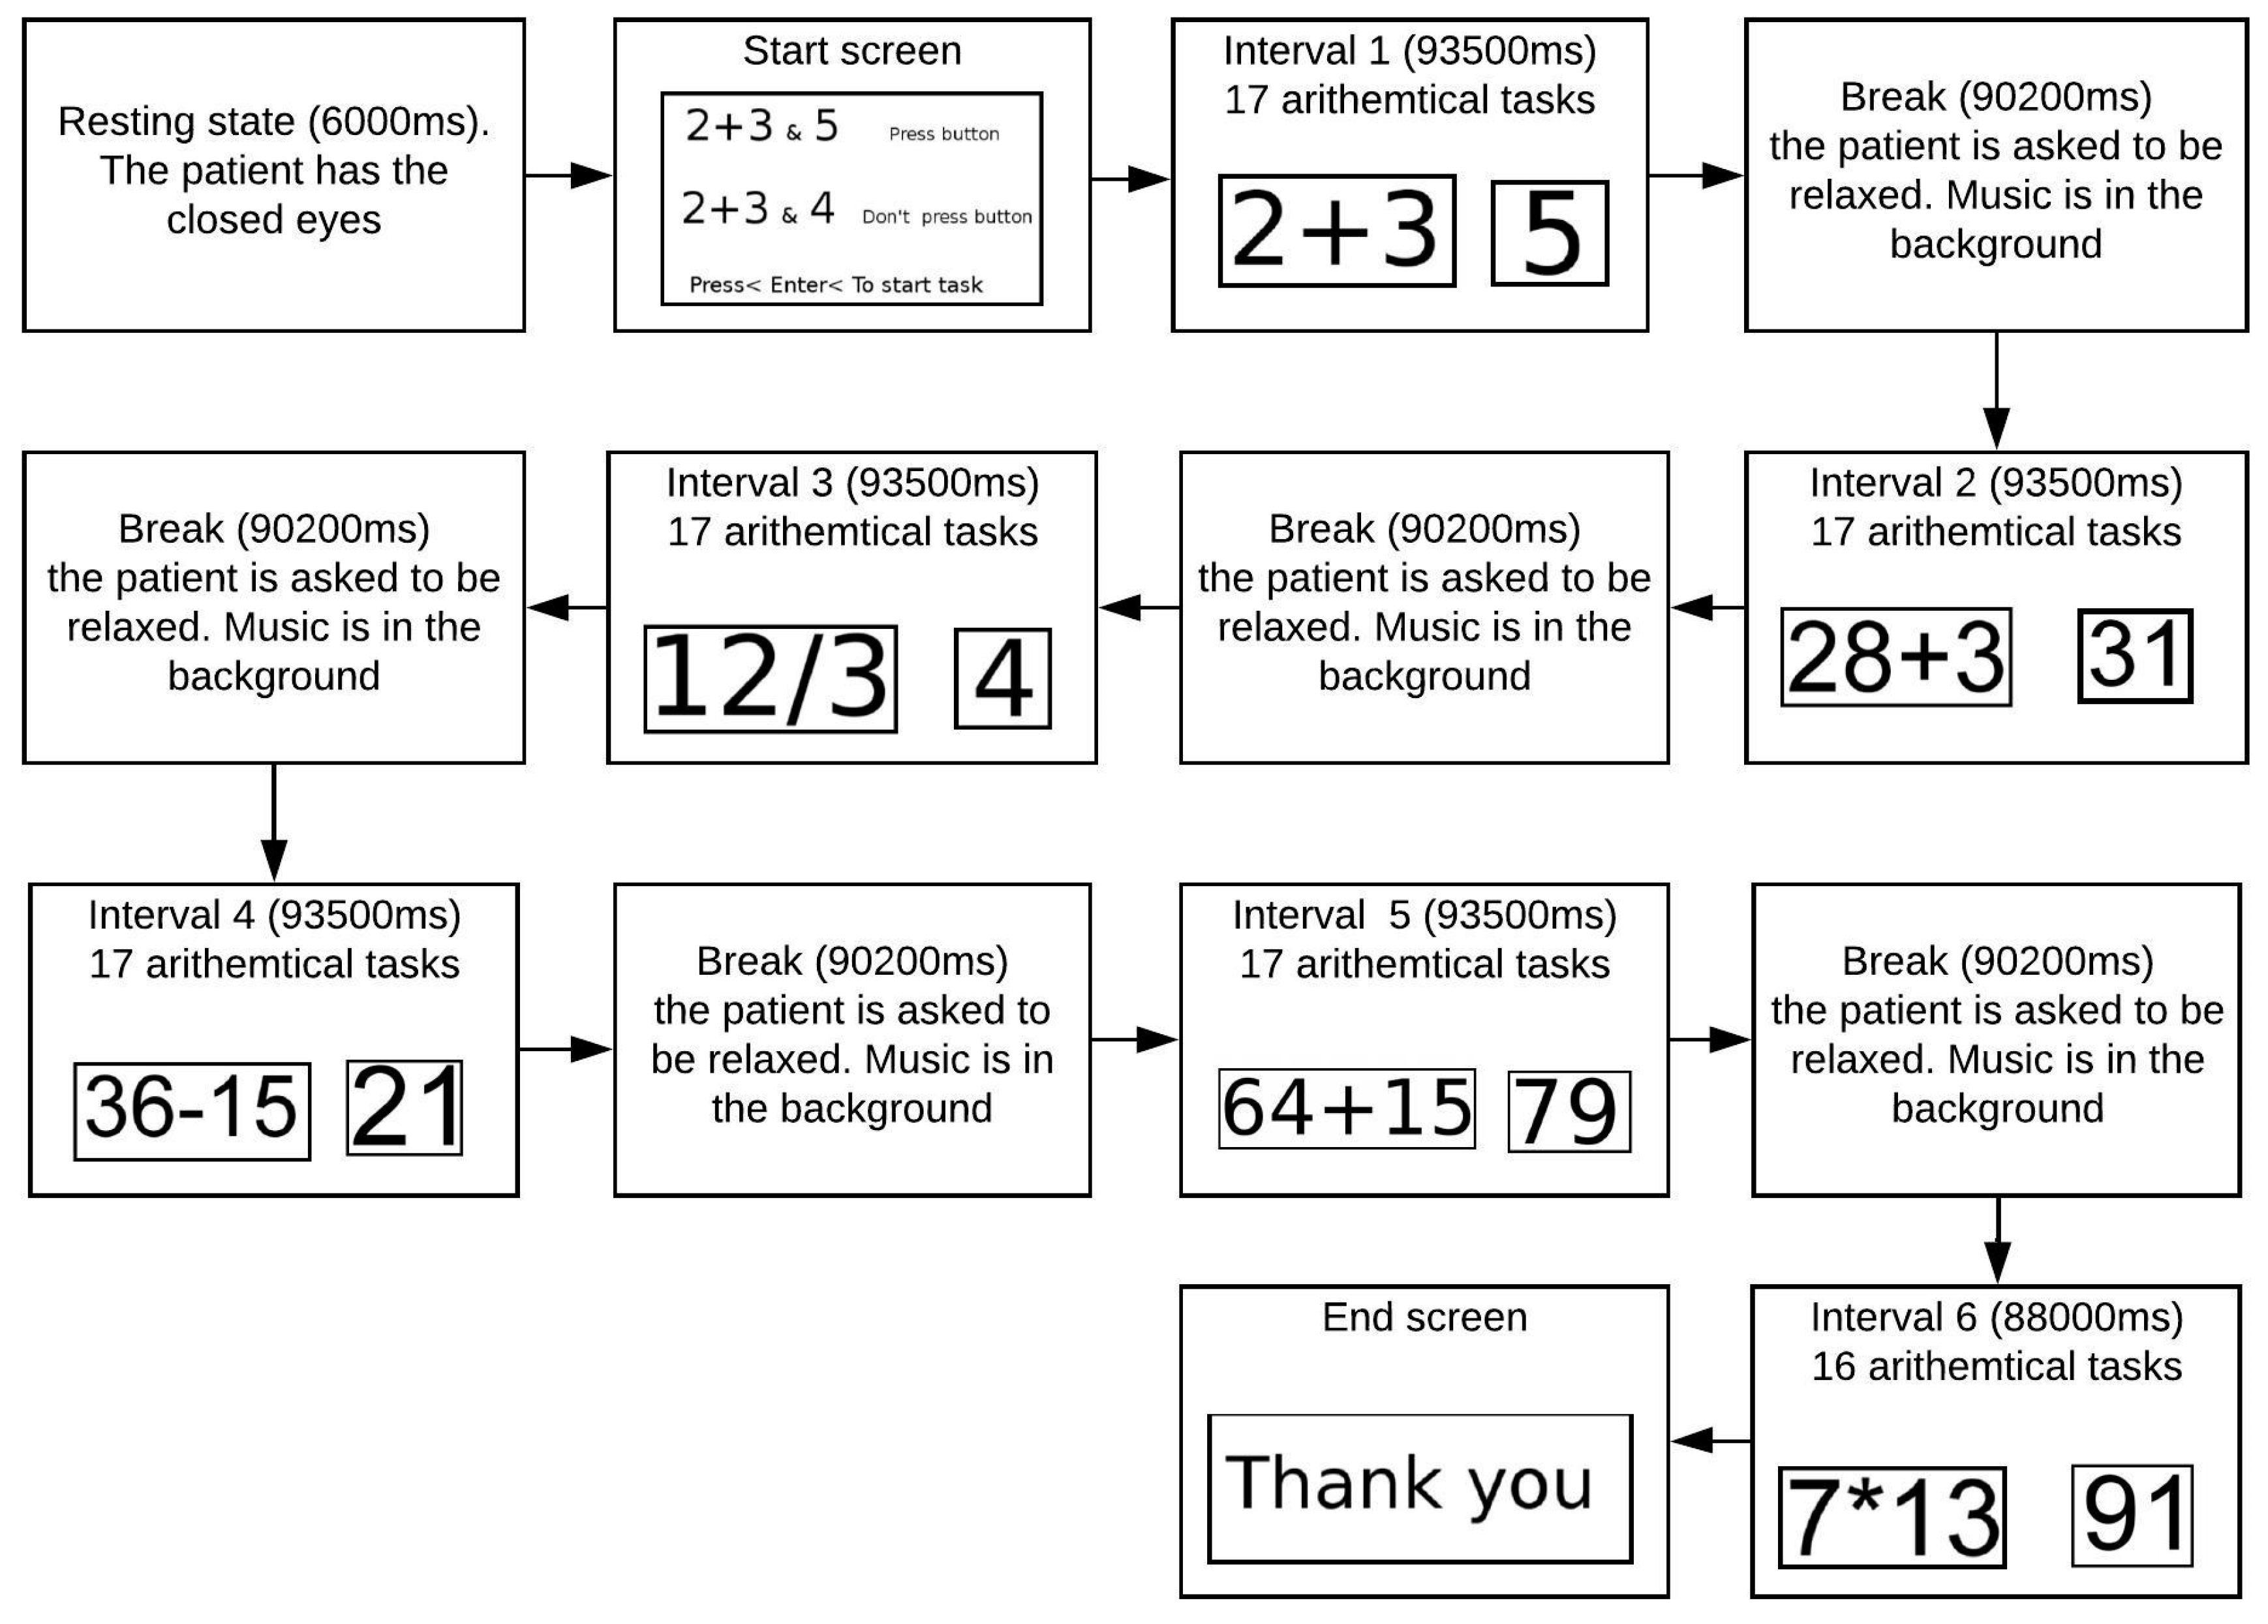
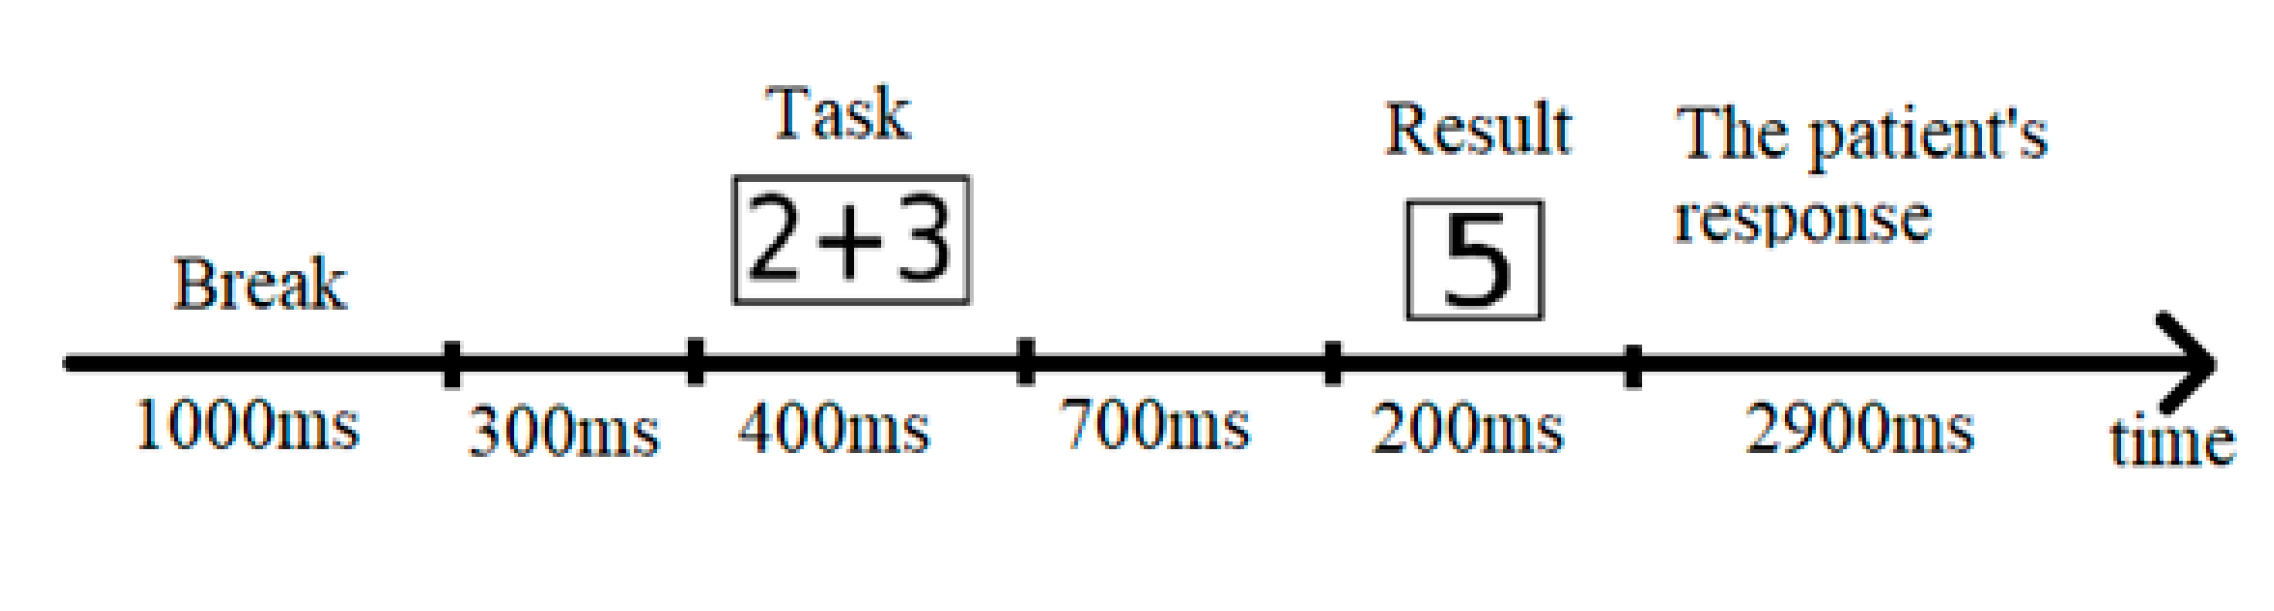
2. Materials and Methods
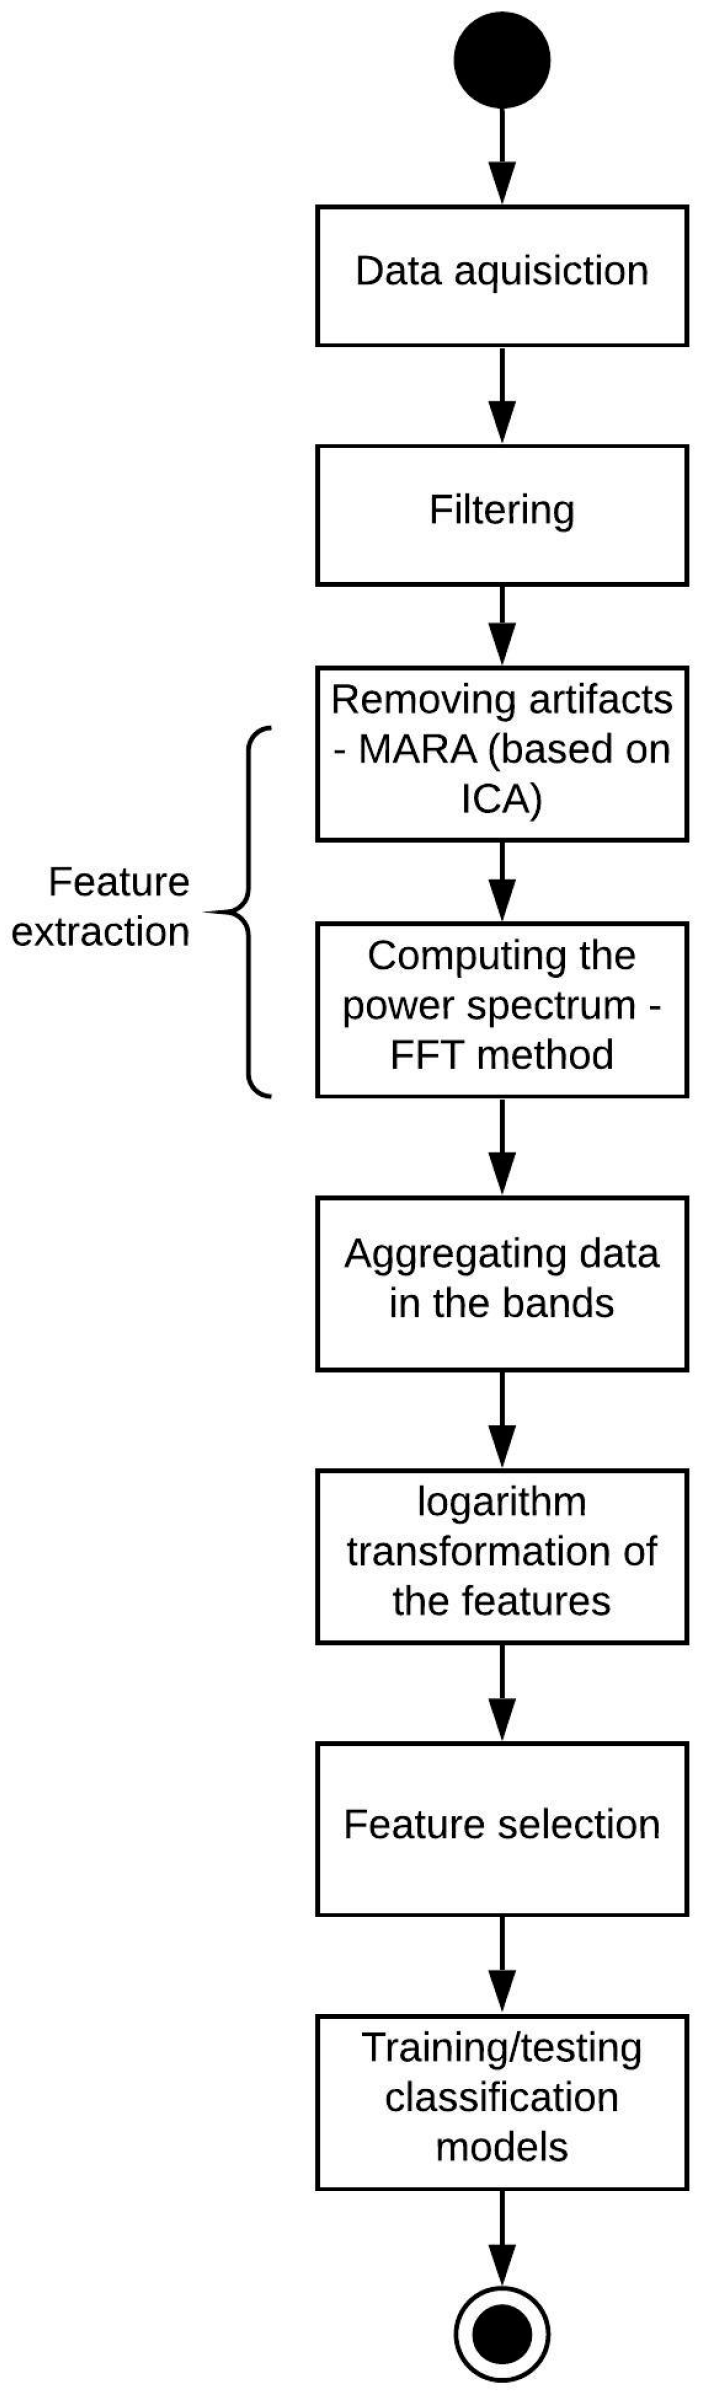
The experiment was conducted in quiet laboratory conditions by using a dedicated 21-channel Mitsar EEG 201 amplifier. The signal was gathered from 19 electrodes, and a computer mouse was used in order to provide the answers. A special cap and EEG cup gel were applied in order to ensure good conductivity in the experiment. The electrodes were placed according to the 10–20 system. The monopolar average montage was applied, and the ground electrode was placed in the center of the frontal lobe of the person examined. Twelve male participants took part in the experiment, but the signal from one of them contained a high level of noise and, due to that fact, only the signals from 11 subjects were used in the further analysis. The mean age of the people examined was 22 years. The subjects were asked to minimize movements and blinking in order to obtain less noisy fragments in the signal. The samples were recorded with the frequency of 500 Hz.
The experiment lasted about 20 min, and all participants had to carry out the same of tasks. The procedure of the experiment was divided into six intervals of advancement. The person was prepared for the examination, and the calibration was performed before the first part. Each interval except for the last one (interval 6) consisted of 17 arithmetical tasks, and the consequent intervals were separated with breaks. The last interval included 16 arithmetical tasks, as the last stimulus was not fully recorded. In total, each conducted experiment contained 6 intervals and 5 breaks. Each task was based on displaying a mathematical operation (adding, subtracting, multiplying integers) and the result of this operation. The person examined had to make the decision if the result was correct and then click on the button of the mouse, or do nothing if the answer was incorrect. The appearance of the stimulus was marked by a marker in the record, and the moment when the user clicked was marked as well. Figure 1 below presents the overall description of the conducted experiment with the numbers of intervals, resting breaks, and stimuli. Figure 2 shows the procedure of a single stimulus: The stimuli are separated with 1 s long breaks, after a break a task was demonstrated, shortly after the task the answer was provided, after that the participant was given approximately 3 s for approving/disapproving the answer by clicking/not clicking a mouse button, after that the next cycle was started with 1 s long break [49,52,57].
The obtained dataset included 11 files with EEG signal. The structure of each file is the following: 19 columns representing separate electrodes and rows representing separate samples of the signal registered.
In order to make the differences between various levels of cognitive workload more noticeable, intervals 3 and 4 were rejected from the experiment. The data from the first and second intervals were considered as a low level of cognitive workload, the data from the fifth and sixth interval were regarded as a high cognitive workload, and the data from the breaks were seen as a state of relaxation. The authors decided to remove intervals 3 and 4, as participants in the after-study interview reported different level of mental effort in intervals 3 and 4. That is why the decision to remove them was made in order to keep the dataset homogenous and reduce inter-subject differences.
The further analysis was performed based on the dataset including 1067 samples. This number of samples was obtained in the following way: 11 participants, 2 intervals with low level of cognitive workload with 17 stimuli each, 2 intervals with high level of cognitive workload with respectively 17 and 16 stimuli each, and 30 samples received from breaks.

3. Data Processing

Figure 3 presents the procedure of data processing.
EEG pre-processing consisted of filtration and artifact correction. The pre-processing was performed in the EEGLab, which is the plugin of Matlab software. The set of notch and high pass filters were used. In order to implement said filters, Butterworth filter of the second order was applied. Firstly, a notch filter was used in order to eliminate the influence of the electrical power circuit, the notch boundaries were set to 45–55 Hz. High-pass filter was used to remove noised signal containing non-stationary signal drift across the recording below 0.53 Hz [58,59,60] in addition to the two mentioned filters, low pass filter was also applied, and its cut off frequency was equal to 50 Hz. The described filtering step is a part of standard EEG signal processing pipeline [61].
Secondly, in the preprocessing stage MARA (Multiple Artifact Rejection Algorithm) [62] algorithm available in EEGLab software was also applied. This is a method based on Independent Component Analysis (ICA), where artificial intelligence is applied to choose the components to remove. Artifactual ICA-components marked by MARA were revised with ICLabel [63], the other ICA component classification method, also available in EEGLab software.
In order to eliminate possible potentials related to movement planning and performing, 200 ms prior to each mouse click were discarded. This procedure was adopted to the stimuli where mouse click was required in order to approve the correct answer.
Owing to a high inter-subject diversity of EEG signals, feature extraction is one of the essential steps in evaluating the level of cognitive workload based on EEG signal. In addition to this, it may be noticed that classical Machine Learning models such as SVM, decision trees, or kNN require feature extraction and selection for ensuring sufficient quality of cognitive workload classification [40,44]. After initial consideration, the Fast Fourier Transform (FFT) method was chosen as the main feature extraction method. This decision was taken due to the fact that FFT is one of the most popular methods of EEG feature extraction [56,64]. The Hamming window function was also applied.
The sampling frequency was equal to 500 Hz. The length of a single stimulus record was 5500 ms, what corresponds to 2750 samples. Hamming window was applied to each stimulus, and afterwards FFT was calculated for the whole window, resulting into 1375 frequency bins with frequency resolution 0.18 Hz/bin. Further procedure included decreasing frequency resolution to 1 Hz. Due to the fact that only components of the frequencies below 30 Hz contain valuable information, the spectrum obtained after the FFT transform was cut to the 0–30 Hz interval. This measure allowed to decrease the number of features down to 570, which was still high. In order to further decrease the feature number, the next step was taken: The power of the frequency components were averaged within the following intervals: Delta(1–3 Hz), theta (4–8 Hz), alpha (8–13 Hz), beta1 (13–20 Hz), and beta2 (20–30 Hz) for 19 electrodes, which led to the total feature number equaling 95.
As was shown in a previously published paper [32], the appliance of a log transform positively affects the classification performance, as the distribution of a log-transformed feature becomes closer to the normal distribution, thus eliminating outliers. The data which did not undergo the log-transform procedure were not used in the further analysis.
In order to reduce the input dimension number and ensure higher classification accuracy, feature selection was performed. Various ranking methods allowing to arrange the features according to their predictive ability were applied. They included:
  • ECFS-Feature Selection by Eigenvector Centrality [61],
  • Relief feature selection method [65],
  • Mutinffs—mutual information feature selection method [66],
  • Fisher score feature selection method [67].
As the experiment presented involved multiclass classification, feature selection methods had to be used in the following way: Having n classes in our dataset, the feature selection methods were used n times in 1-vs-all manner, obtaining n feature rankings, and the resulting feature set was built as the intersection of the said rankings. Multiple feature numbers were tested in order to find the most productive feature set, i.e., one where the classification accuracy was the highest.
Having the feature selection stage completed, the final stage of the experiment, i.e., classification, was started. The following classification models were used:
  • SVM with cubic kernel,
  • decision tree,
  • k nearest neighbours (kNN),
  • random forest of 100 boosted decision trees.
The performance of the models mentioned was tested in two ways: With the use of a five-fold cross validation technique and a separate validation dataset. The total number of samples is equal to 1067, 15% of the whole dataset were used for hold-out validation and did not take part in cross validation. 5-fold cross validation was conducted.
In order to extract the features, which are the most common for all the subjects, all the observations were joined into one dataset, and the observations in the dataset were shuffled in random order. Said dataset was used in 5-fold cross validation both for feature selection and classification.

4. Results

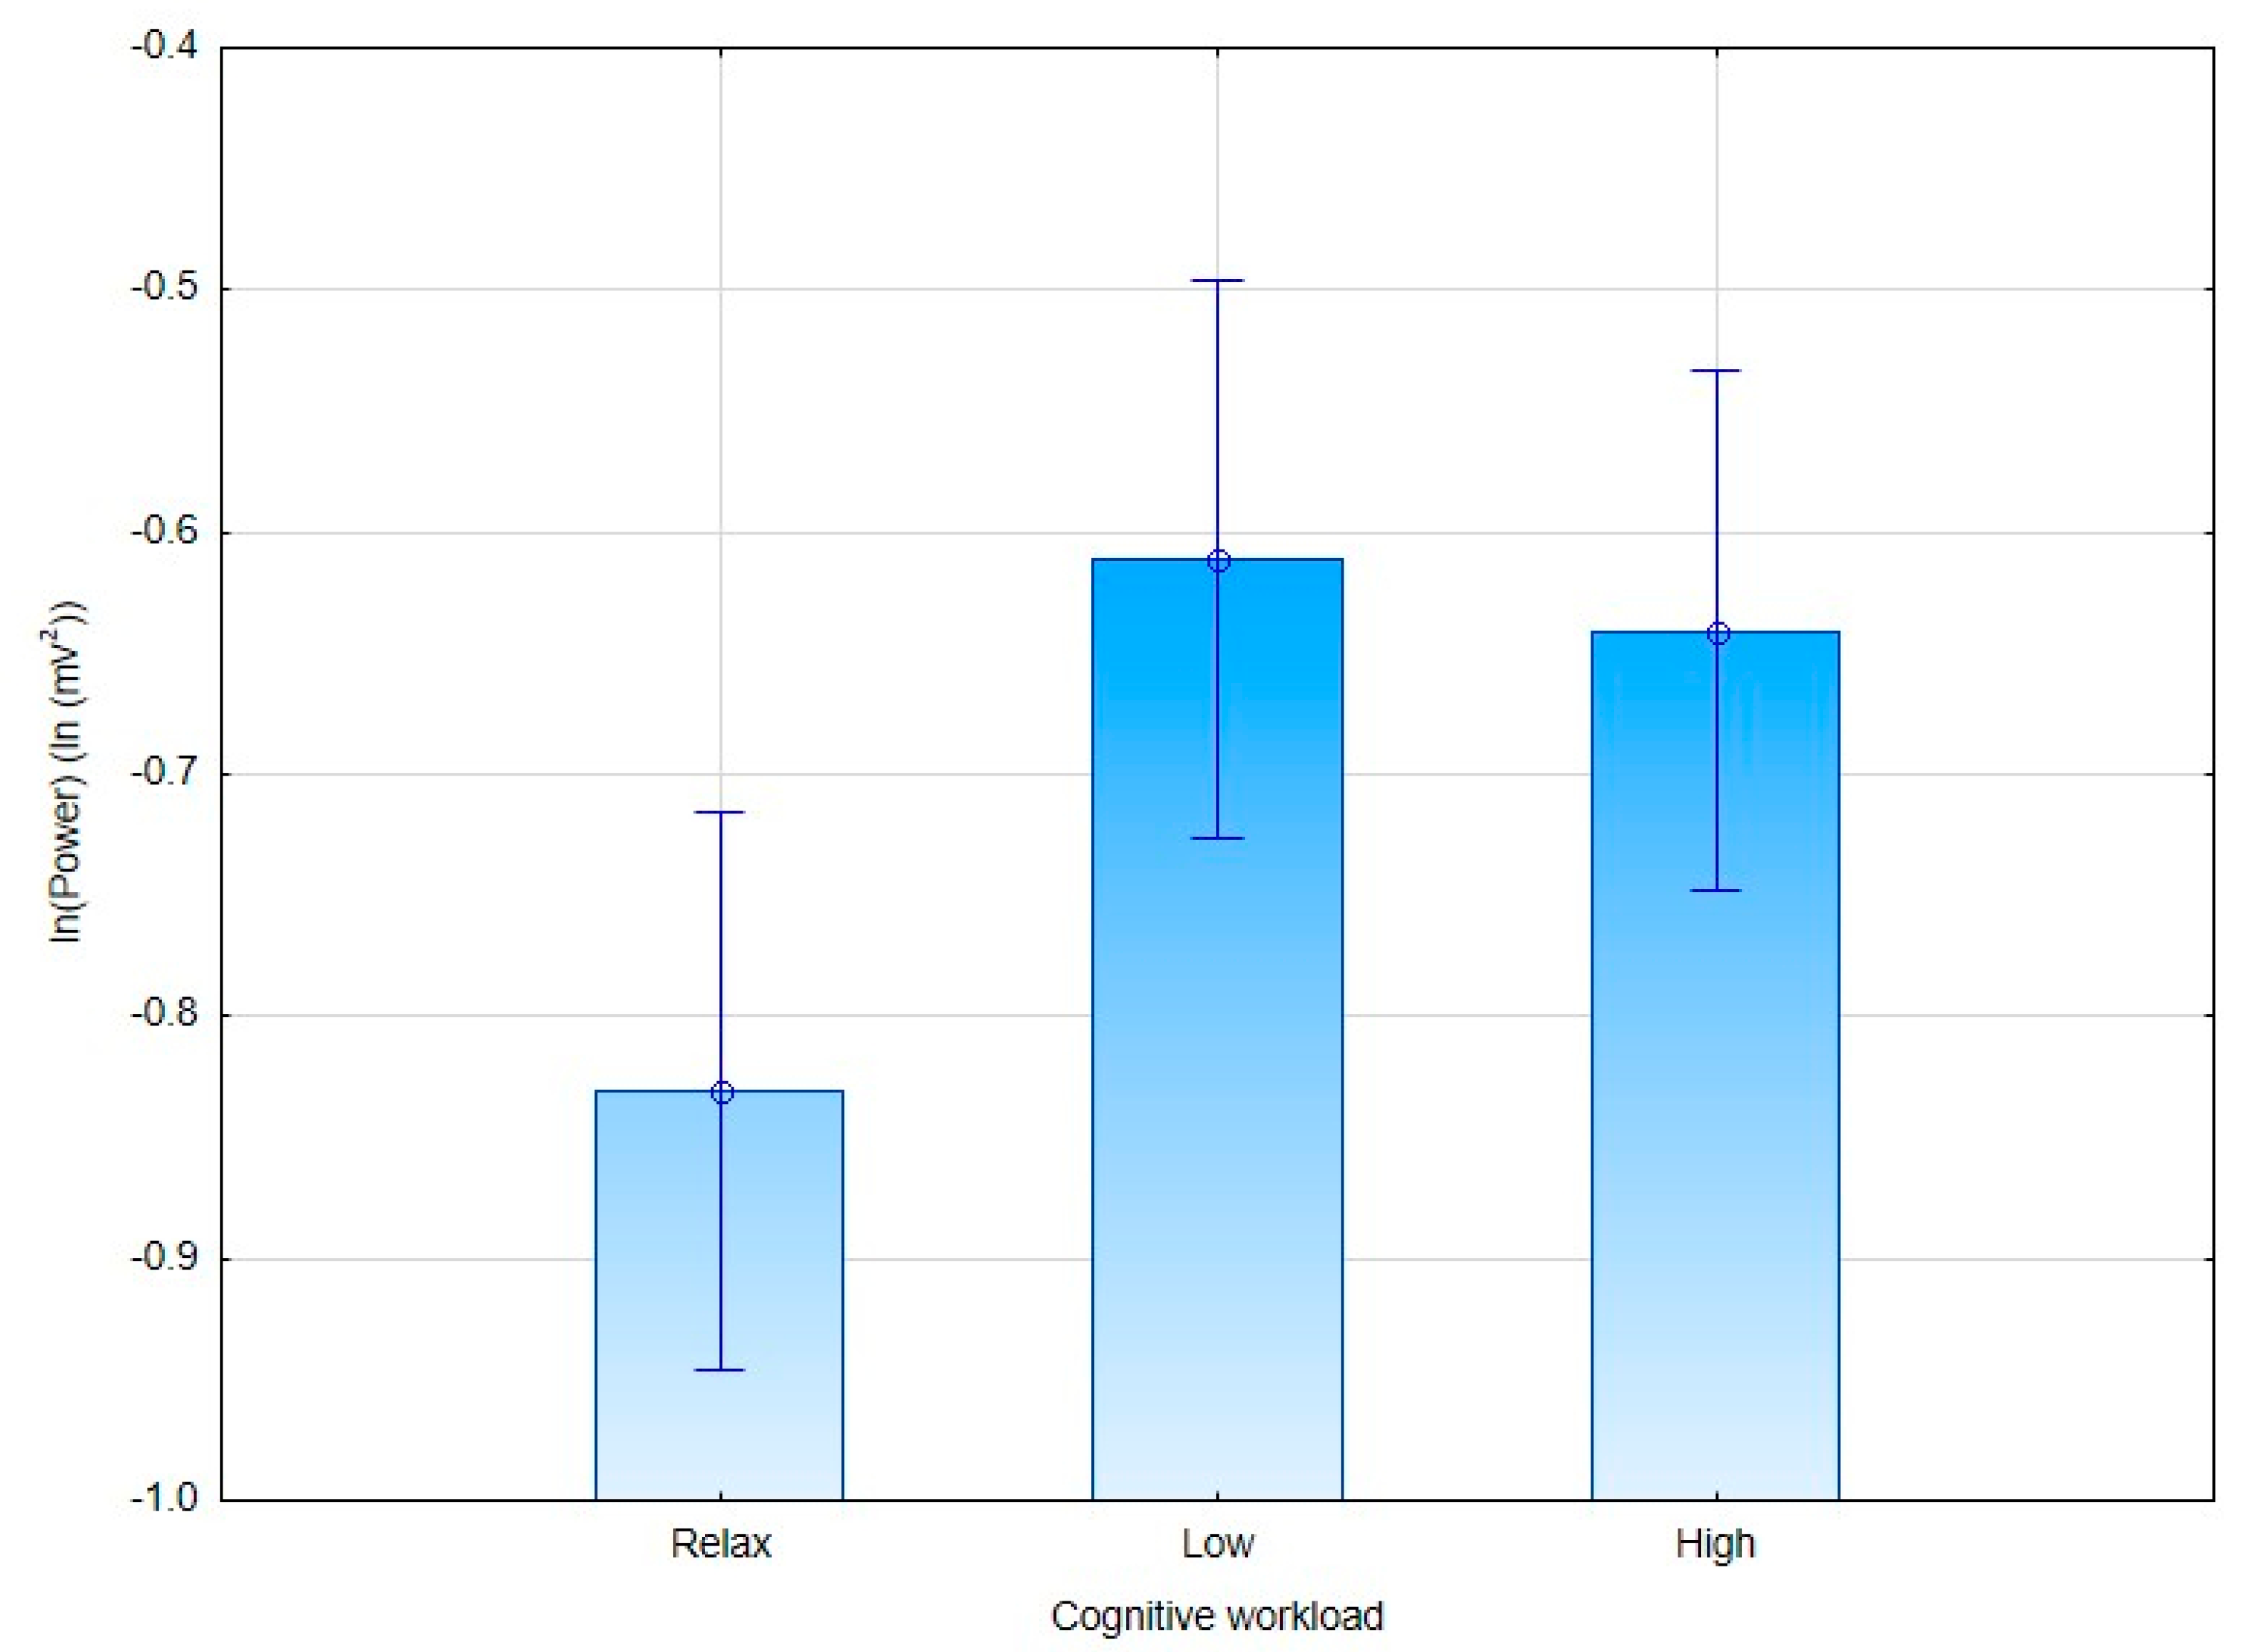
4.1. Statistical Analysis

Statistical analysis was performed using the Statistica 13 (Dell Inc.), Matlab and R software. All tests were performed with the statistical significance level of 5%.
Statistical analysis was conducted for features calculated as natural logarithm of separate frequency component power. Analyzed data subjected to statistical analysis had 285 features (19 electrodes, 5 frequencies, 3 cognitive workload levels). The sample size is 11.
Statistical analysis was based on ANOVA for repeated measures. What is more, the correlation analysis was additionally performed to supplement the results.
The values of Spearman correlation coefficients were computed to determine the relationship between features and the level of cognitive workload. Three levels of cognitive workload were considered: Cognitive workload level of 1 indicates break, 2-low cognitive workload level, and 3-high cognitive workload level. The results of this correlation analysis including p-value are presented in the Table 2. Presented results cover statistically significant correlation obtained at the level alpha 0.05. The correlation analysis confirmed the strongest correlation between the cognitive workload level and EEG features in beta waves covered especially in central and parietal areas of the brain. Laterality analysis revealed higher results for the electrodes on the left in the delta, theta, alpha, and beta2, but in the beta1 the trend is the opposite (F (4, 40) = 336.26, p < 0.001 obtained for the interaction of the electrode location with individual frequency ranges).
ANOVA for repeated measures was applied in order to perform the main statistical analysis. The analysis was conducted on the 11 × 285 dataset, where 11 is a sample size (number of participants) and 285 is a number of features obtained after electrodes aggregation to the main brain areas. Results of ANOVA for repeated measures were calculated for three effects defined as: COGNITIVE (three levels of cognitive workload), LOCATIONS (nineteen electrodes), and FREQUENCY (five EEG waves). As a result of this analysis, a significant main effect of COGNITIVE F (2, 20) = 26.795 was obtained; p < 0.001; η p 2   = 0.73. After the application of Tukey HSD post hoc tests, it was observed that the power of waves from the entire studied frequency range was significantly stronger (p < 0.001) during low (M = −0.61; SE = 0.11) and high cognitive workload (M = −0.64; SE = 0.11), than it was observed in the recording in the relaxation condition (M = −0.83; SE = 0.11). Simultaneously, there are no significant differences in power between low and high cognitive load (p = 0.995). This relationship between cognitive workload and wave power over the entire frequency range is presented in the Figure 4, where it might be observed that the natural logarithm of wave power during cognitive workload is on around −0.61 ln(mV2). Statistical analysis revealed also significant differences between all effects (COGNITIVExLOCATIONSxFREQUENCY). F(144, 1440) = 1.763; p < 0.001; η p 2 = 0.15. However, for this result post hoc analysis did not confirm any strong relations.
Significant differences were also found in LOCATIONS (F (18, 180) = 13.867; p < 0.001) and FREQUENCY (F (4, 40) = 845.21; p < 0.001). What is more, results reveal significant interaction with the COGNITIVExLOCATION effect (F (36, 360) = 1.907; p < 0.001) confirmed in post hoc analysis.
Due to the fact, that inter-trial-intervals (breaks) represent a different brain state than low/high workload states, the correlation analysis was performed also for only two levels of cognitive workload: Low and high. Table 3 presents the values of Spearman correlation coefficients for these two workload states. Obtained Spearman correlation results showed weaker relations compared to analogous correlation results of three cognitive workload levels (including breaks). The strongest correlations were found in temporal (T), parietal (P), and central (C) areas of the brain.
Statistical analysis did not reveal significant statistical differences between low and high workload states.

4.2. Classification Results

Table 4 and Table 5 contain the highest accuracies achieved for various classification models. The values in the last two columns correspond to the selected feature number and FS method, which ensured the best accuracy for the current classifier, shown in the column “Highest mean accuracy”. The tests were conducted with all the FS methods mentioned in the Section 3, but only the FS method numbers and feature numbers ensuring the best accuracy for given classifier were presented in the Table 4 and Table 5. The values in the column “FS method” stand for, correspondently:
  • 1—ECFS;
  • 2—“relieff”;
  • 3—mutinffs
The cycles of training and testing the classification models were repeated 250 times for every classifier. The highest mean values of accuracy and its standard deviation values are presented in the Table 4 and Table 5.
The presented results illustrate high nonlinearity of the feature space. Due to that fact a separate decision tree demonstrated the poorest performance, owing to the fact that it divides the space with borders parallel to the axes, which not always allows to obtain good space partitioning. SVM demonstrated better performance, but cubic kernel still did not introduce enough nonlinearity to successfully partition the space. kNN demonstrated the best result due to the different nature of its algorithm. Ensemble of decision trees provided sufficient results; however, its training took the longest time.

5. Discussion

The main focus of the present research was put on estimation of cognitive workload level in accordance with subject-independent approach applying classical machine learning methods combined with feature selection techniques. Another issue addressed was multiclass classification of cognitive workload, i.e., distinguishing among more than two levels of cognitive workload. The results obtained show that the proper procedure of feature selection has high influence on the performance of the classification model, allowing to conduct subject-independent multiclass cognitive workload classification with high accuracy (91% in the case of the cross validation for kNN classifier).
All the combinations of the mentioned classifiers and feature selection methods were tested, whereas only those feature selection methods that ensured the best values for specific classifiers, were presented, and the rest of the results were discarded from further analysis due to lower classification performance.
Another point that can be highlighted is the procedure of feature selection. The results show that it allows to achieve sufficient performance of the classification model with a significant decrease of feature number: 52 of 95 features allowed to obtain the classification accuracy as high as 91% with the use of a kNN classifier.
The comparison of the classification models applied shows that kNN and the ensemble of boosted decision trees allow to achieve the highest accuracy compared to the other models. The literature review shows that kNN methods were widely applied in cognitive workload classification in both two- and multiclass approach. The obtained accuracy varied in the range between 85% and 90% in case of subject dependent approach [36,44,47,51,53]. As for subject-independent approach, the results achieved with the use of kNN were in the range between 80% and 90%. The procedure of feature selection made it possible to achieve higher classification accuracy. The literature (papers presented in the Table 1) allows concluding that researches rarely conduct comparison of various methods of feature selection, limiting FS only to one method, or avoiding it at all.
The results show that the choice of the classifier also affects the accuracy of distinguishing between various levels of cognitive workload.
The task of classifying cognitive workload appears to be highly complicated due to high nonlinearity of the feature space classified. Nowadays, deep learning is progressively gaining popularity in many fields of data analysis, but classical models can still present interest due to lower computational cost of these models. The classical models can be trained faster with appliance of less powerful hardware [68]. In the present research, it was shown that the classical methods of machine learning (e.g., kNN, random forests) can provide good performance in the task of classifying cognitive workload with comparatively low computational cost. Another advantage of the classical classification methods is the fact that the results of classification are more interpretable. A deep neural network usually behaves as a “black box”, in other words, it can approximate highly complex dependencies, but high number of model parameters cause bad interpretability of the results, whereas classical models, such as decision trees and kNN classifiers, give a better ability to understand the processes behind the analyzed phenomena.
To complement the classification analysis, the statistical examination was also performed. Spearman analysis results indicated significant correlation between the cognitive workload level and EEG features of beta waves located especially in central and parietal areas of the brain. Results of ANOVA for repeated measures prove that the power of waves from the entire studied frequency range was significantly stronger during low and high cognitive workload, than it was observed in the recording in the relaxation condition. Owing to the fact that the statistical analysis did not reveal significant differences between low and high cognitive workload level. What is more, Spearman correlation results did not revealed strong relations between features. This lack of significant differences between low and high cognitive workload levels is a limitation of this research. Further research is needed to investigate this problem.

Author Contributions

Conceptualization, M.P.-W., M.T., M.K.; methodology, M.P.-W., M.T.; software, M.T., M.K.; data curation, M.T., M.K.; writing—original draft preparation, M.P.-W.; writing—review and editing, M.P.-W., M.T., M.K.; visualisation, M.T., M.K; statistical analysis, D.Z., M.P.-W.

Funding

This research received no external funding.

Conflicts of Interest

The authors declare no conflict of interest.

References

  1. Gevins, A.; Smith, M.E.; McEvoy, L.; Yu, D. High-resolution EEG mapping of cortical activation related to working memory: Effects of task difficulty, type of processing, and practice. Cereb. Cortex 1997, 7, 374–385. [Google Scholar] [CrossRef] [Green Version]
  2. Binet, A.; Henri, V. La Fatigue Intellectuelle; Librairie C. Reinwald, Schleicher Frères: Paris, France, 1898; Volume 1. [Google Scholar]
  3. Marcora, S.M.; Staiano, W.; Manning, V. Mental fatigue impairs physical performance in humans. J. Appl. Physiol. 2009, 106, 857–864. [Google Scholar] [CrossRef]
  4. Kruger, J.; Doherty, S. Measuring cognitive load in the presence of educational video: Towards a multimodal methodology. Australas. J. Educ. Technol. 2016, 32, 19–31. [Google Scholar] [CrossRef]
  5. Hancock, P.A.; Chignell, M.H. Mental workload dynamics in adaptive interface design. IEEE Trans. Syst. Man. Cybern. 1988, 18, 647–658. [Google Scholar] [CrossRef]
  6. O’Donnell, R.D.; Eggemeier, F.T. Workload assessment methodology. In Handbook of Perception and Human Performance, 2: Cognitive Processes and Performance; Boff, K.R., Kaufman, L., Thomas, J.P., Eds.; Sage: Los Angeles, CA, USA, 1986. [Google Scholar]
  7. Hart, S.G. NASA-Task Load Index (NASA-TLX); 20 years later. Proc. Hum. Factors Ergon. Soc. Annu. Meet. 2006, 50, 904–908. [Google Scholar] [CrossRef] [Green Version]
  8. Wobrock, D.; Frey, J.; Graeff, D.; de la Rivière, J.B.; Castet, J.; Lotte, F. Continuous mental effort evaluation during 3D object manipulation tasks based on brain and physiological signals. In Human-Computer Interaction—INTERACT 2015; Abascal, J., Barbosa, S., Fetter, M., Gross, T., Palanque, P., Winckler, M., Eds.; Lecture Notes in Computer Science; Springer: Cham, Switzerland, 2015; Volume 9296, pp. 472–487. [Google Scholar]
  9. Matthews, G.; Reinerman-Jones, L.E.; Barber, D.J.; Abich, J. IV The psychometrics of mental workload: Multiple measures are sensitive but divergent. Hum. Factors. 2015, 57, 125–143. [Google Scholar] [CrossRef]
  10. Ren, P.; Barreto, A.; Huang, J.; Gao, Y.; Ortega, F.R.; Adjouadi, M. Offline and on-line stress detection through processing of the pupil diameter signal. Ann. Biomed. Eng. 2014, 42, 162–176. [Google Scholar] [CrossRef]
  11. Kumar, N.; Kumar, J. Measurement of cognitive load in HCI systems using EEG power spectrum: An experimental study. Procedia Computer Science 2016, 84, 70–78. [Google Scholar] [CrossRef] [Green Version]
  12. Brouwer, A.M.; Hogervorst, M.A.; Van Erp, J.B.; Heffelaar, T.; Zimmerman, P.H.; Oostenveld, R. Estimating workload using EEG spectral power and ERPs in the n-back task. J. Neural Eng. 2012, 9, 045008. [Google Scholar] [CrossRef]
  13. Klimesch, W. EEG alpha and theta oscillations reflect cognitive and memory performance: A review and analysis. Brain Res. Rev. 1999, 29, 169–195. [Google Scholar] [CrossRef]
  14. Andreassi, J.L. Psychophysiology: Human Behavior and Physiological Response; Lawrence Erlbaum Associates, Inc.: Mahwah, NJ, USA, 1995. [Google Scholar]
  15. Holm, A.; Lukander, K.; Korpela, J.; Sallinen, M.; Müller, K.M.I. Estimating brain load from the EEG. Sci. World J. 2009, 9, 639–651. [Google Scholar] [CrossRef] [Green Version]
  16. Putze, F.; Jarvis, J.-P.; Schultz, T. Multimodal recognition of cognitive workload for multitasking in the car. In Proceedings of the 2010 20th Conference on Pattern Recognition, Istanbul, Turkey, 23–26 August 2010; pp. 3748–3751. [Google Scholar]
  17. Gentili, R.J.; Jaquess, K.J.; Shuggi, I.M.; Shaw, E.P.; Oh, H.; Lo, L.C.; Hatfieldm, B.D. Combined assessment of attentional reserve and cognitive-motor effort under various levels of challenge with a dry EEG system. Psychophysiology 2018, 55, e13059. [Google Scholar] [CrossRef]
  18. Shaw, E.P.; Rietschel, J.C.; Hendershot, B.D.; Pruziner, A.L.; Miller, M.W.; Hatfield, B.D.; Gentili, R.J. Measurement of attentional reserve and mental effort for cognitive workload assessment under various task demands during dual-task walking. Biol. Psychol. 2018, 134, 39–51. [Google Scholar] [CrossRef]
  19. Zammouri, A.; Abdelaziz, A.M.; Yassine, M. Brain-computer interface for workload estimation: Assessment of mental efforts in learning processes. Expert Syst. Appl. 2018, 112, 138–147. [Google Scholar] [CrossRef]
  20. Jaquess, K.J.; Lo, L.C.; Oh, H.; Lu, C.; Ginsberg, A.; Tan, Y.Y.; Gentili, R.J. Changes in mental workload and motor performance throughout multiple practice sessions under various levels of task difficulty. Neuroscience 2018, 393, 305–318. [Google Scholar] [CrossRef]
  21. Röy, R.N.; Charbonnier, S.; Campagne, A.; Bonnet, S. Efficient mental work- load estimation using task-independent EEG features. J. Neural Eng. 2016, 13, 026019. [Google Scholar] [CrossRef]
  22. Dijksterhuis, C.; de Waard, D.; Brookhuis, K.A.; Mulder, B.L.J.M.; de Jong, R. Classifying visuomotor workload in a driving simulator using subject specific spatial brain patterns. Front. Neurosci. 2013, 7, 149. [Google Scholar] [CrossRef] [Green Version]
  23. Di Flumeri, G.; Borghini, G.; Aricò, P.; Sciaraffa, N.; Lanzi, P.; Pozzi, S.; Babiloni, F. EEG-based mental workload neurometric to evaluate the impact of different traffic and road conditions in real driving settings. Front. Hum. Neurosci. 2018, 12, 509. [Google Scholar] [CrossRef] [Green Version]
  24. Wilson, G.F.; Russell, C.A. Operator functional state classification using multiple psychophysiological features in an air traffic control task. Hum. Factors J. Hum. Factors Erg. 2003, 45, 381–389. [Google Scholar] [CrossRef]
  25. Wilson, G.F.; Russell, C.A. Real-time assessment of mental workload using psychophysiological measures and artificial neural networks. Hum. Factors 2003, 45, 635–643. [Google Scholar] [CrossRef]
  26. Baldwin, C.L.; Penaranda, B.N. Adaptive training using an artificial neural network and EEG metrics for within- and cross-task workload classification. NeuroImage 2012, 59, 48–56. [Google Scholar] [CrossRef]
  27. Mahmoud, R.; Shanableh, T.; Bodala, I.P.; Thakor, N.V.; Al-Nashash, H. Novel classification system for classifying cognitive workload levels under vague visual stimulation. IEEE Sens. J. 2017, 17, 7019–7028. [Google Scholar] [CrossRef]
  28. Borghini, G.; Isabella, R.; Vecchiato, G.; Toppi, J.; Astolfi, L.; Caltagirone, C.; Babiloni, F. Brainshield: HREEG study of perceived pilot mental workload. Ital. J. Aerosp. Med. 2011, 5, 34–47. [Google Scholar]
  29. Breiman, L. Random forests. Mach. Learn. 2001, 45, 5–32. [Google Scholar] [CrossRef] [Green Version]
  30. Zarjam, P.; Epps, J.; Chen, F.; Lovell, N.H. Estimating cognitive workload using wavelet entropy-based features during an arithmetic task. Comput. Biol. Med. 2013, 43, 2186–2195. [Google Scholar] [CrossRef]
  31. Grimes, D.; Tan, D.S.; Hudson, S.E.; Shenoy, P.; Rao, R.P.N. Feasibility and pragmatics of classifying working memory load with an electroencephalograph. In Proceedings of the SIGCHI Conference on Human Factors in Computing Systems, Florence, Italy, 5–10 April 2008; pp. 835–844. [Google Scholar]
  32. Yu, K.; Prasad, I.; Mir, H.; Thakor, N.; Al-Nashash, H. Cognitive workload modulation through degraded visual stimuli: A single-trial EEG study. J. Neural Eng. 2015, 12, 046020. [Google Scholar] [CrossRef] [Green Version]
  33. Wang, Z.; Hope, R.M.; Wang, Z.; Ji, Q.; Gray, W.D. Cross-subject workload classification with a hierarchical Bayes model. NeuroImage 2012, 59, 64–69. [Google Scholar] [CrossRef]
  34. Chen, J.; Wang, H.; Wang, Q.; Hua, C. Exploring the fatigue affecting electroencephalography based functional brain networks during real driving in young males. Neuropsychologia 2019, 129, 200–211. [Google Scholar] [CrossRef]
  35. Nuamah, J.K.; Seong, Y. Support vector machine (SVM) classification of cognitive tasks based on electroencephalography (EEG) engagement index. Brain-Comput. Interfaces 2018, 5, 1–12. [Google Scholar] [CrossRef]
  36. Sharma, G.; Gomes, A. Estimation of workload using EEG data and classification using linear classifiers. Int. J. Sci. Eng. Res. 2015, 6, 198–203. [Google Scholar]
  37. Walter, C.; Wolter, P.; Rosenstiel, W.; Bogdan, M.; Spüler, M. Towards cross-subject workload prediction. In Proceedings of the 6th International Brain-Computer Interface Conference 2014; Müller-Putz, G., Bauernfeind, G., Brunner, C., Steyrl, D., Wriessnegger, S., Scherer, R., Eds.; Graz University of Technology Publishing House: Graz, Austria, 2014. [Google Scholar]
  38. Chen, L.L.; Zhao, Y.; Ye, P.F.; Zhang, J.; Zou, J.Z. Detecting driving stress in physiological signals based on multimodal feature analysis and kernel classifiers. Expert Syst. Appl. 2017, 85, 279–291. [Google Scholar] [CrossRef]
  39. Wilson, G.F.; Russell, C.A.; Monnin, J.W.; Estepp, J.R.; Christensen, J.C. How does day-to-day variability in psychophysiological data affect classifier accuracy? Proc. Human Factors Ergon. Soc. Annu. Meet. 2010, 54, 264–268. [Google Scholar] [CrossRef]
  40. Khushaba, R.N.; Kodagoda, S.; Lal, S.; Dissanayake, G. Driver drowsiness classification using fuzzy wavelet-packet-based feature-extraction algorithm. IEEE Trans. Biomed. Eng. 2010, 58, 121–131. [Google Scholar] [CrossRef] [Green Version]
  41. Magnusdottir, E.H.; Johannsdottir, K.R.; Bean, C.; Olafsson, B.; Gudnason, J. Cognitive workload classification using cardiovascular measures and dynamic features. In Proceedings of the 2017 8th IEEE International Conference on Cognitive Infocommunications (CogInfoCom), Debrecen, Hungary, 11–14 September 2017; pp. 351–356. [Google Scholar]
  42. Shen, K.Q.; Ong, C.J.; Li, X.P.; Hui, Z.; Wilder-Smith, E.P. A feature selection method for multilevel mental fatigue EEG classification. IEEE Trans. Biomed. Eng. 2007, 54, 1231–1237. [Google Scholar] [CrossRef]
  43. Wang, Q.; Sourina, O. Real-time mental arithmetic task recognition from EEG signals. IEEE Trans. Neural Syst. Rehabil. Eng. 2013, 21, 225–232. [Google Scholar] [CrossRef]
  44. Petrantonakis, P.C.; Hadjileontiadis, L.J. Emotion recognition from EEG using higher order crossings. IEEE Trans. Inf. Technol. Biomed. 2009, 14, 186–197. [Google Scholar] [CrossRef]
  45. Laine, T.I.; Bauer, K.W.; Lanning, J.W.; Russell, C.A.; Wilson, G.F. Selection of input features across subjects for classifying crewmember workload using artificial neural networks. IEEE Trans. Syst. Man Cybern. Part A Syst. Humans 2002, 32, 691–704. [Google Scholar] [CrossRef]
  46. Spüler, M.; Walter, C.; Rosenstiel, W.; Gerjets, P.; Moeller, K.; Klein, E. EEG-based prediction of cognitive workload induced by arithmetic: A step towards online adaptation in numerical learning. ZDM 2016, 48, 267–278. [Google Scholar] [CrossRef]
  47. Atasoy, H.; Yildirim, E. Classification of verbal and quantitative mental tasks using phase locking values between EEG signals. Int. J. Signal. Process. Image Process. Pattern Recognit. 2016, 9, 383–390. [Google Scholar] [CrossRef]
  48. Shen, K.Q.; Li, X.P.; Ong, C.J.; Shao, S.Y.; Wilder-Smith, E.P. EEG-based mental fatigue measurement using multi-class support vector machines with confidence estimate. Clin. Neurophysiol. 2008, 119, 1524–1533. [Google Scholar] [CrossRef]
  49. Plechawska-Wójcik, M.; Borys, M.; Tokovarov, M.; Kaczorowska, M.; Wesołowska, K.; Wawrzyk, M. Classifying cognitive workload based on brain waves signal in the arithmetic tasks’ study. In Proceedings of the 2018 11th International Conference on Human System Interaction (HSI), Gdansk, Poland, 4–6 July 2018; pp. 277–283. [Google Scholar]
  50. Kutlu, Y.; Yayık, A.; Yildirim, E.; Yildirim, S. LU triangularization extreme learning machine in EEG cognitive task classification. Neural Comput. Appl. 2019, 31, 1117–1126. [Google Scholar] [CrossRef]
  51. Dimitriadis, S.I.; Sun, Y.; Kwok, K.; Laskaris, N.A.; Thakor, N.; Bezerianos, A. Cognitive workload assessment based on the tensorial treatment of EEG estimates of cross-frequency phase interactions. Ann. Biomed. Eng. 2015, 43, 977–989. [Google Scholar] [CrossRef] [PubMed]
  52. Plechawska-Wójcik, M.; Wawrzyk, M.; Wesołowska, K.; Kaczorowska, M.; Tokovarov, M.; Dmytruk, R.; Borys, M. EEG spectral analysis of human cognitive workload study. Studia Informatica 2017, 38, 17–30. [Google Scholar]
  53. Le, A.S.; Aoki, H.; Murase, F.; Ishida, K. A novel method for classifying driver cognitive distraction under naturalistic conditions with information from near-infrared spectroscopy. Front. Hum. Neurosci. 2018, 12, 431. [Google Scholar] [CrossRef] [PubMed] [Green Version]
  54. Son, J.; Oh, H.; Park, M. Identification of driver cognitive workload using support vector machines with driving performance, physiology and eye movement in a driving simulator. Int. J. Precis. Eng. Manuf. 2013, 14, 1321–1327. [Google Scholar] [CrossRef]
  55. Zarjam, P.; Epps, J.; Lovell, N.H. Beyond subjective self-rating: EEG signal classification of cognitive workload. IEEE Trans. Auton. Ment. Dev. 2015, 7, 301–310. [Google Scholar] [CrossRef]
  56. Jusas, V.; Samuvel, S.G. Classification of motor imagery using combination of feature extraction and reduction methods for brain-computer interface. Inf. Technol. Control. 2019, 48, 225–234. [Google Scholar] [CrossRef] [Green Version]
  57. Borys, M.; Tokovarov, M.; Wawrzyk, M.; Wesołowska, K.; Plechawska-Wójcik, M.; Dmytruk, R.; Kaczorowska, M. An analysis of eye-tracking and electroencephalography data for cognitive load measurement during arithmetic tasks. In Proceedings of the 2017 10th International Symposium on Advanced Topics in Electrical Engineering (ATEE), Bucharest, Romania, 23–25 March 2017; pp. 287–292. [Google Scholar]
  58. Bigdely-Shamlo, N.; Mullen, T.; Kothe, C.; Su, K.-M.; Robbins, K.A. The PREP pipeline: Standardized preprocessing for large-scale EEG analysis. Front. Neuroinform. 2015, 9, 16. [Google Scholar] [CrossRef]
  59. Winkler, I.; Debener, S.; Muller, K.-R.; Tangermann, M. On the influence of high-pass filtering on ICA-based artifact reduction in EEG-ERP. Conf. Proc. IEEE Eng. Med. Biol. Soc. 2015, 2015, 4101–4105. [Google Scholar]
  60. Gabard-Durnam, L.J.; Mendez Leal, A.S.; Wilkinson, C.L.; Levin, A.R. The Harvard Automated Processing Pipeline for Electroencephalography (HAPPE): Standardized processing software for developmental and high-artifact data. Front. Neurosci. 2018, 12, 97. [Google Scholar] [CrossRef]
  61. Roffo, G.; Melzi, S. Features selection via eigenvector centrality. In Proceedings of the International Workshop on New Frontiers in Mining Complex Patterns (NFMCP 2016), Riva del Garda, Italy, 19 September 2016; pp. 1–12. [Google Scholar]
  62. Winkler, I.; Haufe, S.; Tangermann, M. Automatic classification of artifactual ICA-components for artifact removal in EEG signals. Behav. Brain Funct. 2011, 7, 30. [Google Scholar] [CrossRef] [PubMed] [Green Version]
  63. Pion-Tonachini, L.; Kreutz-Delgado, K.; Makeig, S. ICLabel: An automated electroencephalographic independent component classifier, dataset, and website. NeuroImage 2019, 198, 181–197. [Google Scholar] [CrossRef] [PubMed] [Green Version]
  64. Uktveris, T.; Jusas, V. Application of convolutional neural networks to four-class motor imagery classification problem. Inf. Technol. Control 2017, 46, 260–273. [Google Scholar] [CrossRef] [Green Version]
  65. Sun, Y.; Li, J. Iterative RELIEF for feature weighting. In Proceedings of the 23rd International Conference on Machine Learning, Pittsburgh, PA, USA, 25–29 June 2006; pp. 913–920. [Google Scholar]
  66. Peng, H.; Long, F.; Ding, C. Feature selection based on mutual information criteria of max-dependency max-relevance and min-redundancy. IEEE Trans. Pattern Anal. Mach. Intell. 2005, 27, 1226–1238. [Google Scholar] [CrossRef]
  67. Gu, Q.; Li, Z.; Han, J. Generalized fisher score for feature selection. arXiv 2012, arXiv:1202.3725. [Google Scholar]
  68. Elkin, C.; Devabhaktuni, V. Comparative analysis of machine learning techniques in assessing cognitive workload. In Advances in Neuroergonomics and Cognitive Engineering; Ayaz, H., Ed.; Advances in Intelligent Systems and Computing; Springer: Cham, Switzerland, 2019; Volume 953, pp. 185–195. [Google Scholar]
Figure 1. The experiment procedure.
Applsci 09 05340 g001
Figure 2. The procedure of one stimulus.
Applsci 09 05340 g002
Figure 3. The procedure of data processing.
Applsci 09 05340 g003
Figure 4. Relationship of cognitive workload and wave power over the entire frequency range.
Applsci 09 05340 g004
Table 1. Overview of cognitive workload classification research. Two approaches were regarded: subject independent (si) and subject dependent (sd).
PaperWorkload Class NumberSubject NumberClassifierMetricMetric ValueApproach
[45]38Artificial Neutral Networkaccuracy0.74si
20.87
[33]38Artificial Neutral Networkaccuracy0.83si
[37]cognitive workload level was defined as real number from the range [0.6; 7.2]10Linear Regressioncorrelation coefficient between predicted and actual difficulty level0.84si
[46]610Linear Regressioncorrelation coefficient between predicted and actual difficulty level0.82si
[34]216SVMaccuracy0.94sd
[38]213SVM, ELMaccuracy0.99sd
0.89si
[40]231LDA, LIBLINEAR, kNN, LIBSVMaccuracy0.95sd
[35]26SVMaccuracy0.93sd
[41]396SVMmistrust rate0.29sd
[36]228SVM, k-Means, kNNaccuracy0.92; 0.86; 0.58sd
[53]326Decision tree, discriminant analysis, logistic
regression, SVM, kNN, ensemble
classifier
accuracy0.84–0.89sd
0.81–0.95si
[54]230SVMaccuracy0.58–0.89si
[48]510SVMaccuracy0.91sd
[42]512Random forestaccuracy0.87sd
[50]218ELMaccuracy0.93sd
0.91si
[47]218kNN, decision tree
ANOVA, CFT
accuracy0.92sd
[43]210SVMaccuracy0.97sd
[44] kNNaccuracy0.8sd
[55]212MLPaccuracy0.99si
40.88
[51]516LDA, kNNaccuracy0.96sd
[33]38hierarchical Bayes model,
neural net, naive Bayes
accuracy0.8si
[56]49SVM, LDAaccuracy0.56sd
Table 2. Spearman correlation results obtained for three levels of cognitive workload.
FeatureCorrelation Coefficient p-Value
Cz beta10.35<0.001
Cz beta20.32<0.001
Fz beta10.27<0.001
C4 beta20.26<0.001
P4 beta20.25<0.001
F4 beta20.24<0.001
F3 beta10.24<0.001
C3 beta10.24<0.001
O1 beta10.24<0.001
F3 alpha0.23<0.001
Table 3. Spearman correlation results obtained for two levels of cognitive workload.
FeatureCorrelation Coefficient p-Value
T6-A2_alpha0.26<0.001
O2-A2_beta10.25<0.001
T6-A2_theta0.22<0.001
T6-A2_beta10.16<0.001
C3-A1_delta0.16<0.001
T6-A2_delta0.14<0.001
Pz-A1_theta0.14<0.001
O2-A2_alpha0.13<0.001
Cz-A2_alpha0.13<0.001
P3-A1_theta0.12<0.001
F3-A1_beta20.12<0.001
Table 4. Results obtained for various classifier models (with the application of a validation dataset).
ClassifierHighest Mean Accuracy (%)Std (%)Feature NumberFS Method, Which Ensured Best Result
SVM82.24.0822
Decision tree (DT)71.14.8511
kNN90.52.6511
Random forest86.33.5292
Table 5. Results obtained for various classifier models (with the application of crossvalidation).
ClassifierHighest Accuracy (%)Std (%)Feature NumberFS Method
SVM82.90.9813
Decision tree (DT)70.41.7511
kNN91.50.7522
Random forest84.61.1621

