Human Factors Analysis of Air Traffic Safety Based on HFACS-BN Model


Abstract
:1. Introduction
2. Methodology and Materials
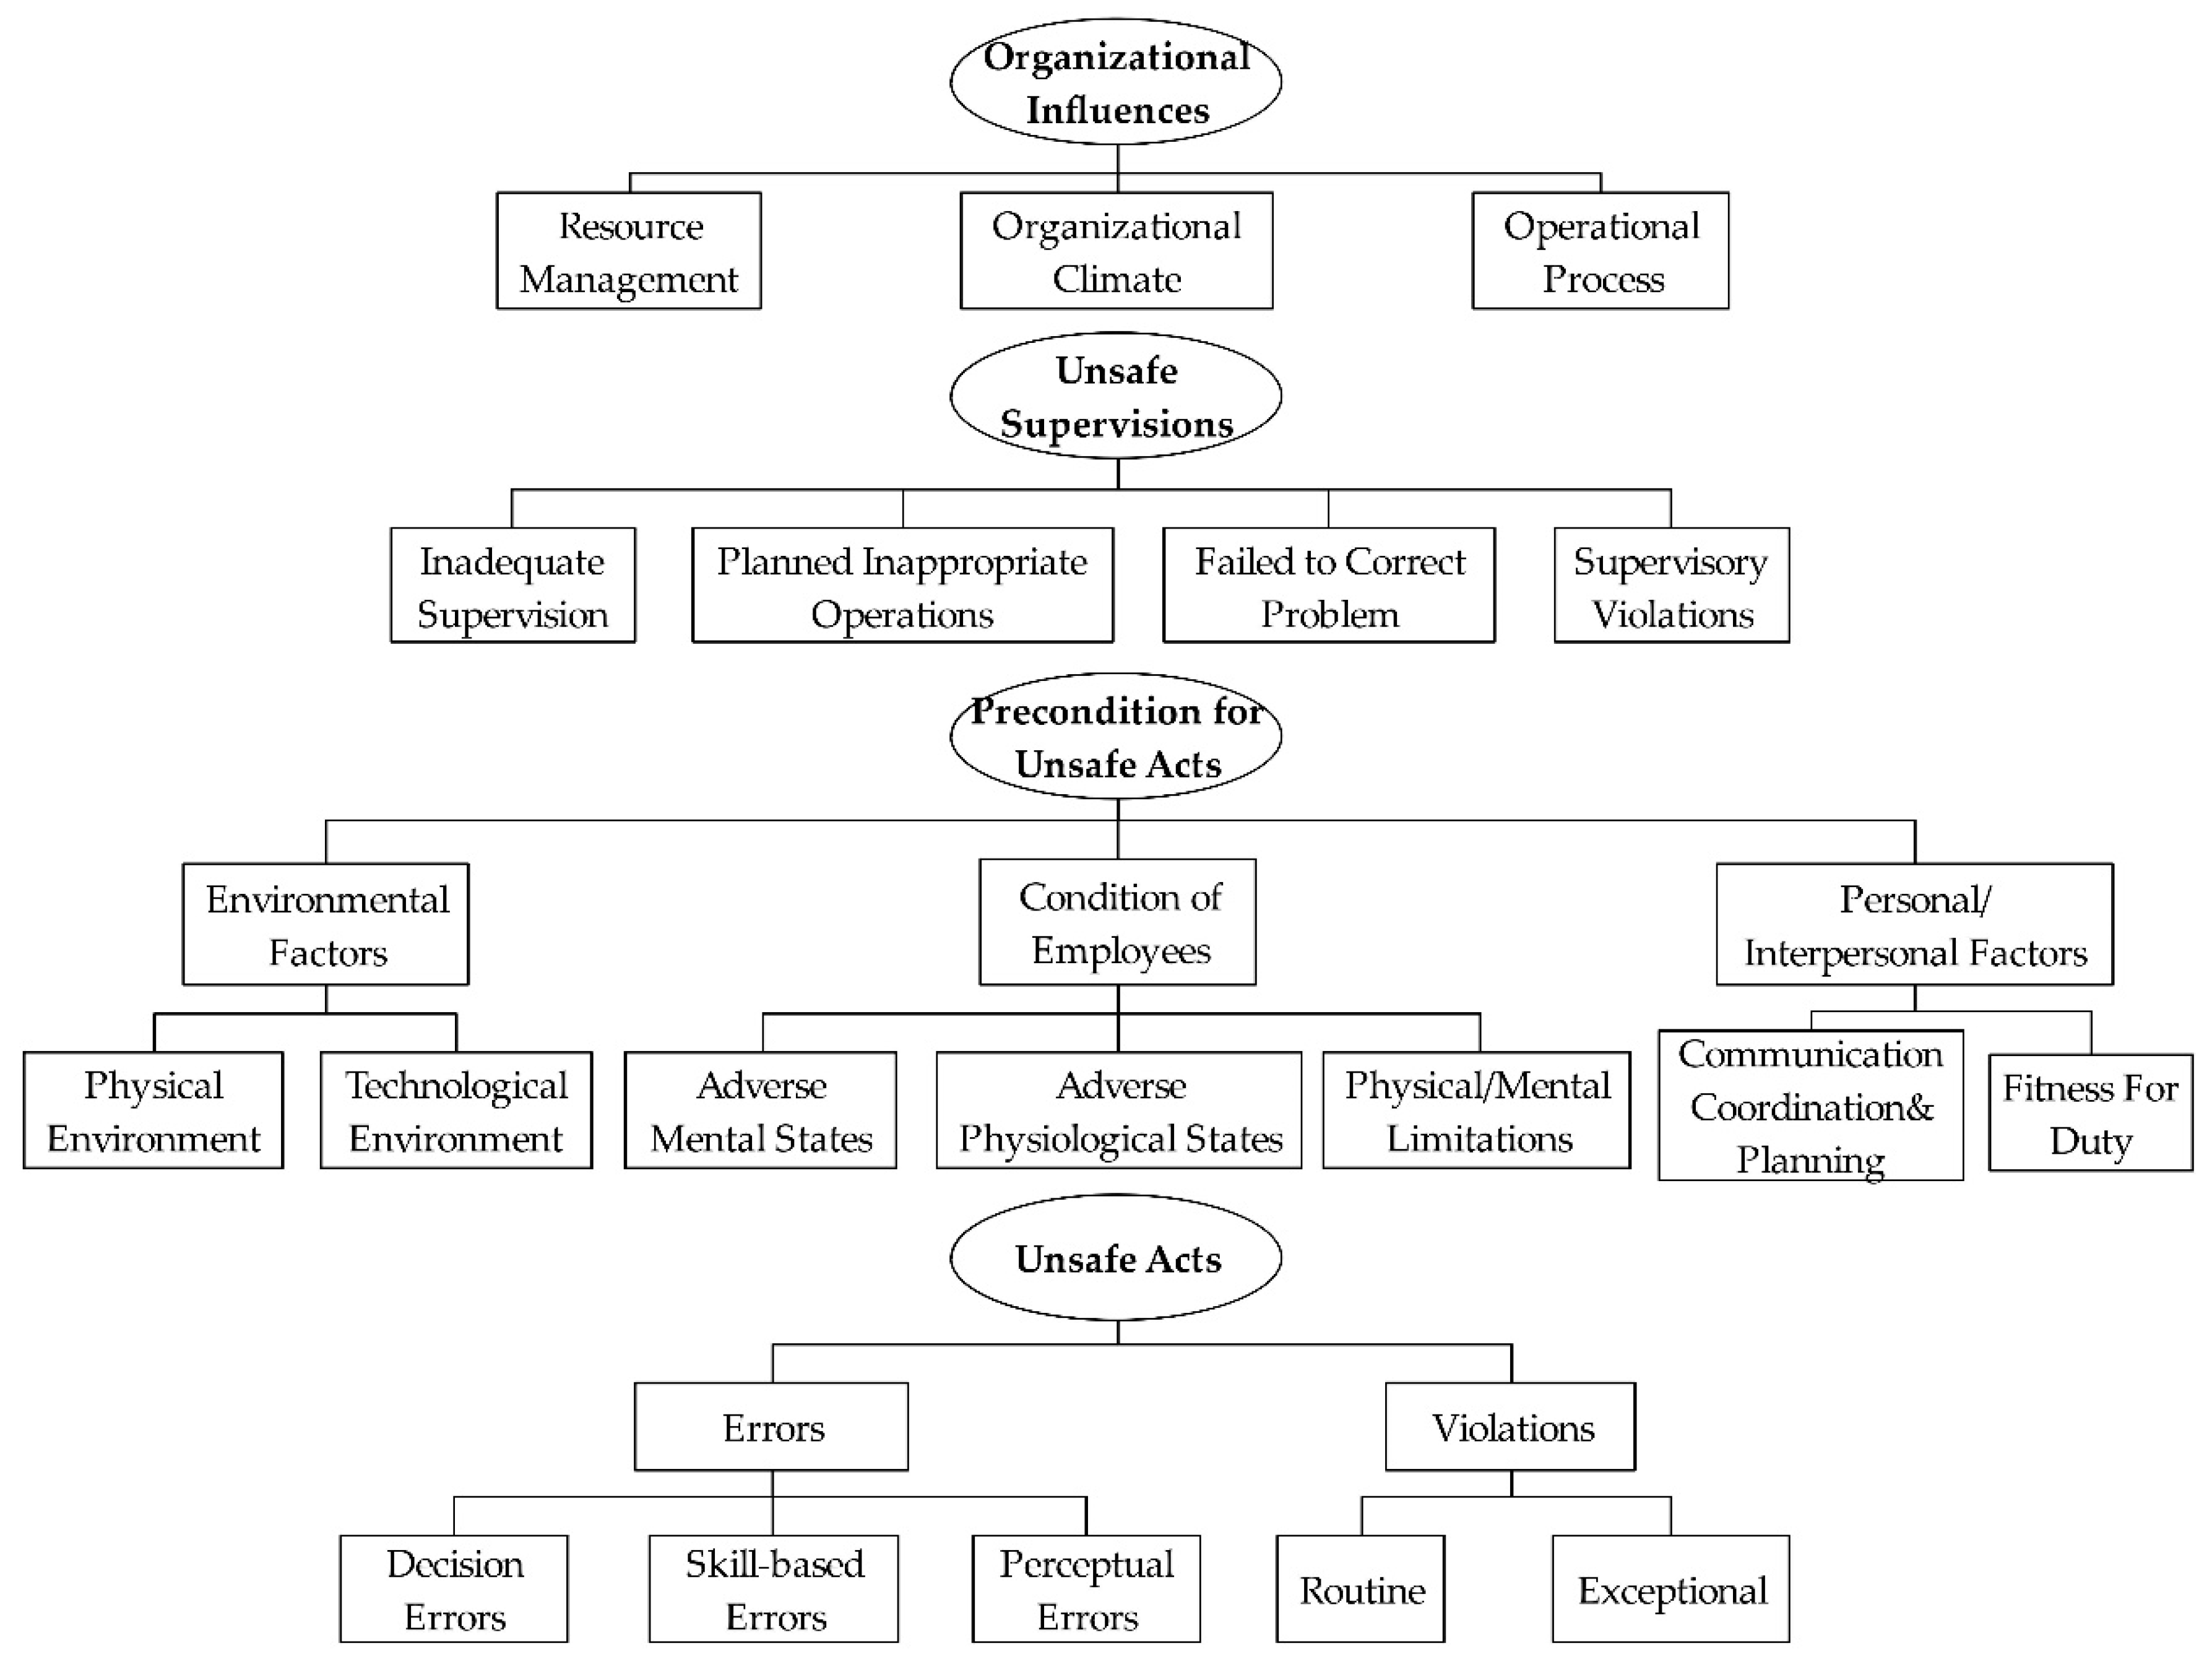
2.1. Human Factors Analysis and Classification System (HFACS)
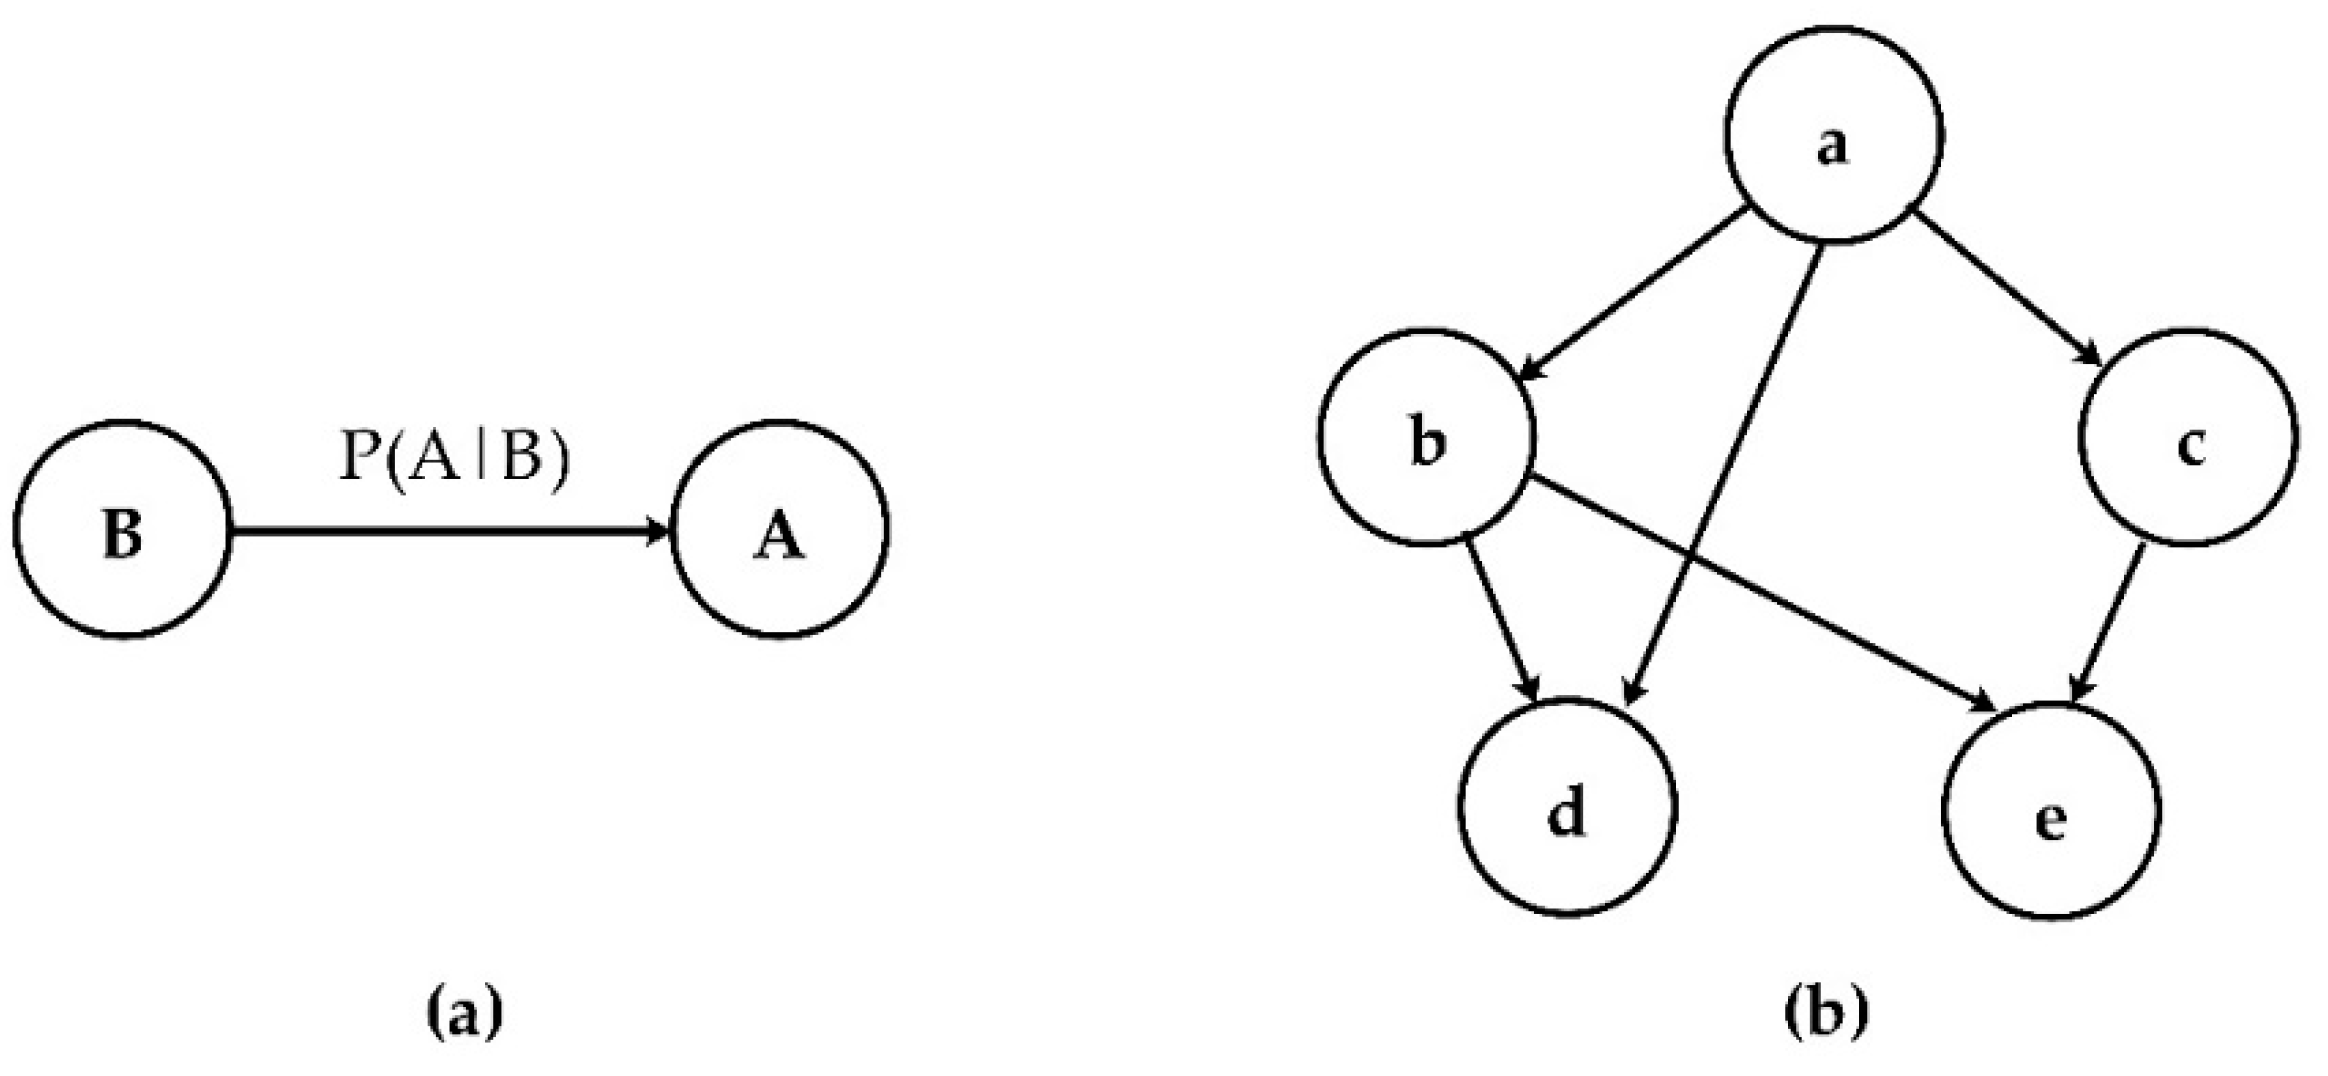
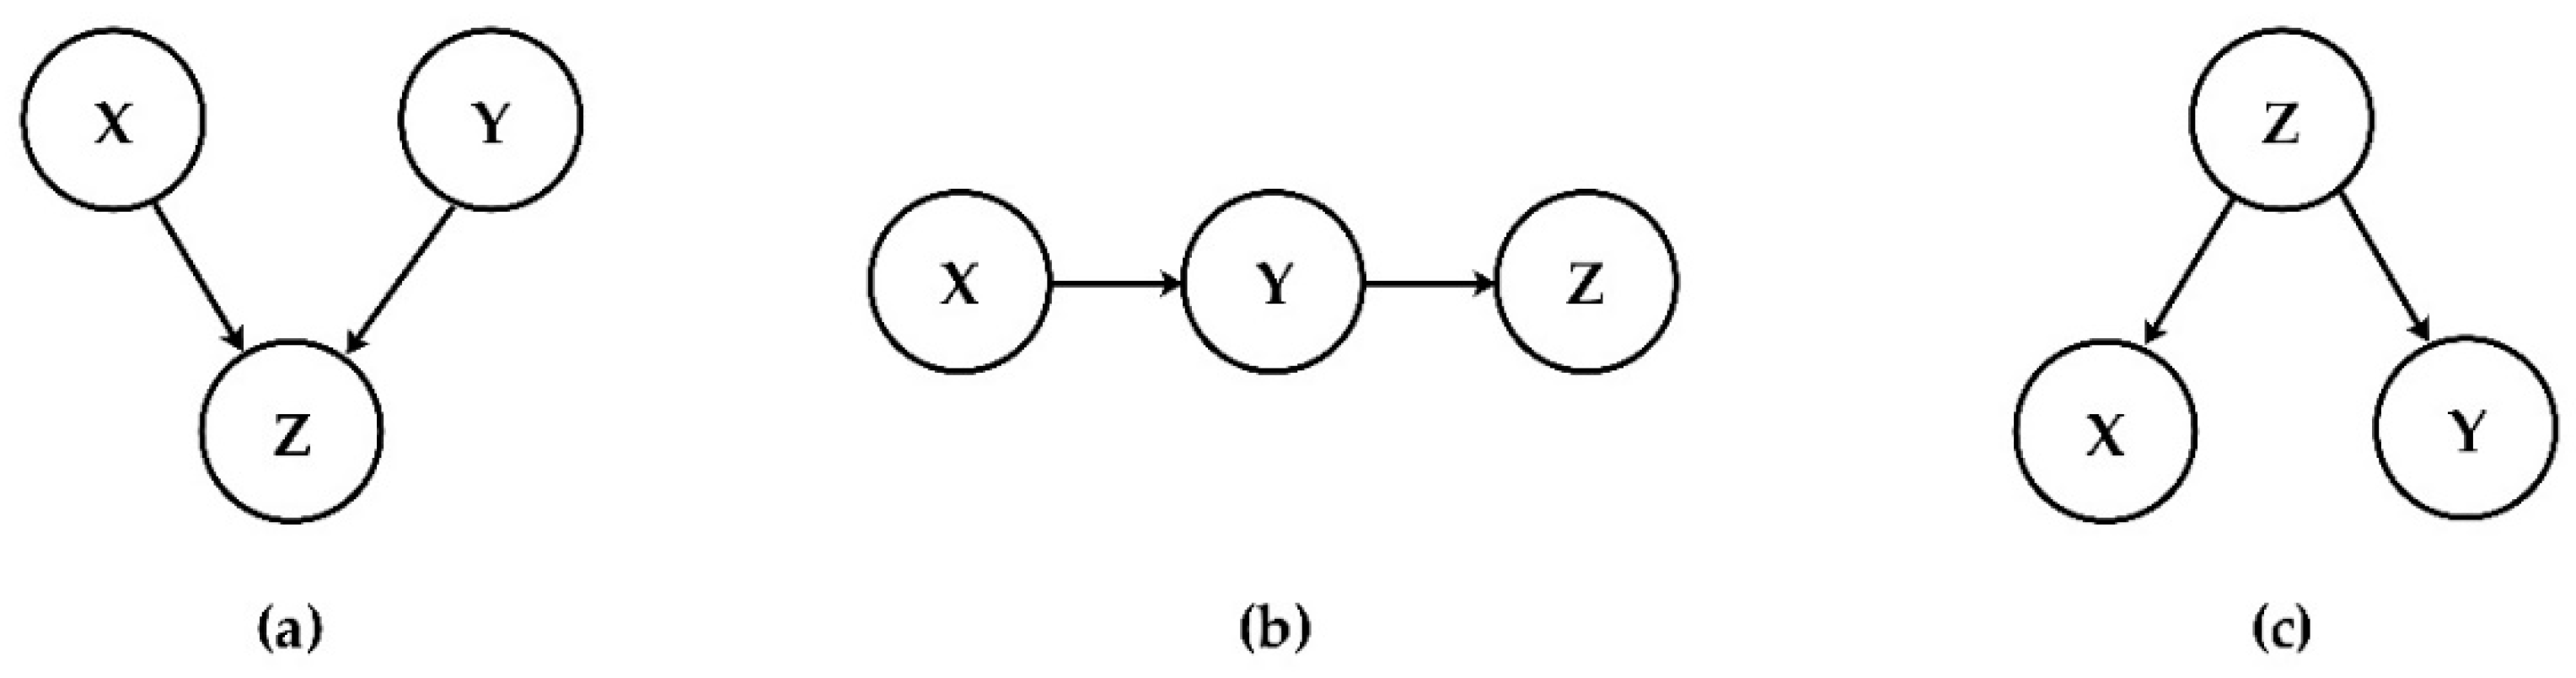
2.2. Bayesian Network Model
2.3. Noisy MAX Model
2.4. Research Framework
3. Theoretical Development
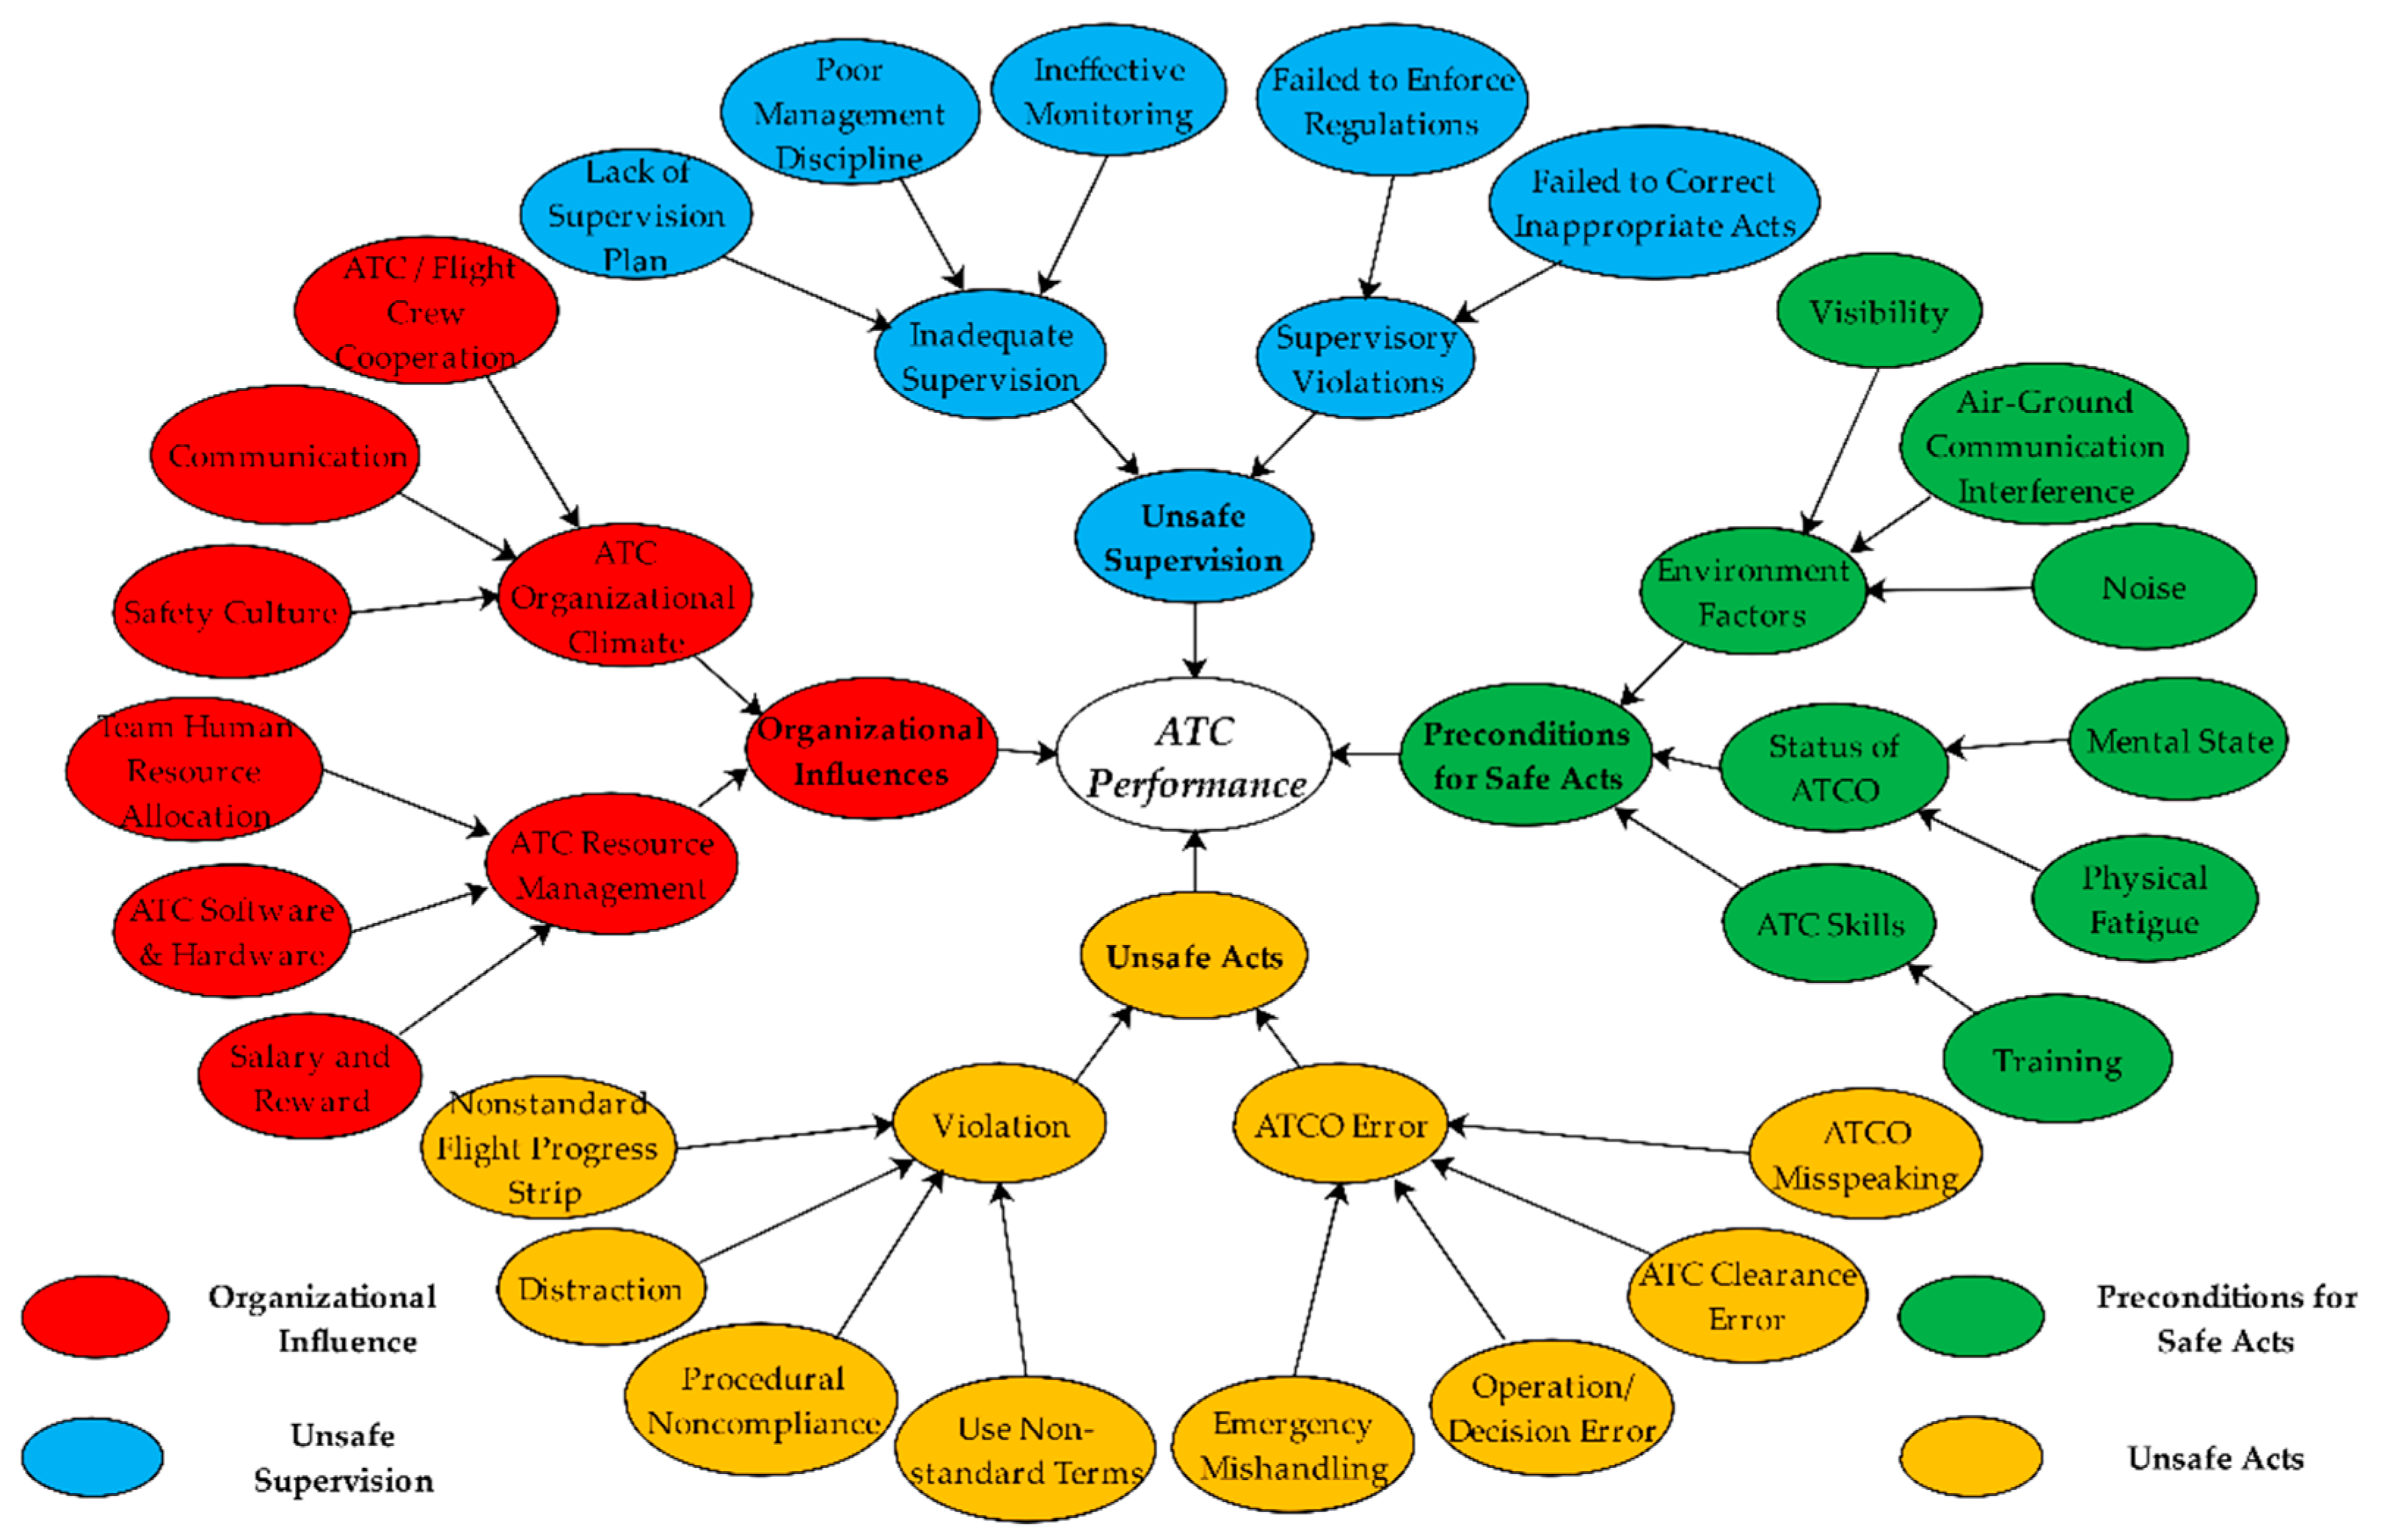
3.1. Network Construction
3.2. Data Collection
3.2.1. Objective Marginal Probability
3.2.2. Subjective Conditional Probability
- Type 1 is used for conditional probabilities assignment, which requires respondents to give conditional probabilities under the condition that only child and parent are considered.
- Type 2 is used for model validation, which requires respondents to select the countermeasures of different nodes that should be taken.
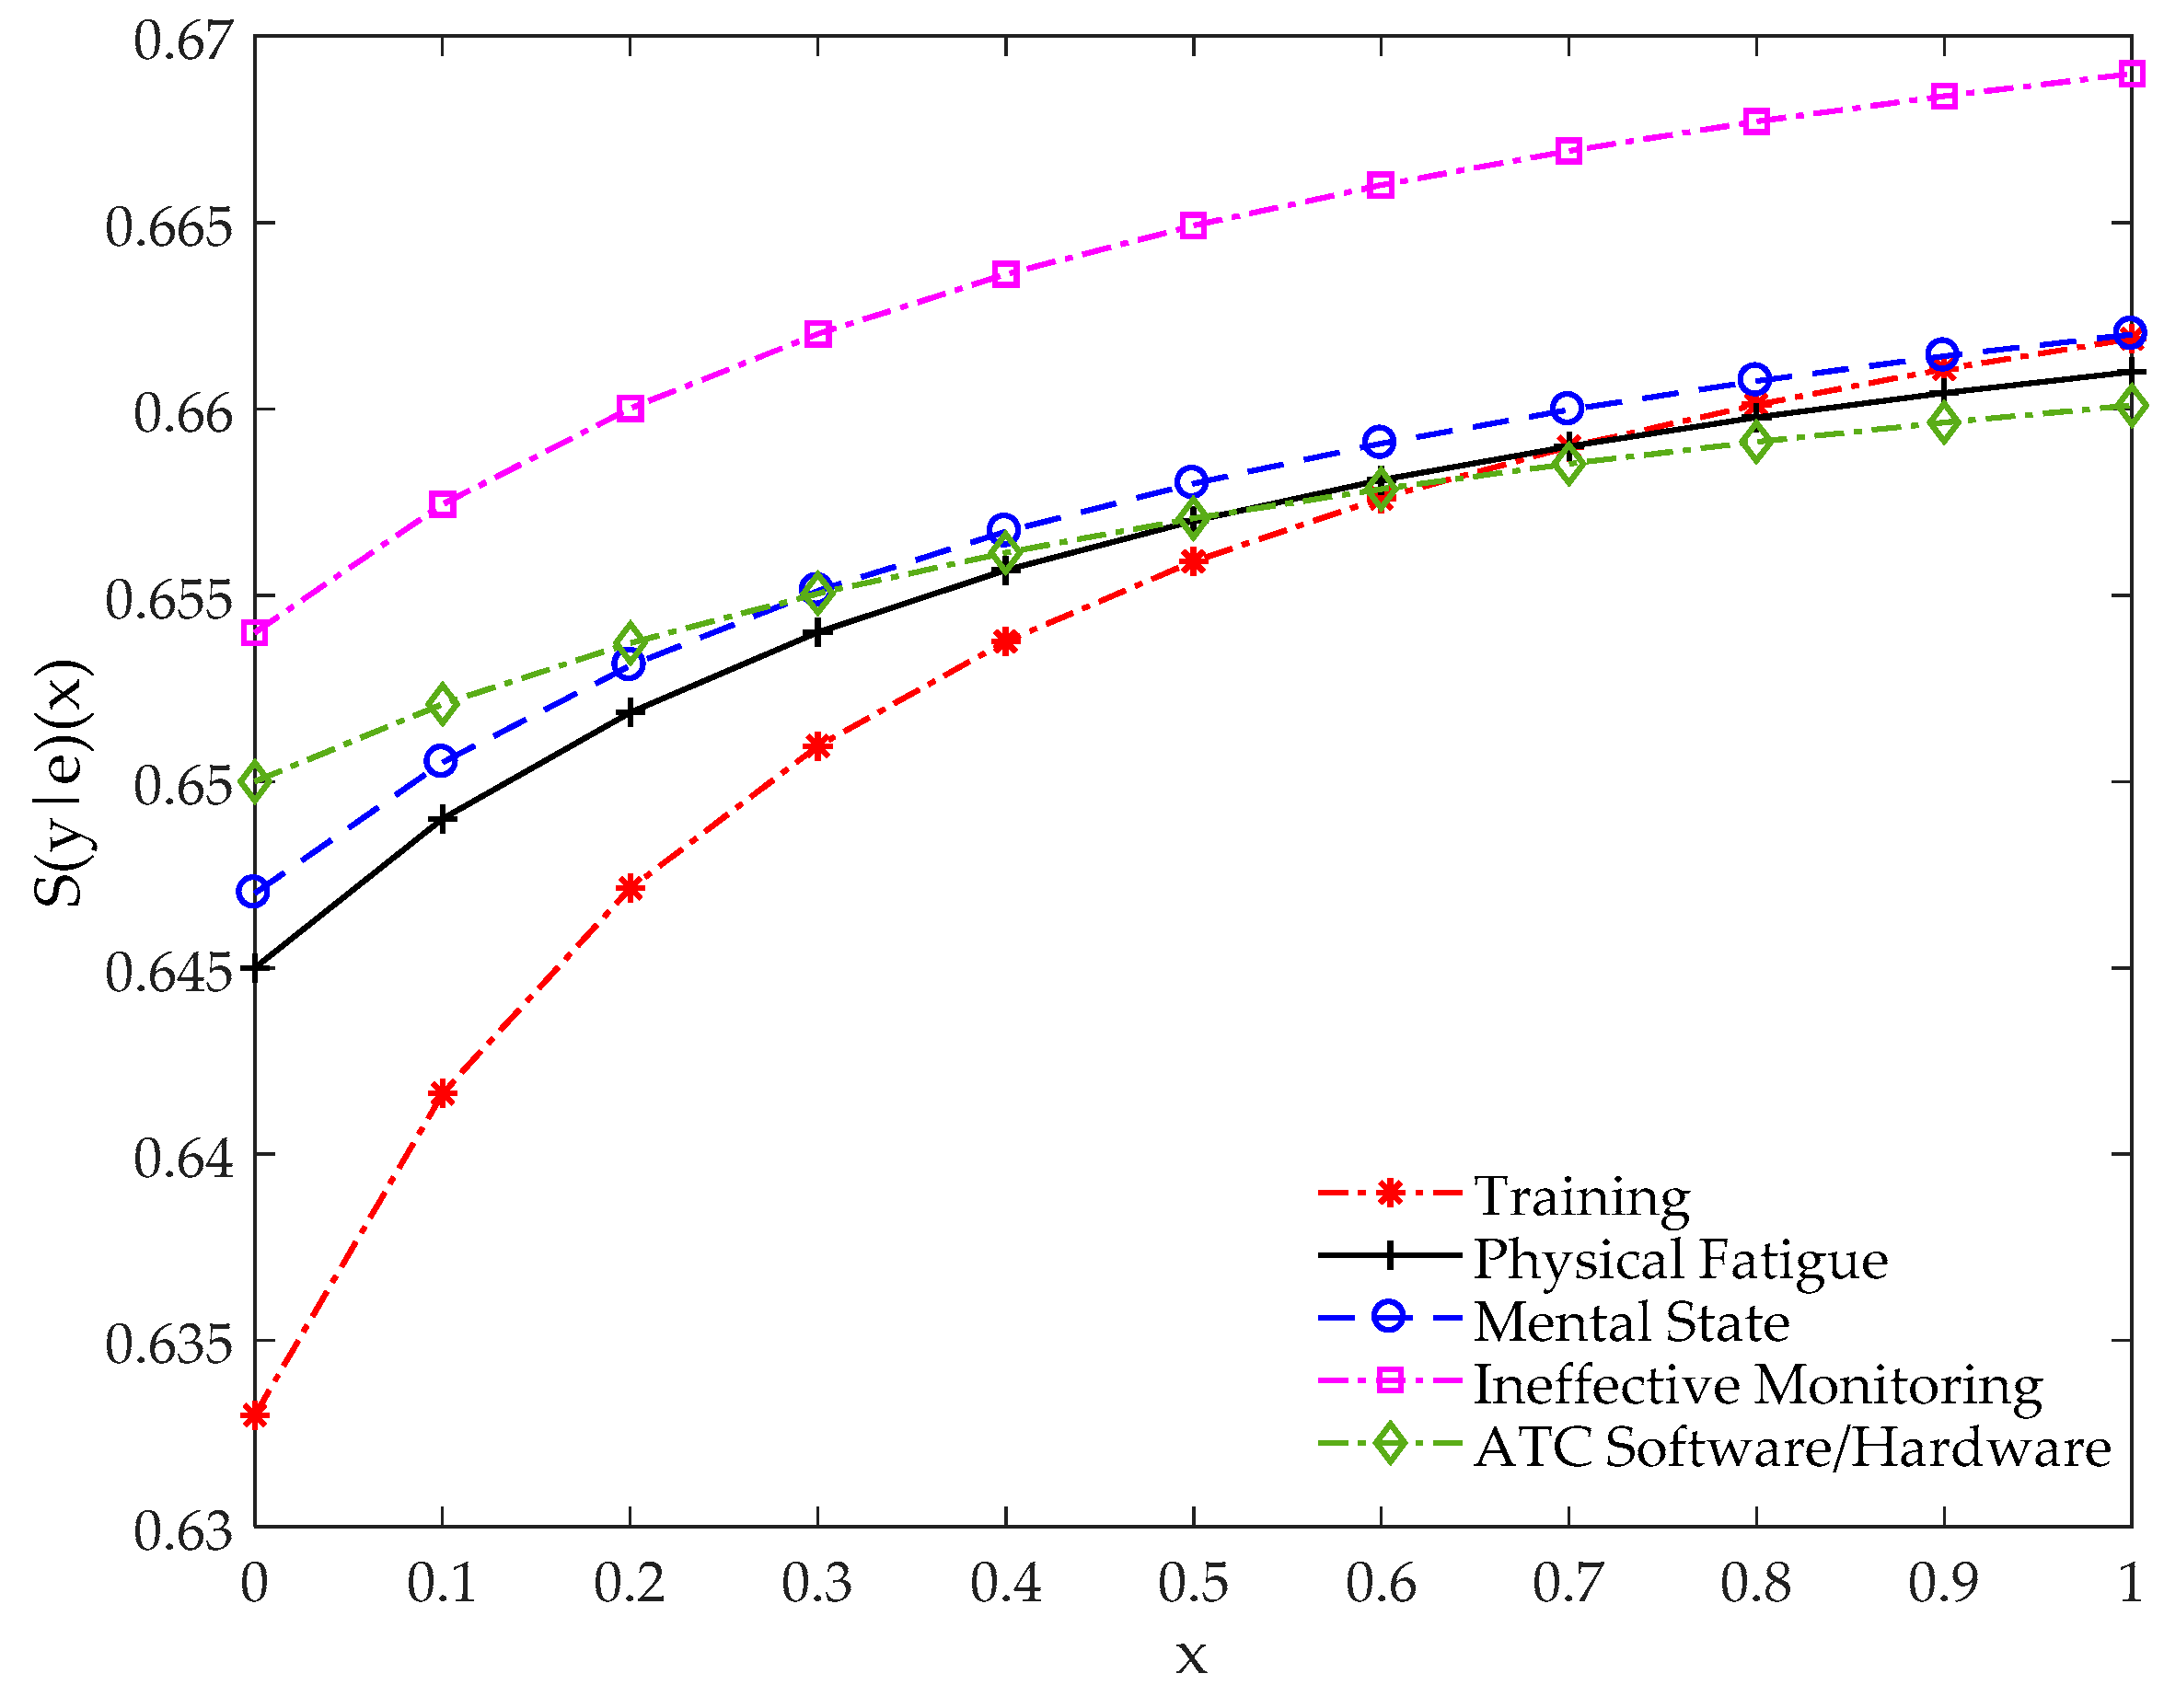
3.3. Sensitivity Analysis
4. Results
4.1. Key Factors
4.2. BN Inference
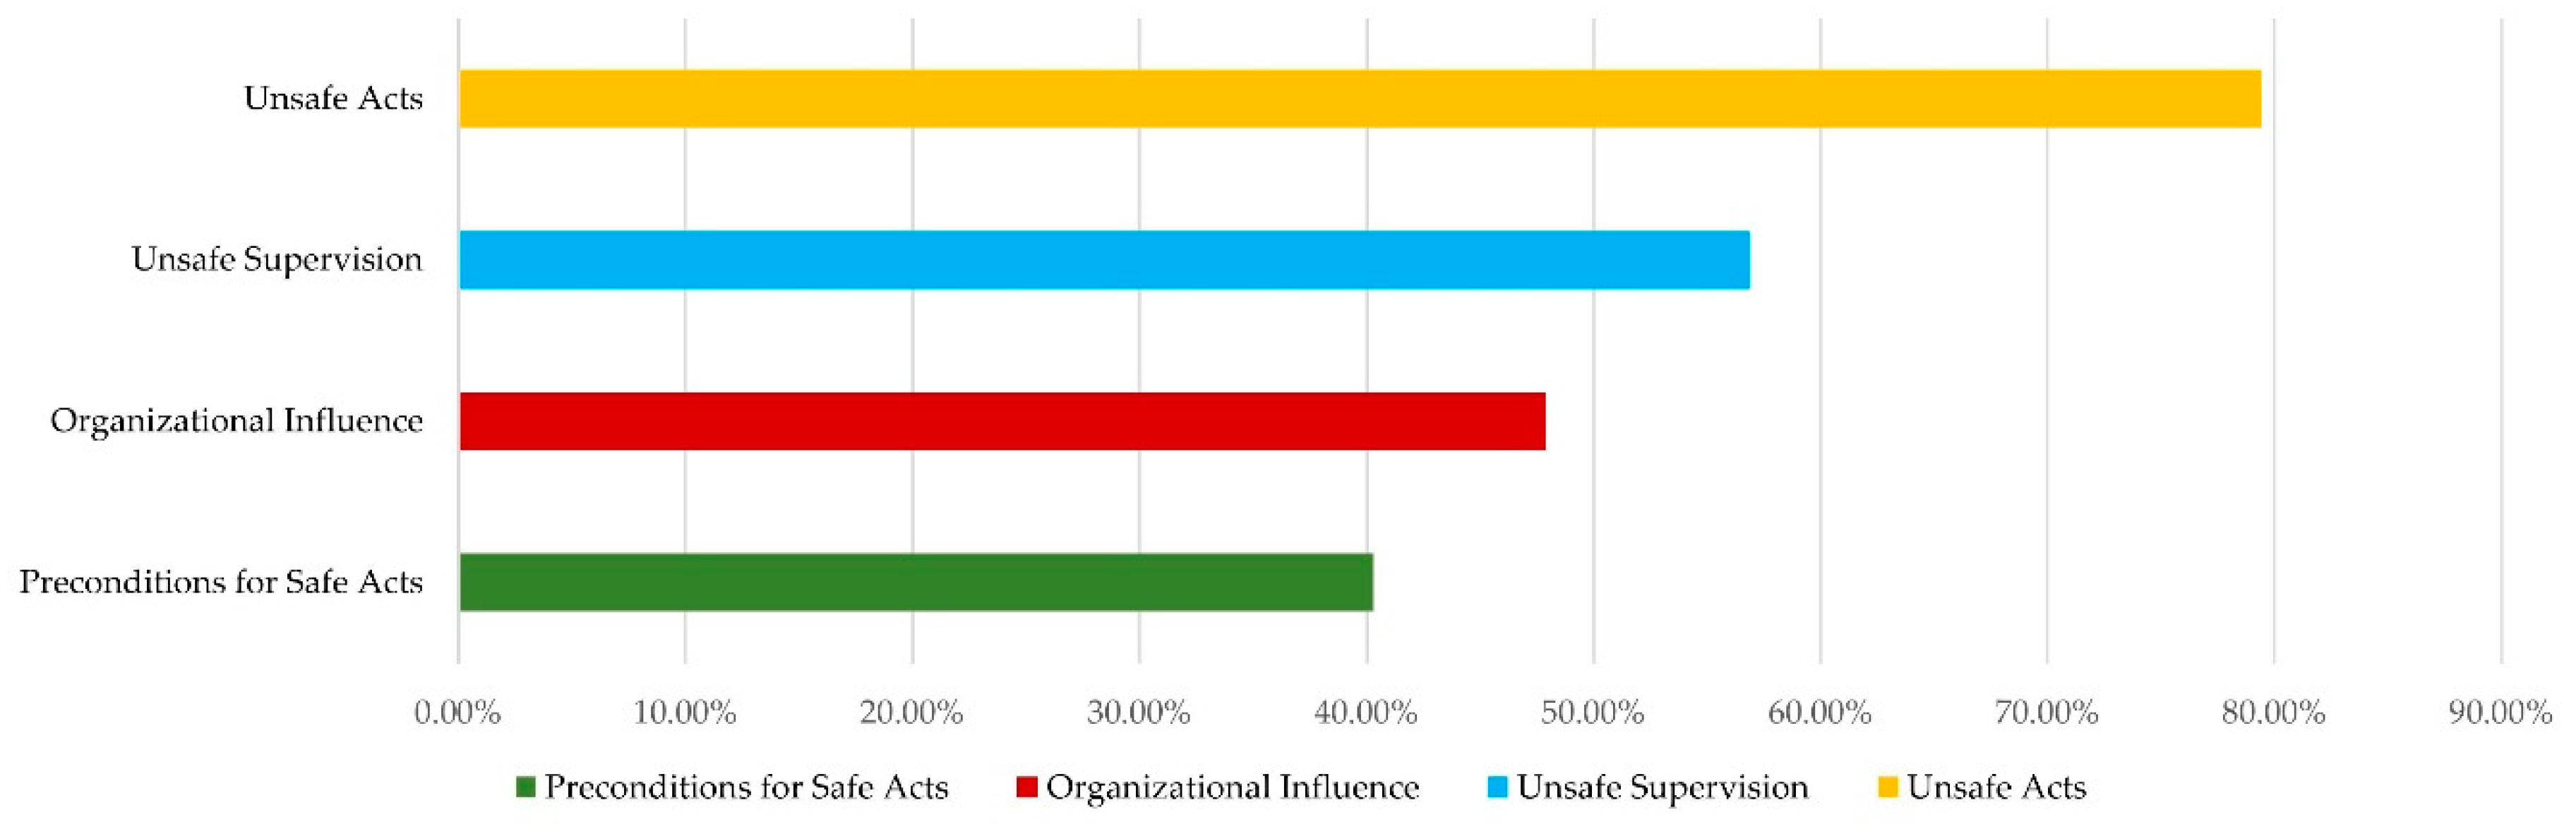
4.3. Model Validation
- Content validity: In order to check the validity of Content, it is necessary to ensure that the BN network only considers the relevant human factor variables and their relations related to ATC. In this regard, all human factors are derived from the literature review and the viewpoint of front-line ATCOs, who also provide great help for the subsequent input of conditional probability between nodes.
- Predictive validity: The most direct and effective verification method is to compare the diagnosis results of the BN model with the database used, which include countermeasure preferences and sensitivity verification.
5. Conclusions
- Almost all accidents have multiple contributory factors and that pilot error is often the probable cause.
- Air traffic control systems vary in size and structure around the world so that where one investigative agency may find ATC, or an associated controller or controllers, responsible for a particular accident, another one may not.
- These data are limited to summarized accident reports based on queried keywords and not based on independent evaluations of all accidents, probable causes, or contributing factors.
- Expert opinions were gathered from one ATC system (i.e., China) and perceptions may not reflect a comprehensive global view.
- The use of expert evaluation and the noisy MAX algorithm to evaluate the prior probability of the root node in the BN model will inevitably involve cognitive bias.
6. Key Points
- “Human error” is an unhelpful yet common explanation for the cause of accidents/incidents in complex activities featuring vast combinations of people and technology (e.g., aviation) [41].
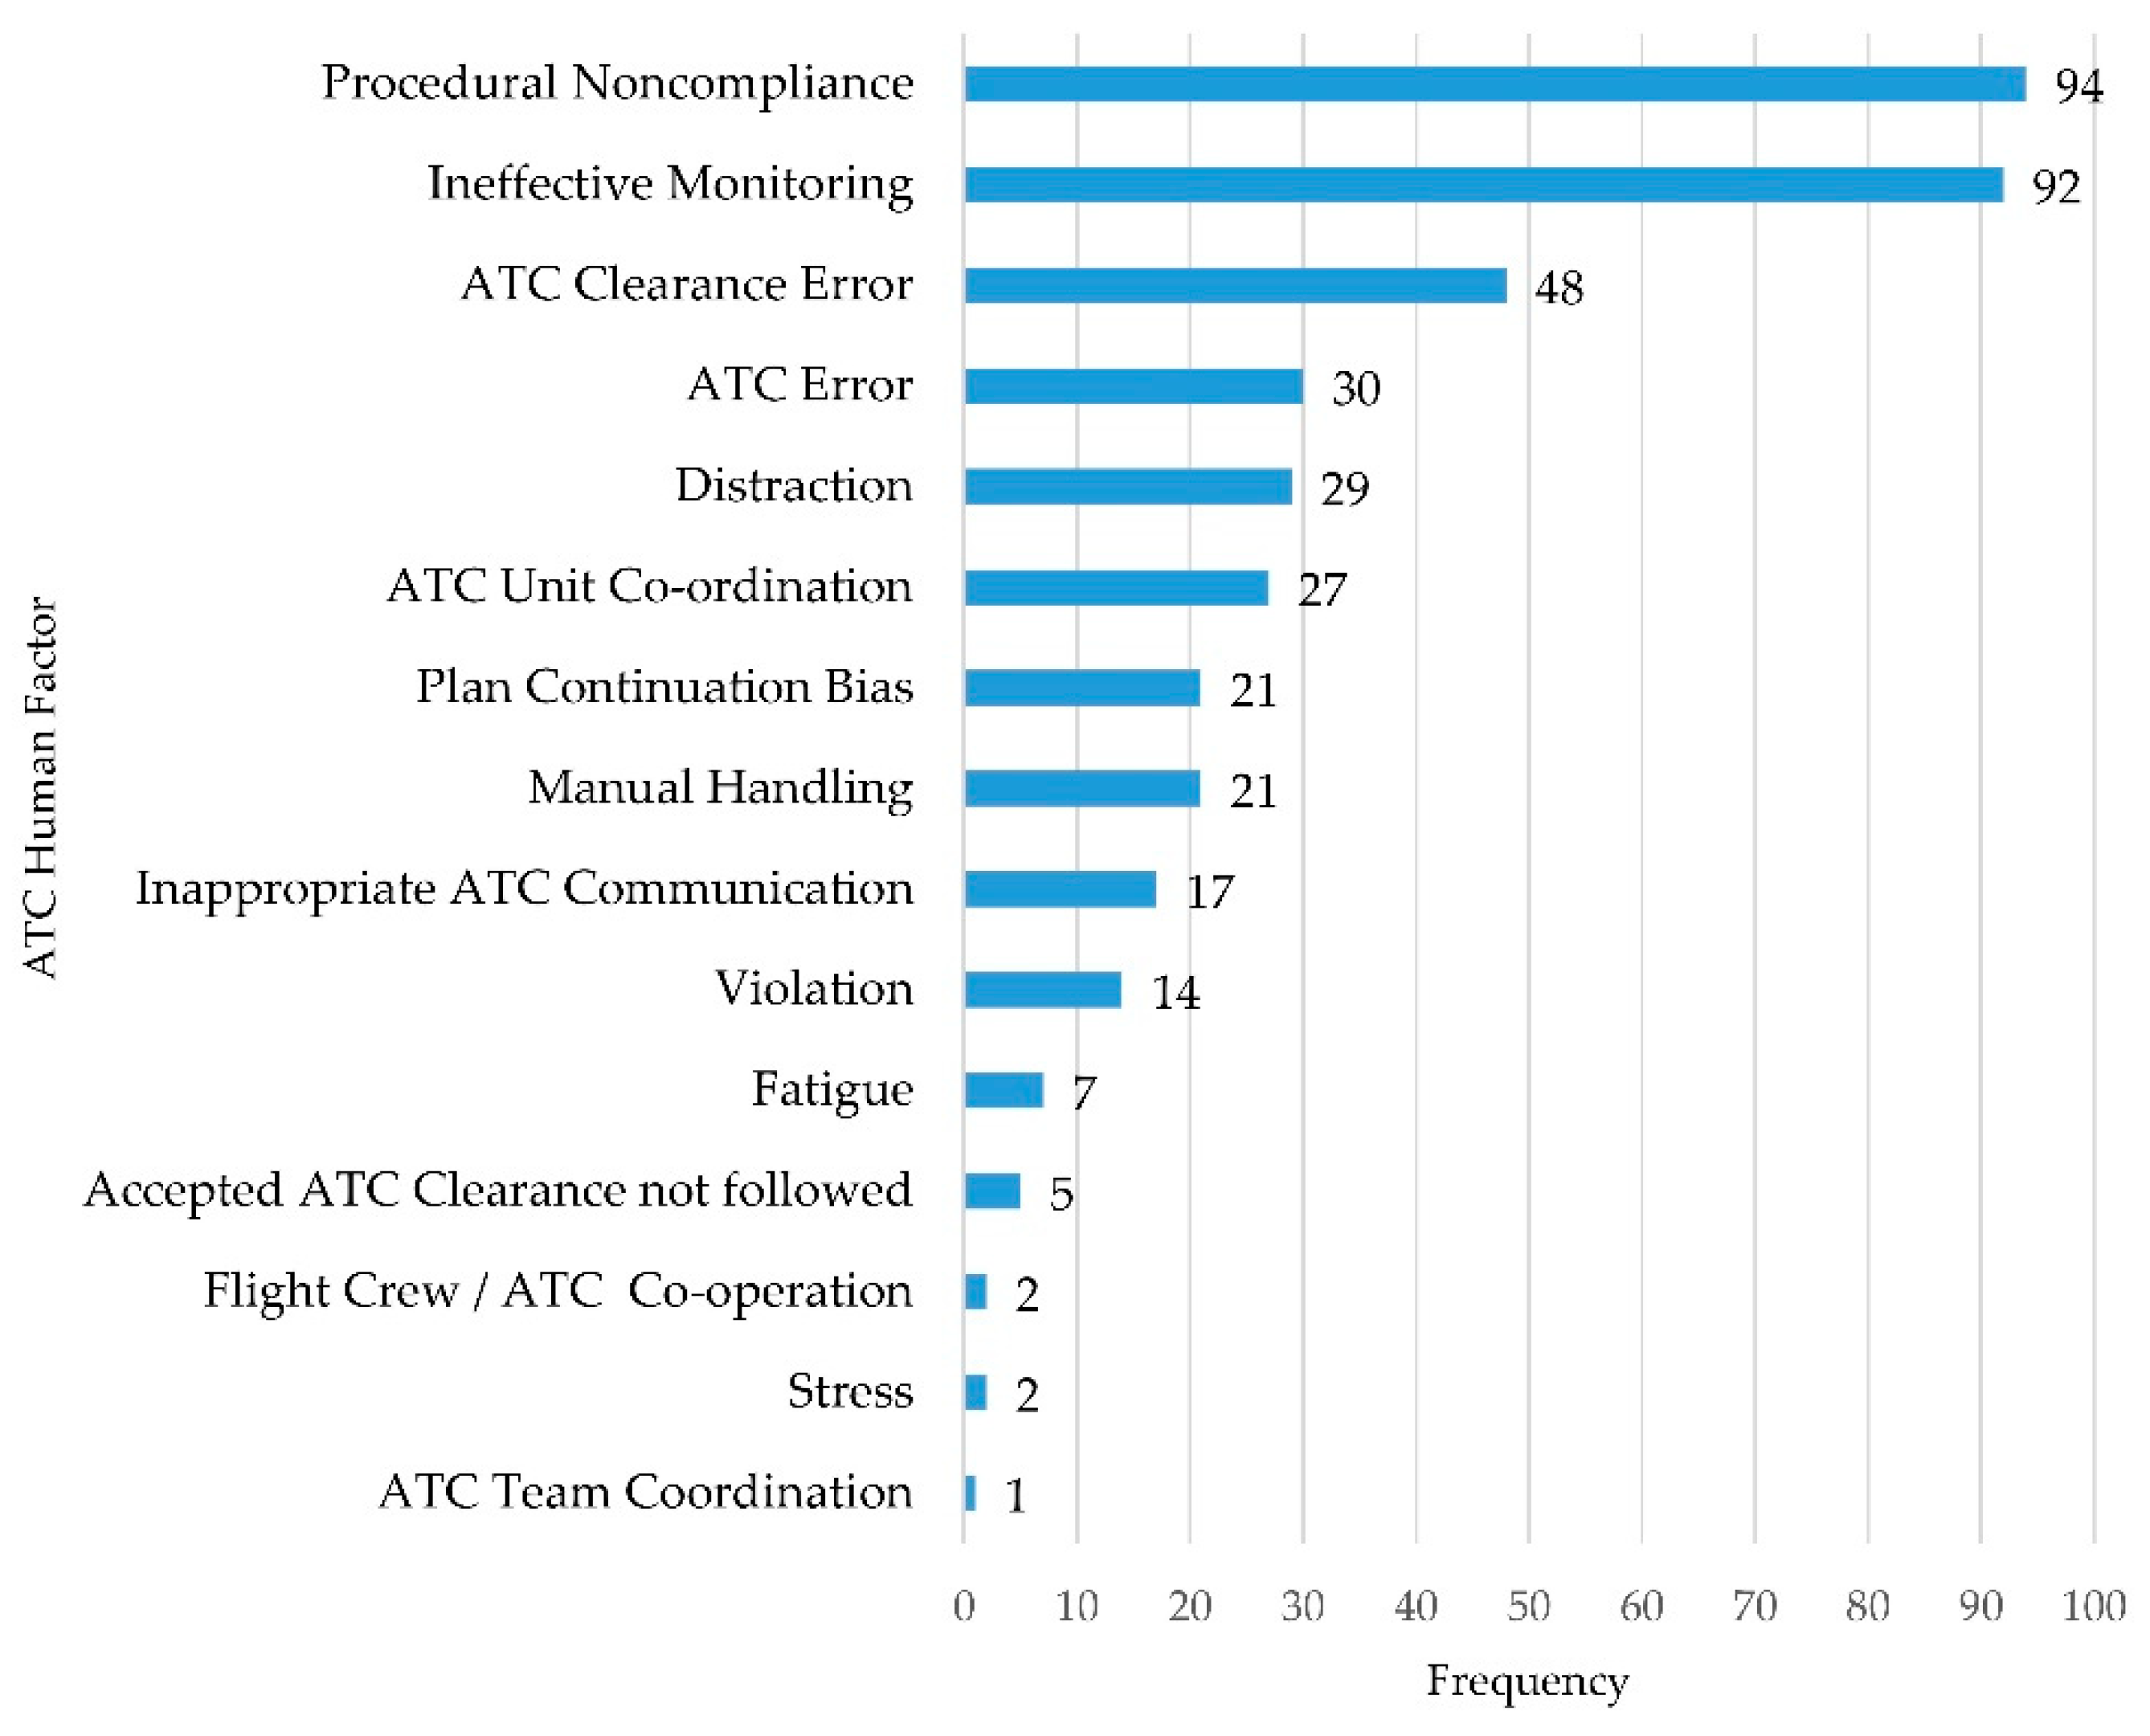
- To better understand the conditions influencing human error in aviation accidents/incidents related to air traffic control, we analyzed the “SKYbrary” database based on the HFACS model and preliminarily identified the human factors affecting ATC performance.
- A subsequent analysis based on BN model combined with accident statistics and expert opinions found that inadequate training, physiological fatigue, and ineffective monitoring were important factors affecting ATC performance continuation aggravated by the lack of regulatory plans.
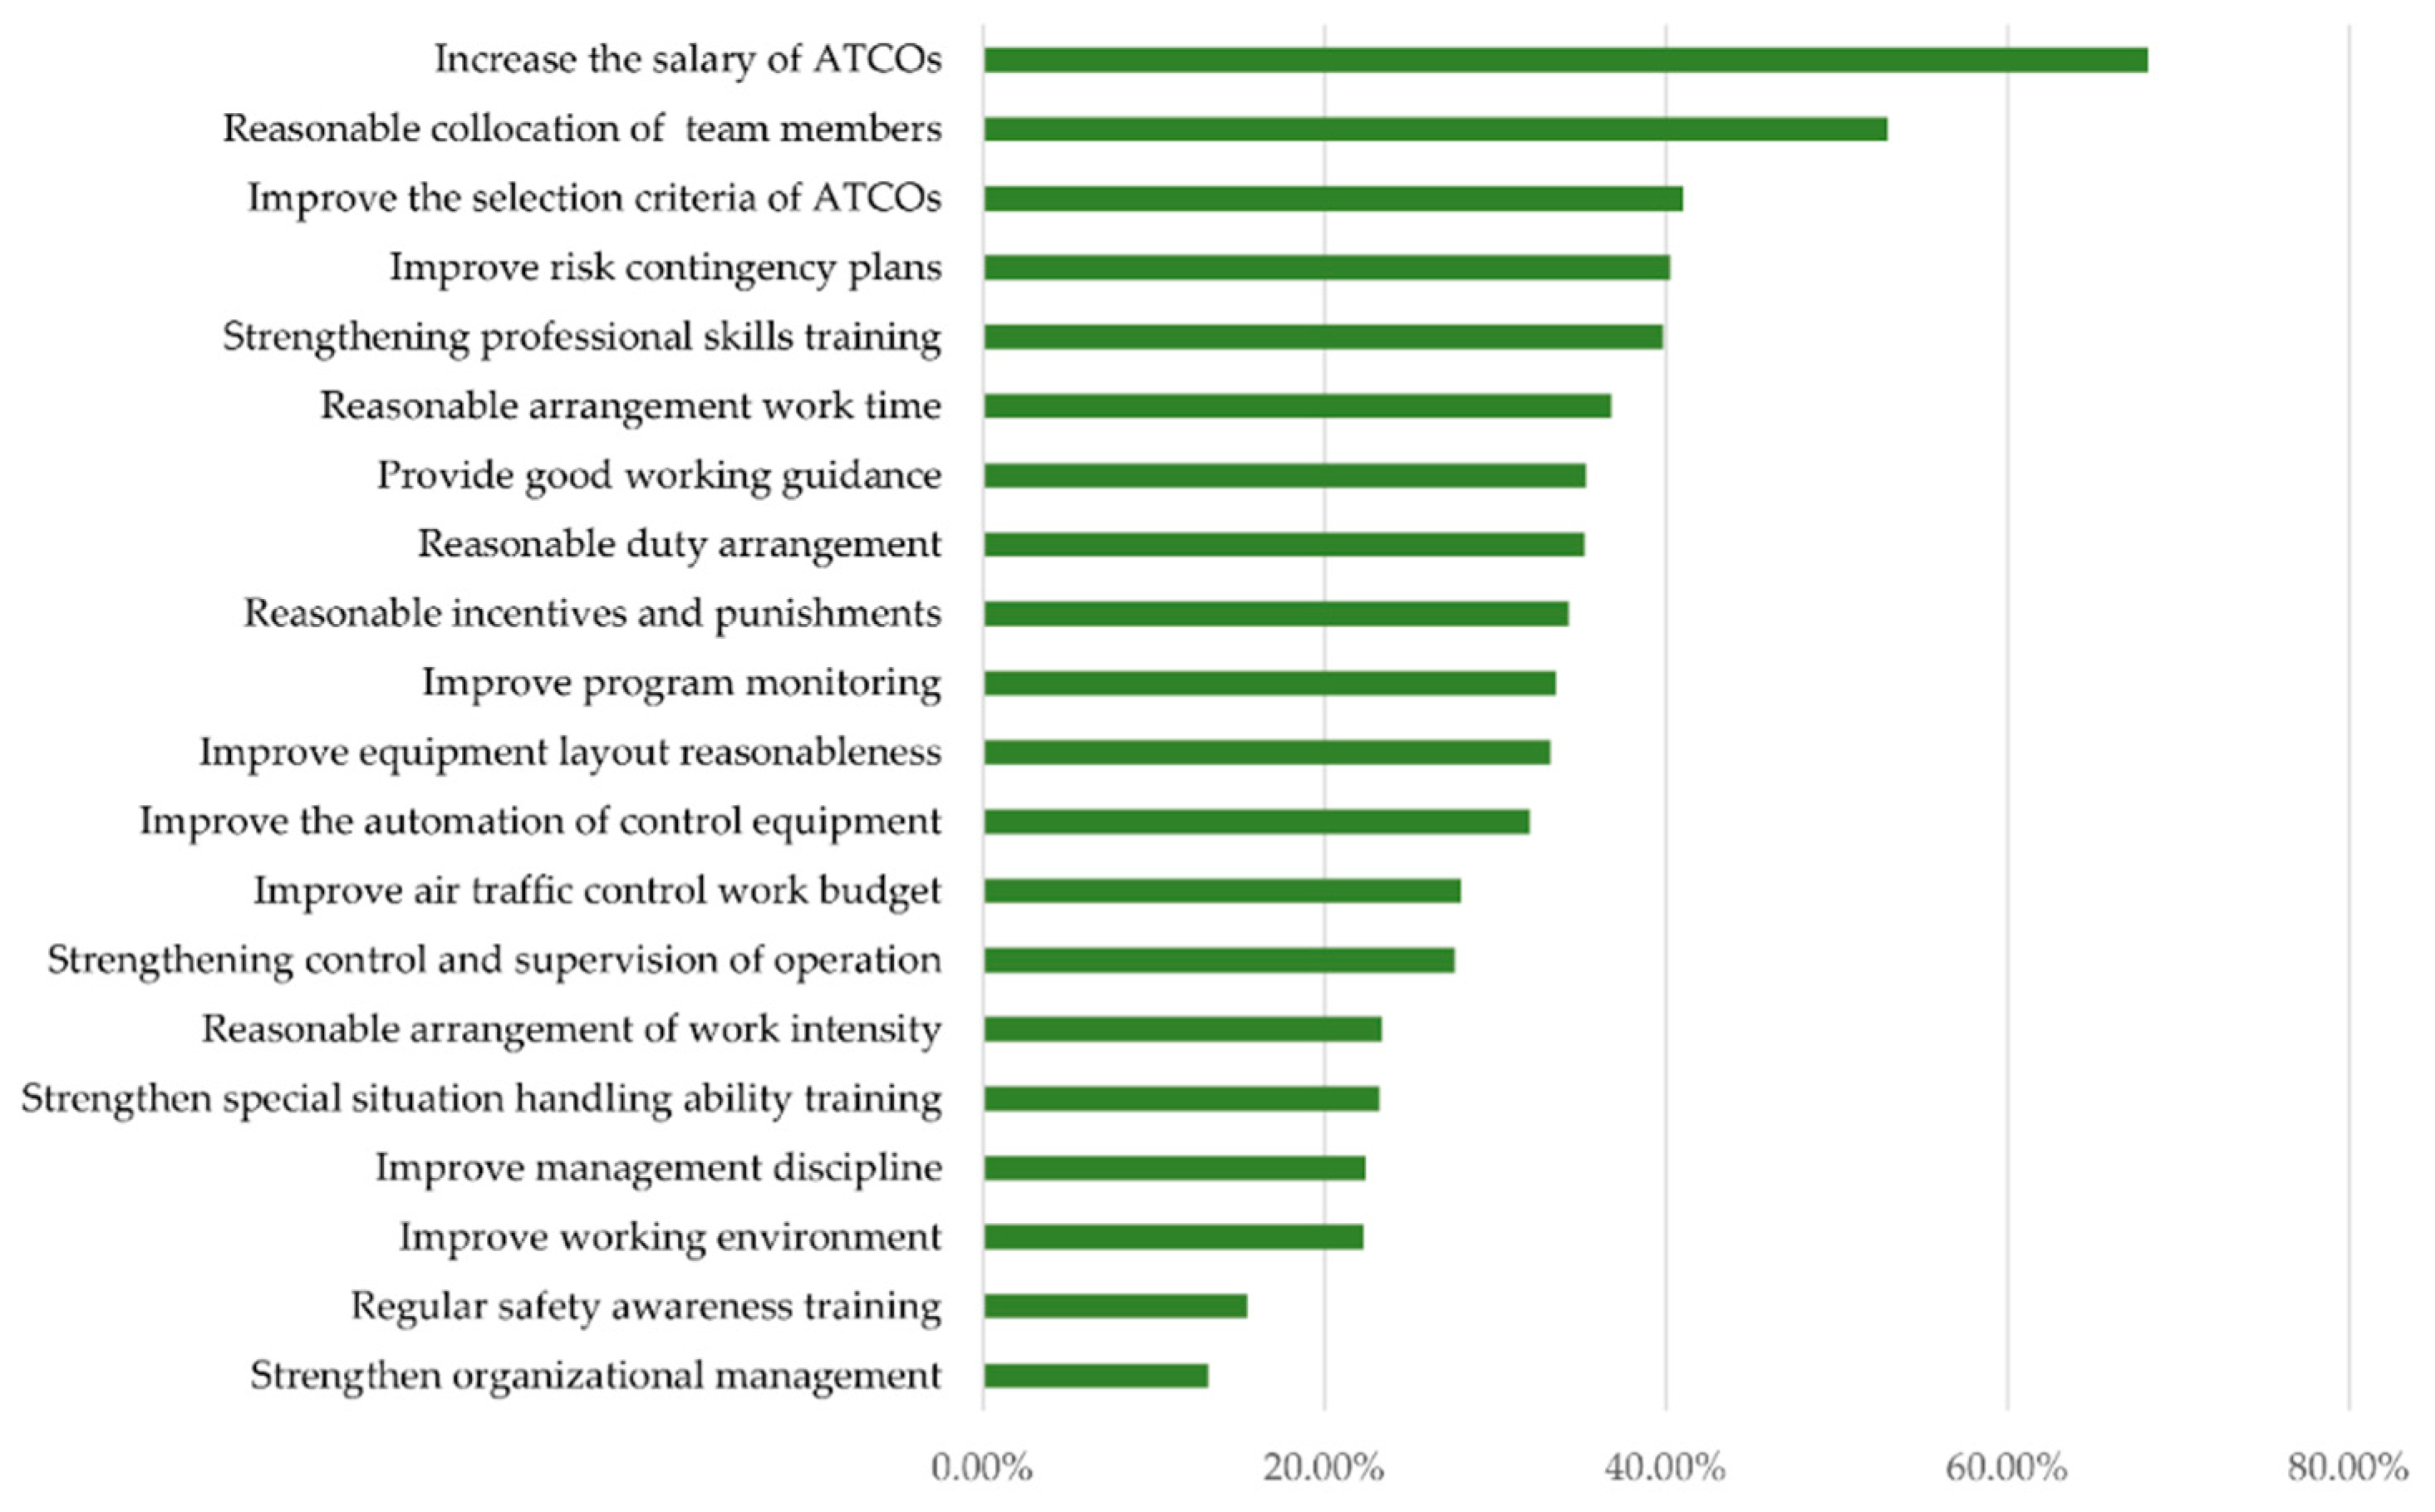
- Meanwhile, validated the effectiveness of key human factors with the help of sensitivity analysis functions and provided countermeasures to improve ATC performance through surveys of respondents.
Author Contributions
Funding
Acknowledgments
Conflicts of Interest
Appendix A

| Date | Aircraft Type | Location |
|---|---|---|
| A | ||
| 2013 | A109 | Vicinity London Heliport London UK |
| 2008 | A310 | Khartoum Sudan |
| 2008 | A310 | Vicinity Quebec Canada |
| 2009 | A318/B738 | En-route, Trasadingen Switzerland |
| 2007 | A318/B739 | Vicinity Amsterdam Netherlands |
| 2011 | A319/A321 | En-route, west north west of GeneVaSwitzerland |
| 2011 | A319/PRM1 | En-route, near Fribourg Switzerland |
| 2016 | A319 | Santiago de Compostela Spain |
| 2010 | A319/A319 | En-route, South west of Basle-Mulhouse France |
| 2011 | A320/A320 | Zurich Switzerland |
| 2012 | A320/A346 | En-route Eastern Indian Ocean |
| 2017 | A320/AT76 | Yangon Myanmar |
| 2012 | A320/B738 | Barcelona Spain |
| 2016 | A320/B738 | Vicinity Delhi India |
| 2013 | A320/B739 | Yogyakarta Indonesia |
| 2011 | A320/C56X | Vicinity GeneVa Switzerland |
| 2014 | A320/CRJ2 | Port Elizabeth South Africa |
| 2010 | A320 | Oslo Norway |
| 2000 | A320 | Toronto Canada |
| 2013 | A320 | En route, north of Marseilles France |
| 2009 | A320 | En-route, Denver CO USA |
| 2014 | A320 | Vicinity Naha Okinawa Japan |
| 2013 | A320/B738 | Vicinity Delhi India |
| 2013 | A320/E190/B712 | Vicinity Helsinki Finland |
| 2015 | A321/B734 | Barcelona Spain |
| 2011 | A321/B738 | Dublin Ireland |
| 2012 | A332/A333 | En-route, north West Australia |
| 2004 | A332/RJ1H | Vicinity Zurich Switzerland |
| 2014 | A343/B763 | Barcelona Spain |
| 2012 | A343/GLID | En-route, north of Waldshut-TiEngEn southwest Germany |
| 2012 | A343 | Vicinity Paris CDG France |
| 2009 | AS50/PA32 | En-route Hudson River NJ USA |
| 1999 | AT43 | Vicinity Pristina KosoVo |
| 2004 | AT45/B733 | Munich Germany |
| 1999 | AT72/B732 | Vicinity Queenstown New Zealand |
| 2009 | AT72 | Mumbai India |
| 2017 | AT75/B739 | Medan Indonesia |
| 2014 | AT76 | Surabaya Indonesia |
| B | ||
| 2014 | B190/B737 | Calgary Canada |
| 2008 | B190 | Vicinity Bebi south eastern Nigeria |
| 1990 | B722/BE10 | Atlanta GA USA |
| 2004 | B732/A321 | Manchester UK |
| 1988 | B732 | En-route, Maui Hawaii |
| 1982 | B732 | Vicinity Washington National DC USA |
| 1991 | B733/SW4 | Los Angeles CA USA |
| 2010 | B733/Vehicle | Amsterdam Netherlands |
| 2008 | B733 | Vicinity Helsinki Finland |
| 1996 | B734/MD81 | En-route, Romford UK |
| 2010 | B734 | Amsterdam Netherlands |
| 2008 | B734 | Palembang Indonesia |
| 2015 | B734 | Sharjah UAE |
| 2010 | B734 | Vicinity Lyon France |
| 1999 | B735 | Vicinity Billund Denmark |
| 2013 | B735 | Vicinity Kazan Russia |
| 2001 | B735/B733 | Dallas-Fort Worth TX USA |
| 2006 | B737/B737 | Vicinity Geneva Switzerland |
| 2005 | B737 | Chicago Midway USA |
| 2011 | B737/C212 | En-route/maneuvering, near Richmond NSW Australia |
| 2018 | B738/A320 | Edinburgh UK |
| 2016 | B738/AT46 | Jakarta Halim Indonesia |
| 2004 | B738/B744 | Los Angeles USA |
| 2007 | B738/CRJ1 | New York La Guardia USA |
| 2006 | B738/E135 | En-route, Mato Grosso Brazil |
| 2013 | B738 | Alicante Spain |
| 2009 | B738 | Kingston Jamaica |
| 2017 | B738 | Sint Maarten Eastern Caribbean |
| 2010 | B738 | En-route, east of Asahikawa Japan |
| 2010 | B738/B734 | Johannesburg South Africa |
| 2010 | B738/B738 | Girona Spain |
| 2012 | B738/B738 | Vicinity Oslo Norway |
| 2010 | B738/B738 | Vicinity Queenstown New Zealand |
| 2011 | B738/B763 | Barcelona Spain |
| 2000 | B744/A321 | Vicinity London Heathrow UK |
| 2010 | B744/Vehicle | Luxembourg Airport Luxembourg |
| 2009 | B744 | Mumbai India |
| 2007 | B744 | Sydney Australia |
| 1996 | B752 | En-route, Vicinity Chancay Peru |
| 2001 | B762/A310 | Toronto Canada |
| 2002 | B762 | Vicinity Busan Korea |
| 1998 | B763/B744 | Amsterdam Netherlands |
| 2007 | B763/B772 | New Chitose Japan |
| 2014 | B763 | Addis Ababa Ethiopia |
| 2010 | B763/B738 | Vicinity Melbourne Australia |
| 2009 | B772 | St Kitts West Indies |
| 2015 | B773/B738/B738 | Melbourne Australia |
| 2007 | B773 | Auckland Airport New Zealand |
| 2016 | B773 | Dhaka Bangladesh |
| C | ||
| 1997 | C185 | Wellington New Zealand |
| 2012 | C30J | En-route, northern Sweden |
| 2009 | C525/B773 | Vicinity London City UK |
| 2004 | C550 | Vicinity Cagliari Sardinia Italy |
| 2006 | CRJ1 | Lexington KY USA |
| 2014 | CRJ2/A320 | Vicinity Port Elizabeth South Africa |
| 2008 | CRJ7/C172 | Allentown PA USA |
| 2009 | CRJ9/Vehicles | Whitehorse YK Canada |
| 2017 | CRJ9 | Turku Finland |
| D | ||
| 2012 | D328/R44 | Bern Switzerland |
| 1990 | DC91/B722 | Detroit MI USA |
| 1983 | DC93/B722 | Madrid Spain |
| 1994 | DC93 | Vicinity Charlotte NC USA |
| 2002 | DC95/C206 | Toronto Canada |
| 2017 | DH8B | Kangerlussuaq Greenland |
| 2013 | DH8C/P180 | Ottawa ON Canada |
| E | ||
| 2009 | E145/DH8B | Cleveland USA |
| 2011 | E145/E135 | Chicago O’Hare USA |
| 2016 | E190/D328 | Basel Mulhouse France |
| 2011 | E190/Vehicle | Denver COUSA |
| 2010 | E190 | Oslo Norway |
| 2016 | E195/A320 | Brussels Belgium |
| F | ||
| 2012 | F100/EC45 | Vicinity Bern Switzerland |
| 2000 | F15/B752 | En-route, South East of Birmingham UK |
| 2005 | F15/E145 | En-route, Bedford UK |
| 2016 | F50/P28T | Vicinity Friedrichshafen Germany |
| 2014 | FA50/Vehicle | Moscow Vnukovo Russia |
| M | ||
| 1994 | MD82/C441 | Lambert-St Louis MI USA |
| 2004 | MD83 | Vicinity Nantes France |
| 2001 | MD87/C525 | Milan Linate |
| P | ||
| 2012 | PRM1/CRJ2 | Nice France |
| R | ||
| 2009 | RJ1H/UNKN | Vicinity Malmo Sweden |
| 2011 | RJ85/Vehicle | Gothenburg Sweden |
| S | ||
| 2011 | SF34/AT72 | Helsinki Finland |
| 2000 | SH33/MD83 | Paris CDG France |
| 2012 | SU95 | maneuvering near Jakarta Indonesia |
| T | ||
| 2002 | T154/B752 | En-route, Uberlingen Germany |
| 2011 | TBM8 | Birmingham UK |
| V | ||
| 2006 | Vehicle/B738 | Brisbane Australia |
| 2013 | Vehicle/B773 | Singapore |
| 2008 | Vehicles/B737 | Toronto Canada |
| W | ||
| 1993 | WW24 | Vicinity John Wayne Airport Santa Ana CA USA |
References
- Aurino, D.E.M. Human factors and aviation safety: What the industry has, what the industry needs. Ergonomics 2000, 43, 952–959. [Google Scholar] [CrossRef] [PubMed]
- Bentley, R.; Hughes, J.A.; Randall, D.; Shapiro, D.Z. Technological support for decision making in a safety critical environment. Saf. Sci. 1995, 19, 149–156. [Google Scholar] [CrossRef]
- Kirchner, J.H.; Laurig, W. The human operator in air traffic control systems. Ergonomics 1971, 14, 549–556. [Google Scholar] [CrossRef]
- Chang, Y.-H.; Yeh, C.-H. Human performance interfaces in air traffic control. Appl. Ergon. 2010, 41, 123–129. [Google Scholar] [CrossRef] [PubMed]
- Isaac, A.R.; Ruitenberg, B. Air Traffic Control: Human Performance Factors; Routledge: Abingdon-on-Thames, UK, 2017. [Google Scholar]
- Zhou, T.; Zhang, J.; Baasansuren, D. A Hybrid HFACS-BN Model for Analysis of Mongolian Aviation Professionals’ Awareness of Human Factors Related to Aviation Safety. Sustainability 2018, 10, 4522. [Google Scholar] [CrossRef]
- Wiegmann, D.A.; Shappell, S.A. A Human Error Approach to Aviation Accident Analysis: The Human Factors Analysis and Classification System; Routledge: Abingdon-on-Thames, UK, 2017. [Google Scholar]
- Shorrock, S.T.; Kirwan, B. Development and application of a human error identification tool for air traffic control. Appl. Ergon. 2002, 33, 319–336. [Google Scholar] [CrossRef]
- Chen, W.; Huang, S. Evaluating Flight Crew Performance by a Bayesian Network Model. Entropy 2018, 20, 178. [Google Scholar] [CrossRef]
- Wiegmann, D.A.; Shappell, S.A. Human error analysis of commercial aviation accidents: application of the Human Factors Analysis and Classification system (HFACS). Aviat. Space Environ. Med. 2001, 72, 1006–1016. [Google Scholar]
- Shappell, S.A.; Wiegmann, D.A. Reshaping the way we look at general aviation accidents using the human factors analysis and classification system. In Proceedings of the International Symposiumon Aviation Psychology, Dayton, OH, USA, 14–17 April 2003; pp. 1047–1052. [Google Scholar]
- Reinach, S.; Viale, A. Application of a human error framework to conduct train accident/incident investigations. Accid. Anal. Prev. 2006, 38, 396–406. [Google Scholar] [CrossRef]
- Baysari, M.T.; Caponecchia, C.; McIntosh, A.S.; Wilson, J.R. Classification of errors contributing to rail incidents and accidents: A comparison of two human error identification techniques. Saf. Sci. 2009, 47, 948–957. [Google Scholar] [CrossRef]
- Vairo, T.; Quagliati, M.; Del Giudice, T.; Barbucci, A.; Fabiano, B. From land-to water-use-planning: A consequence based case-study related to cruise ship risk. Saf. Sci. 2017, 97, 120–133. [Google Scholar] [CrossRef]
- Celik, M.; Cebi, S. Analytical HFACS for investigating human errors in shipping accidents. Accid. Anal. Prev. 2009, 41, 66–75. [Google Scholar] [CrossRef] [PubMed]
- Daramola, A.Y. An investigation of air accidents in Nigeria using the Human Factors Analysis and Classification System (HFACS) framework. J. Air Transp. Manag. 2014, 35, 39–50. [Google Scholar] [CrossRef]
- Trucco, P.; Cagno, E.; Ruggeri, F.; Grande, O. A Bayesian Belief Network modelling of organisational factors in risk analysis: A case study in maritime transportation. Reliab. Eng. Syst. Saf. 2008, 93, 845–856. [Google Scholar] [CrossRef]
- Díez, F.J.J.U.i.A.I. Parameter adjustment in Bayes networks. The generalized noisy OR–gate. In Uncertainty in Artificial Intelligence; Morgan Kaufmann: Burlington, MA, USA, 1993; pp. 99–105. [Google Scholar] [CrossRef]
- Heijden, M.V.D.; Hommersom, A. Causal Independence Models for Continuous Time Bayesian Networks. In Proceedings of the European Workshop on Probabilistic Graphical Models, Utrecht, The Netherlands, 17–19 September 2014. [Google Scholar]
- Shappell, S.A.; Wiegmann, D.A. The human factors analysis and classification system--HFACS; U.S. Department of Transportation, Office of Aviation Medicine: Washington, DC, USA, 2000.
- Patterson, J.M.; Shappell, S.A. Operator error and system deficiencies: analysis of 508 mining incidents and accidents from Queensland, Australia using HFACS. Accid. Anal. Prev. 2010, 42, 1379–1385. [Google Scholar] [CrossRef]
- Chauvin, C.; Lardjane, S.; Morel, G.; Clostermann, J.-P.; Langard, B. Human and organisational factors in maritime accidents: Analysis of collisions at sea using the HFACS. Accid. Anal. Prev. 2013, 59, 26–37. [Google Scholar] [CrossRef]
- Pearl, J. Bayesian netwcrks: A model cf self-activated memory for evidential reasoning. In Proceedings of the 7th Conference of the Cognitive Science Society, University of California, Irvine, CA, USA, 15–17 August 1985; pp. 329–334. [Google Scholar]
- Groth, K.M.; Mosleh, A. Deriving causal Bayesian networks from human reliability analysis data: A methodology and example model. Proc. Inst. Mech. Eng. Part O J. Risk Reliab. 2012, 226, 361–379. [Google Scholar] [CrossRef]
- Ghasemi, F.; Sari, M.H.M.; Yousefi, V.; Falsafi, R.; Tamosaitiene, J. Project Portfolio Risk Identification and Analysis, Considering Project Risk Interactions and Using Bayesian Networks. Sustainability 2018, 10, 1609. [Google Scholar] [CrossRef]
- Xia, N.N.; Zou, P.X.W.; Liu, X.; Wang, X.Q.; Zhu, R.H. A hybrid BN-HFACS model for predicting safety performance in construction projects. Saf. Sci. 2018, 101, 332–343. [Google Scholar] [CrossRef]
- Francis, R.A.; Guikema, S.D.; Henneman, L. Bayesian belief networks for predicting drinking water distribution system pipe breaks. Reliab. Eng. Syst. Saf. 2014, 130, 1–11. [Google Scholar] [CrossRef]
- Jitwasinkul, B.; Hadikusumo, B.H.W.; Memon, A.Q. A Bayesian Belief Network model of organizational factors for improving safe work behaviors in Thai construction industry. Saf. Sci. 2016, 82, 264–273. [Google Scholar] [CrossRef]
- Heckerman, D. A tutorial on learning with Bayesian networks. In Innovations in Bayesian networks; Springer: Berlin/Heidelberg, Germany, 2008; pp. 33–82. [Google Scholar]
- Dıez, F.J.; Galán, S.F. An efficient factorization for the noisy MAX. Int. J. Intell. Syst. 2003, 18, 165–177. [Google Scholar]
- Good, I.J. A causal calculus (I). Br. J. Philos. Sci. 1961, 11, 305–318. [Google Scholar] [CrossRef]
- Henrion, M. Some Practical Issues in Constructing Belief Networks. UAI 1987, 3, 161–173. [Google Scholar]
- Olsen, N.S. Coding ATC incident data using HFACS: Inter-coder consensus. Saf. Sci. 2011, 49, 1365–1370. [Google Scholar] [CrossRef]
- Teperi, A.M.; Leppanen, A.; Norros, L. Application of new human factors tool in an air traffic management organization. Saf. Sci. 2015, 73, 23–33. [Google Scholar] [CrossRef]
- Chang, Y.-H.; Wang, Y.-C. Significant human risk factors in aircraft maintenance technicians. Saf. Sci. 2010, 48, 54–62. [Google Scholar] [CrossRef]
- Pape, A.M.; Wiegmann, D.A.; Shappell, S.A. Air traffic control (ATC) related accidents and incidents: A human factors analysis. In Proceedings of the 11th International Symposium on Aviation Psychology, The Ohio State University, Columbus, OH, USA, 5–8 March 2001. [Google Scholar]
- Krastev, A. SKYbrary: a single entry point to aviation safety knowledge. Controller 2009, 48, 18–19. [Google Scholar]
- ICAO. Human Factors Training Manual, 1st ed.; International Civil Aviation Organization: Montreal, QC, Canada, 1998. [Google Scholar]
- Brooker, P. Experts, Bayesian Belief Networks, rare events and aviation risk estimates. Saf. Sci. 2011, 49, 1142–1155. [Google Scholar] [CrossRef]
- Wang, H.; Rish, I.; Ma, S. Using Sensitivity Analysis for Selective Parameter Update in Bayesian Network Learning; Association for the Advancement of Artificial Intelligence: Menlo Park, CA, USA, 2002. [Google Scholar]
- Miranda, A.T. Understanding human error in naval aviation mishaps. Hum. Factors 2018, 60, 763–777. [Google Scholar] [CrossRef] [PubMed]


| Factors | HFACS Level | Description | Source |
|---|---|---|---|
| Safety Culture | Organizational Influence | It includes the safety policy of the ATC department, safety education, as well as preventive measures | CAA (2003) [35] |
| Team Human Resource Allocation | The duty of the team members is not clear, the collocation is not reasonable, the work is not coordinated and so on | N.S. Olsen [33] | |
| Salary and Reward | It refers to salary and workload that do not match, employees that are not satisfied with the salary and reward | CAA (2002a) [35] | |
| ATC Communication | Communication between controllers, including briefing on handover | Shappell [36] | |
| ATC/Flight Crew Cooperation | It refers to the communication and coordination between ATCOs and crew members | SKYbrary [37] | |
| ATC Software/Hardware | It includes ATC equipment layout, hardware failure, software interaction and so on | SKYbrary [37] | |
| Lack of Supervision Plan | Unsafe Supervision | ATC supervision is not in place, not comprehensive, not meticulous, etc. | N.S. Olsen [33] |
| Poor Management Discipline | It means the management style discipline/supervision effect are poor | Experts’ opinions | |
| Failed to Enforce Regulations | It leads to an inadequate understanding of the rules by air traffic controllers and may raise safety risks | Zhou [6] | |
| Failed to Correct Inappropriate Acts | It occurs when ATCO does not correct unsafe acts during control | N.S. Olsen [33] | |
| Ineffective Monitoring | It includes monitoring flight path, aircraft systems, operational factors, crew/situational awareness. | ICAO [38] | |
| Visibility | Preconditions for Unsafe Acts | Poor visibility due to weather or environmental conditions, unable to effectively monitor aircraft status | SKYbrary [37] |
| Air–Ground Communication Interference | Ground–to–air communication frequency is seriously disturbed by the external environment | Experts’ opinions | |
| Mental State | Mental, emotional or physical tension, strain or distress | N.S. Olsen [33] | |
| Noise | It includes ambient noise from air traffic controllers, noise from crew members, or other noises in the radio | Experts’ opinions | |
| Training | Lack of training materials or inadequate training | Teperi [34] | |
| Physical Fatigue | Factors related to a lack of sleep or long work days | IATA (2006) | |
| Nonstandard Flight Progress Strip | Unsafe Acts | Aircraft call number, departure location, aircraft model and other information are not standard | SKYbrary [37] |
| Distraction | Distraction refers to the lack of concentration of air traffic controllers, which affects the normal work of ATC | Chang [35] | |
| Use Non-standard Terms | It refers to the use of informal terms in air traffic control activities | SKYbrary [37] | |
| ATC clearance error | There are two types: intended clearance given to wrong aircraft or wrong clearance given to intended aircraft | SKYbrary [37] | |
| Emergency Mishandling | ATCO do not have a good command of special situation handling procedures, poor psychological endurance | ICAO [38] | |
| Operation/Decision Error | Mis operation or decision-making by the ATCO in the control process | N.S. Olsen [33] | |
| ATCO Misspeaking | It refers to careless, absent-minded, insincere control work, resulting in instruction errors | ICAO [38] | |
| Procedural Noncompliance | Not following procedures: FARs, OEM standards, SOPs; It always results in a greater risk for the operation | SKYbrary [37] |
| Node | ATC Clearance Error | Distraction | ||
|---|---|---|---|---|
| State | Yes | No | Yes | No |
| Number | 48 | 94 | 29 | 113 |
| Probability | 0.3380 | 0.6620 | 0.2042 | 0.7958 |
| ATC Organizational Climate | ATC/Crew Cooperation | Communication | Safety Culture | ||||||
|---|---|---|---|---|---|---|---|---|---|
| Good | Normal | Poor | Good | Normal | Poor | Good | Normal | Poor | |
| Good | 0.4776 | 0.2619 | 0 | 0.4468 | 0.3095 | 0 | 0.4762 | 0.3182 | 0 |
| Normal | 0.3406 | 0.4048 | 0 | 0.3404 | 0.4286 | 0 | 0.3333 | 0.4318 | 0 |
| Poor | 0.1818 | 0.3333 | 1 | 0.2128 | 0.2619 | 1 | 0.1905 | 0.25 | 1 |
| Item | Frequency | Percent (%) |
|---|---|---|
| Gender | ||
| Male | 21 | 80.8 |
| Female | 5 | 19.2 |
| Education | ||
| Bachelor degree | 15 | 57.7 |
| Master | 7 | 26.9 |
| Ph.D. | 4 | 15.4 |
| Position | ||
| Tower control | 6 | 23.1 |
| Approach control | 8 | 30.8 |
| Area control | 8 | 30.8 |
| ATC expert (Dr., Prof.) | 4 | 15.3 |
| Work experience | ||
| <3 | 3 | 11.5 |
| 3−5 | 8 | 30.8 |
| >5 | 15 | 57.7 |
| Control mode | ||
| Procedural Control | 14 | 53.8 |
| Radar Control | 8 | 30.8 |
| No. | Node | State | P (ATC = Good) | State | P (ATC = Good) | State | P (ATC = Good) | Increased Percent |
|---|---|---|---|---|---|---|---|---|
| 1 | Training | poor | 0.633 | normal | 0.656 | good | 0.662 | 4.58% |
| 2 | Physical Fatigue | poor | 0.645 | normal | 0.657 | good | 0.661 | 2.48% |
| 3 | Mental State | poor | 0.647 | normal | 0.658 | good | 0.662 | 2.32% |
| 4 | Ineffective Monitoring | yes | 0.654 | - | / | no | 0.669 | 2.29% |
| 5 | ATC Software/Hardware | poor | 0.650 | normal | 0.657 | good | 0.660 | 1.54% |
| 6 | Failed to Enforce Regulations | yes | 0.652 | - | / | no | 0.661 | 1.38% |
| 7 | Failed to Correct Inappropriate Acts | yes | 0.652 | - | / | no | 0.661 | 1.38% |
| 8 | ATC/Flight Crew Cooperation | poor | 0.652 | normal | 0.658 | good | 0.661 | 1.38% |
| 9 | ATC Communication | poor | 0.652 | normal | 0.659 | good | 0.661 | 1.38% |
| 10 | Noise | high | 0.652 | normal | 0.658 | low | 0.661 | 1.38% |
| 11 | Safety Culture | poor | 0.652 | normal | 0.659 | good | 0.660 | 1.23% |
| 12 | Air-Ground Communication Interference | serious | 0.653 | normal | 0.658 | slight | 0.661 | 1.23% |
| 13 | Visibility | poor | 0.653 | normal | 0.658 | good | 0.661 | 1.23% |
| 14 | Lack of Supervision Plan | yes | 0.653 | - | / | no | 0.660 | 1.07% |
| 15 | Team Human Resource Allocation | poor | 0.654 | normal | 0.659 | good | 0.661 | 1.07% |
| 16 | ATC clearance error | yes | 0.655 | - | / | no | 0.662 | 1.07% |
| 17 | Procedural Noncompliance | yes | 0.657 | - | / | no | 0.664 | 1.07% |
| 18 | Operation/Decision Error | yes | 0.654 | - | / | no | 0.660 | 0.92% |
| 19 | Poor Management Discipline | yes | 0.654 | - | / | no | 0.660 | 0.92% |
| 20 | Salary and Reward | low | 0.655 | middle | 0.659 | high | 0.661 | 0.92% |
| 21 | ATCO Misspeaking | yes | 0.655 | - | / | no | 0.660 | 0.76% |
| 22 | Emergency Mishandling | yes | 0.655 | - | / | no | 0.660 | 0.76% |
| 23 | Nonstandard Flight Progress Strip | yes | 0.656 | - | / | no | 0.660 | 0.61% |
| 24 | Distraction | yes | 0.656 | - | / | no | 0.660 | 0.61% |
| 25 | Use Nonstandard Terms | yes | 0.657 | - | / | no | 0.660 | 0.46% |
© 2019 by the authors. Licensee MDPI, Basel, Switzerland. This article is an open access article distributed under the terms and conditions of the Creative Commons Attribution (CC BY) license (http://creativecommons.org/licenses/by/4.0/).
Share and Cite
Lyu, T.; Song, W.; Du, K. Human Factors Analysis of Air Traffic Safety Based on HFACS-BN Model. Appl. Sci. 2019, 9, 5049. https://doi.org/10.3390/app9235049
Lyu T, Song W, Du K. Human Factors Analysis of Air Traffic Safety Based on HFACS-BN Model. Applied Sciences. 2019; 9(23):5049. https://doi.org/10.3390/app9235049
Chicago/Turabian StyleLyu, Tao, Wenbin Song, and Ke Du. 2019. "Human Factors Analysis of Air Traffic Safety Based on HFACS-BN Model" Applied Sciences 9, no. 23: 5049. https://doi.org/10.3390/app9235049
APA StyleLyu, T., Song, W., & Du, K. (2019). Human Factors Analysis of Air Traffic Safety Based on HFACS-BN Model. Applied Sciences, 9(23), 5049. https://doi.org/10.3390/app9235049