Article

Human Factors Analysis of Air Traffic Safety Based on HFACS-BN Model

1
School of Aeronautics and Astronautics, Shanghai Jiao Tong University, Shanghai 200240, China
2
School of Communication, East China Normal University, Shanghai 200240, China
*
Authors to whom correspondence should be addressed.
Appl. Sci. 2019, 9(23), 5049; https://doi.org/10.3390/app9235049
Submission received: 25 September 2019 / Revised: 13 November 2019 / Accepted: 20 November 2019 / Published: 22 November 2019

Abstract

:
Air traffic control (ATC) performance is important to ensure flight safety and the sustainability of aviation growth. To better evaluate the performance of ATC, this paper introduces the HFACS-BN model (HFACS: Human factors analysis and classification system; BN: Bayesian network), which can be combined with the subjective information of relevant experts and the objective data of accident reports to obtain more accurate evaluation results. The human factors of ATC in this paper are derived from screening and analysis of 142 civil and general aviation accidents/incidents related to ATC human factors worldwide from 1980 to 2019, among which the most important 25 HFs are selected to construct the evaluation model. The authors designed and implemented a questionnaire survey based on the HFACS framework and collected valid data from 26 frontline air traffic controllers (ATCO) and experts related to ATC in 2019. Combining the responses with objective data, the noisy MAX model is used to calculate the conditional probability table. The results showed that, among the four levels of human factors, unsafe acts had the greatest influence on ATC Performance (79.4%), while preconditions for safe acts contributed the least (40.3%). The sensitivity analysis indicates the order of major human factors influencing the performance of ATC. Finally, this study contributes to the literature in terms of methodological development and expert empirical analysis, providing data support for human error management intervention of ATC in aviation safety.

1. Introduction

Safety is an important prerequisite for the sustainable and healthy development of the aviation industry [1]. As a critical area of aviation safety, air traffic control (ATC) requires highly skilled operators to work together in a large and complex human–machine system [2]. In an ATC system, air traffic controllers play a central role, and they have to cooperate with the various components of the ATC system to ensure the safety, order, and efficiency of air traffic flow [3]. Like other complex sociotechnical systems, there are always some risks of interference in the system [4]. Uncooperative interactions between controllers and system components hold potential for human errors, leading to safety breakdowns [5]. In fact, during the second half of the 20th century, the technical environment changed and the focus of attention in aviation industrial sectors shifted from technological problems to human factors problems and, finally, to problems with organizations and safety culture [6]. Human error is one of the contributors to more than 70% of aviation accidents [7]. This is demonstrated by a review of the Australian ATC system, which finds that coordination and communication errors contribute most to air traffic incidents [5]. In the UK Airprox incident report, human errors in ATC are related to perception, decision making, communication, and team resource management [8]. ATC-related incident examples include on 1 July 2002, a Tu-154m passenger aircraft (BTC2937) of Russian Bashkir Air collided with a former DHL Express Boeing 757-200sf cargo plane (DHX611) over the Swiss city of Überlingen, killing all 71 passengers and crew of both aircraft. The main cause of the accident was a Swiss air traffic control center command serious error; on 11 October 2016, a China Eastern Airlines A320 evaded a runway incursion by narrowly passing over the top of an A330 that had crossed into the active runway due to improper situational awareness by both the pilots and tower controllers. As the number of flights increases, air traffic controllers have to learn from these disasters, and an analysis of human factors may be one of the effective ways to learn from such “mistakes” to reduce the number of similar disasters [8]. The International Civil Aviation Organization (ICAO) has been working to improve aviation safety and to apply the latest research on human factors to the global aviation industry. Investigators tend to analyze safety issues from a systematic perspective, including human and organizational factors as well as other factors [9]. In this context, the human factor analysis and classification system (HFACS) emerged. HFACS was originally designed and developed based on the “Swiss-Cheese” model of Reason and the human error framework, which was used to investigate and analyze human error accidents in American military aviation operations [10], and the framework’s developers have demonstrated its applicability to commercial and general aviation accident analysis [11]. Moreover, human factors are important for understanding human performance in a variety of transportation sectors, and HFACS was further adapted to investigate ship and railway accidents arising from human errors [12,13,14]. Celik and Cebi used HFACS to investigate the human factors in the ship accident [15]. Daramola et al. used the HFACS framework to investigate aviation accidents in Nigeria between 1985 and 2010 [16]. Chen et al. used the HFACS framework and Bayesian network to analyze the human factors of crew members behind the aviation accident and evaluate their performance [9]. Zhou et al. searched for human factors affecting aviation safety based on the framework of HFACS through the questionnaire survey of airport staff in Ulaanbaatar, Mongolia. The study focused on the professional opinions of experienced investigators or operators [6].
Through the above review, we found that the existing research can be further improved in the following aspects. First of all, the detailed information about the behavior of air traffic controllers obtained from the accident reports is relatively limited, such as the degree of ATC safety culture, the salary of controllers, whether the ATC supervision plan is complete, etc., which is more or less unavailable in the accident reports [9]. In addition, the reasons behind air accidents seem to be very complex, and the quantitative causal relationship between human factors is usually limited and highly uncertain. Faced with the problem of missing and incomplete data, this paper appliedthe Bayesian network (BN) model, which is one of the most effective theoretical models in the field of uncertain knowledge expression and reasoning. The model can integrate objective information and subjective information from multiple sources, and make an inferential analysis from incomplete, inaccurate, and fuzzy information [17]. Such a combination of HFACS and BN model will advance our full understanding of the underlying causes of ATC safety failure, and the interrelationships among the risk sources and their total effects on ATC performance. In the calculation of a conditional probability table, this paper adopts the noise maximum model, which allows the processing of multi-state nodes in the network [18,19].
The rest of this paper includes the methodology applied in the study, data collection and modeling, results analysis, discussion and conclusion, and further research work.

2. Methodology and Materials

2.1. Human Factors Analysis and Classification System (HFACS)

HFACS is valuable for systematically analyzing the causes of an accident and currently remains at identifying the core risk factors of accidents. It describes four levels of human error: Unsafe acts, preconditions for unsafe acts, unsafe supervision, and organizational influences (Figure 1) [20]. Since its initial development, HFACS has proved to be an effective tool for human error analysis in various fields, such as railway [13], mining [21], and maritime transport [22], as argued previously. This study utilizes the Bayesian network (BN) to construct a quantitative prediction network among different levels of risk factors in HFACS and between risk factors and ATC performance.

2.2. Bayesian Network Model

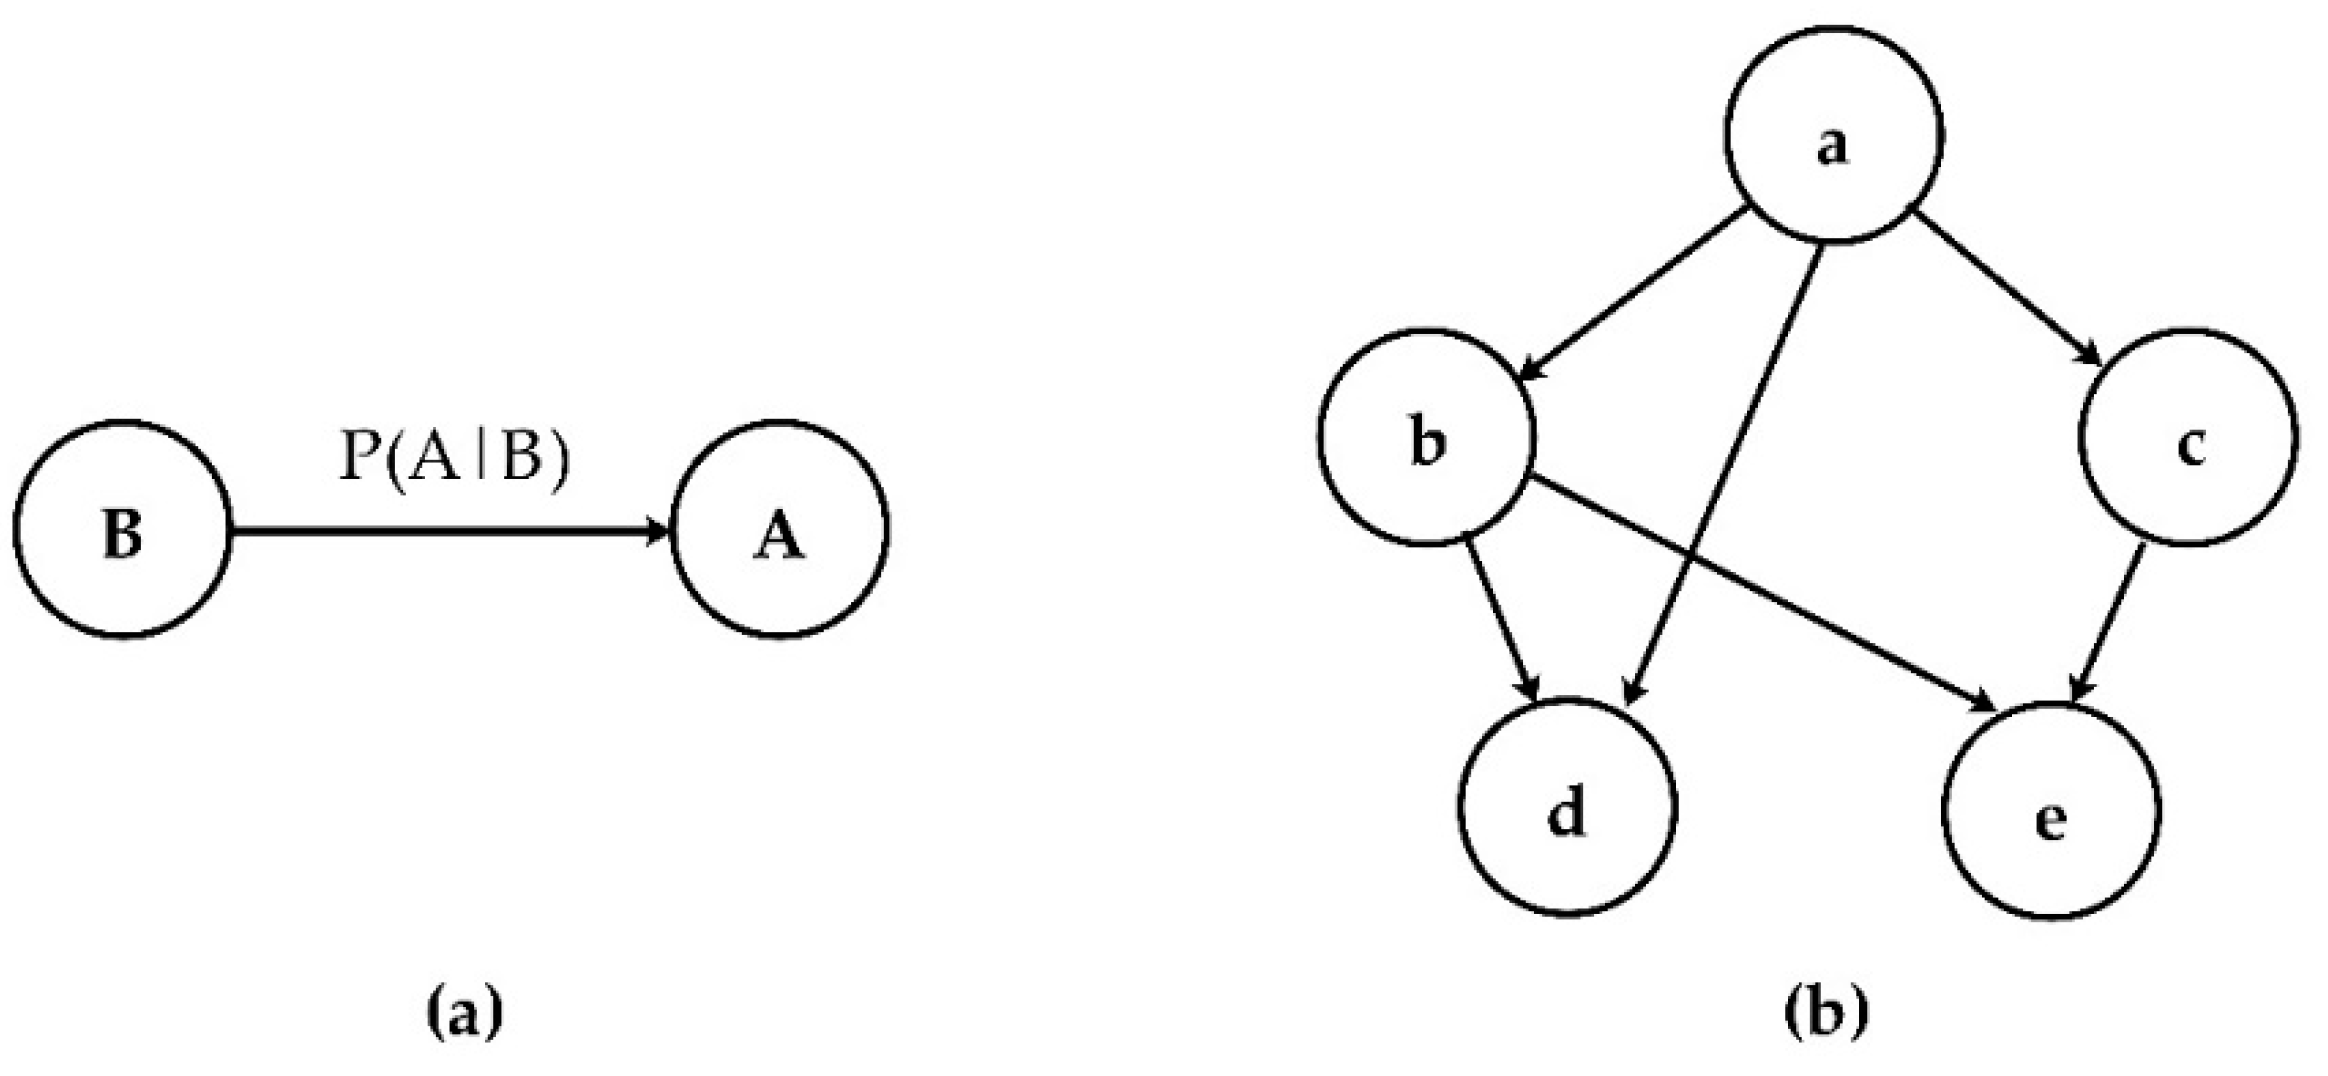
Bayesian network, also known as belief network or causal network, is a probabilistic directed acyclic graphical (DAG) model [23]. Nodes in DAG denote random variables, directed line segments represent conditional dependencies among random variables, and conditional probability tables store joint conditional probabilities between corresponding nodes [24,25,26]. It is assumed that node B directly affects node A and connects the two nodes with A directed line segment, i.e., B → A, where B stands for “Parents” and A stands for “Children”. The connection strength between the two nodes is expressed by conditional probability P (A|B), as shown in Figure 2a. A Bayesian network is formed when variables involved in a system are plotted in a DAG according to a certain causal relationship, as shown in Figure 2b, which is a simple example.
In a BN, any trajectory consists of the connection of the three structures in Figure 3.
BN is especially well suited to safety issues and risk assessment, including the aviation field [27]. Jitwasinkul et al., focusing on personal safety behavior, established the BN model to identify the most critical organizational factors that improve safety behavior [28]. Chen et al. focused on the human error of flight crew behind aviation accidents [9], while Zhou et al. focused on the safety awareness of airport staff [6]. Although these applications are in different settings, it can be concluded that BN can perform human factor and safety analysis, including prediction, diagnosis, decision making, and provide insight into the relationship between variables. This study thus aims to introduce BN as an appropriate method to predict ATC performance and to diagnose human factors in ATC failures.

2.3. Noisy MAX Model

In general, the conditional probability table can be obtained from a database or the judgment of relevant experts [29]. However, it is challenging work to directly get all the conditional probabilities for a large-scale network since the number of parameters grows exponentially with the number of parents [30]. At present, the most widely used algorithm is the Noise-OR model proposed by Good [31]. Henrion further extends the model to multivariate variables [32]. Based on Henrion’s model and formalizing it, Diez proposed a kind of evidence propagation algorithm “MAX gate” [18]. To focus on the ternary variable BN model, this paper, therefore, adopts the “noisy MAX” dealing with conditional distribution of multiple variables.
In noisy MAX, the child node Y, taken sequentially from 0 to y max 1 , has a total of y max states, and N parents, P a ( Y ) = { X 1 , , X n } , representing the causes of Y. The following are two basic axioms of noisy MAX [18]:
P ( Y = 0 | X i = 0 , i ) = 1
P ( Y y | x 1 , x 2 , , x n ) = i P ( Y y | X i = x i , X j = 0 , j i )
where the X i are independent of each other.
The parameters for link X i Y are c y x i , representing the probability of Y = y when parent X i takes on the value x i and all other X j values are 0.
c y x i = P ( Y = y | X i = x i , X j = 0 , j i )
Define a new parameter:
C y x i = P ( Y y | X i = x i , X j = 0 , j , j i ) = k = 0 y c k x i .
Then, Equation (2) can be rewritten as:
P ( Y y | x 1 , x 2 , , x n ) = i C y x i .
Finally, the CPT is obtained using the following formulas:
P ( y | X ) = { P ( Y 0 | X ) P ( Y y | X ) P ( Y y 1 | X ) i f y = 0 i f y > 0

2.4. Research Framework

In order to clearly describe how HFACS and BN effectively combine to predict the performance of ATC, Figure 4 presents the research framework of this paper.
Phase 1. First, an HFACS framework was established for the specific analysis of human factors related to ATC in civil aviation safety. To this end, based on the existing mature HFACS structure, and aviation accident report, we also interviewed the opinions of experts and engineers in relevant fields to select the most important ATC human factors that may lead to aviation accidents. Detailed data information for phase 1 will be provided later in this article.
Phase 2. Next, human factors from the HFACS framework are selected as the node variables of the BN model to establish the influence relationship between different variables involved in the HFACS framework. When the BN model is used for prediction, the prior probability of the root node in the model should be given first. According to the data in the aviation accident reports, and the “Skybrary” database, as well as the results of the questionnaire survey, the conditional probability tables (CPT) among the BN nodes can be generated. CPT calculation results of phase 2 are shown in Section 3.2.
Phase 3. Based on the HFACS-BN model established in the above steps, BN inference and sensitivity analysis were conducted to predict and analyze the most important factors affecting the performance of ATC in the model. Finally, it gives corresponding risk factors intervention measures, and verifies the model to help managers predict aviation safety performance ability.

3. Theoretical Development

3.1. Network Construction

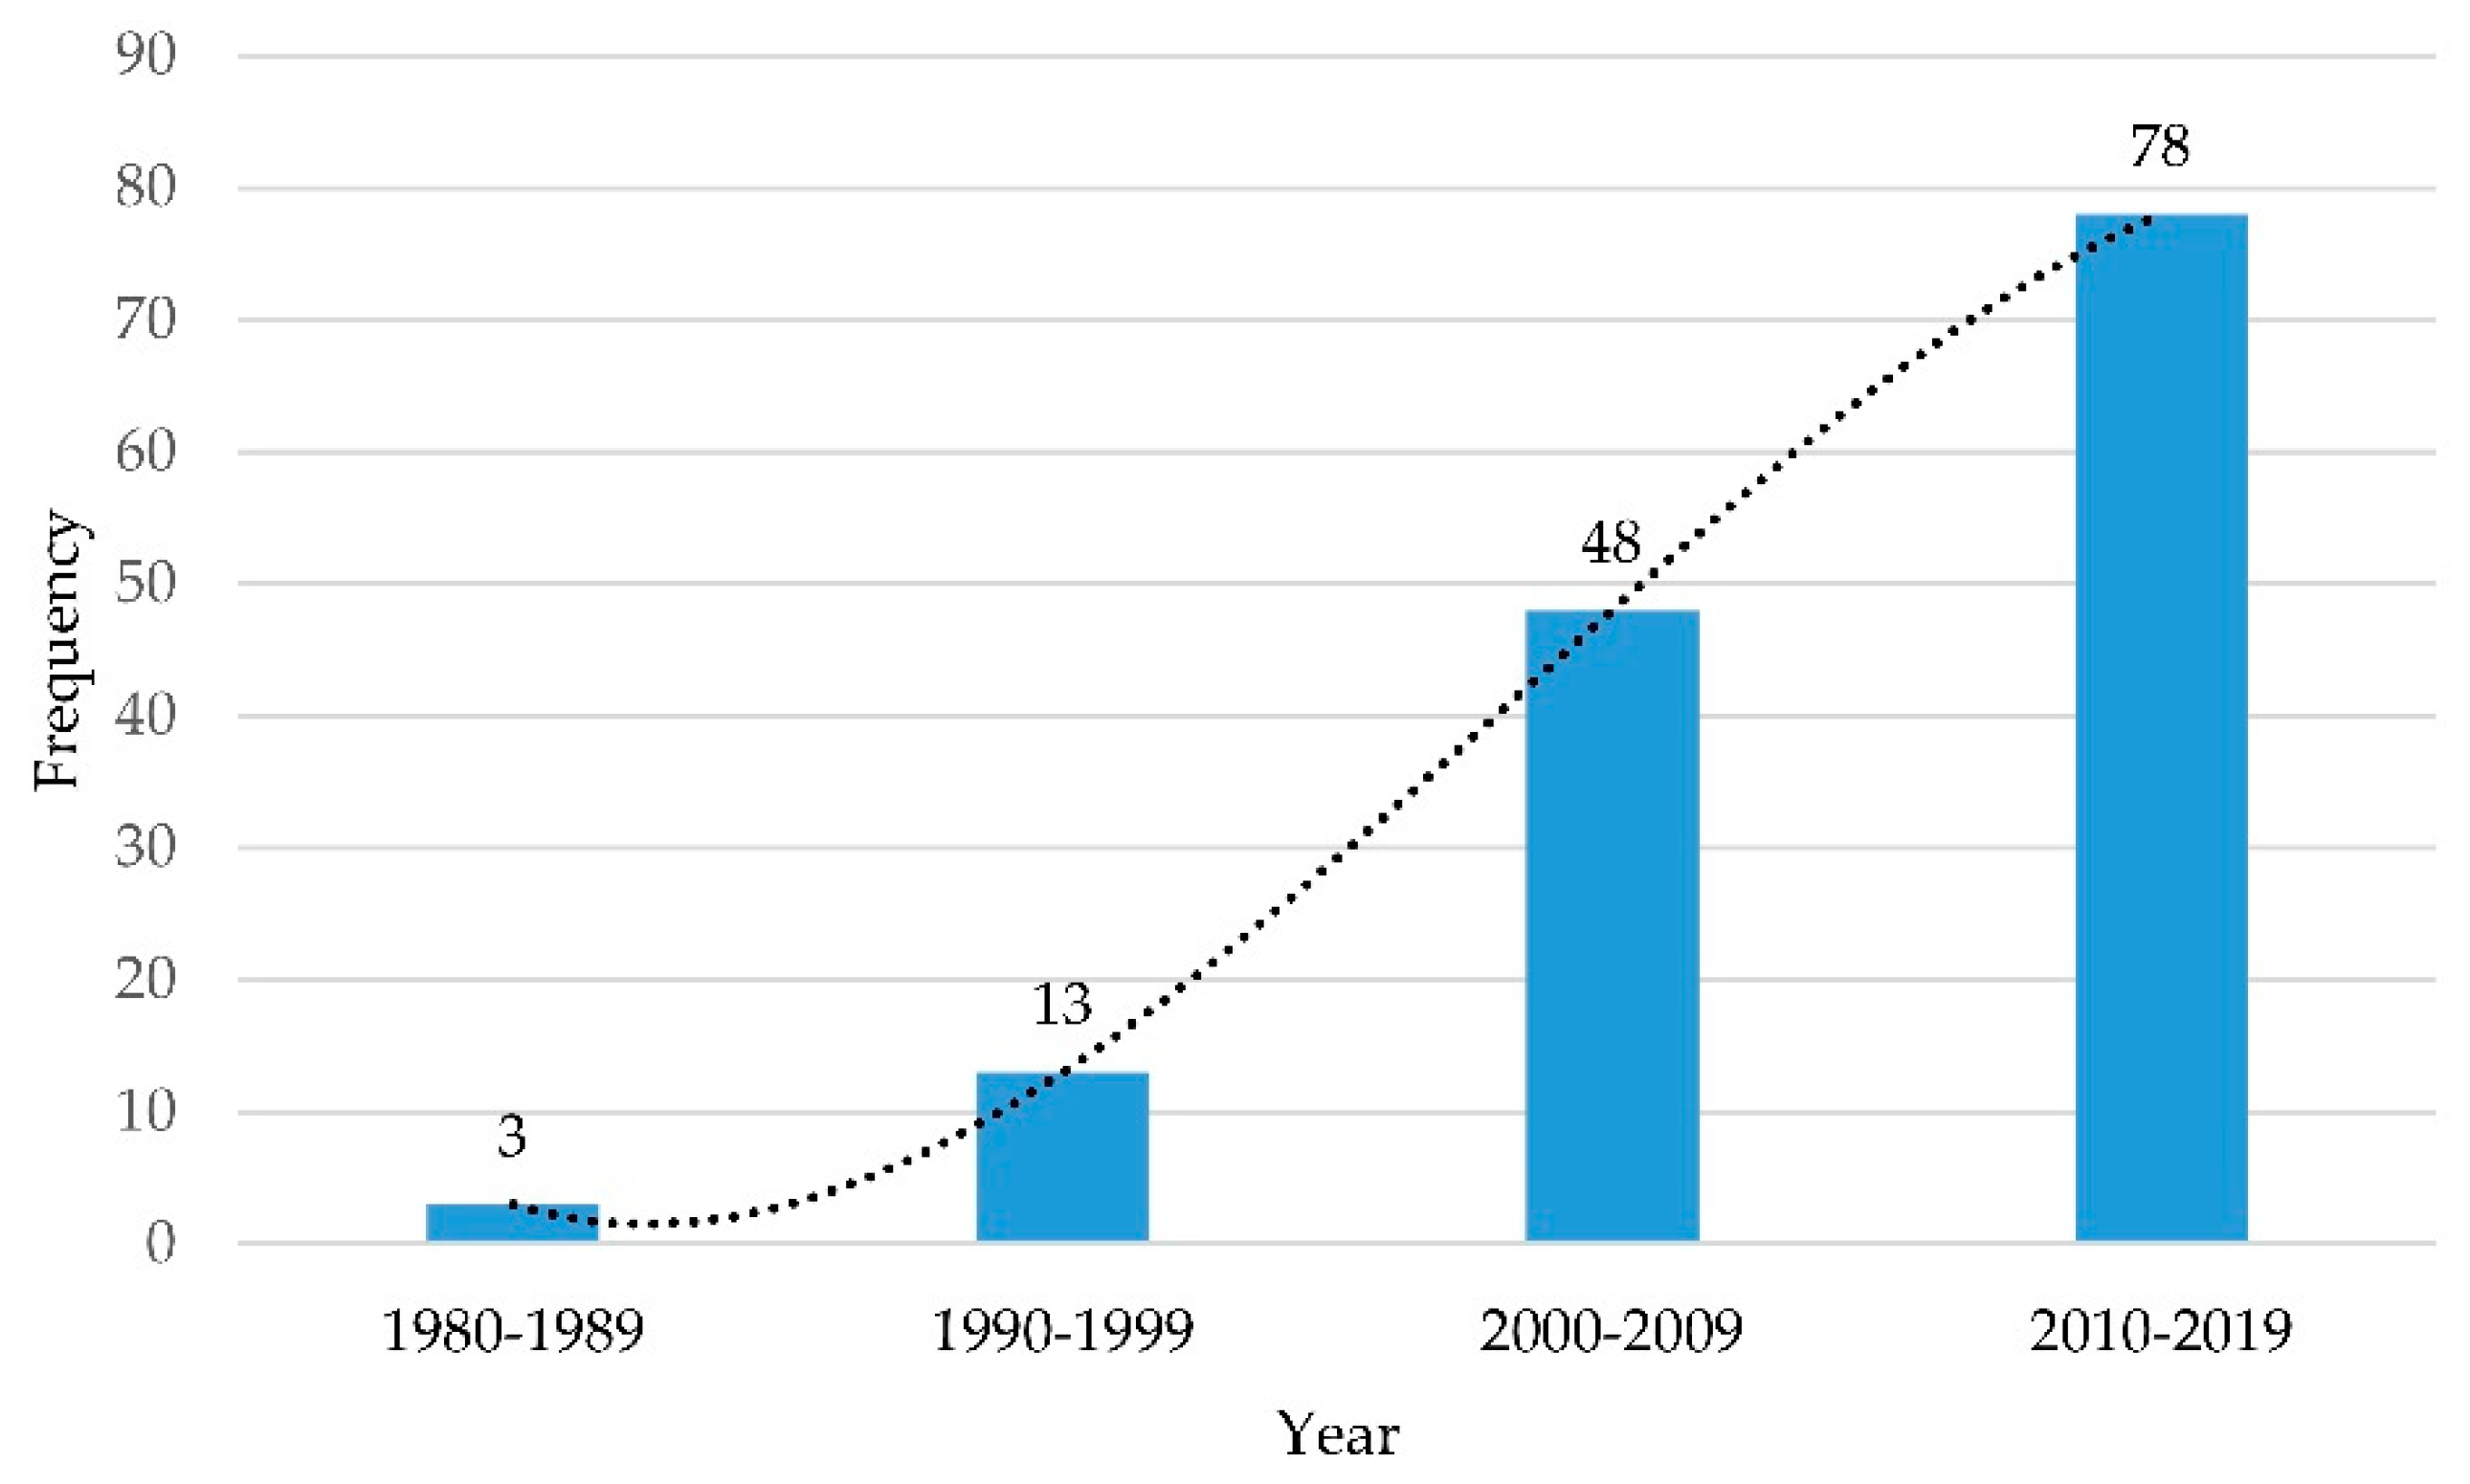
Since 1980, 142 aviation accidents/incidents worldwide related to ATC human factors have been recorded in “Skybrary,” accounting for more than 13.6% of the 1045 aviation accidents/incidents in the database in the same period. SKYbrary was initiated by EUROCONTROL in partnership with International Civil Aviation Organization (ICAO), The Flight Safety Foundation and The UK Flight Safety Committee, and work with the Federal Aviation Administration (FAA) to upload the outputs of the Commercial Aviation Safety Team (CAST) to provide reference materials for safety managers. As shown in Figure 5, the time–frequency distribution shows that the number of aviation accidents/incidents related to ATC human factors is on a sharp rise, which is understandable because the leading cause of aviation accidents has shifted from technical problems to human factors; moreover, the number of aircraft fleet and flight frequency are also increasing. The analysis and identification of ATC human factors provide practical insights for organizations on aviation safety and ATC performance management, especially in understanding which key human factors have a significant impact on the performance of controllers, to further improve ATC work and the safety of ATC operations.
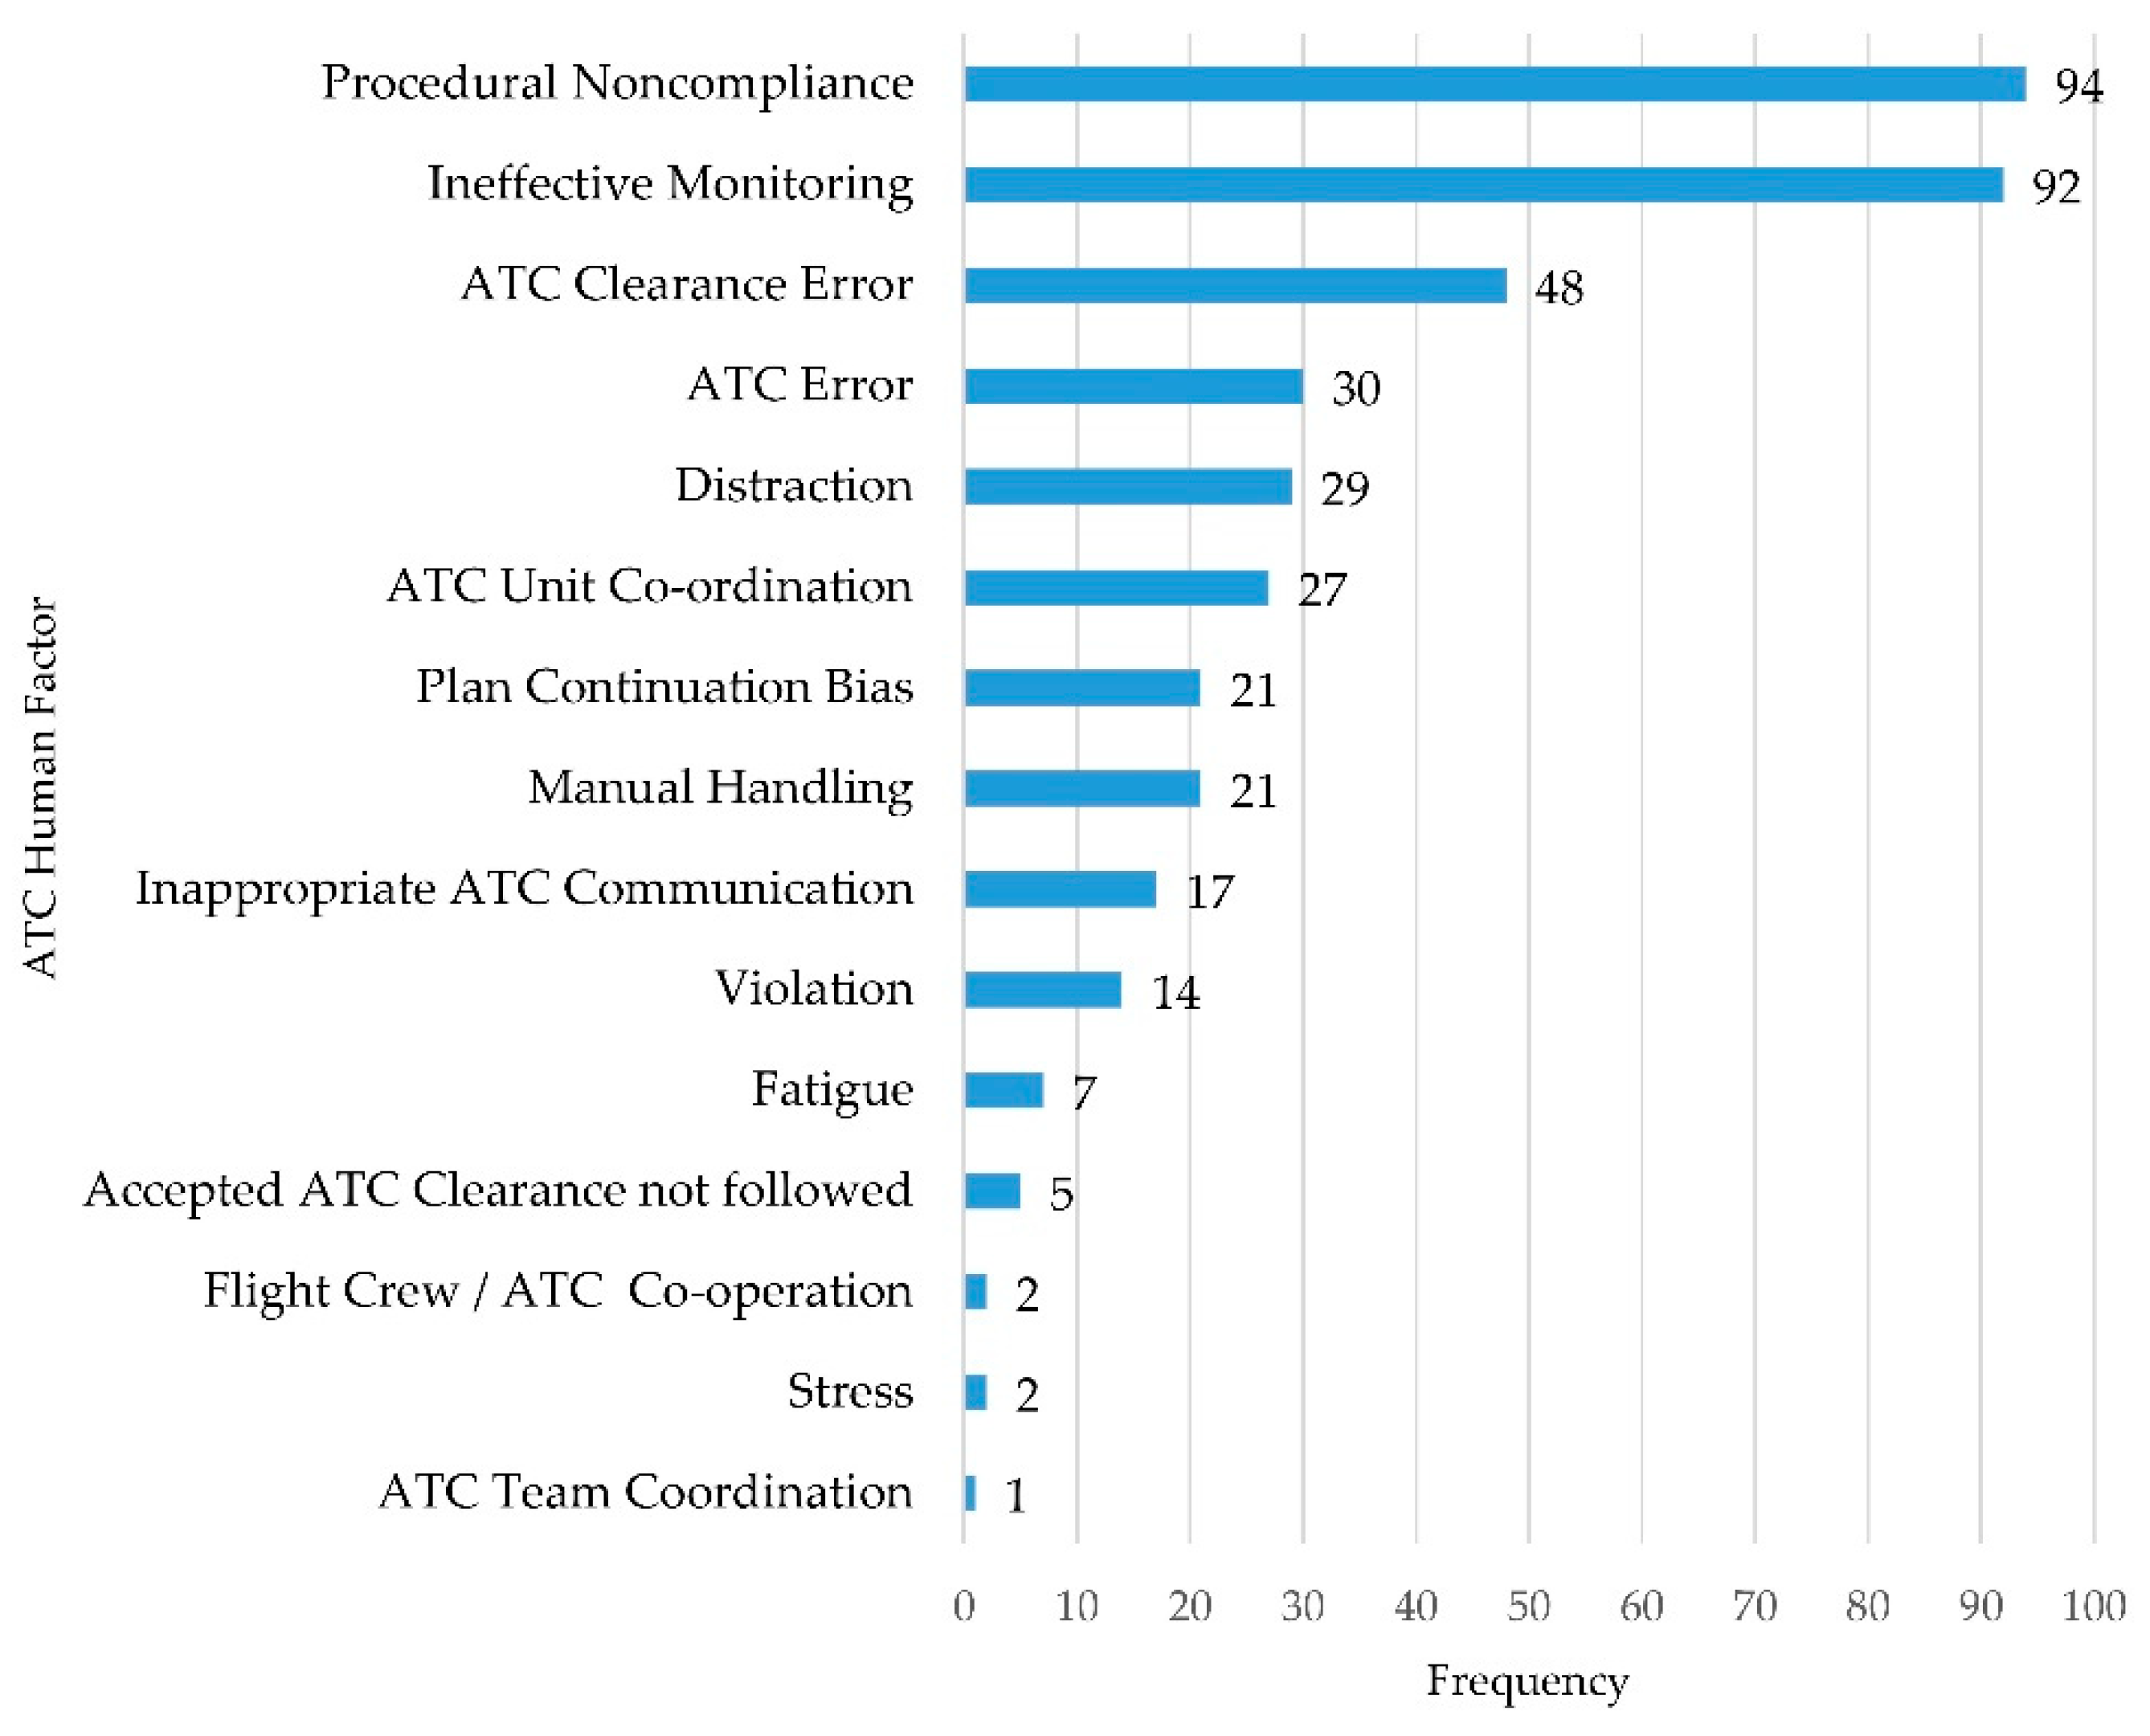
Figure 6 shows the category of ATC human factors and the frequency of each human factor according to Skybrary statistics in 142 aviation accidents/incidents worldwide from 1980 to 2019. As we can see, a total of 14 human factor tags were behind 142 aviation accidents/incidents, and all human factor tags occurred 410 times; where 94 accidents/incidents related to procedural noncompliance and 92 accidents/incidents related to ineffective monitoring, while only 2 and 1 accidents/incidents related to stress and ATC team coordination, respectively. Note that this is because the human factors behind every aviation accident/incident are complex and diverse, as in the case of the 4 April 2016 accident, a Boeing 737-800 crew taking off in normal night visibility from Jakarta Halim were unable to avoid an ATR 42-600 undertow, which had entered their runway after ambiguity in its clearance. Both aircraft sustained substantial damage and caught fire but all those involved escaped uninjured. The accident report involves four kinds of human factor tags, including the ATC clearance error, ATC unit coordination, ineffective monitoring, and procedural noncompliance, hence all human factor tags occurred 410 times.
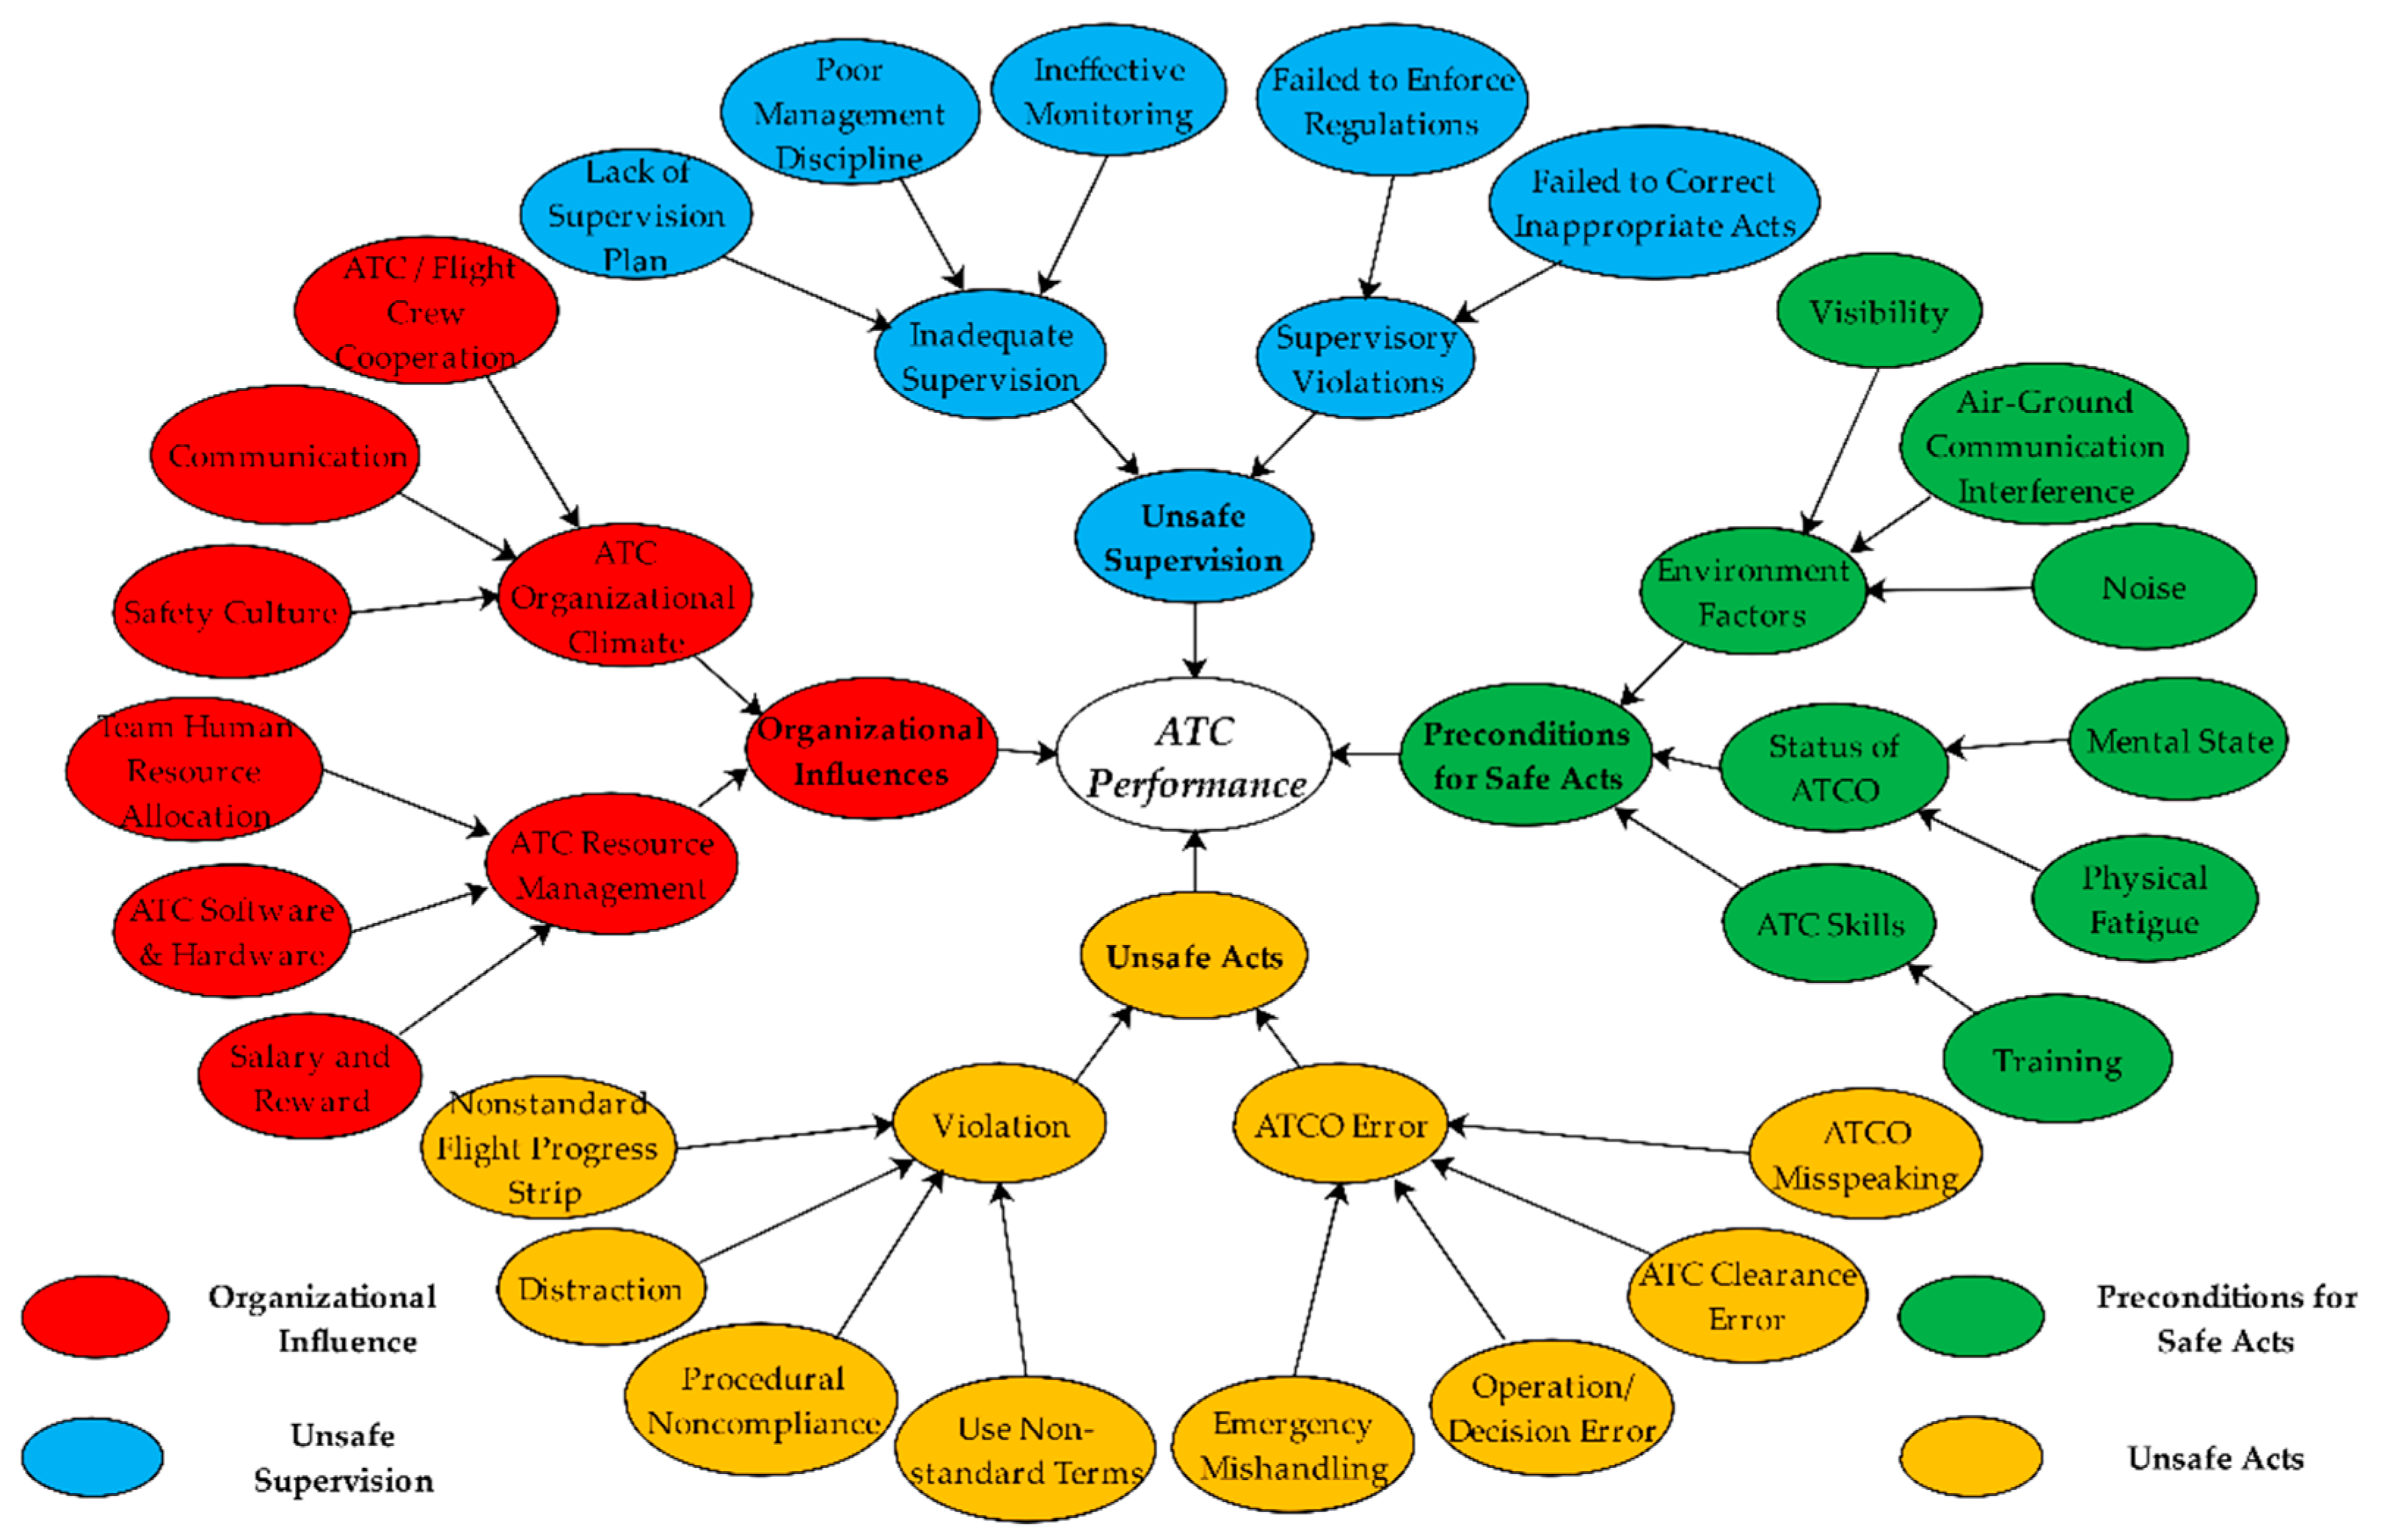
Generally, the ATC performance model is a complex system with tightly coupled relationships between nodes. Combined with the opinions of experts in the aviation field, Figure 7 shows the “ATC Performance” model in this paper, which contains four sequential paths affecting the performance of ATC, namely “Organizational Influence”, “Unsafe Supervision”, “Preconditions for Unsafe Acts”, and “Unsafe Acts”, and each influence path contains human factors at the corresponding level.
In order to better illustrate each node in the ATC performance model, Table 1 describes the source and detailed interpretation of human factors. It is worth mentioning that the ATC human factor tags from Skybrary are not very comprehensive, and most of them are distributed on the two levels of unsafe acts and the preconditions of unsafe acts. However, some human factors related to organizational influence, such as organizational climate, safety culture, or resource allocation, are difficult to be directly recorded in the accident report. However, in previous studies [4,33,34], these factors did affect ATC performance. Therefore, some nodes in the model are not involved in the accident report mentioned above, which are derived from references and expert opinions.

3.2. Data Collection

Generally, when the number of parents involved in a BN is large, collecting a conditional probability table (CPT) of each node from the accident/incident reports or experts’ opinions is a challenging task. Since the accident reports related to ATC cannot record all the information of each node, it is difficult to deduce CPTs directly from the database. In this paper, the original parameters of CPT are obtained by combining the analysis of aviation accident reports and survey. However, the limitations of the data need to be noted, as the survey related to human factors is susceptible to the influence of statistical factors. These expert estimates, plus the need to be cautious about statistical fluctuations, limit the accuracy of conditional probability estimates [39].

3.2.1. Objective Marginal Probability

The marginal probabilities are obtained by analyzing literature review and ATC accident reports. Two nodes of “ATC Clearance Error” and “Distraction” are taken as examples to illustrate how to obtain the marginal probability from the database. Of the 142 aviation accidents/incidents recorded by the “SKYbrary” between 1980 and 2019, 48 accidents/incidents were related to “ATC Clearance Error,” and 29 were related to “Distraction.” According to the above 142 relevant records, the marginal probabilities of nodes were calculated, as shown in Table 2.

3.2.2. Subjective Conditional Probability

The Noisy MAX model is used to generate conditional probabilities, and the survey is conducted to obtain the original parameters, involving human factors at four levels of HFACS [30]. Each node in the survey has two types of questions, corresponding to the dependencies between parent and child nodes and the countermeasures to be taken. Questions are divided into the following two types:
  • Type 1 is used for conditional probabilities assignment, which requires respondents to give conditional probabilities under the condition that only child and parent are considered.
  • Type 2 is used for model validation, which requires respondents to select the countermeasures of different nodes that should be taken.
We successfully collected valid questionnaire sheets from 26 air traffic controllers and experts familiar with ATC in China. The Likert scale was adopted to evaluate the survey, with 1 point representing a very low probability and 5 points representing a very high probability, which were used to indicate the influence degree of one node on another node. Taking the node ATC organizational climate in Figure 7 as an example, the Type 1 question amounted to: What is the probability that “Safety Culture = good” results in “ATC Organizational Climate = good”?
Type 2 question: Which of the following measures do you think would reduce human errors and improve ATC performance? Choose several most influential factors or give your opinions. For instance, the corresponding measure lists include regular safety awareness training, improve management discipline, reasonable arrangement work time, strengthening ATC professional skills training, and so on. After the original probabilities were collected and normalized, the noisy MAX model above was used to generate CPT. Table 3 shows an example of CPTS. Out of those 42 sets of questionnaires, 26 sets were valid, reaching a valid response rate of 61.9%. The respondents’ backgrounds are described in Table 4.

3.3. Sensitivity Analysis

Sensitivity analysis is a general method to study the influence of inaccurate parameters on model output and to compare the importance of different factors. The analysis based on it will be shown in Section 4.3. The sensitivity function can be used to express the sensitivity change of the posterior probability of the target variable [40]. X is defined as the probability of the variable taking a certain state, Y is a query, then according to the evidence E, the posterior probability S (Y|E) (X) can be expressed as the normalized function of X:
s ( y | e ) ( x ) = α x + β λ x + 1 .
Here, replace the values of X with 0, 0.5, and 1, respectively, and substitute the posterior probability values of the target variable to determine the values of α , β and λ :
{ β = s ( 0 ) λ = β s ( 0.5 ) s ( 0.5 ) s ( 1 ) 1 α = s ( 1 ) * ( λ + 1 ) β .
Then, according to the partial derivative of S (Y|E) (X) with respect to X, the sensitivity value of S on X can be obtained:
f ( x ) = s ( x ) x = α β λ ( λ x + 1 ) 2 .
The more sensitive the target variable is to the factor, the more drastic the change of S(Y|E) (X) is with the factor X value.

4. Results

The BN model was implemented in GeNIe software. After the BN model was estimated, sensitivity analysis of probability was carried out by giving evidence of different subsets. In addition, the final target variable “ATC Performance” was performed with bottom-up probability reasoning to calculate the posterior probability of each human factor. Finally, content validity and predictive validity were applied to verify the BN model.

4.1. Key Factors

By setting the human factors in Figure 7 to different states (“Good, Normal, Bad” or “Yes, No”), the percentage of posterior probability increase of the target variable was calculated to measure the importance of different human factors on ATC Performance.
As shown in Table 5, the five most important human factors affecting ATC Performance are training, physical fatigue, mental state, ineffective monitoring, and ATC software/hardware. Obviously, training contributes the most to the performance of air traffic controllers, which means that the professionals interviewed believe that the above human factors are most likely to exist in air traffic accidents related to air traffic controllers. One interesting human factor is ineffective monitoring, which will affect the organization’s safety culture, and the attitude, performance, and efficiency of the controllers, ultimately affecting the air traffic safety.

4.2. BN Inference

The process of finding the key factors is a top-down probabilistic diagnosis. In Figure 7, the value of the final target variable “ATC Performance” is replaced by 1, and the posterior probability of all parent nodes can be obtained; that is, the so-called bottom-up diagnosis. Here, the probability of “ATC Performance = Bad” is set to 1 to obtain the posterior probability of all nodes. The higher the posterior probability of human factors, the greater the contribution of this factor to aviation accident risk.
Figure 8 shows the marginal probability distribution of the four levels in the HFACS model. Unsafe acts had the greatest influence on ATC Performance (79.4%), while preconditions for safe acts contributed the least (40.3%).
Apparently, as shown in Figure 9, unsafe acts contributes the most to the overall risk of accidents, including violations and air traffic control errors, with a posteriori probability of 71.3% and 52.6%, respectively. This means that the respondents believe that these human factors are most likely to be present in air accidents involving controllers. The second group of factors with more considerable influence belong to unsafe supervision, and preconditions of safe acts level include inadequate supervision, ATCOs states, whose posterior probabilities range between 40% and 65%. The contributions of the other levels to the ATC performance are similar (23%–35%), in which the supervision violation at the level of unsafe supervision and the organizational climate at the level of organizational influence contribute the least to the performance (posterior probabilities are less than 25%).

4.3. Model Validation

A BN model without verification is incomplete. This study adopts the following two methods:
  • Content validity: In order to check the validity of Content, it is necessary to ensure that the BN network only considers the relevant human factor variables and their relations related to ATC. In this regard, all human factors are derived from the literature review and the viewpoint of front-line ATCOs, who also provide great help for the subsequent input of conditional probability between nodes.
  • Predictive validity: The most direct and effective verification method is to compare the diagnosis results of the BN model with the database used, which include countermeasure preferences and sensitivity verification.
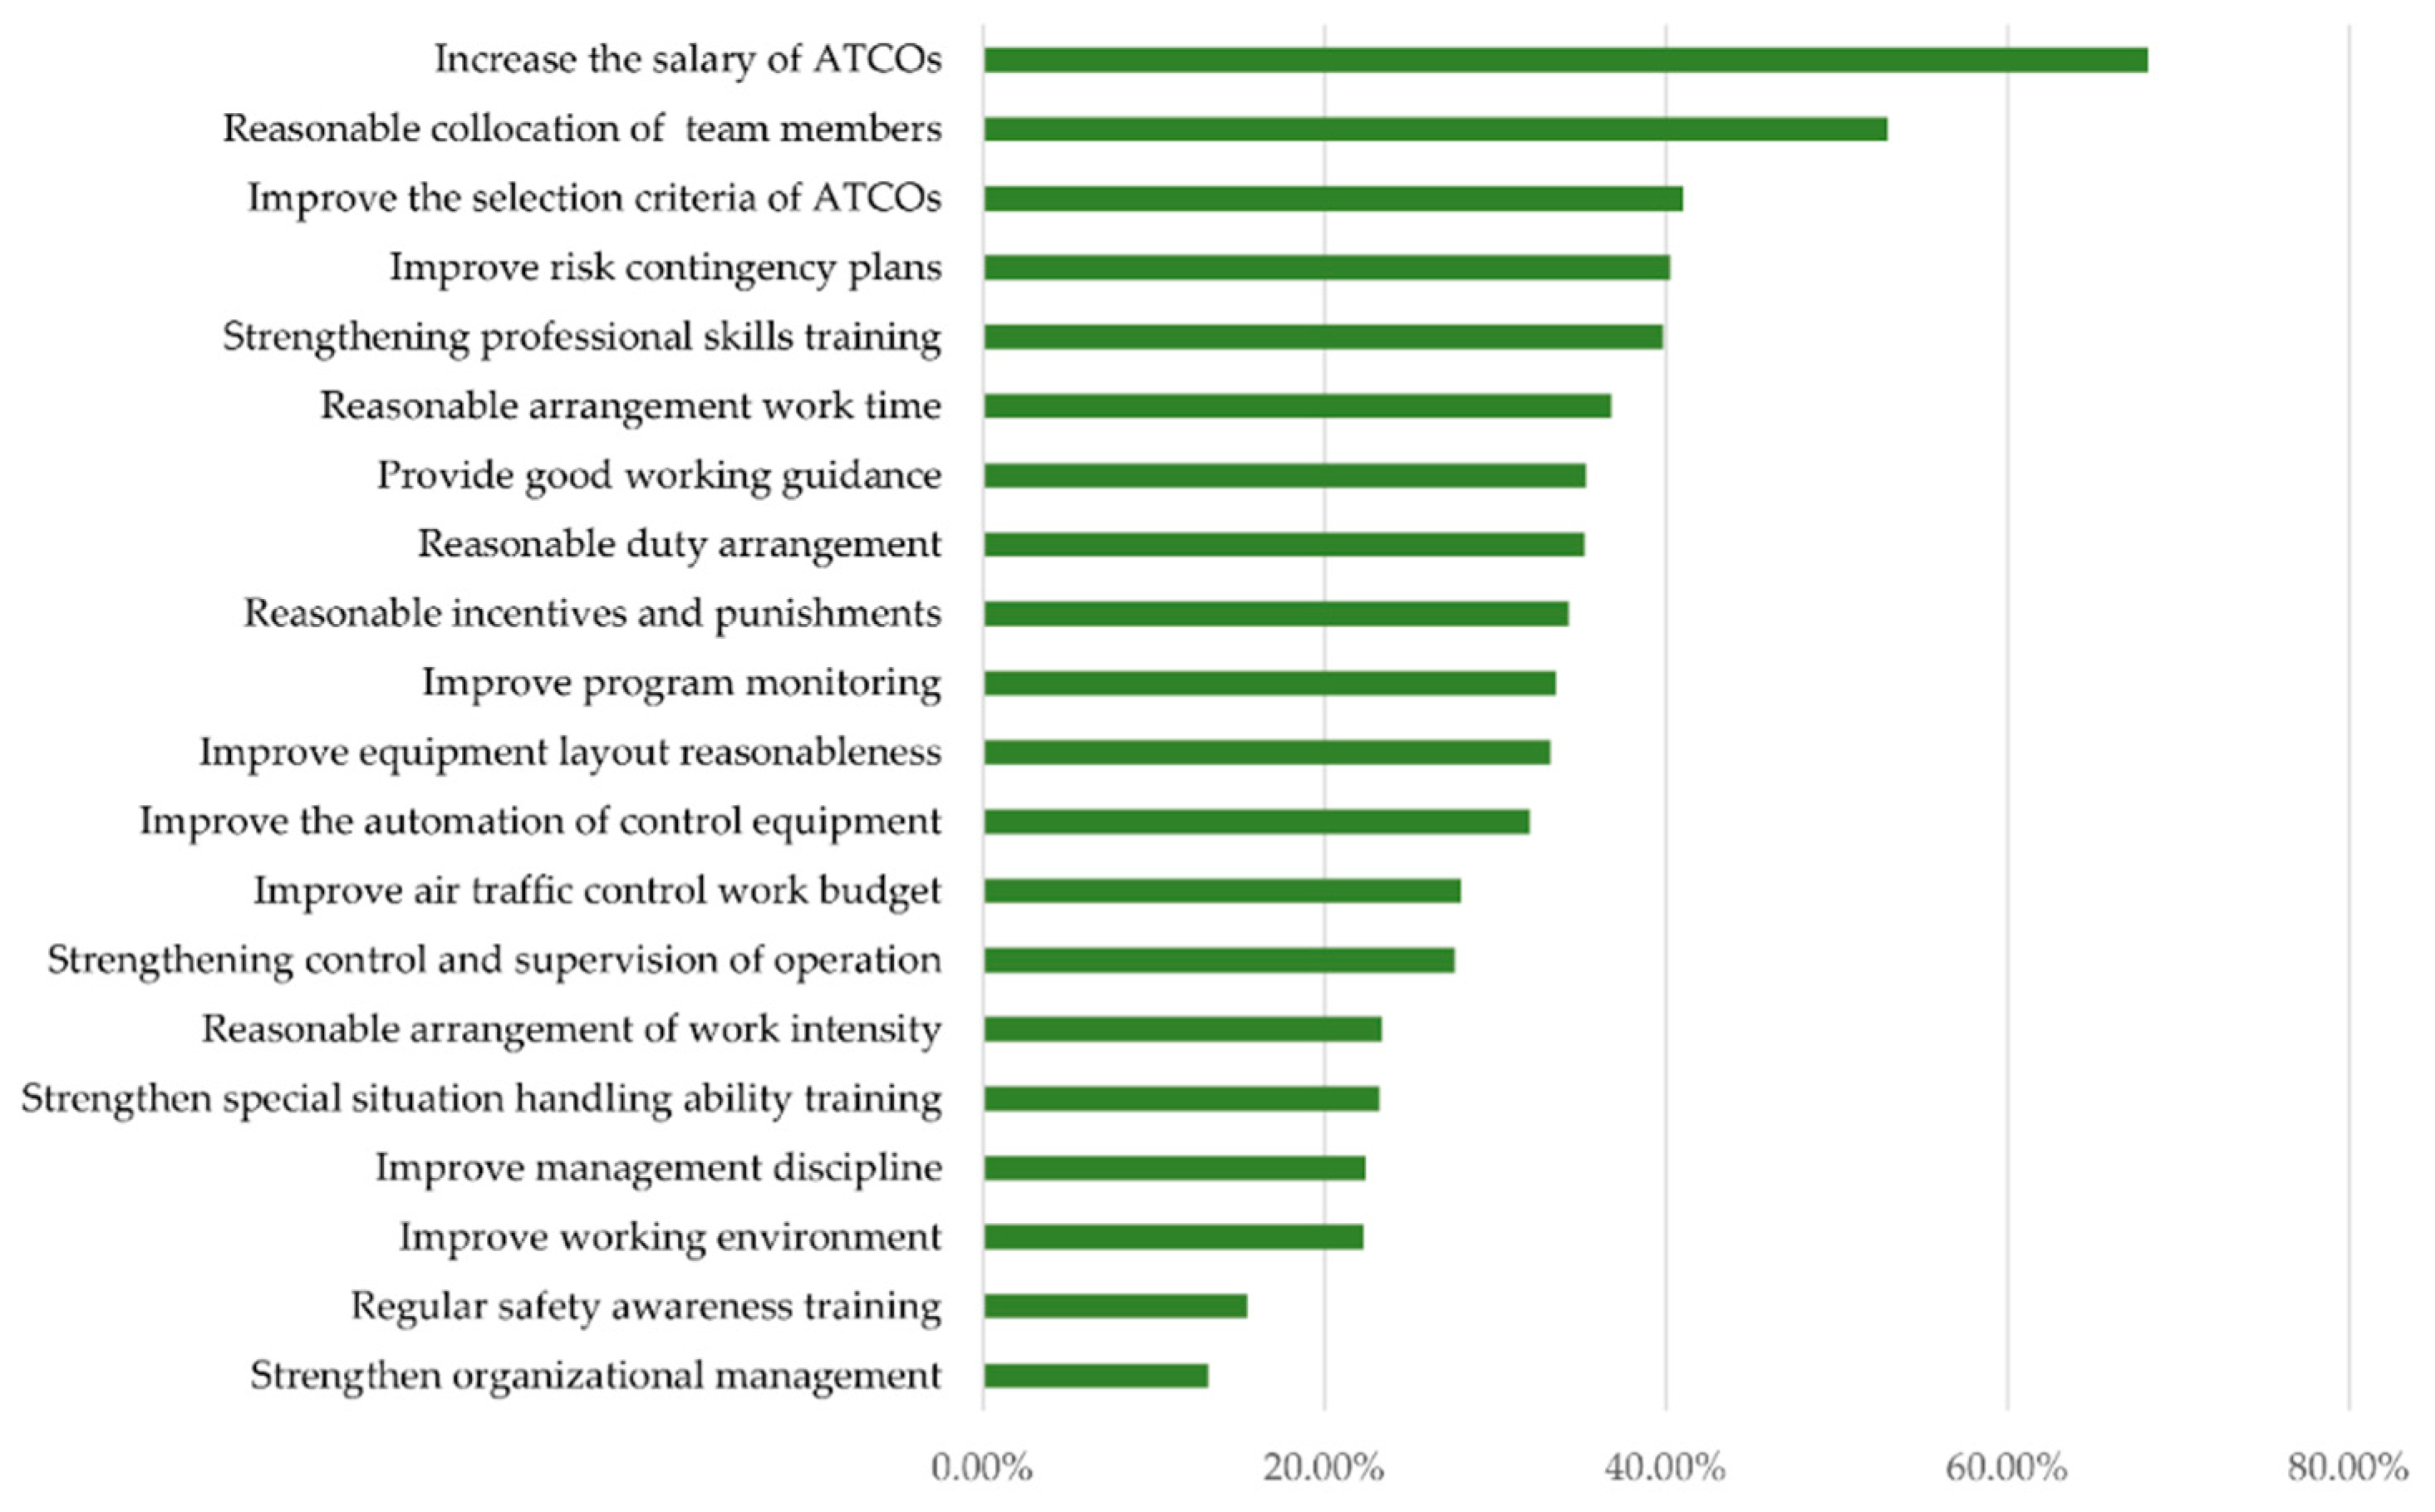
Firstly, as mentioned above in Section 3.2.2, there are questions designed for the preference of countermeasures. According to their prior knowledge, the respondents were required to select the six most influential factors from lists that would reduce human errors and improve ATC performance, then compare them with the posterior key human factors calculated by the Bayesian network. Figure 10 shows the countermeasure preferences of 26 frontline ATCOs and relevant experts. Interestingly, “Increase the salary of ATCOs” (chosen by 68.20% of the respondents) is the most popular response. Higher salaries may have a positive effect on ATC mental state and physical fatigue. Followed by “Reasonable collocation of team members” (53.13%) and “Improve the selection criteria of ATCOs” (41.35%). Understandably, air traffic controllers selected with higher standards tend to have better professional qualities, which can make up for the possible consequences of insufficient training. At the same time, reasonable collocation of team members can also reduce ATC work burden and pressure. In contrast, “Regular safety awareness training” and “Strengthen organizational management” are the least popular measures chosen by 13.32% and 15.53%, respectively. The possible explanation is that respondents are satisfied with the current situation of safety awareness training and organizational management. The above results are roughly consistent with the observations in Section 4.1. However, respondents’ preference for countermeasures only indicates their observation and understanding of ATC performance in this region, and cannot be extended to other regions of the world.
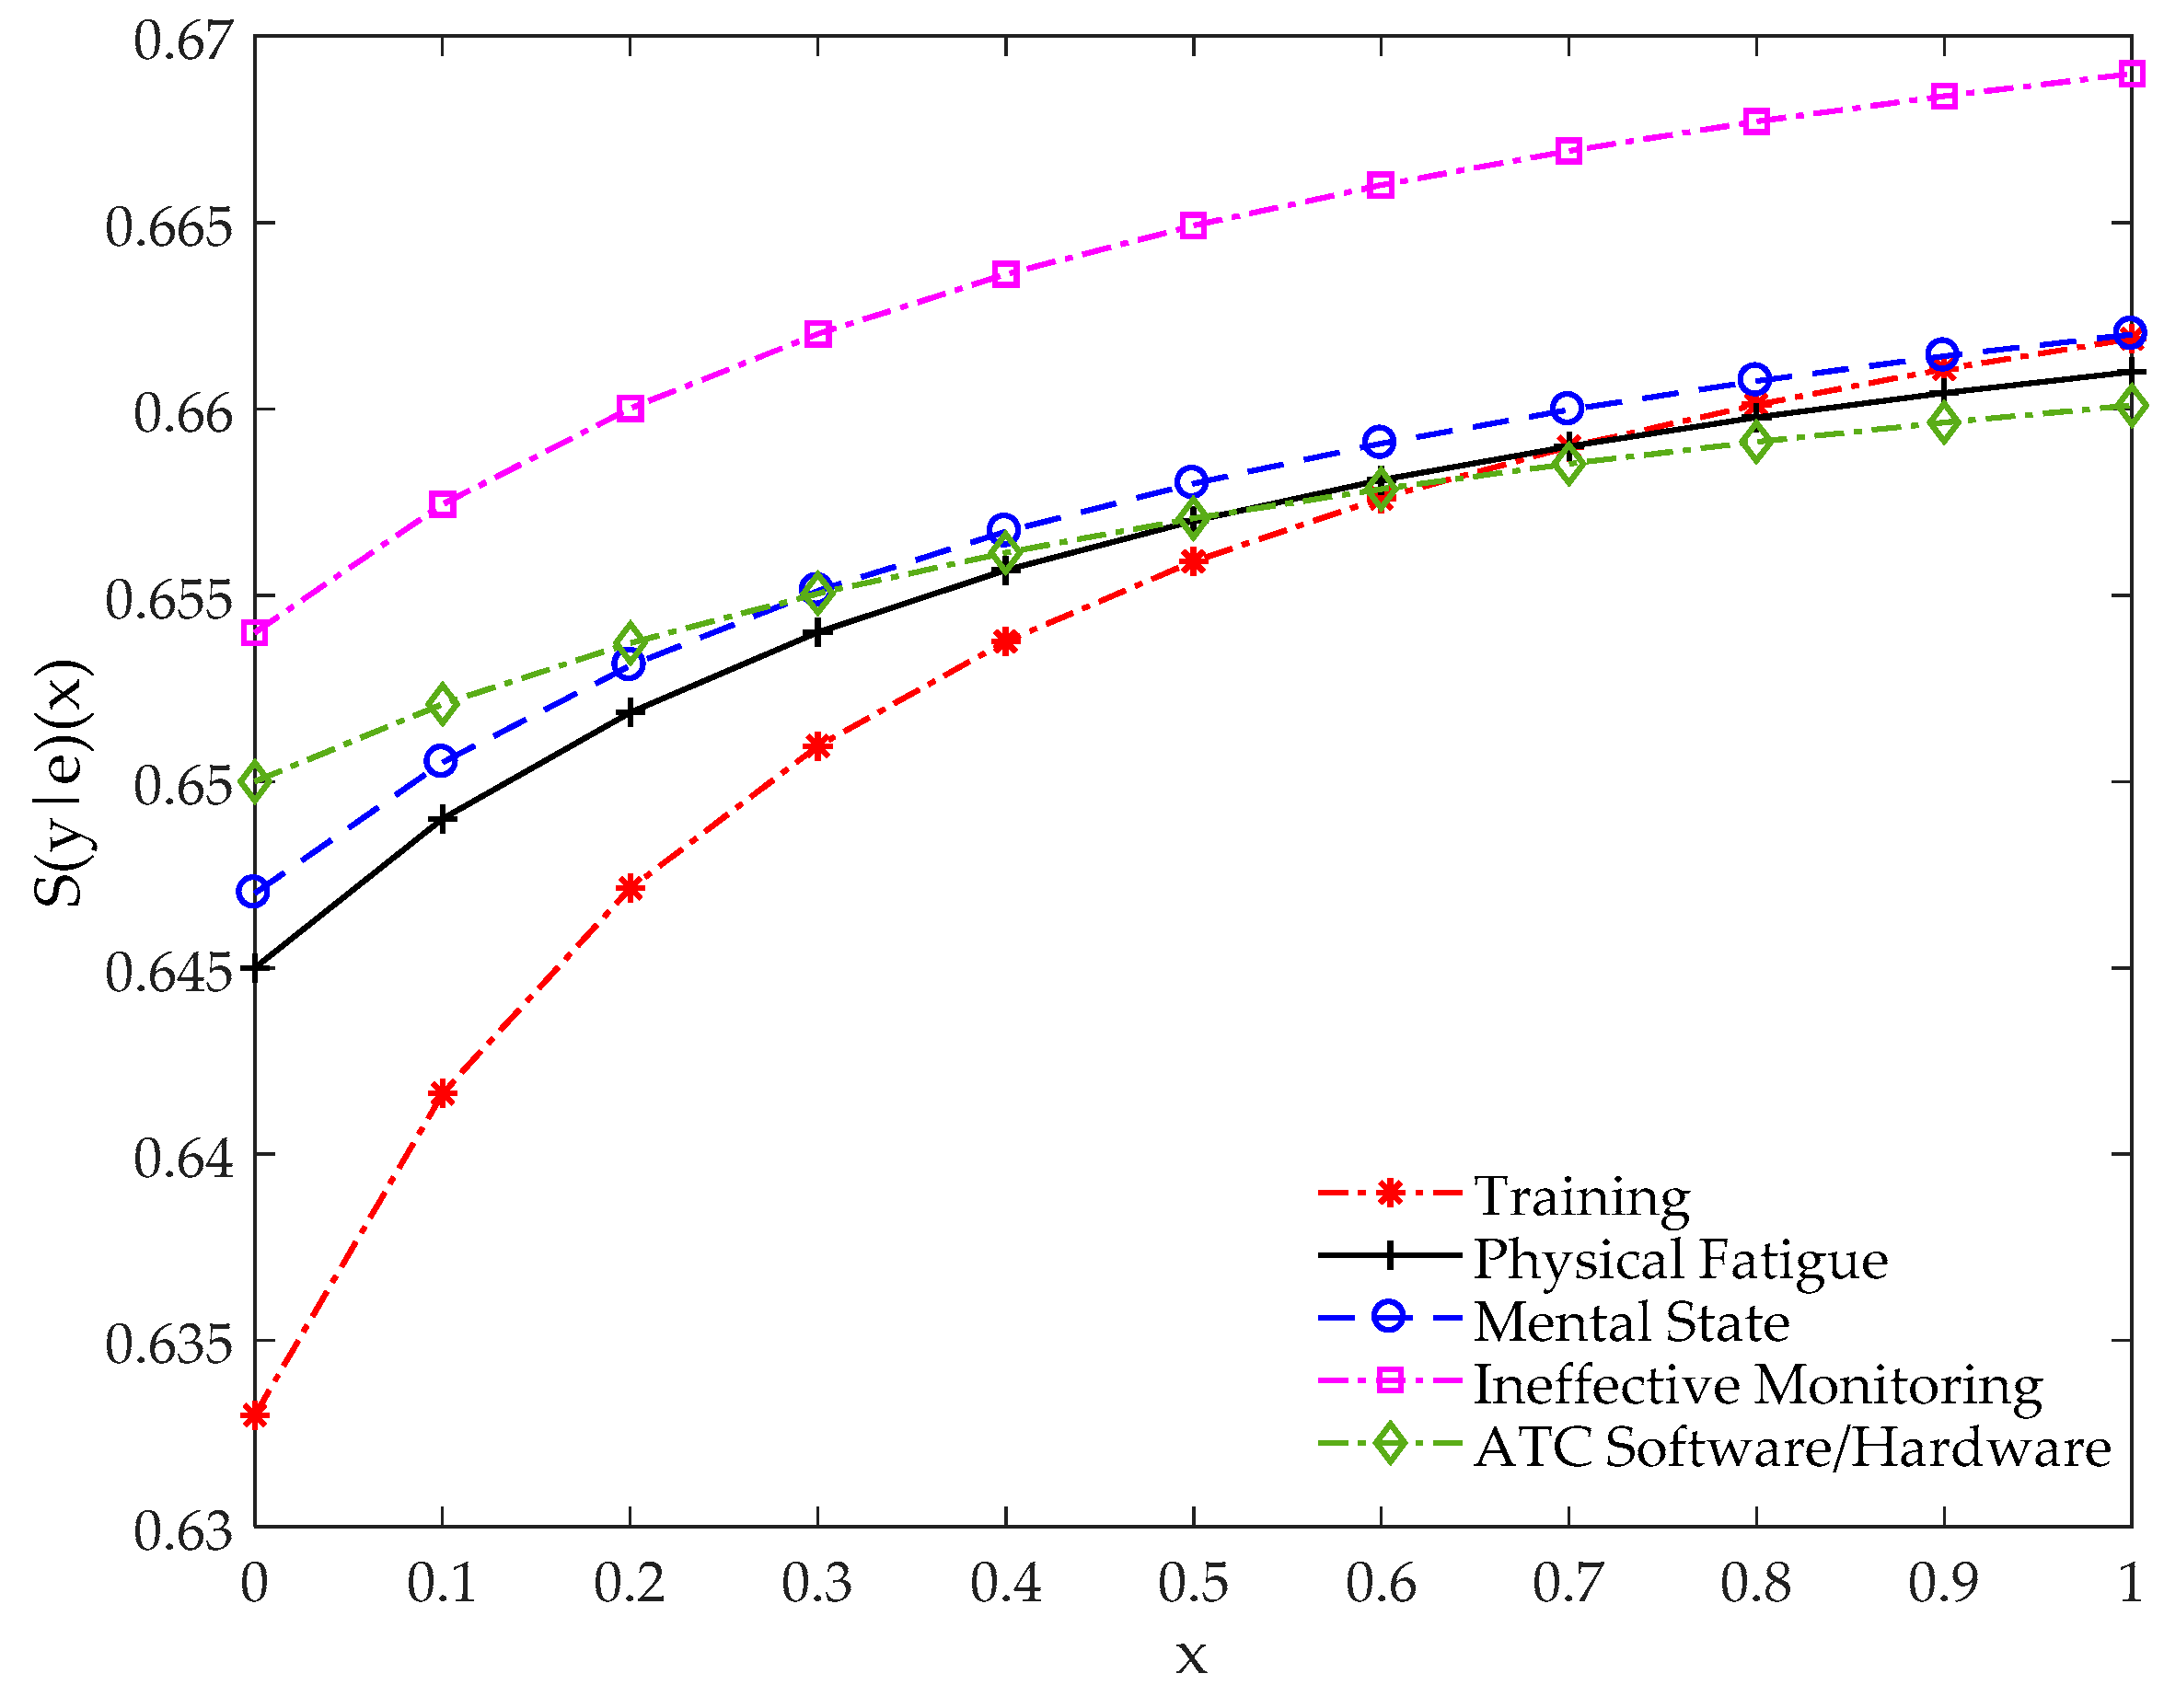
Secondly, the sensitivity analysis of the target node “ATC Performance” was conducted to determine how much uncertainty can be reduced by each human factor. The mathematical function and analysis were shown in Section 3.3. Figure 11 shows the human factors with relatively high sensitivity.
The study found that the target variable was relatively sensitive to training, physical fatigue, mental state, ineffective monitoring, and ATC software/hardware. This finding is also consistent with previous observations.

5. Conclusions

As reviewed in Section 1, traditional accident analysis or risk assessment methods are difficult to quantify rare accidents related to aviation safety. HFACS-BN model provides an additional method for identifying the major human factors that may lead to aviation accidents. Through the analysis of 142 aviation accidents/incidents related to ATC human factors worldwide from 1980 to 2019, the ATC performance model identified 25 major human factors (Figure 1). In addition, the subjective data of the human factors perceived by ATCOs are further collected to supplement the objective data of aviation accident report. CPTs are elicited by the noisy MAX model, and two inference methods of probability prediction and probability diagnosis are used to analyze the causal relationship and posterior probability among variables in the BN model.
Concerning the four levels of the HFACS framework, the influence of human factors on various levels is quite different. Unsafe acts (79.4%) and unsafe supervision (56.9%) contribute the most to ATC performance, while preconditions for safe acts (40.3%) has the lowest Influence. Overall, the top five most influential factors for ATC Performance are training, physical fatigue, mental state, ineffective monitoring, and ATC software/hardware; specific values are described in Section 4. The above results further imply that the formulation of aviation safety policy should pay more attention to the supervision level and individual factors. Furthermore, due to the complexity between human factors and accident risk, the coupling relationship and chain reaction between human factors should be fully utilized in the safety-related capacity building for ATCO; for example, reasonable allocation of team members may increase work efficiency and reduce the physical strain.
The contribution of this study is mainly reflected in the following aspects. Firstly, the HFACS framework and BN model are used to provide a systematic and operable method for aviation safety research. Secondly, it makes full use of the ATCO’s professional knowledge to overcome the issues of database availability, as mentioned above in Section 3.2.2, to calculate the order of key factors, and to derive effective countermeasures against human errors. Thirdly, the modeling method and data analysis strategy of this study can also be further applied to security research in non-aviation fields. Examples include areas involving human-factor-related accident risk mechanisms such as public transport or mining systems.
This study is, however, not free of limitations, including:
  • Almost all accidents have multiple contributory factors and that pilot error is often the probable cause.
  • Air traffic control systems vary in size and structure around the world so that where one investigative agency may find ATC, or an associated controller or controllers, responsible for a particular accident, another one may not.
  • These data are limited to summarized accident reports based on queried keywords and not based on independent evaluations of all accidents, probable causes, or contributing factors.
  • Expert opinions were gathered from one ATC system (i.e., China) and perceptions may not reflect a comprehensive global view.
  • The use of expert evaluation and the noisy MAX algorithm to evaluate the prior probability of the root node in the BN model will inevitably involve cognitive bias.
Finally, the current BN model in this study may change with the passage of time and the cognition of various human factors by the frontline ATC. More research should be accumulated in the future to monitor the changes in human factors and causal relationships related to aviation safety, reducing the contribution of human errors to the risk of aviation accidents.

6. Key Points

  • “Human error” is an unhelpful yet common explanation for the cause of accidents/incidents in complex activities featuring vast combinations of people and technology (e.g., aviation) [41].
  • To better understand the conditions influencing human error in aviation accidents/incidents related to air traffic control, we analyzed the “SKYbrary” database based on the HFACS model and preliminarily identified the human factors affecting ATC performance.
  • A subsequent analysis based on BN model combined with accident statistics and expert opinions found that inadequate training, physiological fatigue, and ineffective monitoring were important factors affecting ATC performance continuation aggravated by the lack of regulatory plans.
  • Meanwhile, validated the effectiveness of key human factors with the help of sensitivity analysis functions and provided countermeasures to improve ATC performance through surveys of respondents.

Author Contributions

Conceptualization, K.D.; data curation, K.D.; formal analysis, T.L.; funding acquisition, W.S.; investigation, T.L.; methodology, T.L.; supervision, W.S.; validation, T.L.; writing—original draft, T.L.; writing—review and editing, T.L.

Funding

This research received no external funding.

Acknowledgments

We are grateful to two anonymous reviewers for their thoughtful and constructive comments, which helped improve both the exposition and technical quality of the paper.

Conflicts of Interest

The authors declare no conflict of interest.

Appendix A

The aviation accident database is an important data source for the construction of the Bayesian network. Based on 142 accidents/incidents related to ATC human factors in 1980–2019 listed on Skybrary, this paper conducts detailed and specific accident analysis, which provides an essential basis for the establishment of CPT. Brief information on the aviation accidents/incidents shown in Table A1.
Table A1. Brief information on air accidents/incidents.
DateAircraft TypeLocation
A
2013A109Vicinity London Heliport London UK
2008A310Khartoum Sudan
2008A310Vicinity Quebec Canada
2009A318/B738En-route, Trasadingen Switzerland
2007A318/B739Vicinity Amsterdam Netherlands
2011A319/A321En-route, west north west of GeneVaSwitzerland
2011A319/PRM1En-route, near Fribourg Switzerland
2016A319Santiago de Compostela Spain
2010A319/A319En-route, South west of Basle-Mulhouse France
2011A320/A320Zurich Switzerland
2012A320/A346En-route Eastern Indian Ocean
2017A320/AT76Yangon Myanmar
2012A320/B738Barcelona Spain
2016A320/B738Vicinity Delhi India
2013A320/B739Yogyakarta Indonesia
2011A320/C56XVicinity GeneVa Switzerland
2014A320/CRJ2Port Elizabeth South Africa
2010A320Oslo Norway
2000A320Toronto Canada
2013A320En route, north of Marseilles France
2009A320En-route, Denver CO USA
2014A320Vicinity Naha Okinawa Japan
2013A320/B738Vicinity Delhi India
2013A320/E190/B712Vicinity Helsinki Finland
2015A321/B734Barcelona Spain
2011A321/B738Dublin Ireland
2012A332/A333En-route, north West Australia
2004A332/RJ1HVicinity Zurich Switzerland
2014A343/B763Barcelona Spain
2012A343/GLIDEn-route, north of Waldshut-TiEngEn southwest Germany
2012A343Vicinity Paris CDG France
2009AS50/PA32En-route Hudson River NJ USA
1999AT43Vicinity Pristina KosoVo
2004AT45/B733Munich Germany
1999AT72/B732Vicinity Queenstown New Zealand
2009AT72Mumbai India
2017AT75/B739Medan Indonesia
2014AT76Surabaya Indonesia
B
2014B190/B737Calgary Canada
2008B190Vicinity Bebi south eastern Nigeria
1990B722/BE10Atlanta GA USA
2004B732/A321Manchester UK
1988B732En-route, Maui Hawaii
1982B732Vicinity Washington National DC USA
1991B733/SW4Los Angeles CA USA
2010B733/VehicleAmsterdam Netherlands
2008B733Vicinity Helsinki Finland
1996B734/MD81En-route, Romford UK
2010B734Amsterdam Netherlands
2008B734Palembang Indonesia
2015B734Sharjah UAE
2010B734Vicinity Lyon France
1999B735Vicinity Billund Denmark
2013B735Vicinity Kazan Russia
2001B735/B733Dallas-Fort Worth TX USA
2006B737/B737Vicinity Geneva Switzerland
2005B737Chicago Midway USA
2011B737/C212En-route/maneuvering, near Richmond NSW Australia
2018B738/A320Edinburgh UK
2016B738/AT46Jakarta Halim Indonesia
2004B738/B744Los Angeles USA
2007B738/CRJ1New York La Guardia USA
2006B738/E135En-route, Mato Grosso Brazil
2013B738Alicante Spain
2009B738Kingston Jamaica
2017B738Sint Maarten Eastern Caribbean
2010B738En-route, east of Asahikawa Japan
2010B738/B734Johannesburg South Africa
2010B738/B738Girona Spain
2012B738/B738Vicinity Oslo Norway
2010B738/B738Vicinity Queenstown New Zealand
2011B738/B763Barcelona Spain
2000B744/A321Vicinity London Heathrow UK
2010B744/VehicleLuxembourg Airport Luxembourg
2009B744Mumbai India
2007B744Sydney Australia
1996B752En-route, Vicinity Chancay Peru
2001B762/A310Toronto Canada
2002B762Vicinity Busan Korea
1998B763/B744Amsterdam Netherlands
2007B763/B772New Chitose Japan
2014B763Addis Ababa Ethiopia
2010B763/B738Vicinity Melbourne Australia
2009B772St Kitts West Indies
2015B773/B738/B738Melbourne Australia
2007B773Auckland Airport New Zealand
2016B773Dhaka Bangladesh
C
1997C185Wellington New Zealand
2012C30JEn-route, northern Sweden
2009C525/B773Vicinity London City UK
2004C550Vicinity Cagliari Sardinia Italy
2006CRJ1Lexington KY USA
2014CRJ2/A320Vicinity Port Elizabeth South Africa
2008CRJ7/C172Allentown PA USA
2009CRJ9/VehiclesWhitehorse YK Canada
2017CRJ9Turku Finland
D
2012D328/R44Bern Switzerland
1990DC91/B722Detroit MI USA
1983DC93/B722Madrid Spain
1994DC93Vicinity Charlotte NC USA
2002DC95/C206Toronto Canada
2017DH8BKangerlussuaq Greenland
2013DH8C/P180Ottawa ON Canada
E
2009E145/DH8BCleveland USA
2011E145/E135Chicago O’Hare USA
2016E190/D328Basel Mulhouse France
2011E190/VehicleDenver COUSA
2010E190Oslo Norway
2016E195/A320Brussels Belgium
F
2012F100/EC45Vicinity Bern Switzerland
2000F15/B752En-route, South East of Birmingham UK
2005F15/E145En-route, Bedford UK
2016F50/P28TVicinity Friedrichshafen Germany
2014FA50/VehicleMoscow Vnukovo Russia
M
1994MD82/C441Lambert-St Louis MI USA
2004MD83Vicinity Nantes France
2001MD87/C525Milan Linate
P
2012PRM1/CRJ2Nice France
R
2009RJ1H/UNKNVicinity Malmo Sweden
2011RJ85/VehicleGothenburg Sweden
S
2011SF34/AT72Helsinki Finland
2000SH33/MD83Paris CDG France
2012SU95maneuvering near Jakarta Indonesia
T
2002T154/B752En-route, Uberlingen Germany
2011TBM8Birmingham UK
V
2006Vehicle/B738Brisbane Australia
2013Vehicle/B773Singapore
2008Vehicles/B737Toronto Canada
W
1993WW24Vicinity John Wayne Airport Santa Ana CA USA

References

  1. Aurino, D.E.M. Human factors and aviation safety: What the industry has, what the industry needs. Ergonomics 2000, 43, 952–959. [Google Scholar] [CrossRef] [PubMed]
  2. Bentley, R.; Hughes, J.A.; Randall, D.; Shapiro, D.Z. Technological support for decision making in a safety critical environment. Saf. Sci. 1995, 19, 149–156. [Google Scholar] [CrossRef]
  3. Kirchner, J.H.; Laurig, W. The human operator in air traffic control systems. Ergonomics 1971, 14, 549–556. [Google Scholar] [CrossRef]
  4. Chang, Y.-H.; Yeh, C.-H. Human performance interfaces in air traffic control. Appl. Ergon. 2010, 41, 123–129. [Google Scholar] [CrossRef] [PubMed]
  5. Isaac, A.R.; Ruitenberg, B. Air Traffic Control: Human Performance Factors; Routledge: Abingdon-on-Thames, UK, 2017. [Google Scholar]
  6. Zhou, T.; Zhang, J.; Baasansuren, D. A Hybrid HFACS-BN Model for Analysis of Mongolian Aviation Professionals’ Awareness of Human Factors Related to Aviation Safety. Sustainability 2018, 10, 4522. [Google Scholar] [CrossRef]
  7. Wiegmann, D.A.; Shappell, S.A. A Human Error Approach to Aviation Accident Analysis: The Human Factors Analysis and Classification System; Routledge: Abingdon-on-Thames, UK, 2017. [Google Scholar]
  8. Shorrock, S.T.; Kirwan, B. Development and application of a human error identification tool for air traffic control. Appl. Ergon. 2002, 33, 319–336. [Google Scholar] [CrossRef]
  9. Chen, W.; Huang, S. Evaluating Flight Crew Performance by a Bayesian Network Model. Entropy 2018, 20, 178. [Google Scholar] [CrossRef]
  10. Wiegmann, D.A.; Shappell, S.A. Human error analysis of commercial aviation accidents: application of the Human Factors Analysis and Classification system (HFACS). Aviat. Space Environ. Med. 2001, 72, 1006–1016. [Google Scholar]
  11. Shappell, S.A.; Wiegmann, D.A. Reshaping the way we look at general aviation accidents using the human factors analysis and classification system. In Proceedings of the International Symposiumon Aviation Psychology, Dayton, OH, USA, 14–17 April 2003; pp. 1047–1052. [Google Scholar]
  12. Reinach, S.; Viale, A. Application of a human error framework to conduct train accident/incident investigations. Accid. Anal. Prev. 2006, 38, 396–406. [Google Scholar] [CrossRef]
  13. Baysari, M.T.; Caponecchia, C.; McIntosh, A.S.; Wilson, J.R. Classification of errors contributing to rail incidents and accidents: A comparison of two human error identification techniques. Saf. Sci. 2009, 47, 948–957. [Google Scholar] [CrossRef]
  14. Vairo, T.; Quagliati, M.; Del Giudice, T.; Barbucci, A.; Fabiano, B. From land-to water-use-planning: A consequence based case-study related to cruise ship risk. Saf. Sci. 2017, 97, 120–133. [Google Scholar] [CrossRef]
  15. Celik, M.; Cebi, S. Analytical HFACS for investigating human errors in shipping accidents. Accid. Anal. Prev. 2009, 41, 66–75. [Google Scholar] [CrossRef] [PubMed]
  16. Daramola, A.Y. An investigation of air accidents in Nigeria using the Human Factors Analysis and Classification System (HFACS) framework. J. Air Transp. Manag. 2014, 35, 39–50. [Google Scholar] [CrossRef]
  17. Trucco, P.; Cagno, E.; Ruggeri, F.; Grande, O. A Bayesian Belief Network modelling of organisational factors in risk analysis: A case study in maritime transportation. Reliab. Eng. Syst. Saf. 2008, 93, 845–856. [Google Scholar] [CrossRef]
  18. Díez, F.J.J.U.i.A.I. Parameter adjustment in Bayes networks. The generalized noisy OR–gate. In Uncertainty in Artificial Intelligence; Morgan Kaufmann: Burlington, MA, USA, 1993; pp. 99–105. [Google Scholar] [CrossRef]
  19. Heijden, M.V.D.; Hommersom, A. Causal Independence Models for Continuous Time Bayesian Networks. In Proceedings of the European Workshop on Probabilistic Graphical Models, Utrecht, The Netherlands, 17–19 September 2014. [Google Scholar]
  20. Shappell, S.A.; Wiegmann, D.A. The human factors analysis and classification system--HFACS; U.S. Department of Transportation, Office of Aviation Medicine: Washington, DC, USA, 2000.
  21. Patterson, J.M.; Shappell, S.A. Operator error and system deficiencies: analysis of 508 mining incidents and accidents from Queensland, Australia using HFACS. Accid. Anal. Prev. 2010, 42, 1379–1385. [Google Scholar] [CrossRef]
  22. Chauvin, C.; Lardjane, S.; Morel, G.; Clostermann, J.-P.; Langard, B. Human and organisational factors in maritime accidents: Analysis of collisions at sea using the HFACS. Accid. Anal. Prev. 2013, 59, 26–37. [Google Scholar] [CrossRef]
  23. Pearl, J. Bayesian netwcrks: A model cf self-activated memory for evidential reasoning. In Proceedings of the 7th Conference of the Cognitive Science Society, University of California, Irvine, CA, USA, 15–17 August 1985; pp. 329–334. [Google Scholar]
  24. Groth, K.M.; Mosleh, A. Deriving causal Bayesian networks from human reliability analysis data: A methodology and example model. Proc. Inst. Mech. Eng. Part O J. Risk Reliab. 2012, 226, 361–379. [Google Scholar] [CrossRef]
  25. Ghasemi, F.; Sari, M.H.M.; Yousefi, V.; Falsafi, R.; Tamosaitiene, J. Project Portfolio Risk Identification and Analysis, Considering Project Risk Interactions and Using Bayesian Networks. Sustainability 2018, 10, 1609. [Google Scholar] [CrossRef]
  26. Xia, N.N.; Zou, P.X.W.; Liu, X.; Wang, X.Q.; Zhu, R.H. A hybrid BN-HFACS model for predicting safety performance in construction projects. Saf. Sci. 2018, 101, 332–343. [Google Scholar] [CrossRef]
  27. Francis, R.A.; Guikema, S.D.; Henneman, L. Bayesian belief networks for predicting drinking water distribution system pipe breaks. Reliab. Eng. Syst. Saf. 2014, 130, 1–11. [Google Scholar] [CrossRef]
  28. Jitwasinkul, B.; Hadikusumo, B.H.W.; Memon, A.Q. A Bayesian Belief Network model of organizational factors for improving safe work behaviors in Thai construction industry. Saf. Sci. 2016, 82, 264–273. [Google Scholar] [CrossRef]
  29. Heckerman, D. A tutorial on learning with Bayesian networks. In Innovations in Bayesian networks; Springer: Berlin/Heidelberg, Germany, 2008; pp. 33–82. [Google Scholar]
  30. Dıez, F.J.; Galán, S.F. An efficient factorization for the noisy MAX. Int. J. Intell. Syst. 2003, 18, 165–177. [Google Scholar]
  31. Good, I.J. A causal calculus (I). Br. J. Philos. Sci. 1961, 11, 305–318. [Google Scholar] [CrossRef]
  32. Henrion, M. Some Practical Issues in Constructing Belief Networks. UAI 1987, 3, 161–173. [Google Scholar]
  33. Olsen, N.S. Coding ATC incident data using HFACS: Inter-coder consensus. Saf. Sci. 2011, 49, 1365–1370. [Google Scholar] [CrossRef]
  34. Teperi, A.M.; Leppanen, A.; Norros, L. Application of new human factors tool in an air traffic management organization. Saf. Sci. 2015, 73, 23–33. [Google Scholar] [CrossRef]
  35. Chang, Y.-H.; Wang, Y.-C. Significant human risk factors in aircraft maintenance technicians. Saf. Sci. 2010, 48, 54–62. [Google Scholar] [CrossRef]
  36. Pape, A.M.; Wiegmann, D.A.; Shappell, S.A. Air traffic control (ATC) related accidents and incidents: A human factors analysis. In Proceedings of the 11th International Symposium on Aviation Psychology, The Ohio State University, Columbus, OH, USA, 5–8 March 2001. [Google Scholar]
  37. Krastev, A. SKYbrary: a single entry point to aviation safety knowledge. Controller 2009, 48, 18–19. [Google Scholar]
  38. ICAO. Human Factors Training Manual, 1st ed.; International Civil Aviation Organization: Montreal, QC, Canada, 1998. [Google Scholar]
  39. Brooker, P. Experts, Bayesian Belief Networks, rare events and aviation risk estimates. Saf. Sci. 2011, 49, 1142–1155. [Google Scholar] [CrossRef]
  40. Wang, H.; Rish, I.; Ma, S. Using Sensitivity Analysis for Selective Parameter Update in Bayesian Network Learning; Association for the Advancement of Artificial Intelligence: Menlo Park, CA, USA, 2002. [Google Scholar]
  41. Miranda, A.T. Understanding human error in naval aviation mishaps. Hum. Factors 2018, 60, 763–777. [Google Scholar] [CrossRef] [PubMed]
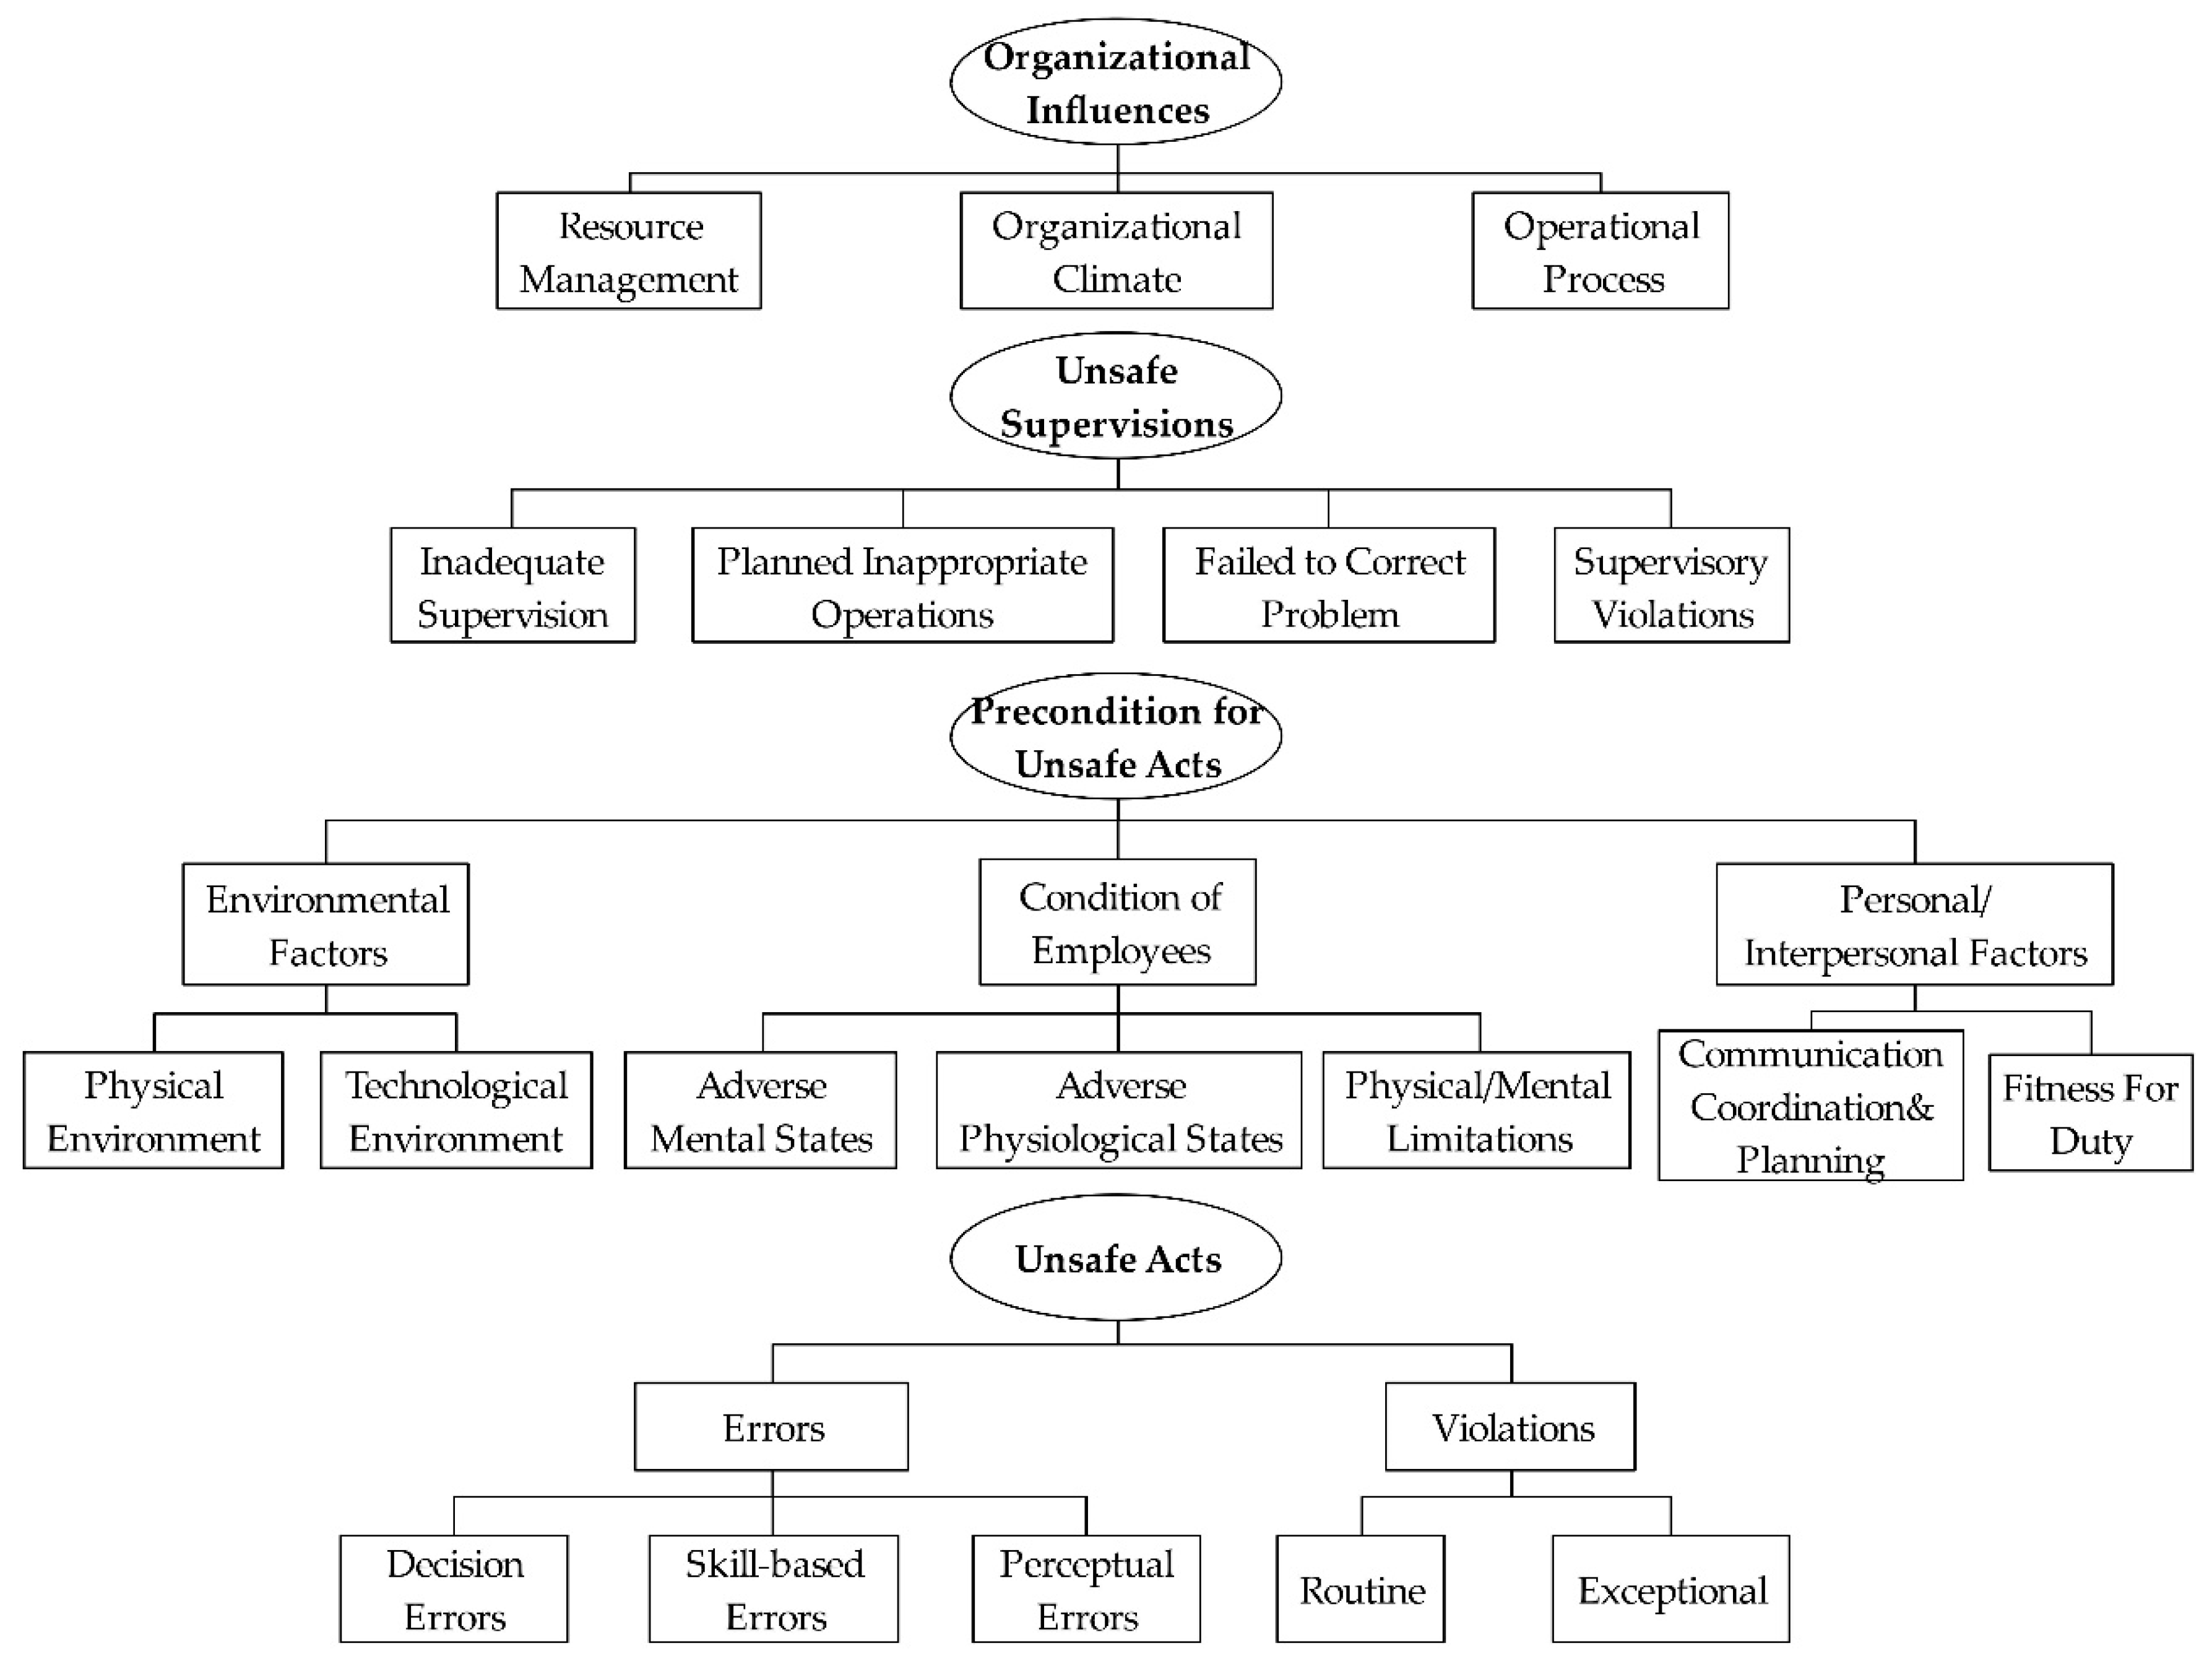
Figure 1. Overview of the human factors analysis and classification system (HFACS).
Applsci 09 05049 g001
Figure 2. (a) Directed acyclic graphs for Bayesian network; (b) simple Bayesian network model.
Applsci 09 05049 g002
Figure 3. Three basic structures of Bayesian networks. (a) Head to head; that is, given the condition of Z, the communication between X and Y is blocked, also known as head-to-head condition independence. It is obvious that variables X and Y have a common result Z. The joint probability can be expressed as P (X, Y, Z) = P(X) P(Y) P (Z|X, Y). (b) Head to tail. For a given condition of Y, the communication between X and Z is blocked, which is called head-to-tail condition independent. X, Y, and Z are connected serially, and the corresponding joint probability distribution is P (X, Y, Z) = P(X) P (Y|X) P(Z|Y). (c) Tail to tail. For a given condition of Z, the communication between X and Y is blocked, which is called tail-to-tail condition independence. Obviously, X and Y have a common cause. The joint probability is therefore calculated as P (X, Y, Z) = P (Z) P (X|Z) P (Y|Z).
Applsci 09 05049 g003
Figure 4. Research framework.
Applsci 09 05049 g004
Figure 5. The number of aviation accidents/incidents related to air traffic control (ATC) human factors from 1980 to 2019.
Applsci 09 05049 g005
Figure 6. Distribution of ATC human factor tags in aviation accidents/incidents from 1980 to 2019.
Applsci 09 05049 g006
Figure 7. ATC performance model.
Applsci 09 05049 g007
Figure 8. Marginal probability distribution by different levels.
Applsci 09 05049 g008
Figure 9. Posterior probabilities from Bayesian network (BN) inferences.
Applsci 09 05049 g009
Figure 10. Countermeasure preferences by ATC professionals.
Applsci 09 05049 g010
Figure 11. Sensitivity function for different human factors.
Applsci 09 05049 g011
Table 1. Factors description and its sources.
FactorsHFACS LevelDescriptionSource
Safety CultureOrganizational InfluenceIt includes the safety policy of the ATC department, safety education, as well as preventive measuresCAA (2003) [35]
Team Human Resource AllocationThe duty of the team members is not clear, the collocation is not reasonable, the work is not coordinated and so onN.S. Olsen [33]
Salary and RewardIt refers to salary and workload that do not match, employees that are not satisfied with the salary and rewardCAA (2002a) [35]
ATC CommunicationCommunication between controllers, including briefing on handoverShappell [36]
ATC/Flight Crew CooperationIt refers to the communication and coordination between ATCOs and crew membersSKYbrary [37]
ATC Software/HardwareIt includes ATC equipment layout, hardware failure, software interaction and so onSKYbrary [37]
Lack of Supervision PlanUnsafe SupervisionATC supervision is not in place, not comprehensive, not meticulous, etc.N.S. Olsen [33]
Poor Management DisciplineIt means the management style discipline/supervision effect are poorExperts’ opinions
Failed to Enforce RegulationsIt leads to an inadequate understanding of the rules by air traffic controllers and may raise safety risksZhou [6]
Failed to Correct Inappropriate ActsIt occurs when ATCO does not correct unsafe acts during controlN.S. Olsen [33]
Ineffective MonitoringIt includes monitoring flight path, aircraft systems, operational factors, crew/situational awareness.ICAO [38]
VisibilityPreconditions for Unsafe ActsPoor visibility due to weather or environmental conditions, unable to effectively monitor aircraft statusSKYbrary [37]
Air–Ground Communication InterferenceGround–to–air communication frequency is seriously disturbed by the external environmentExperts’ opinions
Mental StateMental, emotional or physical tension, strain or distressN.S. Olsen [33]
NoiseIt includes ambient noise from air traffic controllers, noise from crew members, or other noises in the radioExperts’ opinions
TrainingLack of training materials or inadequate trainingTeperi [34]
Physical FatigueFactors related to a lack of sleep or long work daysIATA (2006)
Nonstandard Flight Progress Strip Unsafe ActsAircraft call number, departure location, aircraft model and other information are not standardSKYbrary [37]
DistractionDistraction refers to the lack of concentration of air traffic controllers, which affects the normal work of ATCChang [35]
Use Non-standard TermsIt refers to the use of informal terms in air traffic control activitiesSKYbrary [37]
ATC clearance errorThere are two types: intended clearance given to wrong aircraft or wrong clearance given to intended aircraftSKYbrary [37]
Emergency MishandlingATCO do not have a good command of special situation handling procedures, poor psychological enduranceICAO [38]
Operation/Decision ErrorMis operation or decision-making by the ATCO in the control processN.S. Olsen [33]
ATCO MisspeakingIt refers to careless, absent-minded, insincere control work, resulting in instruction errorsICAO [38]
Procedural NoncomplianceNot following procedures: FARs, OEM standards, SOPs; It always results in a greater risk for the operationSKYbrary [37]
Table 2. Marginal probabilities for nodes ATC clearance error and distraction.
NodeATC Clearance ErrorDistraction
StateYesNoYesNo
Number489429113
Probability0.33800.66200.20420.7958
Table 3. Example of conditional probability table (CPT) inputting.
ATC Organizational ClimateATC/Crew CooperationCommunication Safety Culture
GoodNormalPoorGoodNormalPoorGoodNormalPoor
Good0.47760.261900.44680.309500.47620.31820
Normal0.34060.404800.34040.428600.33330.43180
Poor0.18180.333310.21280.261910.19050.251
Table 4. Respondents’ background.
ItemFrequencyPercent (%)
Gender
 Male2180.8
 Female519.2
Education
 Bachelor degree1557.7
 Master726.9
 Ph.D.415.4
Position
 Tower control623.1
 Approach control 830.8
 Area control830.8
 ATC expert (Dr., Prof.)415.3
Work experience
 <3311.5
 3−5830.8
 >51557.7
Control mode
 Procedural Control1453.8
 Radar Control830.8
Table 5. Computation results of changing states of influence factors.
No.NodeStateP (ATC = Good)StateP (ATC = Good)StateP (ATC = Good)Increased Percent
1Trainingpoor0.633 normal0.656good0.662 4.58%
2Physical Fatiguepoor0.645 normal0.657good0.661 2.48%
3Mental Statepoor0.647 normal0.658good0.662 2.32%
4Ineffective Monitoringyes0.654 -/no0.669 2.29%
5ATC Software/Hardwarepoor0.650 normal0.657good0.660 1.54%
6Failed to Enforce Regulationsyes0.652 -/no0.661 1.38%
7Failed to Correct Inappropriate Actsyes0.652 -/no0.661 1.38%
8ATC/Flight Crew Cooperationpoor0.652 normal0.658good0.661 1.38%
9ATC Communicationpoor0.652 normal0.659good0.661 1.38%
10Noisehigh0.652 normal0.658low0.661 1.38%
11Safety Culturepoor0.652 normal0.659good0.660 1.23%
12Air-Ground Communication Interferenceserious0.653 normal0.658slight0.661 1.23%
13Visibilitypoor0.653 normal0.658good0.661 1.23%
14Lack of Supervision Planyes0.653 -/no0.660 1.07%
15Team Human Resource Allocationpoor0.654 normal0.659good0.661 1.07%
16ATC clearance erroryes0.655 -/no0.662 1.07%
17Procedural Noncomplianceyes0.657 -/no0.664 1.07%
18Operation/Decision Erroryes0.654 -/no0.660 0.92%
19Poor Management Disciplineyes0.654 -/no0.660 0.92%
20Salary and Rewardlow0.655 middle0.659high0.661 0.92%
21ATCO Misspeakingyes0.655 -/no0.660 0.76%
22Emergency Mishandlingyes0.655 -/no0.660 0.76%
23Nonstandard Flight Progress Strip yes0.656 -/no0.660 0.61%
24Distractionyes0.656 -/no0.660 0.61%
25Use Nonstandard Termsyes0.657 -/no0.660 0.46%