Abstract
DNA nanotechnology offers the possibility to rationally design structures with emergent properties by precisely controlling their geometry and functionality. Here, we demonstrate a DNA-based plasmonic metamolecule that is capable of sensing human thrombin proteins. The chiral reconfigurability of a DNA origami structure carrying two gold nanorods was used to provide optical read-out of thrombin binding through changes in the displayed plasmonic circular dichroism. In our experiments, each arm of the structure was modified with one of two different thrombin-binding aptamers—thrombin-binding aptamer (TBA) and HD22—in such a way that a thrombin molecule could be sandwiched by the aptamers to lock the metamolecule in a state of defined chirality. Our structure exhibited a Kd of 1.4 nM, which was an order of magnitude lower than those of the individual aptamers. The increased sensitivity arose from the avidity gained by the cooperative binding of the two aptamers, which was also reflected by a Hill coefficient of 1.3 ± 0.3. As we further exploited the strong plasmonic circular dichroism (CD) signals of the metamolecule, our method allowed one-step, high sensitivity optical detection of human thrombin proteins in solution.
1. Introduction
Since its introduction in 1990, single-stranded DNA and RNA aptamers have become important targets of diagnostic and clinical studies because of their cost effectiveness, stability, affinity, and small size [1,2,3,4,5,6,7,8]. Compared to antibodies, aptamers are cheaper, less prone to stimulate unintended immunoresponses [9,10], readily modifiable, and easily programmable. Therefore, there have been numerous attempts to engineer aptamers to act as sensors that are capable of detecting their target molecules at low concentrations and in biologically relevant settings. For example, conformational changes of aptamers upon binding of target molecules have been detected with techniques like colorimetry [11,12], fluorescence spectroscopy [13], surface-enhanced Raman scattering (SERS) [14], and surface plasmon resonance [15,16]. The detection sensitivity observed in these studies ranges from 45 pM to 20 µM. To achieve sensitivity beyond the affinity of an individual aptamer, it is possible to further engineer the binding affinity of the aptamer itself [17,18] or combine the affinity of multiple aptamers binding to the same target at different locations [19]. To ensure detection of every molecular binding event, the initial signal can be amplified with secondary processes. By using specially designed nanostructures, the detection limit has been pushed towards the single-molecule level. Another method to increase overall sensitivity relies on gaining avidity by using two aptamers that bind to one target molecule but on different epitopes. Connecting two thrombin-binding aptamers with a single-stranded DNA linker increased binding affinity up to 10-fold, when compared to individual aptamers [20]. Here, we used the DNA origami technique [21,22,23,24,25,26,27,28,29,30], which enables us to build dynamic nanostructures with designed shape and modifications and, thus, to implement the two crucial aspects of signal enhancement and increased avidity in one device.
2. Materials and Methods
2.1. Design, Folding, and Purification of DNA Nanostructures
The 3D plasmonic metamolecules were designed as in the previous paper [25], with the only difference being that the staple strands “arm a” were replaced with “arm a thrombin-binding aptamer (TBA)”, “arm b (57 nt)” with “arm b2 HD22” and “arm b (86 nt)” with “arm b blank” (Table 1).

Table 1.
Sequence of modified staple strands.
For the structure folding, 100 nM of staple mix and 10 nM of the scaffold (p7650) were mixed in 1x tris-EDTA (TE) buffer (10 mM Tris, 1 mM EDTA, pH 8) supplemented with 20 mM MgCl2. Concentrations of aptamer staple strands with the aptamers were set to 1 µM during the folding, to ensure high incorporation yields. The folding mix was heat denatured at 65 °C, for 5 min, and slowly cooled down to 20 °C, over 16 h. After folding, the structures were separated from the excessive staple strands by electrophoresis in a 0.7% agarose gel, for 2 h, at 90 V. The visible band of the structure was cut and the structures were recovered by squeezing the gel piece. Purified structures were characterized by negative staining transmission electron microscopy (JEM-1011, JEOL, Tokyo, Japan).
2.2. Conjugation of Gold Nanorod
Gold nanorods (AuNRs) were conjugated with thiolated DNA oligonucleotides by the salt ageing. 50 μL of the 50 μM thiolated oligonucleotide (5′thiol TTT TTT TTT TTT TTT TTT T, Eurofingenomics, Ebersberg, Germany) were added to 1 ml of 1 OD AuNRs solution in 1x TE buffer supplemented with 0.05% SDS. Then, every 10 min, 1 M of the NaCl solution was added to the reaction with final concentrations of 12.5/25/50/75/100/150 mM NaCl. Then, every 30 min, 5 M of NaCl was added to the reaction with final concentrations of 200/300/400/500/600 mM NaCl. After conjugation, AuNRs were centrifuged for 10 min at 6000× g for purification. After taking out the supernatant, AuNRs were re-suspended in 1x TE buffer. This purification step was repeated three times. Purified AuNRs were characterized by measuring their absorbance spectra and taking the TEM image.
2.3. Preparing and Measuring 3D Plasmonic Metamolecule
Conjugated AuNRs were mixed with purified DNA nanostructures at a molar ratio of 10:1 in 1x tris-acetate-EDTA (TAE) buffer (40 mM Tris, 20 mM Acetate, and 1 mM EDTA at pH 8.0) supplemented with 11 mM MgCl2. As the structure has two binding sites for AuNRs, this resulted in a 5:1 ratio for AuNRs over their binding sites. After overnight incubation, AuNR conjugated plasmonic metamolecules were purified from excessive AuNRs by two hours of gel electrophoresis in 0.7% agarose gel at 90 V. After purification, the concentration of the metamolecules was determined by measuring the absorbance at the longitudinal surface plasmon wavelength (700 nm) of AuNRs and comparing the result with that of the unconjugated AuNRs. (Nanodrop, Thermo Fisher Scientific, Waltham, MA, USA). Purified metamolecules were diluted to 100 pM concentration in 1x TAE buffer supplemented with 11 mM MgCl2 for the circular dichroism (CD) measurement.
3. Results
For the detection scheme, we chose plasmonic circular dichroism (CD) [31]. In CD measurements, the difference in absorption for right-handed and left-handed polarized light is often used to detect 3D structure and conformational changes of biomolecules like proteins [32] and DNA [33,34]. Biomolecules exhibit CD in the ultraviolet region of the spectrum and usually none in the visible range. Recently developed plasmonic metamolecules [25] in contrast, generate CD at visible wavelengths, which enables detection of plasmonic CD and conformational changes of the metamolecules in an undisturbed optical region. This concept of high-sensitivity detection of RNA molecules [35] and detection of small molecules like cocaine and ATP [36] have been exploited by our research group and by other authors, in recent years. Here, we extended this approach for the detection of proteins.
In our experiments, two thrombin-binding aptamers each targeting two different epitopes of human α-thrombin were placed on a reconfigurable 3D plasmonic metamolecule [25] such that upon binding of the target molecule, the metamolecule switches its chiral state leading to a change in the circular dichroism (CD) signal. Our X-shaped 3D plasmonic metamolecule is based on two 10-helix DNA bundles connected in the center by two single-stranded DNA linkers (Figure 1a and Figure S1) [25]. Both bundles, or arms, carry a gold nanorod (AuNR) at the top and bottom, respectively. After assembly, the structure is initially in its “open” state in which its arms can freely rotate around their center (Figure 1b, open state). Two thrombin aptamers—thrombin-binding aptamer (TBA) [2] and HD22 [37] were attached at one end of each arm so that the entire structure can switch into the ‘locked’ state by sandwiching one thrombin molecule (Figure 1b, locked state). By design, this state is right-handed and thus exhibits a recognizable CD signal at the plasmon resonance of the metamolecule. The aspect ratio of the AuNR (20 × 60 nm) was chosen to exhibit a maximum response around 700 nm. Purified and negative-stained DNA structures conjugated with two AuNRs were imaged with transmission electron microscopy (TEM) (Figure 1a, inset and Figure S2).
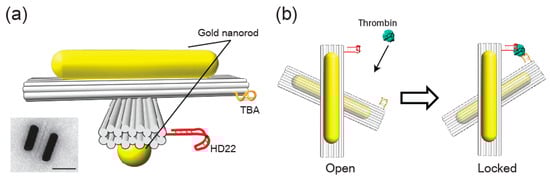
Figure 1.
Scheme for human α-thrombin sensing with the plasmonic metamolecule. (a) The structure consists of two 10-helix bundles each carrying two a gold nanorods (AuNRs) at the top and bottom respectively. The arms are connected by a single-stranded DNA linker (not shown) and are modified at one of their ends with one thrombin aptamer each—thrombin-binding aptamer (TBA) and HD22. Inset: TEM image of an assembled structure lying on its side (Scale bar: 50 nm). (b) In the absence of thrombin, the structure is in its ‘open’ state. In the presence of thrombin, the two aptamers can sandwich one target molecule to fix the structure in its ‘locked’ state with defined right-handed chirality.
CD spectra of the metamolecules at a concentration of 100 pM and in the absence of human α-thrombin were measured first (Figure 2a, black line). These spectra show a characteristic peak-dip “bisignate” shape with the first peak at 705 nm (Figure 2a). This implies that the metamolecules in their relaxed (open) state are on average slightly left-handed. We attribute this to the additional electrostatic and steric repulsion originating from the two aptamers at two ends of the arms. Indeed, if the aptamers are attached onto the mirrored positions, the CD signal of the relaxed structures is right-handed (Figure S3). When thrombin was added to the solution (10 nM) the CD signal switched to a dip-peak shape of higher intensity, with the first dip at 693 nm (Figure 2a). Now, the metamolecules are in their locked right-handed state with thrombin molecules sandwiched by the two aptamers. After confirming that the presence of thrombin switches the CD signal of our metamolecules, we measured the gradual transition of the CD signal by ramping up the protein concentration from 10 pM to 1 µM (Figure 2). Notably, the change of the CD signal was already noticeable at thrombin concentrations as low as 100 pM. The intensity then steadily increased up to 10 nM where it did not plateau but instead fell again (Figure 2a, red arrow with 1 µM thrombin) as soon as the concentration of the thrombin rose above the Kd values of the individual aptamers (20.2 nM and 3.5 nM for TBA and HD22, respectively). [20] We inferred that above these concentrations, two thrombin molecules could separately bind to each aptamer and thereby could unlock the structure. Up to these concentrations, the normalized response showed typical sigmoidal behavior and we were able to fit the data points up to 10 nM, with a Hill equation yielding a dissociation constant (Kd) of 1.4 nM and a Hill coefficient of 1.3 ± 0.3 (cf. Table S1). As this hill coefficient was similar to that of the engineered multimeric ligands’ [38], we concluded that the reaction showed moderate cooperativity from multiple binding sites as expected from the working principle of our metamolecule. To further confirm this, we also analyzed our metamolecule with the thrombin aptamers in the mirrored positions (Figure S3). Indeed, this version of the metamolecule showed the same hill coefficient (1.3 ± 0.1). Finally, to confirm that our metamolecule specifically only detected thrombin, we added 100 nM of bovine serum albumin (BSA) to the metamolecules, which led to no response from our sensor (Figure S4).
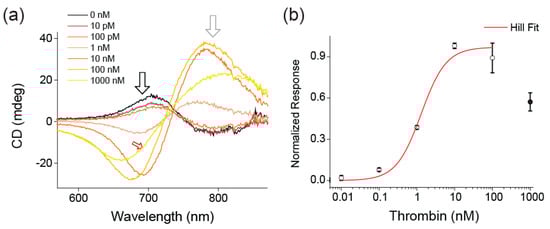
Figure 2.
Detection of thrombin with plasmonic circular dichroism (CD) from the metamolecules. (a) CD spectrum of 100 pM metamolecule in the presence of different concentrations of thrombin. As the concentration of thrombin increases, the CD spectrum switches from right-handed (black line) to left-handed (red line). At thrombin concentrations above 100 nM (1000 nM, red arrow), the signal strength decreases as the thrombin molecules bind to each arm of the metamolecule rather than being sandwiched between two arms. To reduce the noise, all signals were measured with 10 nm spectral windows and the difference between two frequency windows (black and grey arrows) was calculated. (b) Normalized response-concentration data (black circles) with Hill equation fit (red line). The Hill coefficient obtained through the fit was 1.3 ± 0.3 and Kd = 1.4 nM. The normalized response values were obtained by subtracting the values at the extremes (black and grey arrows of Figure 2a) and normalizing it by the value at 10 nM.
4. Discussion
We demonstrated that our plasmonic metamolecule reliably detected human alpha thrombin in solution at concentrations of 100 pM and above. This detection sensitivity was higher than several conventional detection methods, including DNAzyme-based colometry, carbon nanotube sensing, and capillary chromatography which operated reliably at nanomolar concentrations and above [39,40,41]. The sensitivity was also similar to that of previously reported high sensitivity methods, based on colorimetric assays [42], FRET assays [43], rolling circle amplification-based detection [44], or to commercially available ELISA kits. The high sensitivity in our experiments could be attributed to the strong plasmonic CD of our detection device that additionally operated in a frequency window with no naturally occurring (background) CD and to the high avidity working principle leading to cooperative binding. Our high sensitivity detection worked all the same when the position of the aptamers on the DNA origami structure was changed (Figure S3), such that the opposite CD response was generated. This proved the robustness of our method. In this context, there was room for improvement of the sensitivity, for example, by placing multiple copies of the thrombin aptamers on each arm of the structure. Additionally, there is a possibility for our structure to work in physiological buffer conditions, especially in the absence of magnesium chelator EDTA [45].
Supplementary Materials
The following are available online at https://www.mdpi.com/2076-3417/9/15/3006/s1. Figure S1. Strand routing diagram of our X-shaped 3D plasmonic metamolecule. Figure S2. Gel purification and characterization of AuNR conjugated metamolecules. Table S1. Parameters for the Hill equation fit of CD response curve against thrombin. Figure S3. Thrombin detection with metamolecule that locks with left-handed chirality. Figure S4. CD spectra of metamolecules in the presence of thrombin or BSA.
Author Contributions
W.B. and T.L. designed the experiment. W.B. and T.F. performed the experiment. W.B. and T.L. wrote the manuscript.
Funding
W.B., T.F., and T.L acknowledge the support from the European Commission through the ERC grant agreement no. 336440, ORCA, and the DFG, through the SFB1032 (A6).
Acknowledgments
W.B. acknowledges Amelie Heuer-Jungemann for providing the gold nanorods.
Conflicts of Interest
The authors declare no conflict of interest.
References
- Ellington, A.D.; Szostak, J.W. In vitro selection of RNA molecules that bind specific ligands. Nature 1990, 346, 818–822. [Google Scholar] [CrossRef] [PubMed]
- Bock, L.C.; Griffin, L.C.; Latham, J.A.; Vermaas, E.H.; Toole, J.J. Selection of single-stranded DNA molecules that bind and inhibit human thrombin. Nature 1992, 355, 564–566. [Google Scholar] [CrossRef] [PubMed]
- Ellington, A.D.; Szostak, J.W. Selection in vitro of single-stranded DNA molecules that fold into specific ligand-binding structures. Nature 1992, 355, 850–852. [Google Scholar] [CrossRef] [PubMed]
- Pan, T.; Uhlenbeck, O.C. A small metalloribozyme with a two-step mechanism. Nature 1992, 358, 560–563. [Google Scholar] [CrossRef] [PubMed]
- Gold, L.; Polisky, B.; Uhlenbeck, O.; Yarus, M. Diversity of oligonucleotide functions. Annu. Rev. Biochem. 1995, 64, 763–797. [Google Scholar] [CrossRef] [PubMed]
- Wilson, D.S.; Szostak, J.W. In vitro selection of functional nucleic acids. Annu. Rev. Biochem. 1999, 68, 611–647. [Google Scholar] [CrossRef]
- Nimjee, S.M.; Rusconi, C.P.; Sullenger, B.A. Aptamers: An emerging class of therapeutics. Annu. Rev. Med. 2005, 56, 555–583. [Google Scholar] [CrossRef]
- Bunka, D.H.; Stockley, P.G. Aptamers come of age—At last. Nat. Rev. Microbiol. 2006, 4, 588–596. [Google Scholar] [CrossRef]
- Eyetech Study Group. Preclinical and phase 1A clinical evaluation of an anti-VEGF pegylated aptamer (EYE001) for the treatment of exudative age-related macular degeneration. Retina 2002, 22, 143–152. [Google Scholar] [CrossRef]
- Eyetech Study Group. Anti-vascular endothelial growth factor therapy for subfoveal choroidal neovascularization secondary to age-related macular degeneration: Phase II study results. Ophthalmology 2003, 110, 979–986. [Google Scholar] [CrossRef]
- Liu, J.; Lu, Y. A colorimetric lead biosensor using DNAzyme-directed assembly of gold nanoparticles. J. Am. Chem. Soc. 2003, 125, 6642–6643. [Google Scholar] [CrossRef] [PubMed]
- Liu, J.; Lu, Y. Fast colorimetric sensing of adenosine and cocaine based on a general sensor design involving aptamers and nanoparticles. Angew. Chem. Int. Ed. Engl. 2005, 45, 90–94. [Google Scholar] [CrossRef] [PubMed]
- Liu, J.; Brown, A.K.; Meng, X.; Cropek, D.M.; Istok, J.D.; Watson, D.B.; Lu, Y. A catalytic beacon sensor for uranium with parts-per-trillion sensitivity and millionfold selectivity. Proc. Natl. Acad. Sci. USA 2007, 104, 2056–2061. [Google Scholar] [CrossRef] [PubMed]
- Cho, H.; Baker, B.R.; Wachsmann-Hogiu, S.; Pagba, C.V.; Laurence, T.A.; Lane, S.M.; Lee, L.P.; Tok, J.B. Aptamer-based SERRS sensor for thrombin detection. Nano Lett. 2008, 8, 4386–4390. [Google Scholar] [CrossRef] [PubMed]
- Pavlov, V.; Xiao, Y.; Shlyahovsky, B.; Willner, I. Aptamer-functionalized Au nanoparticles for the amplified optical detection of thrombin. J. Am. Chem. Soc. 2004, 126, 11768–11769. [Google Scholar] [CrossRef] [PubMed]
- Tombelli, S.; Minunni, M.; Luzi, E.; Mascini, M. Aptamer-based biosensors for the detection of HIV-1 Tat protein. Bioelectrochemistry 2005, 67, 135–141. [Google Scholar] [CrossRef] [PubMed]
- Davis, J.H.; Szostak, J.W. Isolation of high-affinity GTP aptamers from partially structured RNA libraries. Proc. Natl. Acad. Sci. USA 2002, 99, 11616–11621. [Google Scholar] [CrossRef]
- Hasegawa, H.; Savory, N.; Abe, K.; Ikebukuro, K. Methods for Improving Aptamer Binding Affinity. Molecules 2016, 21, 421. [Google Scholar] [CrossRef]
- Rinker, S.; Ke, Y.; Liu, Y.; Chhabra, R.; Yan, H. Self-assembled DNA nanostructures for distance-dependent multivalent ligand-protein binding. Nat. Nanotechnol. 2008, 3, 418–422. [Google Scholar] [CrossRef] [PubMed]
- Hasegawa, H.; Taira, K.I.; Sode, K.; Ikebukuro, K. Improvement of Aptamer Affinity by Dimerization. Sensors (Basel) 2008, 8, 1090–1098. [Google Scholar] [CrossRef]
- Rothemund, P.W. Folding DNA to create nanoscale shapes and patterns. Nature 2006, 440, 297–302. [Google Scholar] [CrossRef] [PubMed]
- Dietz, H.; Douglas, S.M.; Shih, W.M. Folding DNA into twisted and curved nanoscale shapes. Science 2009, 325, 725–730. [Google Scholar] [CrossRef] [PubMed]
- Castro, C.E.; Kilchherr, F.; Kim, D.N.; Shiao, E.L.; Wauer, T.; Wortmann, P.; Bathe, M.; Dietz, H. A primer to scaffolded DNA origami. Nat. Methods 2011, 8, 221–229. [Google Scholar] [CrossRef] [PubMed]
- Han, D.; Pal, S.; Nangreave, J.; Deng, Z.; Liu, Y.; Yan, H. DNA origami with complex curvatures in three-dimensional space. Science 2011, 332, 342–346. [Google Scholar] [CrossRef] [PubMed]
- Kuzyk, A.; Schreiber, R.; Zhang, H.; Govorov, A.O.; Liedl, T.; Liu, N. Reconfigurable 3D plasmonic metamolecules. Nat. Mater. 2014, 13, 862–866. [Google Scholar] [CrossRef] [PubMed]
- Nickels, P.C.; Wunsch, B.; Holzmeister, P.; Bae, W.; Kneer, L.M.; Grohmann, D.; Tinnefeld, P.; Liedl, T. Molecular force spectroscopy with a DNA origami-based nanoscopic force clamp. Science 2016, 354, 305–307. [Google Scholar] [CrossRef]
- Ijäs, H.; Nummelin, S.; Shen, B.; Kostiainen, M.A.; Linko, V. Dynamic DNA Origami Devices: From Strand-Displacement Reactions to External-Stimuli Responsive Systems. Int. J. Mol. Sci. 2018, 19, 2114. [Google Scholar] [CrossRef] [PubMed]
- Endo, M.; Sugiyama, H. DNA Origami Nanomachines. Molecules 2018, 23, 1766. [Google Scholar] [CrossRef]
- Bae, W.; Kocabey, S.; Liedl, T. DNA nanostructures in vitro, in vivo and on membranes. Nano Today 2019, 26, 98–107. [Google Scholar] [CrossRef]
- Kuzyk, A.; Jungmann, R.; Acuna, G.P.; Liu, N. DNA Origami Route for Nanophotonics. ACS Photonics 2018, 5, 1151–1163. [Google Scholar] [CrossRef]
- Govorov, A.O.; Fan, Z.; Hernandez, P.; Slocik, J.M.; Naik, R.R. Theory of circular dichroism of nanomaterials comprising chiral molecules and nanocrystals: Plasmon enhancement, dipole interactions, and dielectric effects. Nano Lett. 2010, 10, 1374–1382. [Google Scholar] [CrossRef] [PubMed]
- Greenfield, N.J. Using circular dichroism spectra to estimate protein secondary structure. Nat. Protoc. 2006, 1, 2876–2890. [Google Scholar] [CrossRef] [PubMed]
- Kypr, J.; Kejnovska, I.; Renciuk, D.; Vorlickova, M. Circular dichroism and conformational polymorphism of DNA. Nucleic Acids Res. 2009, 37, 1713–1725. [Google Scholar] [CrossRef] [PubMed]
- Martin, S.R.; Schilstra, M.J. Circular dichroism and its application to the study of biomolecules. Methods Cell Biol. 2008, 84, 263–293. [Google Scholar] [CrossRef] [PubMed]
- Funck, T.; Nicoli, F.; Kuzyk, A.; Liedl, T. Sensing Picomolar Concentrations of RNA Using Switchable Plasmonic Chirality. Angew. Chem. Int. Ed. Engl. 2018, 57, 13495–13498. [Google Scholar] [CrossRef] [PubMed]
- Zhou, C.; Xin, L.; Duan, X.; Urban, M.J.; Liu, N. Dynamic Plasmonic System That Responds to Thermal and Aptamer-Target Regulations. Nano Lett. 2018, 18, 7395–7399. [Google Scholar] [CrossRef] [PubMed]
- Tasset, D.M.; Kubik, M.F.; Steiner, W. Oligonucleotide inhibitors of human thrombin that bind distinct epitopes. J. Mol. Biol. 1997, 272, 688–698. [Google Scholar] [CrossRef] [PubMed]
- Vagner, J.; Handl, H.L.; Gillies, R.J.; Hruby, V.J. Novel targeting strategy based on multimeric ligands for drug delivery and molecular imaging: Homooligomers of alpha-MSH. Bioorg. Med. Chem. Lett. 2004, 14, 211–215. [Google Scholar] [CrossRef] [PubMed]
- Li, T.; Wang, E.; Dong, S. G-quadruplex-based DNAzyme for facile colorimetric detection of thrombin. Chem. Commun. (Camb.) 2008, 31, 3654–3656. [Google Scholar] [CrossRef]
- Yang, R.; Tang, Z.; Yan, J.; Kang, H.; Kim, Y.; Zhu, Z.; Tan, W. Noncovalent assembly of carbon nanotubes and single-stranded DNA: An effective sensing platform for probing biomolecular interactions. Anal. Chem. 2008, 80, 7408–7413. [Google Scholar] [CrossRef]
- Zhao, Q.; Li, X.F.; Le, X.C. Aptamer-modified monolithic capillary chromatography for protein separation and detection. Anal. Chem. 2008, 80, 3915–3920. [Google Scholar] [CrossRef] [PubMed]
- Li, J.; Fu, H.E.; Wu, L.J.; Zheng, A.X.; Chen, G.N.; Yang, H.H. General colorimetric detection of proteins and small molecules based on cyclic enzymatic signal amplification and hairpin aptamer probe. Anal. Chem. 2012, 84, 5309–5315. [Google Scholar] [CrossRef] [PubMed]
- Heyduk, E.; Heyduk, T. Nucleic acid-based fluorescence sensors for detecting proteins. Anal. Chem. 2005, 77, 1147–1156. [Google Scholar] [CrossRef] [PubMed]
- Di Giusto, D.A.; Wlassoff, W.A.; Gooding, J.J.; Messerle, B.A.; King, G.C. Proximity extension of circular DNA aptamers with real-time protein detection. Nucleic Acids Res. 2005, 33, 64. [Google Scholar] [CrossRef] [PubMed]
- Kielar, C.; Xin, Y.; Shen, B.; Kostiainen, M.A.; Grundmeier, G.; Linko, V.; Keller, A. On the Stability of DNA Origami Nanostructures in Low-Magnesium Buffers. Angew. Chem. Int. Ed. Engl. 2018, 57, 9470–9474. [Google Scholar] [CrossRef] [PubMed]
© 2019 by the authors. Licensee MDPI, Basel, Switzerland. This article is an open access article distributed under the terms and conditions of the Creative Commons Attribution (CC BY) license (http://creativecommons.org/licenses/by/4.0/).