Article

Tempcore Process Simulator to Analyze Microstructural Evolution of Quenched and Tempered Rebar

1
R&D Center, Dongkuk Steel, 70 Geonposaneop-ro, 3214beon-gil, Nam-gu, Pohang, Gyeongsangbuk-do, Korea
2
Department of Materials Science and Engineering, Pohang University of Science and Technology (POSTECH), Pohang 37673, Korea
3
School of Mechanical Engineering, Pusan National University, 30 Jangjeon-dong, Geumjeong-gu, Busan 46241, Korea
*
Author to whom correspondence should be addressed.
Appl. Sci. 2019, 9(14), 2938; https://doi.org/10.3390/app9142938
Submission received: 30 June 2019 / Revised: 21 July 2019 / Accepted: 22 July 2019 / Published: 23 July 2019
(This article belongs to the Special Issue Extreme Sciences and Engineering)

Abstract

:

Featured Application

Proposed process simulator can be widely applied to parameter design of industrial Tempcore process with reduced cost and time.

Abstract

Tempcore process simulator (TPS) has been developed in this study to analyze the microstructural evolution of quenched and tempered rebar. There has been an increasing need to relate the complex microstructures to the resulting properties of quenched and tempered rebar. However, information on such relationships typically requires precise thermal histories imposed on the workpiece. Therefore, TPS, capable of simulating the Tempcore process, has been developed to produce high-fidelity data. TPS mainly consists of a vacuum induction furnace, pilot rolling mill, box furnace, and cooling unit to simulate shop floor operations. A series of experimental tests were successfully carried out with various parameters, such as reheating temperature, water flow, water pressure, and cooling time. The effects of chemical compositions and cooling time on the microstructural evolution and mechanical properties of quenched and tempered rebar have been analyzed to validate the performance of TPS. The results show that TPS can simulate the Tempcore process with a high degree of fidelity and reliability.

Graphical Abstract

1. Introduction

Thermomechanical processing is a metallurgical process that combines plastic deformation process with thermal processes like heat-treatment, water quenching, heating, and cooling at various rates into a single process. Due to wide range of applications, many studies dealing the effect of thermomechanical processing on metallurgical and mechanical properties have been carried out [1,2,3]. The reinforced steel bars can be produced by the thermomechanical processing, microalloying with V or Nb, and work-hardening etc. [4]. Tempcore is one of thermomechanical processes developed by CRM [5,6] to produce high yield strength weldable rebars from mild steel without the addition of microalloying elements. The strength of rebar originates from the formation of a surface layer of quenched and tempered martensite that surrounds a core made of ferrite and pearlite. Such a composite structure is the result of processing hot rolled rods through water coolers that rapidly cool the surface. The martensitic structure is tempered by the heat from the core of the rod, which transforms into ferrite and pearlite while the rod is in the cooling beds [7,8]. Tempcore rebars are characterized by high mechanical properties and excellent weldability, ductility, and bendability. Tempcore rebar can be problematic due to its heterogeneous structure. It has been reported that the Tempcore rebars presented the more stable behavior up to temperatures of 500 °C, while the microalloyed steel, although it presented very satisfactory tensile properties, displayed low impact toughness due to coarsening of vanadium carbides [4]. Figure 1 schematically shows the temperature profile and microstructural evolution in Tempcore treated rebars [9].
The Tempcore process significantly increases both tensile strength and ductility. The economic advantages of this process are huge in comparison with processes that require alloying elements or further metal working to improve mechanical properties [4].
There has been an increasing need to relate the microstructures to the resulting properties of quenched and tempered rebar [10,11,12]. However, information on such relationships typically requires precise thermal histories. On the viewpoint of product quality and operational performance, the accurate measurement and control of temperature during high temperature processes are very important. A number of attempts have been made to measure the temperature during the thermal process, but accurate thermal histories are hard to obtain due to the complexity of high temperature process and harsh conditions that exist both in the tool and workpiece [13,14,15]. Furthermore, the manufacturing process for the rebar does have an effect on the residual yield and tensile strength, but the quantitative evaluation of process-induced stress-strain relationship is not easy [16,17,18]. Therefore, many studies have been performed to develop thermal models that can accurately predict the temperature during thermal processing [19,20,21,22,23].
While a shop floor test can provide very exact and desirable thermal history, it is not easy to achieve due to the busy production schedule. Furthermore, because the average material amount per heat exceeds 100 tons, shop floor testing requires large investment of both time and capital.
Therefore, there would be a significant advantage if cost-effective methods capable of producing high-fidelity data could be developed. Regarding thermomechanical processing, one way to reduce the time and cost of developing large variations in thermal histories is through the use of well-established thermomechanical simulators (e.g., the GleebleTM, New York, NY, USA) and an electro-thermal mechanical tester (Instron’s ETMTTM, Norwood, OH, USA) [24,25]. However, there is a risk associated with sub-scale mechanical tests to determine bulk mechanical properties. The reliability of sub-scale thermomechanical testing decreases significantly due to reduced similarities, and the rapid cooling necessary for the Tempcore process is hard to achieve by conventional water quenching. Figure 2 compared hardness profiles of rebars after shop floor Tempcore treatment and 5 s water quenching from 1000 °C. As shown in the figure, the tempered martensite rim shown in the Tempcored rebar was not obtained from conventional water quenching.
The mechanical properties of Tempcore rebar have been the subject of several studies. The impact toughness [26], fatigue behavior [27], weldability for seismic application [28], and behavior at elevated temperature [29,30,31] have been studied. Nevertheless, data on practical experimental simulation is very scarce even though this is a very important factor to save time and cost.
Hence, this paper focuses on the development of a TPS capable of precise simulation of shop floor operations and of producing high-fidelity Tempcore data. TPS mainly consists of a vacuum induction furnace, pilot rolling mill, box furnace, and cooling unit to simulate shop floor operations. The operational parameters that affect the Tempcore process are the chemical composition of the bar, the temperature at the end of rolling, and the cooling rate. The aim of this work is to develop TPS and show how the mechanical properties of the material are related to the different operational parameters. Therefore, a series of experimental tests were successfully carried out in TPS with various parameters, such as reheating temperature, water flow, water pressure, and cooling time to study their effects on microstructural evolution and the mechanical properties of quenched and tempered rebar.

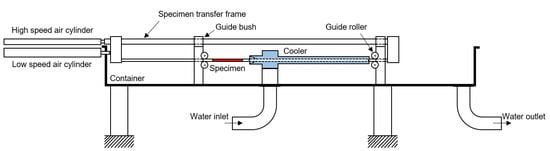
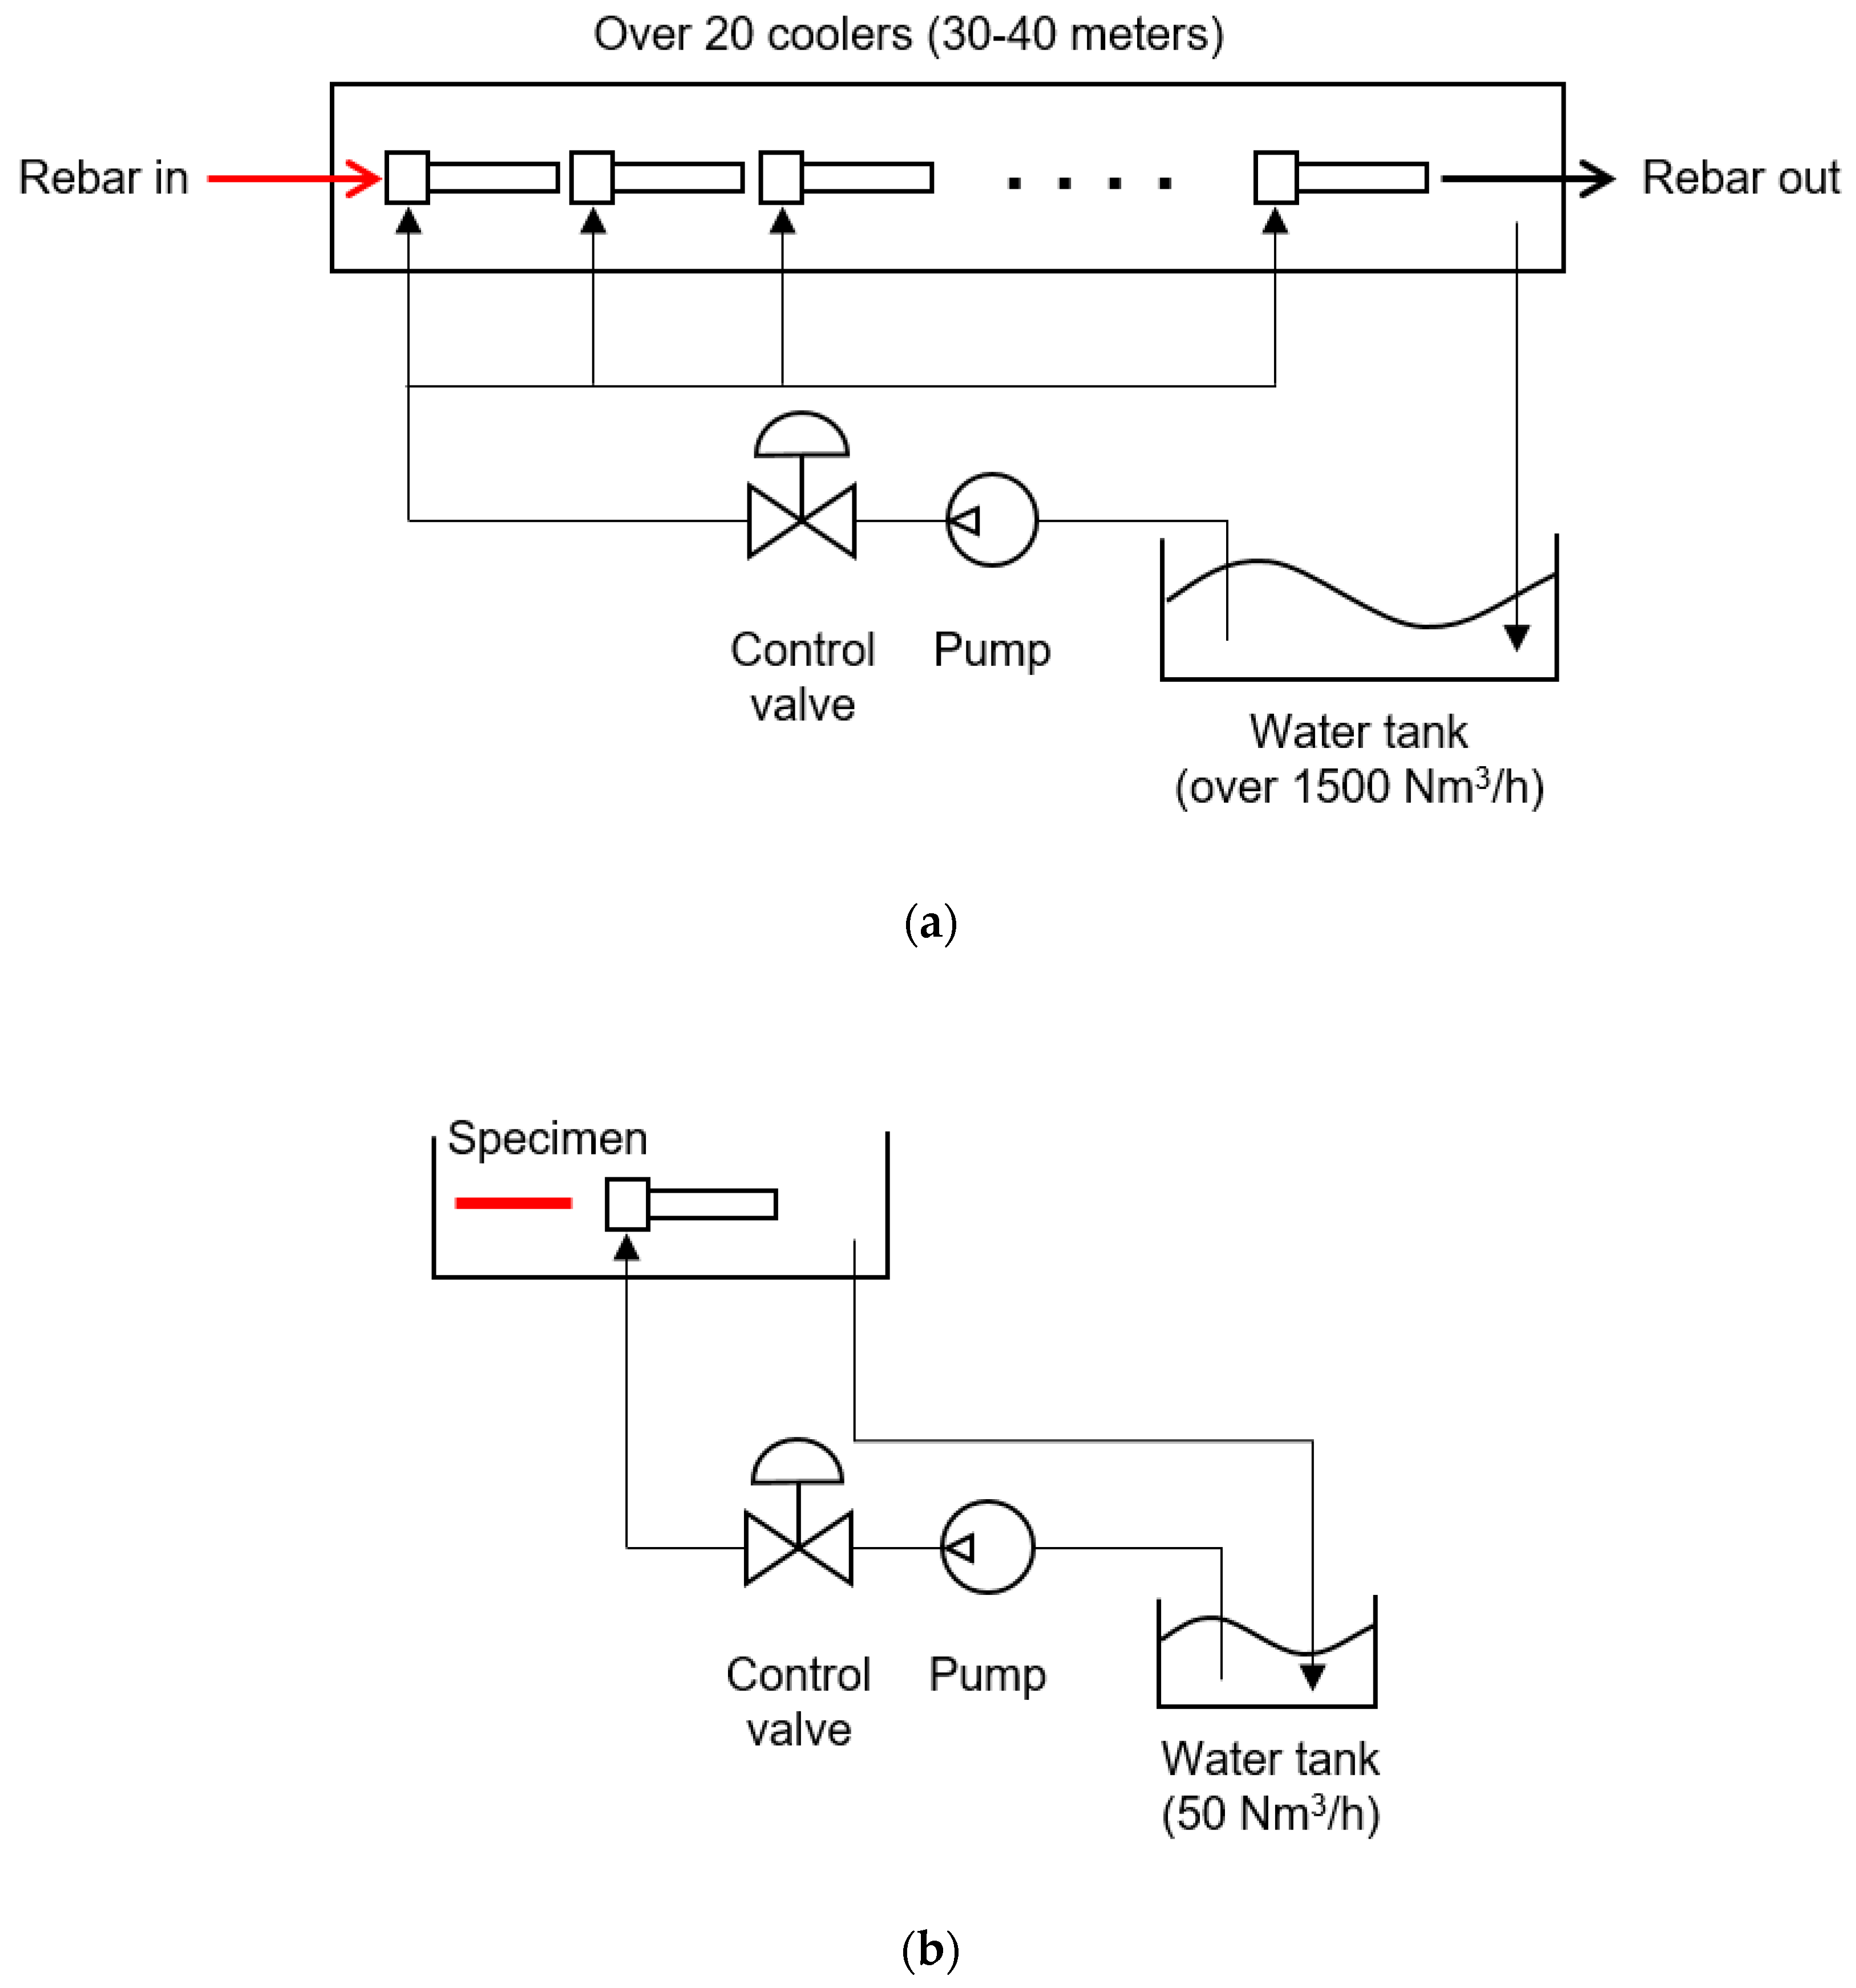
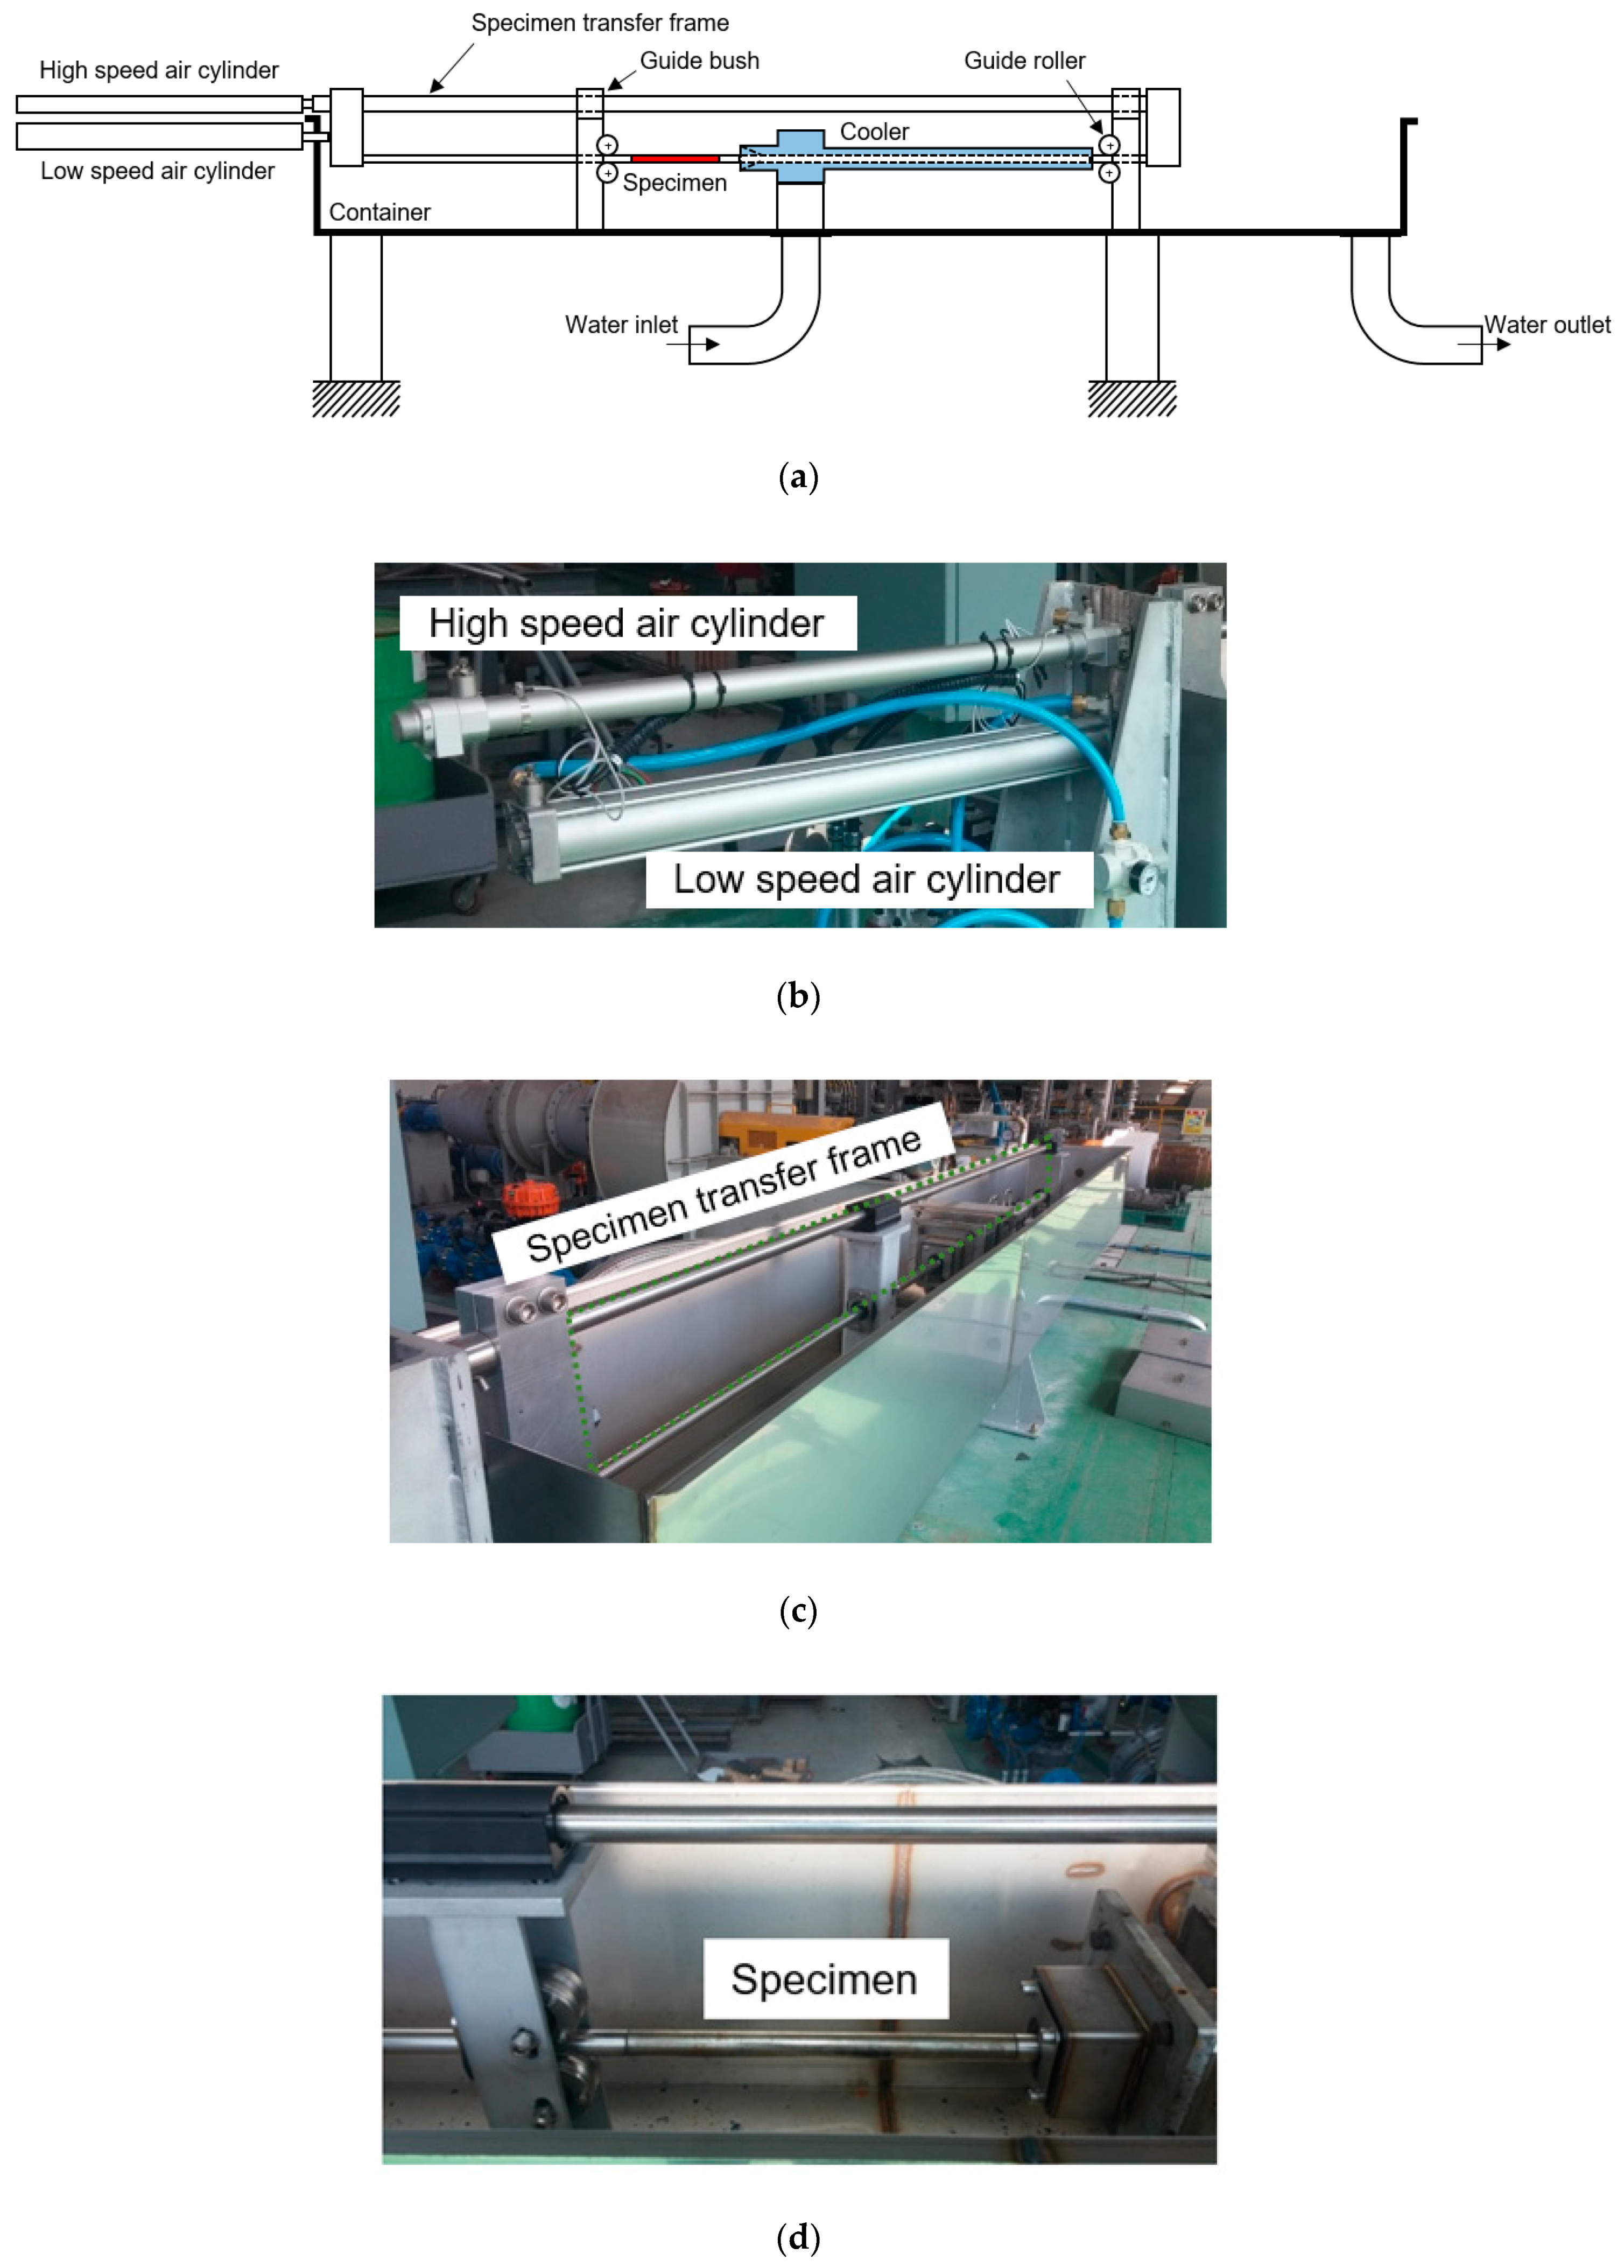
2. Development of Tempcore Process Simulator

As TPS has been designed to simulate shop floor operation, a simulator capable of producing high-fidelity data that shows strong similarity with shop floor operational data has been developed in this study.
Figure 3 shows an industrial Tempcore production line. The length of the Tempcore production line is about 40 m, and more than 20 coolers are installed. Water spraying is performed under condition of a water pressure of 10–12 bar and a water flow rate of 1500 m3/h so as to cool the steel bars to martensite-forming temperature.
TPS mainly consists of a vacuum induction furnace, pilot rolling mill, box furnace, and cooling unit, as shown in Figure 4. The 125 kW/3 kHz vacuum induction furnace has a capacity of 50 kg/charge, maximum heating temperature of 1700 °C, and vacuum level of 8×10⁻³ Torr. The two-high rolling mill equipped with two 630kW motors and 720 mm roll diameter has a maximum load capacity of 600 tons and maximum rolling speed of 150 mpm. The dimensions of the heating chamber are 600(W) × 600(H) × 800(D). As a heating source, KANTHAL®(Hallstahammar, Sweden) A-1 has been used. The maximum heating temperature is 1100 °C, and Ar has been used as an environmental gas.
The layouts of the Tempcore process for the production line and process simulator are compared in Figure 5. The specifications of the subsystems of TPS have been determined to generate data that show strong similarity with shop floor operational data.
To fabricate test specimens, a 50 kg ingot having 120 mm × 120 mm cross-section has been heated to 1150 °C in a vacuum induction furnace and plate rolled to 28 mm thickness. Then, square bars are cut from the as-rolled plate, and specimens having a 25 mm diameter and 360 mm length were machined from square bars by lathe. Figure 6 shows the sequence of fabrication of the test specimen.
Figure 7 shows the main features of the system. Figure 7a shows the schematic drawing of TPS. Figure 7b shows that the dual cylinder consists of a high-speed air cylinder and a low speed air cylinder. The cooling time can be adjusted by a speed control valve. Figure 7c shows the specimen transfer frame used to ensure circumferentially uniform temperature. Figure 7d shows the specimen clamping device. A screw-type specimen clamping device has been designed that can reduce temperature drop by fast clamping. The main specifications of TPS are shown in Table 1.
For the metallographic examination, the specimen was cut from the predetermined position in tested rebar. Microstructure was observed by an optical microscope after mechanical polishing with alumina powder of 0.5 micron in size and etching with 3% nital for 5 s. Vickers micro-hardness test has also been performed from the center to outer surface of the rebar with 10 kg load.

3. Results and Discussion

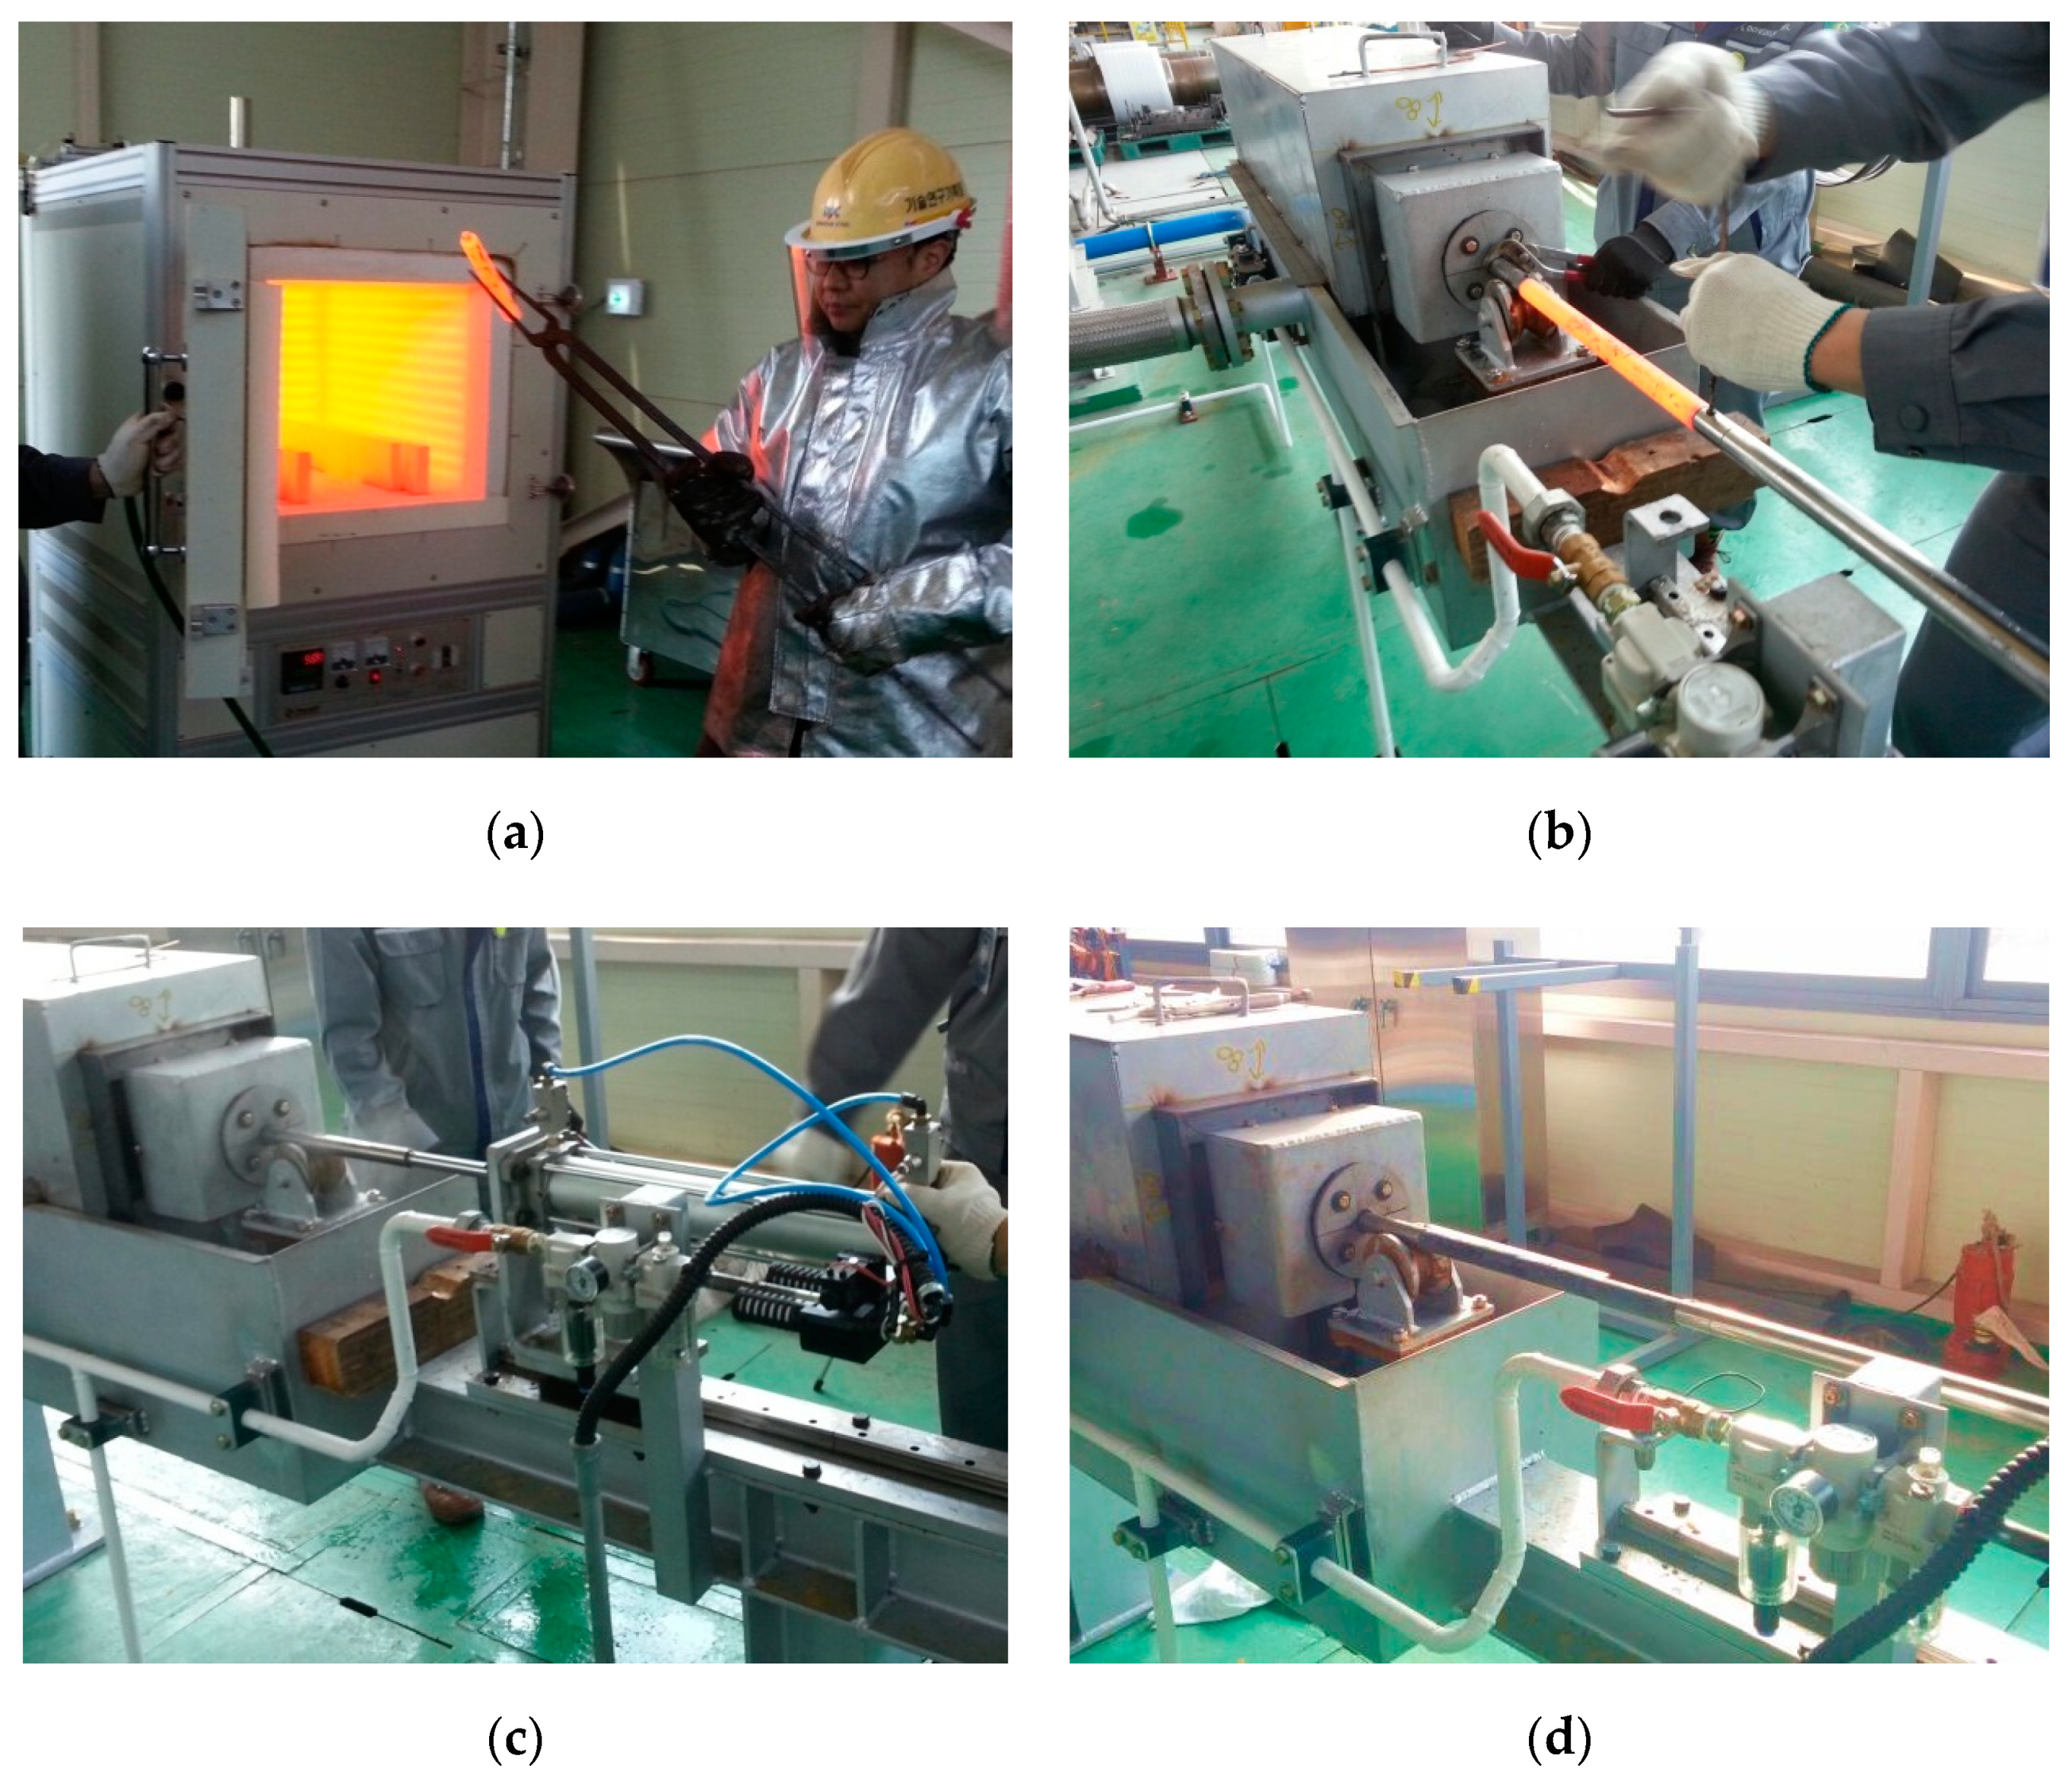
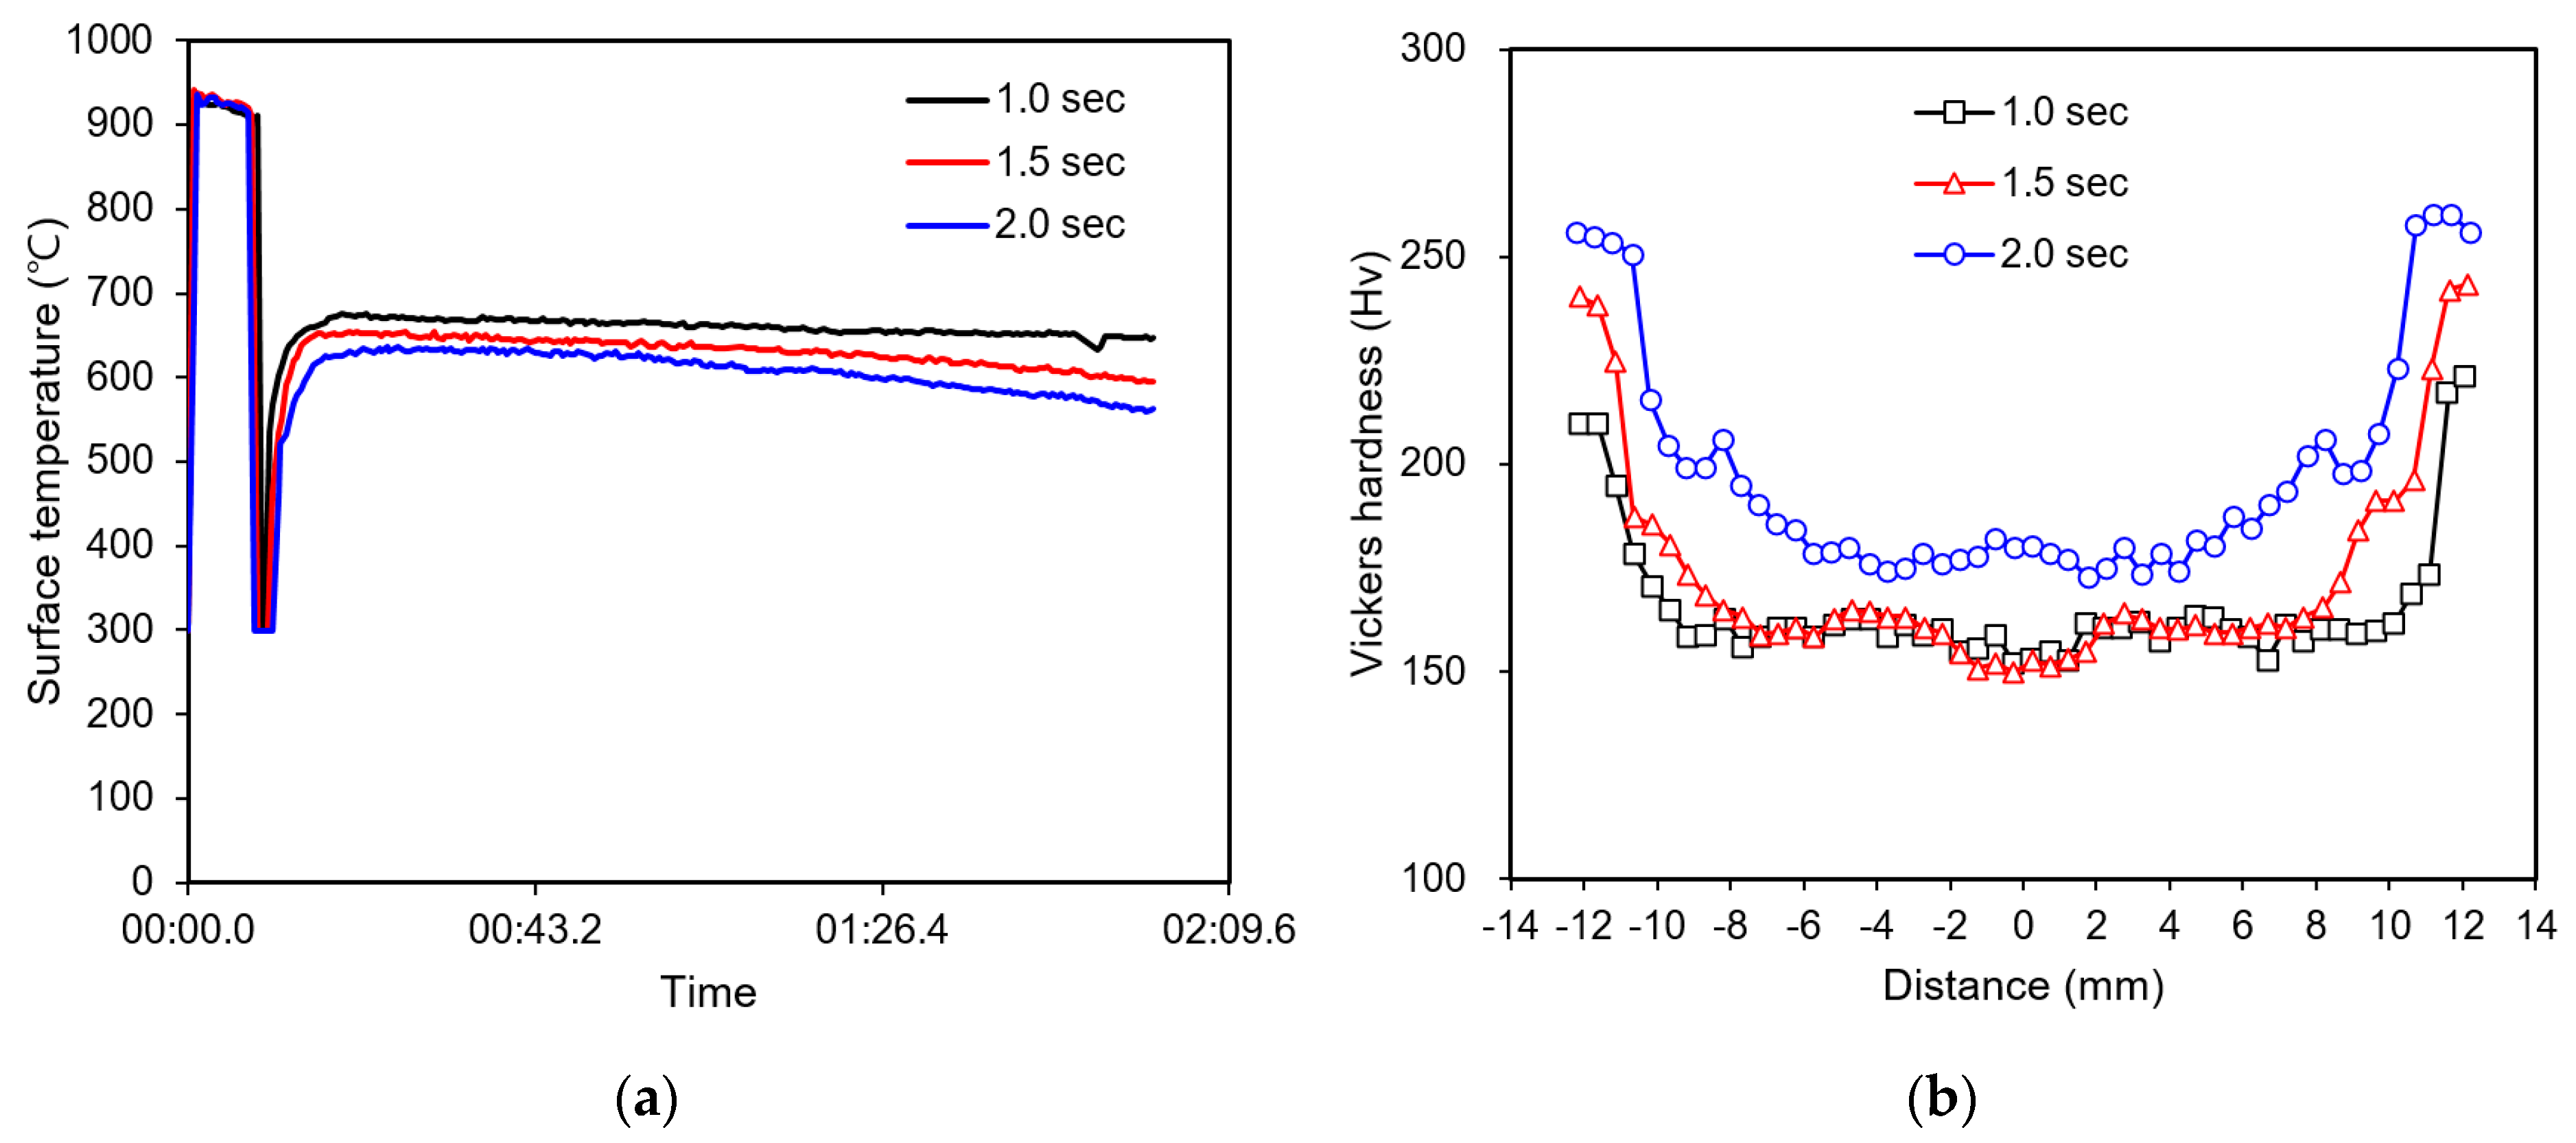
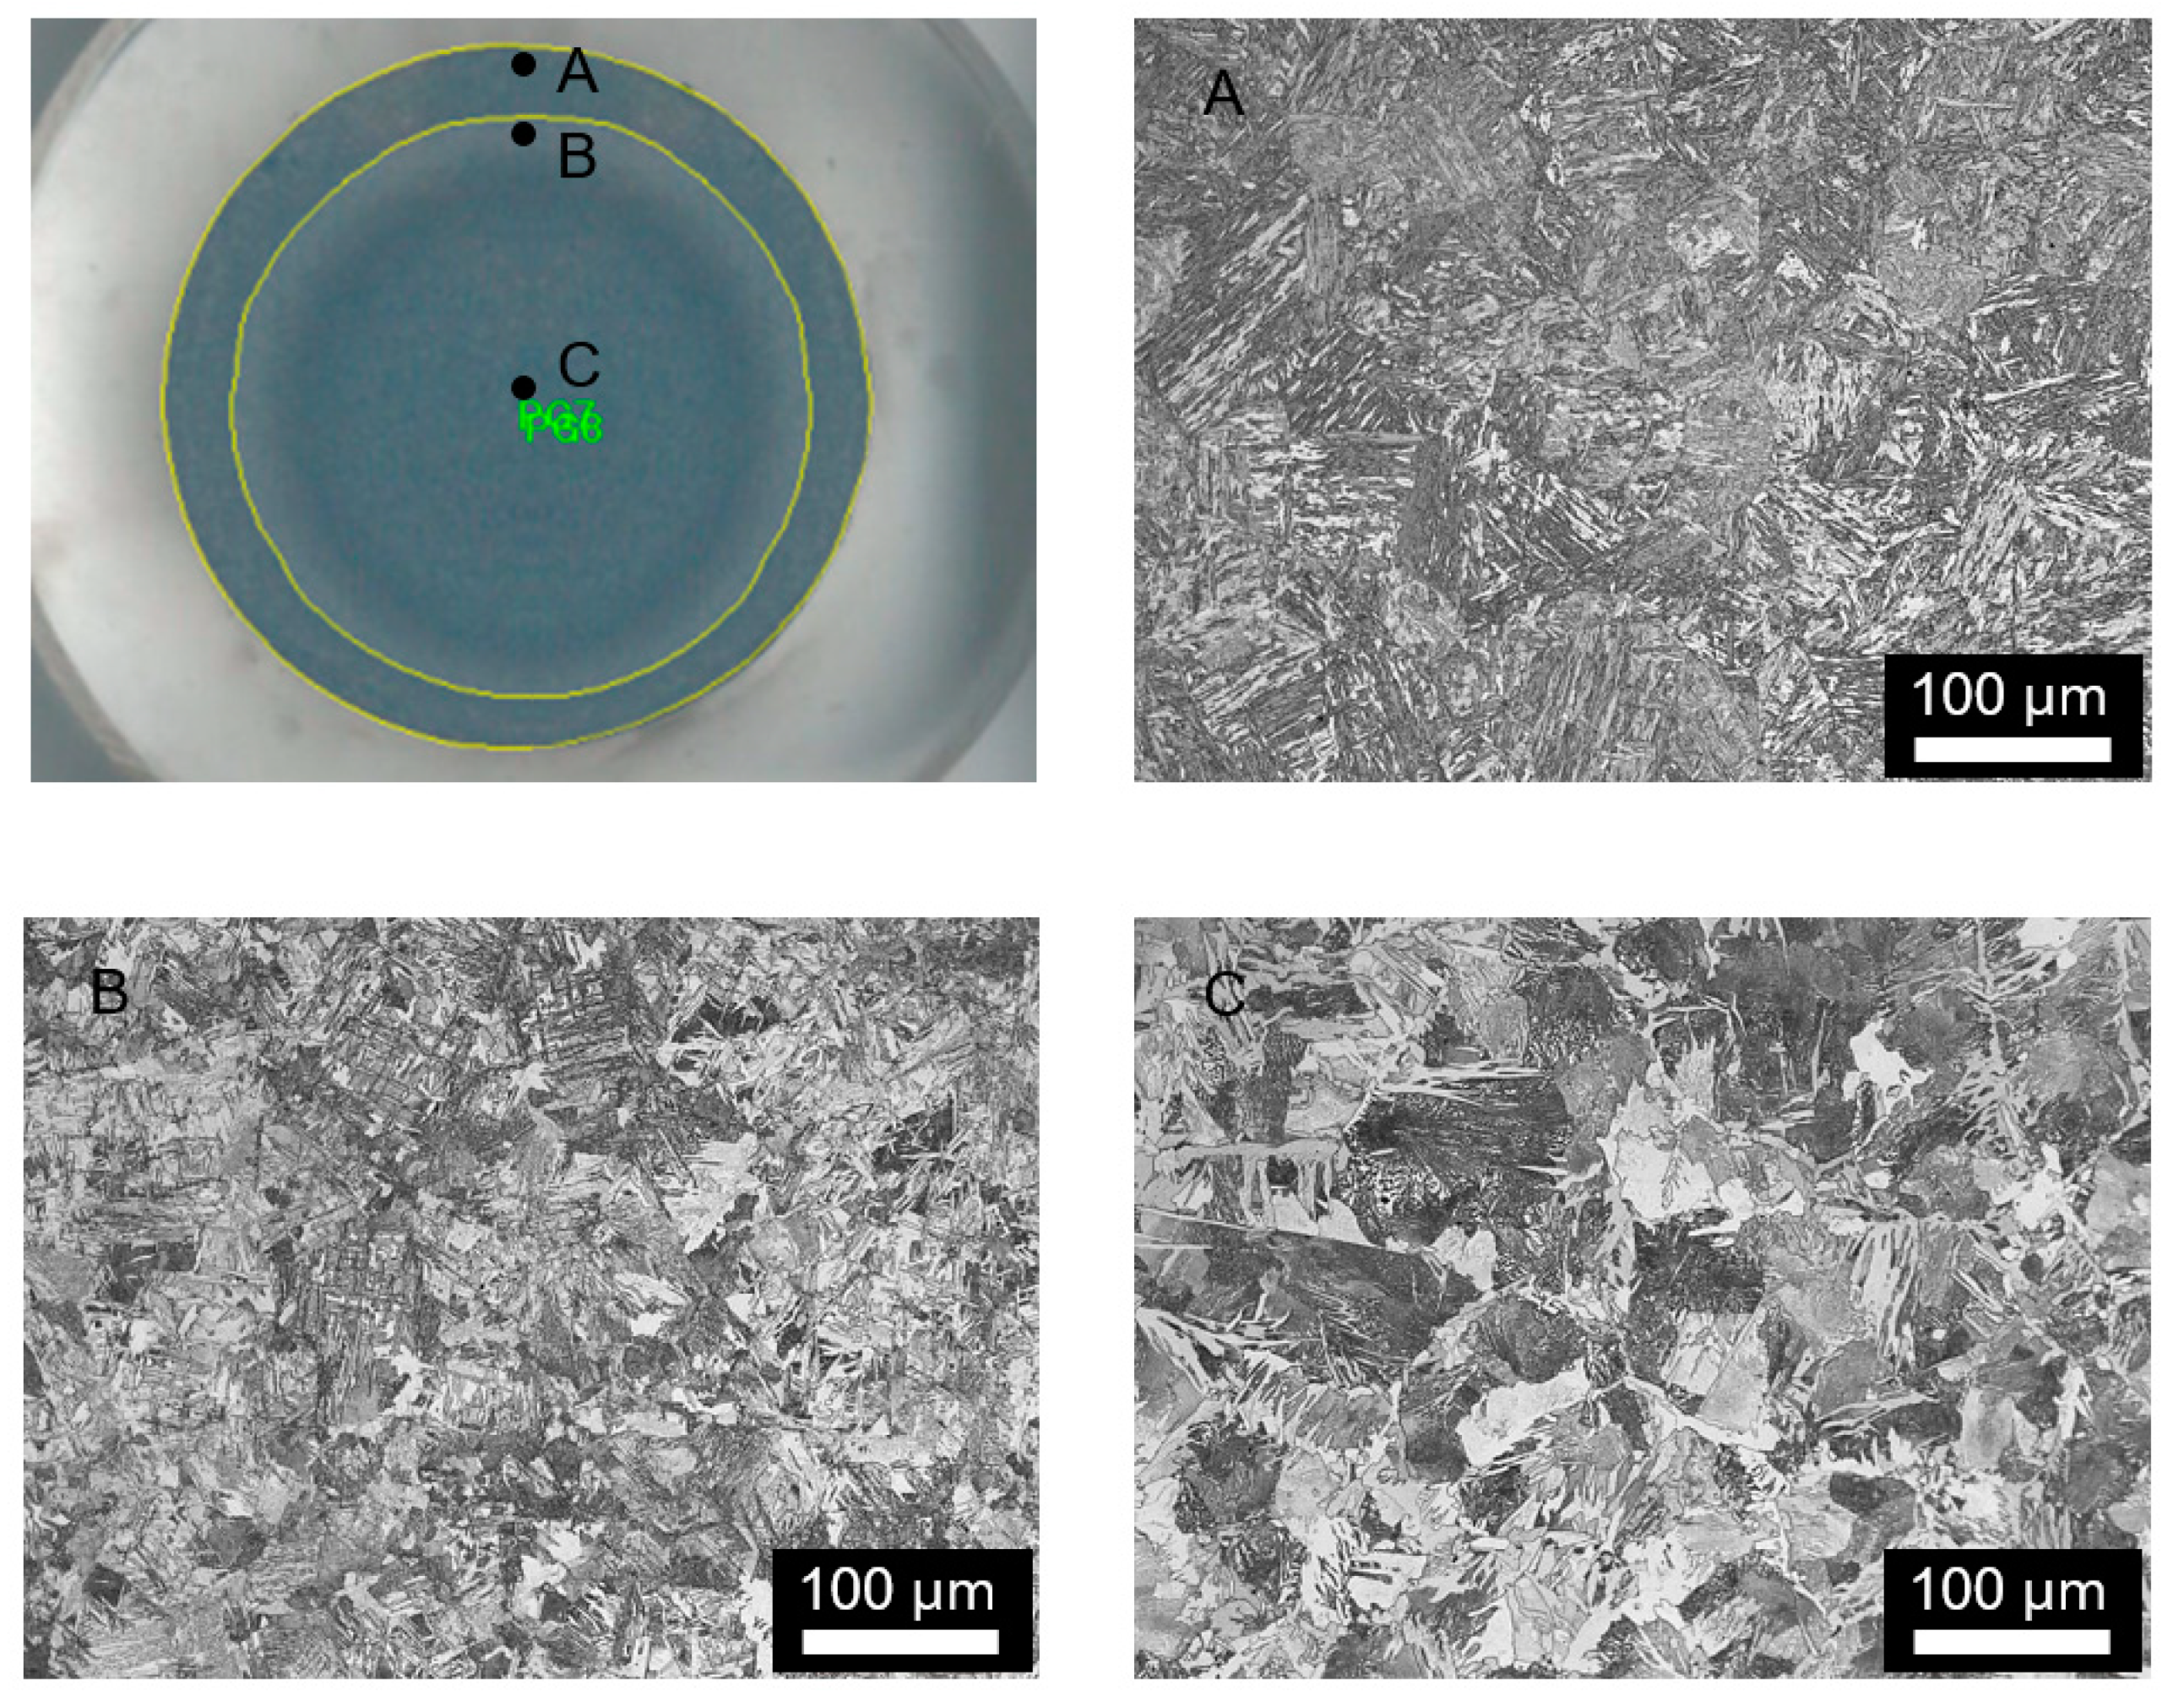
3.1. Test Run of TPS

Figure 8 shows actual test operation of TPS. To estimate the reliability and feasibility of TPS, comparison tests have been performed for 25 mm rebar. Table 2 shows test conditions of shop floor operation and TPS.
Figure 9a,b shows tempered martensite rims produced by shop floor operation and TPS. The ratios of hardened area for shop floor operation and TPS were 32.8% and 31.2%, respectively. Figure 9c shows the variations of microhardness for shop floor operation and TPS. As can be seen in the figure, shop floor operational date was almost the same as that of TPS. This confirms the validity of TPS with high reliability.

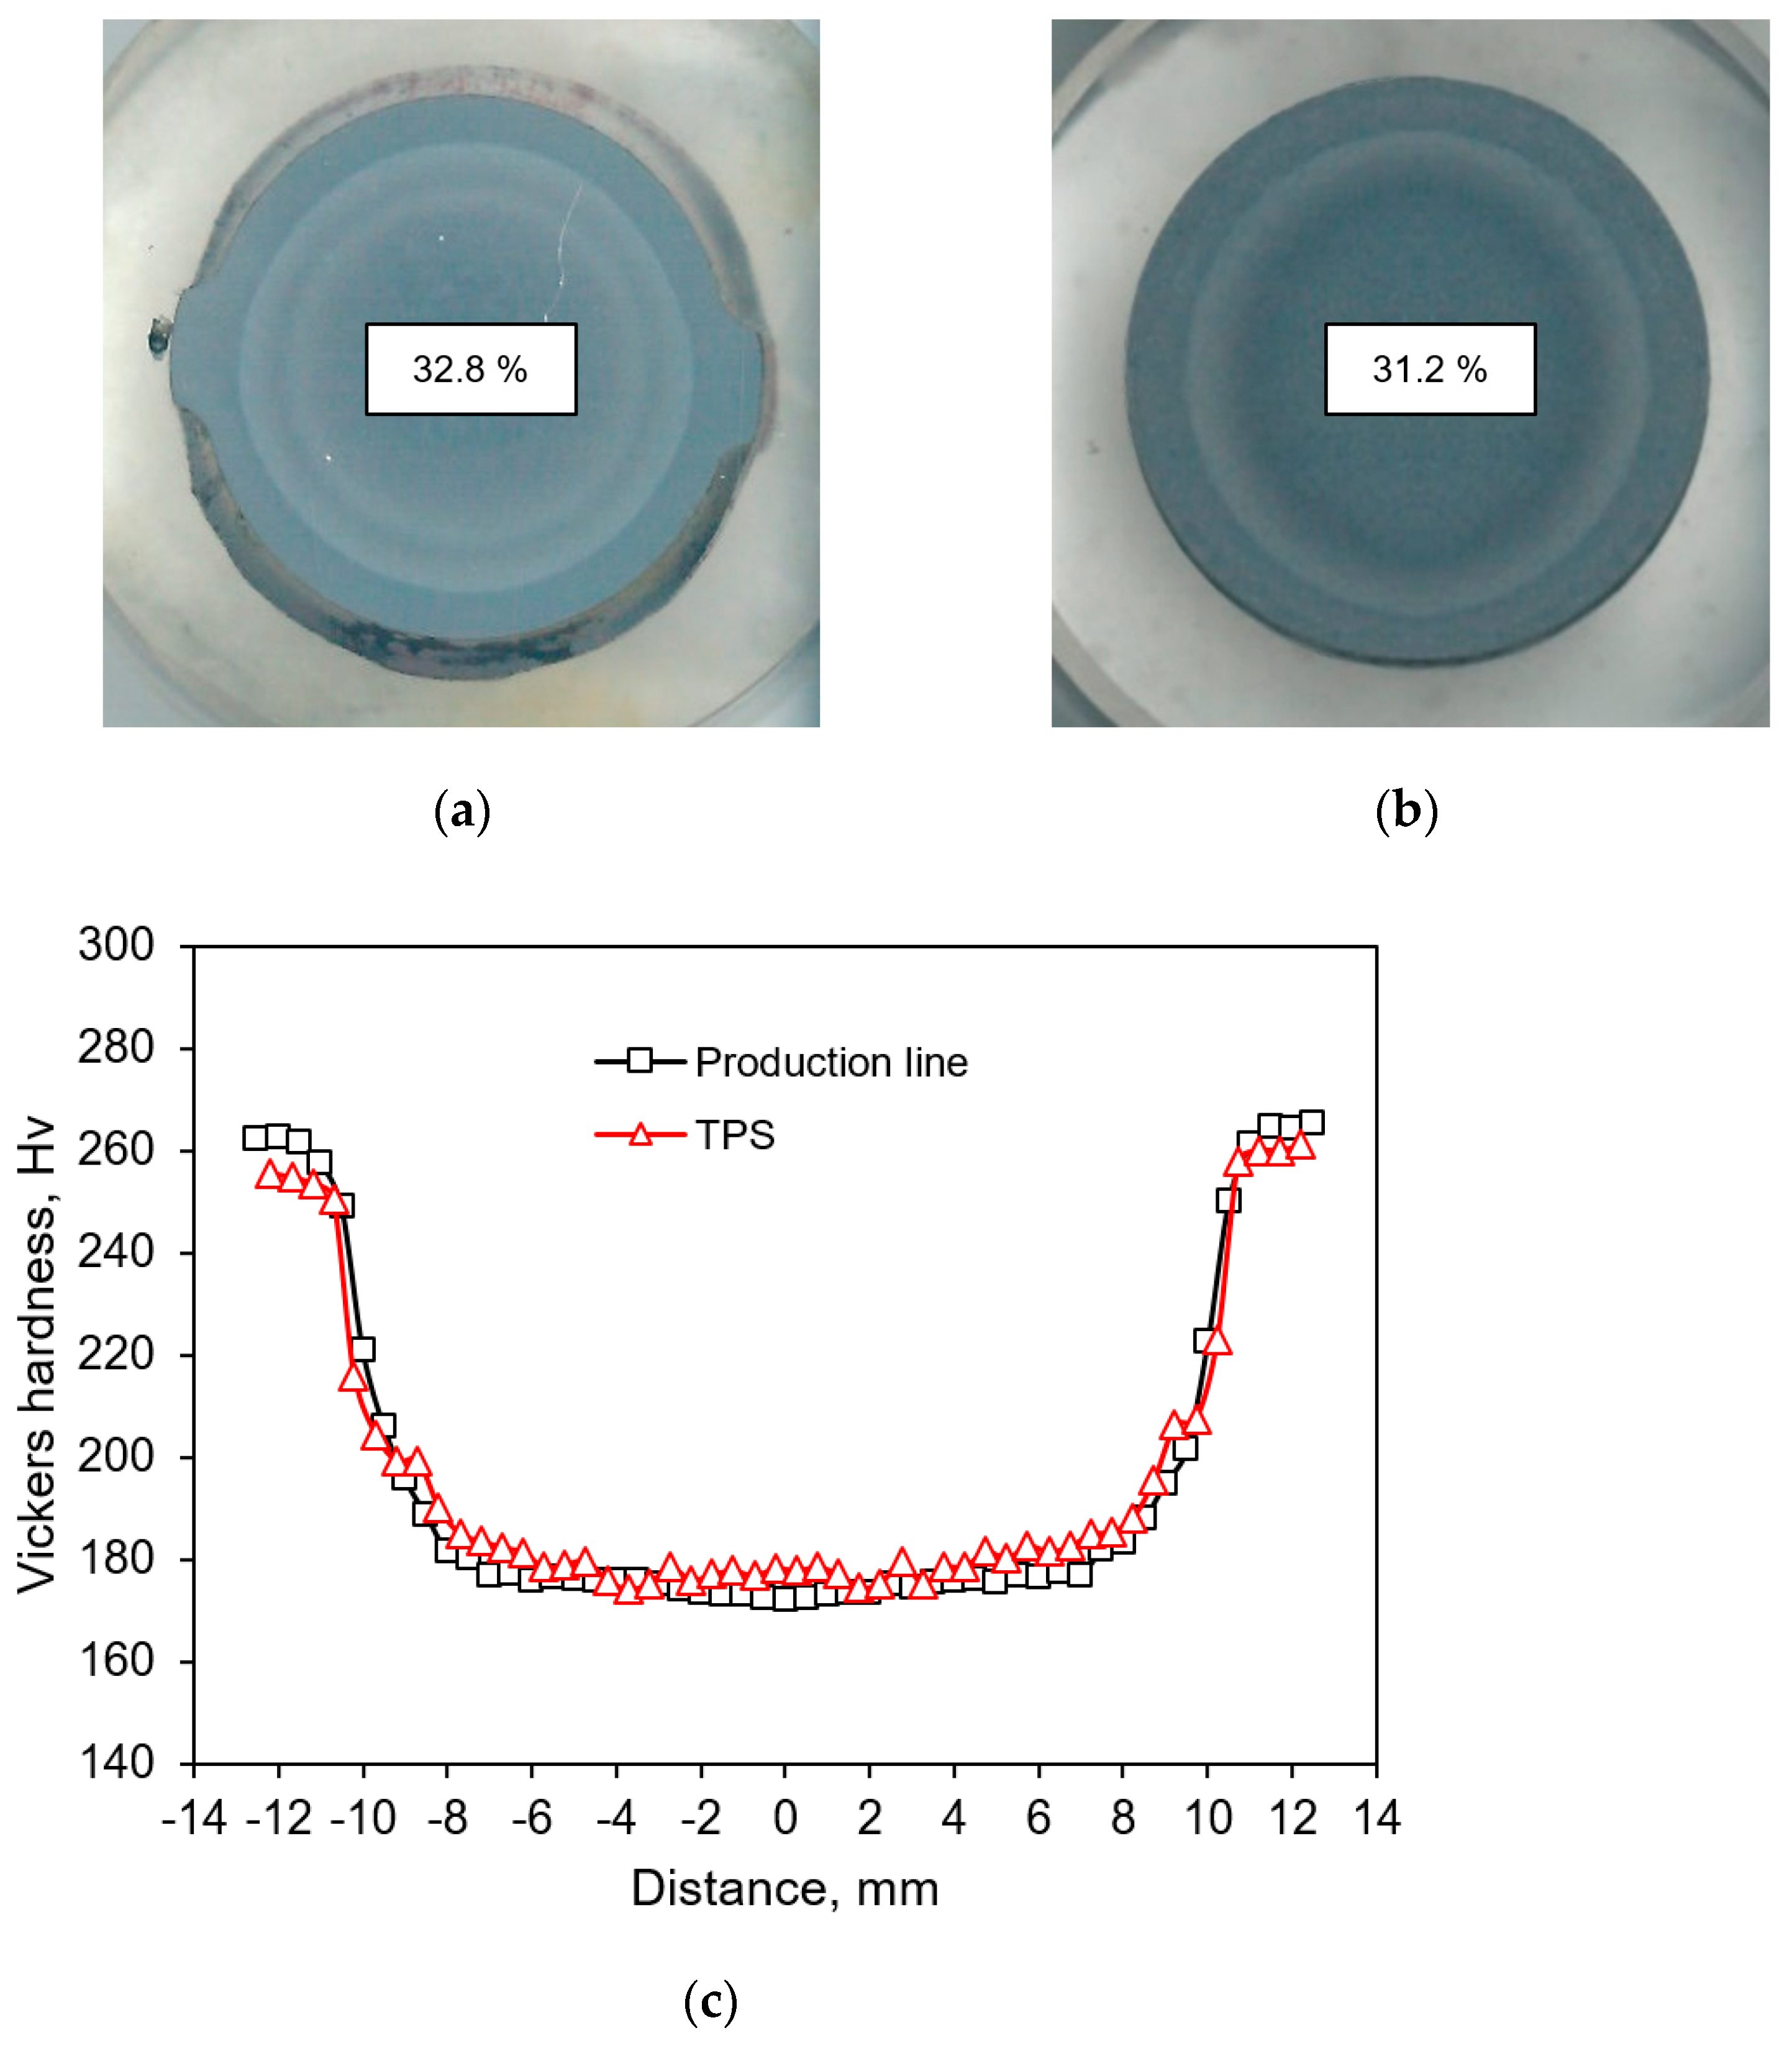
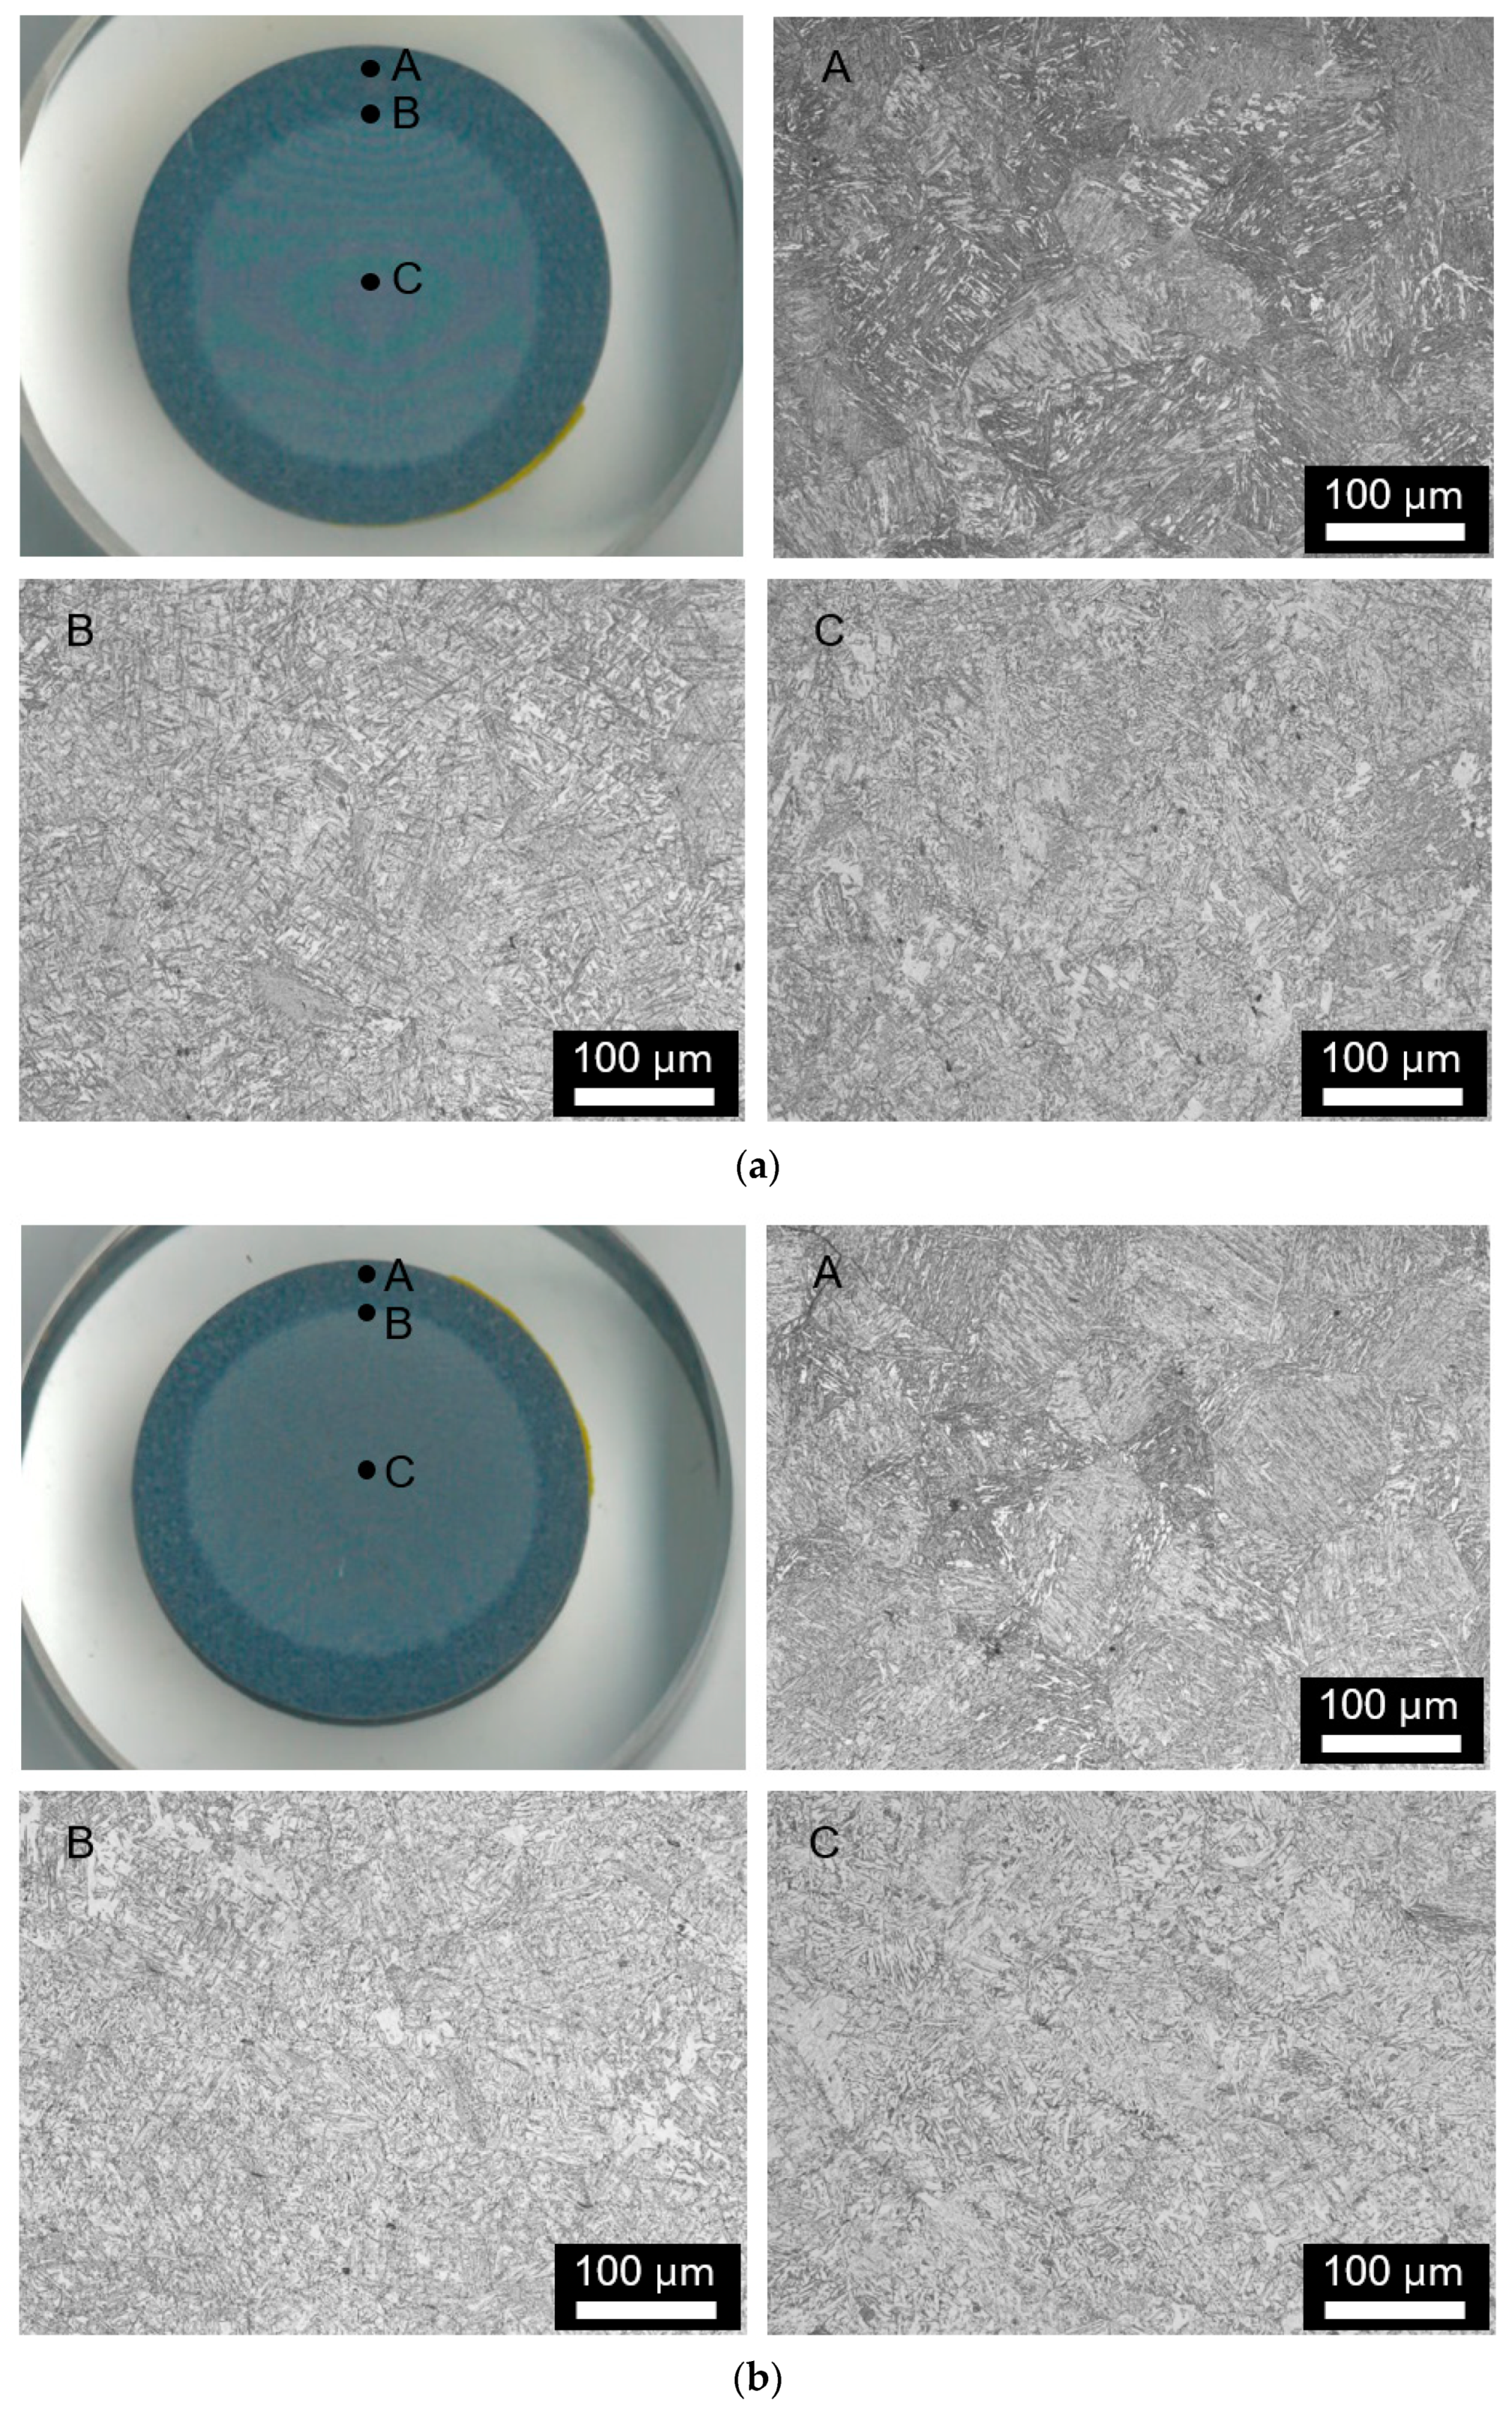
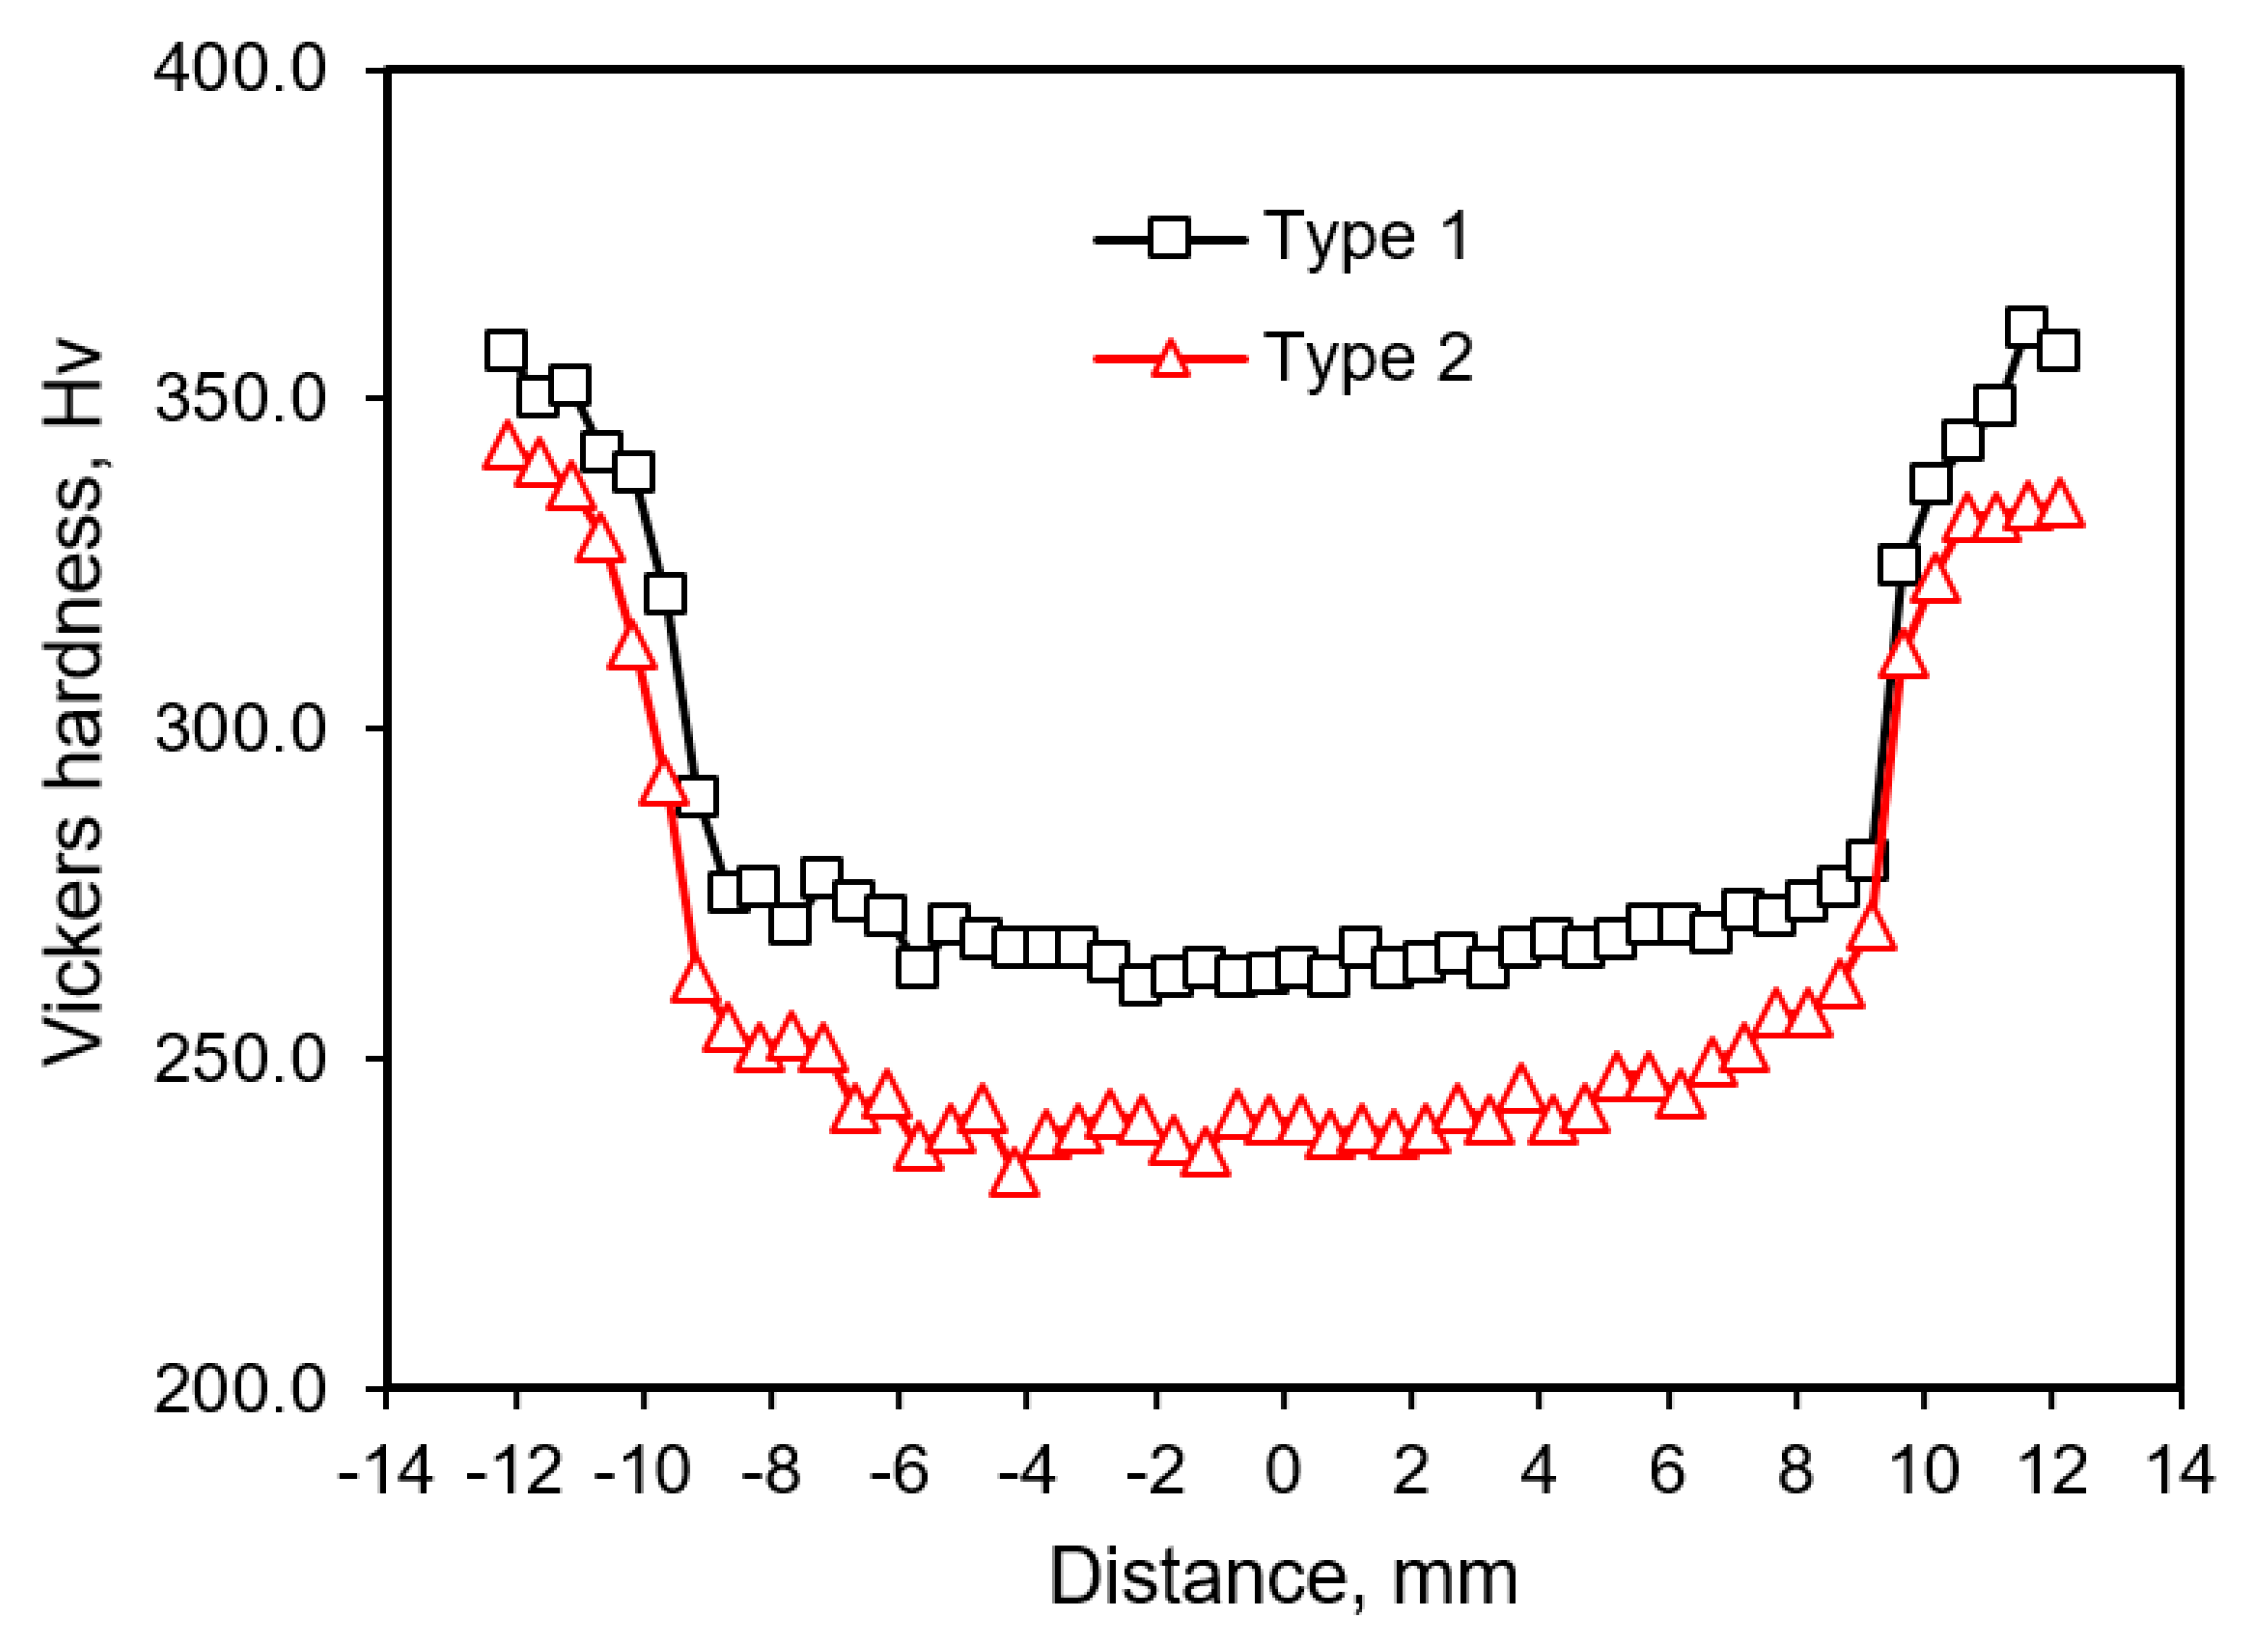
3.2. Performance Validation of TPS

To estimate the performance of TPS, cooling simulation has been performed at various cooling times. Cooling time of TPS has been changed, as shown in Table 3.
Specimen heated to 1.000 °C was extracted from the furnace and moved to the clamping device. The cooling start temperature was 940 °C due to temperature drop caused by extraction and clamping of specimen. The time required to extract and clamp the specimen was less than 10 sec. Figure 10a shows variation of surface temperatures for cooling times of 1.0, 1.5, and 2.0 s. The tempering temperatures for cooling times of 1.0, 1.5, and 2.0 s were 675, 653, and 634 °C, respectively. The ratios of hardened area after TPS for cooling times of 1.0, 1.5, and 2.0 s were 15.4%, 21.0%, and 30.5%, respectively. Therefore, the microhardness increases with increasing cooling time, as shown in Figure 10b. Figure 11 shows microstructure after cooling time of 2.0 s obtained from TPS. As shown in the figure, tempered martensite rim clearly formed on the outer surface, and the hardened area ratio was 30.5%. As shown above, the effect of cooling time on the microstructural evolution and mechanical properties of quenched and tempered rebar have been successfully analyzed by TPS.
To further estimate the performance of TPS, chemical compositions have been changed, as shown in Table 4. The heating time, water flow rate, water pressure, and the specimen diameter were set to be the same as those of Table 3.
The specimen heated to 1,000 °C was extracted from furnace and moved to the clamping device. The cooling start temperature was 940 °C due to temperature drop caused by extraction and clamping of specimen. Figure 12 shows tempered martensite rims obtained from TPS for Cases 1 and 2, respectively. As can be seen in the figure, tempered martensite rim clearly formed at the outer surface, and the hardened area ratios of for Cases 1 and 2 were 44.8% and 41.9%, respectively. The ratio of hardened area for Case 1 was higher than that for Case 2 because the hardenability of Case 1 was higher due to the higher content of alloying elements. Typical Tempcored microstructures having tempered martensite, bainite, and mixed structures of ferrite and pearlite have also been observed. Figure 13 shows variation of microhardness for Cases 1 and 2. The tempered martensite rim obtained from TPS have been well confirmed by hardness profiles.
As shown above, the effects of cooling time and chemical composition on the microstructural evolution and mechanical properties of quenched and tempered rebar have been successfully analyzed. These results show that the need to relate the microstructures to the resulting properties of quenched and tempered rebar can be satisfied by proposed TPS. Khalifa et al. [31] developed a thermal model to predict the temperature distribution across the bar over its whole quenching and self-tempering rout. The output of this model has been used to calculate the area of martensite formed in outer layer and ferrite–pearlite zone. Mukherjee et al. [32] also predicted hardness of the tempered martensitic rim of Tempcore rebars. They developed a model for calculating the hardness of the tempered martensitic rim as a function of chemical composition and non-isothermal tempering parameters. These approaches can be advantageous to estimate rebar strength without experiments, but the accuracy of the thermal model is essentially required. The information on such a thermal model essentially requires precise temperature history, and it can be obtained by TPS.
For the validation of the TPS developed in this study, the area of martensite predicted from TPS was compared with the experimentally obtained area of martensite. From the hardness distribution across the rebar, the martensite volume fraction VM, which is an important parameter in the Tempcore process as it affects the final mechanical properties of the rebar, was determined using the following equation:
V M   =   1 4 ( R M D ) 2
Here, VM denotes the martensite volume fraction, RM is the distance of the martensite layer from the center, and D is the diameter of the rebar, as shown in Figure 14a.
As shown in Figure 14b, strong correlation has been observed between martensite volume fractions obtained from shop floor operation and TPS. It strongly confirms that TPS can simulate the shop floor Tempcore process with a high degree of fidelity and reliability.

4. Conclusions

A cost-effective Tempcore process simulator (TPS) has been developed to investigate the microstructural evolution of quenched and tempered rebar and successfully implemented in this study. TPS consists of a vacuum induction furnace, pilot rolling mill, box furnace, and cooling unit. TPS was used to precisely simulate shop floor operation and successfully produced high-fidelity Tempcore data. Tempered martensite rims having sizes similar to those produced by shop floor operation were clearly shown in the Tempcored rebar through TPS simulation. The operational parameters that affect the Tempcore process, such as chemical composition of the bar and cooling rate, have been well characterized through the series of experiments. It has been confirmed that the TPS can be used to simulate the Tempcore process with a high degree of fidelity and reliability.

Author Contributions

Formal analysis, C.S.P.; Investigation, S.W.H.; Methodology, T.L.; Software, H.J.Y.; Supervision, Y.H.M.; Validation, Y.-T.K.

Funding

This research was funded by National Research Foundation of Korea, grant number 2012R1A5A1048294.

Conflicts of Interest

The authors declare no conflict of interest.

References

  1. Grajcar, A.; Skrzypczyk, P.; Kozłowska, A. Effects of temperature and time of isothermal holding on retained austenite stability in medium-Mn steels. Appl. Sci. 2018, 8, 2156. [Google Scholar] [CrossRef]
  2. Park, K.S.; Van Tyne, C.J.; Moon, Y.H. Process analysis of multistage forging by using finite element method. J. Mater. Process. Technol. 2007, 187, 586–590. [Google Scholar] [CrossRef]
  3. Kil, T.D.; Lee, J.M.; Moon, Y.H. Quantitative formability estimation of ring rolling process by using deformation processing map. J. Mater. Process. Technol. 2015, 220, 224–230. [Google Scholar] [CrossRef]
  4. Nikolaou, J.; Papadimitriou, G.D. Microstructures and mechanical properties after heating of reinforcing 500 MPa class weldable steels produced by various processes (Tempcore, microalloyed with vanadium and work-hardened). Constr. Build. Mater. 2004, 18, 243–254. [Google Scholar] [CrossRef]
  5. Simon, P.; Economopoulos, M.; Nilles, P. Tempcore: A new process for the production of high-quality reinforcing bars. Iron Steel Eng. 1984, 61, 53–57. [Google Scholar]
  6. Economopoulos, M.; Restel, Y.; Lessel, G.; Steffes, G. Application of the Tempcore process to the fabrication of high yield strength concrete-reinforcing bars. Metall. Rep. 1975, 45, 1–17. [Google Scholar]
  7. Movahed, P.; Kolahgar, S.; Marashi, S.P.H.; Pouranvari, M.; Parvin, N. The effect of intercritical heat treatment temperature on the tensile properties and work hardening behavior of ferrite-martensite dual phase steel sheets. Mater. Sci. Eng. A 2009, 518, 1–6. [Google Scholar] [CrossRef]
  8. El-Mahallawi, I.; Abdel-Aal, U. Accelerated cooling of steel rebars establishment of technological and design parameters of the cooling unit by modelling and experimentation. Metall. Sci. Technol. 1977, 15, 11–24. [Google Scholar]
  9. Noville, J.F. TEMPCORE®, the most convenient process to produce low cost high strength rebars from 8 to 75 mm. In Proceedings of the METEC and 2nd European Steel Technology and Application Days (ESTAD) Conference, Düsseldorf, Germany, 15–19 June 2015. [Google Scholar]
  10. Hortigón, B.; Ancio, F.; Nieto-García, E.J.; Herrera, M.A.; Gallardo, J.M. Influence of rebar design on mechanical behaviour of Tempcore steel. Procedia Struct. Integr. 2018, 13, 601–606. [Google Scholar] [CrossRef]
  11. Bandyopadhyay, K.; Lee, J.; Shim, J.H.; Hwang, B.; Lee, M.G. Modeling and experiment on microstructure evolutions and mechanical properties in grade 600 MPa reinforcing steel rebar subjected to TempCore process. Mater. Sci. Eng. A 2019, 745, 39–52. [Google Scholar] [CrossRef]
  12. Mohrbacher, H. Metallurgical Effects of Niobium and Molybdenum on Heat-Affected Zone Toughness in Low-Carbon Steel. Appl. Sci. 2019, 9, 1847. [Google Scholar] [CrossRef]
  13. Jang, J.H.; Lee, J.H.; Joo, B.D.; Moon, Y.H. Flow characteristics of aluminum coated boron steel in hot press forming. Trans. Nonferrous Met. Soc. China 2009, 19, 913–916. [Google Scholar] [CrossRef]
  14. Hwang, T.W.; Woo, Y.Y.; Han, S.W.; Moon, Y.H. Functionally graded properties in directed-energy-deposition titanium parts. Opt. Laser Technol. 2018, 105, 80–88. [Google Scholar] [CrossRef]
  15. Jang, J.H.; Joo, B.D.; Van Tyne, C.J.; Moon, Y.H. Characterization of deposited layer fabricated by direct laser melting process. Met. Mater. Int. 2013, 19, 497–506. [Google Scholar] [CrossRef]
  16. Jeon, C.H.; Han, S.W.; Joo, B.D.; Van Tyne, C.J.; Moon, Y.H. Deformation analysis for cold rolling of Al-Cu double layered sheet by the physical modeling and finite element method. Met. Mater. Int. 2013, 19, 1069–1076. [Google Scholar] [CrossRef]
  17. Gordon, W.A.; Van Tyne, C.J.; Moon, Y.H. Axisymmetric extrusion through adaptable dies—Part 1: Flexible velocity fields and power terms. Int. J. Mech. Sci. 2007, 49, 86–95. [Google Scholar] [CrossRef]
  18. Gordon, W.A.; Van Tyne, C.J.; Moon, Y.H. Axisymmetric extrusion through adaptable dies—Part 3: Minimum pressure streamlined die shapes. Int. J. Mech. Sci. 2007, 49, 104–115. [Google Scholar] [CrossRef]
  19. Kim, D.K.; Woo, Y.Y.; Park, K.S.; Sim, W.J.; Moon, Y.H. Advanced induction heating system for hot stamping. Int. J. Adv. Manuf. Technol. 2018, 99, 583–593. [Google Scholar] [CrossRef]
  20. Winczek, J.; Gawronska, E.; Gucwa, M.; Sczygiol, N. Theoretical and Experimental Investigation of Temperature and Phase Transformation during SAW Overlaying. Appl. Sci. 2019, 9, 1472. [Google Scholar] [CrossRef]
  21. Song, M.C.; Moon, Y.H. Coupled electromagnetic and thermal analysis of induction heating for the forging of marine crankshafts. Appl. Therm. Eng. 2016, 98, 98–109. [Google Scholar] [CrossRef]
  22. Kim, B.J.; Van Tyne, C.J.; Lee, M.Y.; Moon, Y.H. Finite element analysis and experimental confirmation of warm hydroforming process for aluminum alloy. J. Mater. Process. Technol. 2007, 187, 296–299. [Google Scholar] [CrossRef]
  23. Seo, D.M.; Hwang, T.W.; Moon, Y.H. Carbonitriding of Ti-6Al-4V alloy via laser irradiation of pure graphite powder in nitrogen environment. Surf. Coat. Technol. 2019, 363, 224–254. [Google Scholar] [CrossRef]
  24. Lee, R.S.; Lin, Y.K.; Chien, T.W. Experimental and theoretical studies on formability of 22MnB5 at elevated temperatures by Gleeble simulator. Procedia Eng. 2014, 81, 1682–1688. [Google Scholar] [CrossRef]
  25. Xiong, Z.P.; Kostryzhev, A.G.; Chen, L.; Pereloma, E.V. Microstructure and mechanical properties of, strip cast TRIP steel subjected to thermo-mechanical simulation. Mater. Sci. Eng. A 2016, 677, 356–366. [Google Scholar] [CrossRef]
  26. Nikolaou, J.; Papadimitriou, G.D. Impact toughness of reinforcing steels produced by (i) the Tempcore process and (ii) microalloying with vanadium. Int. J. Impact Eng. 2005, 31, 1065–1080. [Google Scholar] [CrossRef]
  27. Zheng, H.; Abel, A.A. Fatigue properties of reinforcing steel produced by TEMPCORE process. J. Mater. Civ. Eng. 1999, 11, 158–165. [Google Scholar] [CrossRef]
  28. Riva, P.; Franchi, A.; Tabeni, D. Welded Tempcore reinforcement behaviour for seismic applications. Mater. Struct. 2001, 34, 240–247. [Google Scholar] [CrossRef]
  29. Dotreppe, J.C. Mechanical properties of quenched and self-tempered reinforcing steel at elevated temperatures compared with recommendations of Eurocode 2—Part 1-2. Mater. Struct. 1997, 30, 430–438. [Google Scholar] [CrossRef]
  30. Felicetti, R.; Gambarova, P.G.; Meda, A. Residual behavior of steel rebars and R/C sections after a fire. Constr. Build. Mater. 2009, 23, 3546–3555. [Google Scholar] [CrossRef]
  31. Khalifa, H.; Megahed, G.M.; Hamouda, R.M.; Taha, M.A. Experimental investigation and simulation of structure and tensile properties of Tempcore treated rebar. J. Mater. Process. Technol. 2016, 230, 244–253. [Google Scholar] [CrossRef]
  32. Mukherjee, M.; Dutta, C.; Haldar, A. Prediction of hardness of the tempered martensitic rim of TMT rebars. Mater. Sci. Eng. A 2012, 543, 35–43. [Google Scholar] [CrossRef]
Figure 1. Schematic of temperature profile and microstructural evolution in Tempcore treated rebars.
Applsci 09 02938 g001
Figure 2. Comparison of hardness profiles of rebars after Tempcore treatment and 5 s water quenching.
Applsci 09 02938 g002
Figure 3. Industrial Tempcore production line.
Applsci 09 02938 g003
Figure 4. Sequential layout of Tempcore process simulator (TPS): (a) induction furnace; (b) pilot rolling mill; (c) box furnace; (d) cooling unit.
Applsci 09 02938 g004
Figure 5. Similarity of cooling system for the Tempcore process: (a) production line; (b) TPS.
Applsci 09 02938 g005
Figure 6. Sequence of fabrication of test specimen: (a) ingot; (b) plate rolled; (c) cylindrical specimen.
Applsci 09 02938 g006
Figure 7. (a) Schematic of TPS system; (b) dual cylinder; (c) specimen transfer frame; (d) screw type specimen clamping device.
Applsci 09 02938 g007
Figure 8. Actual experimentation using TPS: (a) heating; (b) loading; (c) cooling; (d) self-tempering.
Applsci 09 02938 g008
Figure 9. Tempered martensite rims produced by (a) shop floor operation; (b) TPS; (c) variation of microhardness for shop floor operation and TPS.
Applsci 09 02938 g009
Figure 10. (a) Variation of temperature for cooling times of 1.0, 1.5, and 2.0 s; (b) measured microhardness for the cooling times of 1.0, 1.5, and 2.0 s.
Applsci 09 02938 g010
Figure 11. Microstructures obtained from TPS after cooling time of 2.0 s. (A: surface layer; B: transition layer; C: center core.).
Applsci 09 02938 g011
Figure 12. Tempered martensite rim obtained from TPS for (a) Type 1 and (b) Type 2.
Applsci 09 02938 g012
Figure 13. Variation of microhardness obtained from TPS for Cases 1 and 2.
Applsci 09 02938 g013
Figure 14. (a) Definition of martensite volume fraction; (b) correlation of martensite volume fraction.
Applsci 09 02938 g014
Table 1. Main specifications of TPS.
Air cylinder stroke (mm)800
Cooling time (sec)1~2.5
Water flow rate (m3/h)Max 65
Water pressure (bar)0~15
Specimen length (mm)360
Control valve80A × JIS20K (Globe Type)
Container material316 Stainless steel
Table 2. Test conditions for comparison of TPS with shop floor operation.
ParameterShop Floor OperationTPS
Water flow rate (m3/h)50045
Cooler quantity101
Cooling length (m)140.72
Rolling speed (m/s)6.65-
Cylinder speed (m/s)-0.36
Cooling time (sec)2.12.0
Table 3. Performance test with respect to cooling time.
Heating temperature (°C)1.000
Water flow rate (m3/h)36
Water pressure (bar)11~12
Cooling time (sec)1.0, 1.5, 2.0
Specimen diameter (mm)25
Chemical composition of specimen
(wt%)
C0.29
Si0.21
Mn0.52
P< 0.040
S< 0.040
Table 4. Performance test with respect to alloy type.
Cooling time (sec)1.5
Alloy typeType 1Type 2
Chemical composition (wt%)C0.280.27
Si0.240.22
Mn1.431.22
V0.0310.020
P<0.040<0.040
S<0.040<0.040

