Featured Application
The model enables a detailed investigation of phonation with regard to the conditions at phonation onset. Thereby, the goal is to identify advantageous ranges of material parameters that support an efficient vocal fold oscillation as the phonation source.
Abstract
In voice research, analytically-based models are efficient tools to investigate the basic physical mechanisms of phonation. Calculations based on lumped element models describe the effects of the air in the vocal tract upon threshold pressure (Pth) by its inertance. The latter depends on the geometrical boundary conditions prescribed by the vocal tract length (directly) and its cross-sectional area (inversely). Using Titze’s surface wave model (SWM) to account for the properties of the vocal folds, the influence of the vocal tract inertia is examined by two sets of calculations in combination with experiments that apply silicone-based vocal folds. In the first set, a vocal tract is constructed whose cross-sectional area is adjustable from 2.7 cm2 to 11.7 cm2. In the second set, the length of the vocal tract is varied from 4.0 cm to 59.0 cm. For both sets, the pressure and frequency data are collected and compared with calculations based on the SWM. In most cases, the measurements support the calculations; hence, the model is suited to describe and predict basic mechanisms of phonation and the inertial effects caused by a vocal tract.
1. Introduction
Phonation begins with a flow of air from the lungs that transfers energy to the motion of the vocal folds. After this airflow leaves the larynx, it encounters a mass of air in the vocal tract with inertial properties. By examining a vocal tract of uniform cross-sectional area AVT and length LVT, one can use Newton’s second law to derive the following formula for the pressure required to accelerate the air within the vocal tract:
where the quantity dUg/dt is the time derivative of the glottal flow rate Ug, and IVT is the inertance of the air in the vocal tract. The inertance of the air is given by IVT = ρ LVT/ AVT, where ρ is the density of air.
Ishizaka and Flanagan [1] used this formula in their classic paper that developed the two-mass model of the vocal folds. Titze [2] also used this formula in his paper dealing with small amplitude oscillations of the vocal folds. He introduced the surface wave model (SWM) and showed how a wave traveling along the medial surfaces of the vocal folds could account for their sustained oscillations, provided that the subglottal pressure was above a threshold Pth. Titze also gave qualitative arguments that the pressures in the vocal tract should reinforce the effect of the pressures acting on the medial surfaces of the vocal folds, and thus enhance the action of these pressures. A consequence of this is that one would expect the inertial effects of the vocal tract to lower the pressure required for the phonation threshold. In order to examine the predictions of the SWM, Titze et al. [3,4,5] did a number of experiments. Of the most relevance to this work was the 2006 paper where Chan and Titze [5] examined the dependence of the threshold pressure on the prephonatory glottal half-width with and without a vocal tract. This comparison allows rigorous scrutiny of the effects of Equation (1), since it introduces no new free parameters. Fulcher and Scherer [6] showed that a calculation based on the SWM and using Equation (1) to account for the effects of the vocal tract gave a reasonable explanation of the threshold data that Chan and Titze collected. It is shown below in Section 2.1 that this fit can be improved by choosing a larger value for the surface wave velocity.
One of the earlier uses of Equation (1) was the self-oscillating model of Flanagan and Landgraf [7]. Their purpose was to develop a source for a vocal-tract synthesizer, and their paper was primarily concerned with the qualitative features of the glottal area oscillations and glottal flow rates that resulted from using a multi-section vocal tract to describe the shapes appropriate for various vowels. However, they did not quantitatively examine the implications of Equation (1) for the influence of the geometry of the vocal tract on the properties near the phonation threshold. Equation (1) has also been part of numerous calculations addressing the properties of phonation, for example in [8,9,10,11,12], but the focus of these works was not a detailed examination of its validity for representing the inertial properties of the air in the vocal tract.
Zhang, Neubauer, and Berry [13] examined the influence of subglottal acoustics on the dynamics of a single-layer vocal fold model. The dimensions of their pseudotrachea varied from 17 cm to 325 cm. Due to the stiffness of their vocal fold model (Young’s modulus of 11 kPa), they were not able to see aerodynamic oscillations of the vocal folds for pseudotrachea lengths below 30 cm, which includes the region of interest for human phonation. Their measurements focused on the frequencies that are appropriate for the coupling of acoustic resonances with vocal fold oscillations, and thus Equation (1) was not involved in their analysis. Instead, they relied on the model developed by Gupta, Wilson, and Beavers [14]. Subsequent work by Zhang, Neubauer, and Berry [15] showed that decreasing the stiffness of the vocal folds (Young’s modulus in the range of 3 to 8 kPa) would lead to oscillations that were driven by aerodynamic forces. In that work, their focus was on the variation of phonation frequency and threshold pressure with Young’s modulus, and they did not use Equation (1) to analyze their data. Lucero et al. [16] examined the effects of the vocal tract on the phonation threshold pressures and frequencies at threshold using a vocal fold replica where the oscillating mass was a volume of water enclosed by a latex cover. Their main concern was the effect of vocal tract resonances using a wave propagation model, and thus Equation (1) was not part of their analysis.
It is the purpose of the present work to examine carefully the implications of Equation (1) for the influence of the geometry of the vocal tract on threshold pressure and the oscillation frequency near the threshold [17,18]. The formula for the inertance above indicates that it depends directly on the length of the vocal tract and inversely on its cross-sectional area. Thus, increasing the length of the vocal tract should enhance the effects of the vocal tract. Since the pressure in the vocal tract reinforces the action of the pressure within the glottis, one would expect an increase in the vocal tract length to lower the threshold pressure. This question is studied below in Section 3. Conversely, one would expect an increase in the area of the vocal tract to reduce its influence. Reduced influence on the vocal tract pressure values should reduce the effectiveness of the vocal tract in reinforcing the intraglottal pressure. Thus, one would expect that increasing the area of the vocal tract would increase the threshold pressure. This question is also examined in Section 3.
The successes of the vocal fold model described in Section 3 suggest that it could provide a useful foundation for constructing more elaborate models, in order to address important additional aspects of phonation. In particular, it could be used as the main working element of calculations to consider the effects of vocal fold semi-occlusion [19,20]. Such calculations and measurements with human subjects have been undertaken in order to better understand the rationale for the widespread use of straws in voice training and therapy. Another potentially important extension would be an attempt to include the effects of the false vocal folds [21]. These structures may play a significant role in the efficiency of the energy transfer from the glottal airflow to the kinetic energy of the true vocal folds. Such calculations would improve the relevance of lumped element vocal fold models for phonation in humans [22].
2. Models and Methods
2.1. Surface Wave Model and the Vocal Tract
Fulcher and Scherer [6] show that the subglottal pressure Psub is responsible for accelerating the air in the vocal tract as well as moving the air through the glottal duct created by the medial surfaces bounding the glottis, which is shown schematically in Figure 1. Thus, the subglottal pressure is related to the flow rate, its time derivative, and the glottal areas at the entrance A1(t) and at the exit A2(t) by the equation:
where kent is the entrance loss coefficient and kex is the exit coefficient [23,24]. The dynamics of the vocal fold coordinate ξ in the SWM is described by an equation of motion [2,6] whose driving term includes a factor Pg, which is the average of the pressure P(z) over the medial surface of the vocal fold, that is:
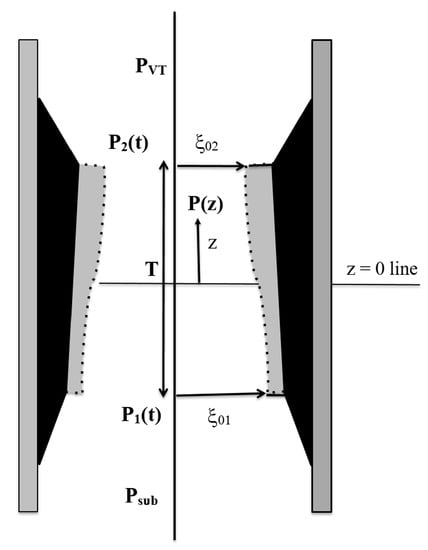
Figure 1.
A schematic diagram showing the surface wave propagating along the medial surface of the vocal tract. The halfwidth at the glottal entrance is ξ01, and that at the glottal exit is ξ02.
In Equation (3), m is the mass of the vocal fold, k is the spring constant representing its stiffness, and η allows for a possible nonlinearity in the stiffness. The quantity Lg there denotes the glottal length (anterior–posterior direction), and T denotes the glottal thickness (inferior–superior direction). The dots in Equation (3) denote time derivatives.
The pressure in the integrand of Equation (3) involves the area A(z,t). This may be expressed in terms of the vocal fold surface coordinate ξSurf(z,t) by the equation, A(z,t) = 2 Lg [ξ0(z) + ξSurf(z,t)], where ξ0(z) is the prephonatory shape of the glottal surface. Since the surface coordinate satisfies a wave equation, the combination of variables z and t takes a simpler form, that is, ξSurf(z,t) = ξSurf(t − z/c), where c is the velocity of the surface wave. Fundamental to the SWM is the expansion of ξSurf(z,t) as a power series in z. This requires the assumption that the phase difference between the glottal entrance and the glottal exit is not too large.
If only the first-order correction is needed, then + …, where ξ(t) is the coordinate of the center of the vocal fold, which is the same as the coordinate of Equation (3). Following Titze’s assumption of a trapezoidal prephonatory shape and that the phase difference of the top and bottom edges of the vocal fold is not too large, the integral in Equation (3) can be done analytically. This yields:
Since z = −T/2 for the glottal entrance and z = T/2 for the glottal exit, the areas in Equation (4) may be written as:
where τ = T/(2c) is the time for the surface wave to propagate from the center of the medial surface to the glottal exit.
If no vocal tract is involved, then one can eliminate the factor of Ug2 in Equation (4) by using Equation (2). Then Equation (4) takes the form:
Measurements show that for most of the glottal diameters, the entrance coefficients are much larger than the exit coefficients [23,24]. Neglecting kex in Equation (6), specializing to the rectangular case where ξ01 = ξ02 = ξ0, and carrying out an expansion in inverse powers of ξ0 there allows Equation (6) to be simplified to the following form:
provided that only the lowest-order terms in (ξ0)−1 are kept. Thus, the driving force on the right-hand side of Equation (3) simplifies to a term that has the effect of a negative damping term. Equating the coefficient of this term to that of the damping term on the left-hand side of Equation (3) yields:
which is essentially Titze’s equation for the threshold pressure [2], since the transglottal coefficient kt = kent, when kex is neglected. Equation (8) requires careful interpretation. If the entrance loss coefficient kent is assumed to be near one (kent = 1.37 was a typical value for much of the earlier work), then Equation (8) predicts that the threshold pressure becomes very small in the limit of small glottal half-widths. However, none of the data collected in the experiments that Titze et al. did to test the predictions of the SWM showed this behavior [3,5]. Fulcher and Scherer [6] showed that the key to resolving this discrepancy was a careful analysis of the behavior of the entrance loss coefficient at small glottal widths, since this coefficient could become very large in this limit, where viscous effects become large. In fact, they showed that the behavior of the entrance loss coefficient in the limit of small glottal widths was consistent with an inverse relationship, that is:
In Figure 2, calculations based on the analytic expressions presented in Equations (8) and (9) are compared with measurements done by Chan and Titze [5], when no vocal tract was present in their experiments. As emphasized earlier [6], the properties of Equations (8) and (9) allow one to account for the observed slope of the line expressing the threshold pressure as a function of the glottal half-width as well as its intercept at zero half-width. For this fit to the data, the parameters B = 112 g/s, c = 400 cm/s, E = 0.072 cm, and F = 0.600 are required. The geometrical parameters, Lg = 2.22 cm and T = 1.1 cm, are determined from the dimensions of the vocal fold model used in the experiments.
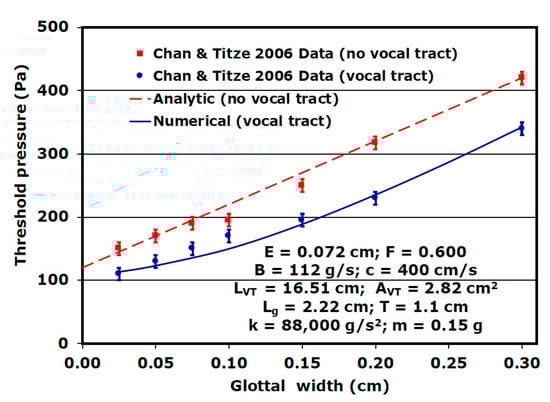
Figure 2.
(Color online) Measured and calculated phonation threshold pressures as functions of the glottal half-width with and without a vocal tract.
When the vocal tract is added, a numerical solution is required, since the time derivative in Equation (2) prevents obtaining an analytic connection between the glottal flow rate and the subglottal pressure. The numerical solution involves the simultaneous solution of Equations (2)–(5). The inertance term of Equation (2) does not introduce additional free parameters, since the vocal tract length and its area are determined from the experiment. For Chan and Titze’s experiment, LVT = 16.51 cm and AVT = 2.82 cm2. The results of the numerical solution are shown in Figure 2, where they are compared with Chan and Titze’s vocal tract measurements. The fits to the data collected with the vocal tract as well as those collected without the vocal tract are very good. The largest differences (about 13%) occur at a glottal width of 0.10 cm, and most of the differences are substantially smaller.
The numerical solution of Equations (2), (3), (5), and (6) requires values for the mass and stiffness parameters. Following the lead of Ishizaka and Flanagan [1,25,26,27], these were chosen to be k = 88,000 g/s2 and m = 0.15 g. In order to make the calculation as simple as possible, the nonlinearity parameter was set equal to zero. It is worth noting that the use of Equations (2) and (4) for the vocal tract calculation eliminates the necessity for the inverse ξ0 expansion, and thus removes the small amplitude requirement. However, the requirement of a reasonably small phase difference between the inferior and the superior edges of the medial surface remains.
2.2. Larynx Model and Measuring Setup
The model used for the synthetic larynx and the subglottal system is shown in Figure 3. It is composed of a mass-flow generator [28], which provides the air flow, an acoustic silencer, a subglottal channel, and the mounting device for the synthetic vocal folds. The subglottal channel provides a rectangular flow cross-section, whose dimensions are 1.8 cm by 1.5 cm. The length of the subglottal channel is 19 cm. Thus, the frequency required for it to serve as an acoustic λ/4 resonator is 451 Hz, which is at least three times larger than any of the oscillation frequencies for the vocal folds reported below. Two measures were employed to minimize the effects of acoustic perturbations on the entering airflow. Most of the silencer is covered with Sonatech PUR SKIN 30 sound-absorbing foam (SONATECH GmbH + Co. KG, Ungerhausen, Germany) matting, which is very effective at damping acoustic fluctuations. These regions are colored in orange in the silencer depicted in Figure 3. In order to interrupt acoustic standing waves in the axial direction, a core body in the center of the silencer is also covered with PUR SKIN.
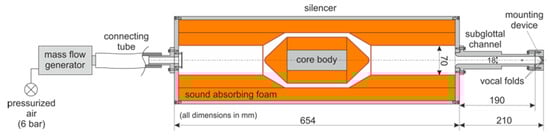
Figure 3.
(Color online) (A) Schematic diagram of the synthetic larynx model including the mass flow generator, silencer, subglottal channel, and mounting device for the synthetic vocal folds (distances are in millimeters).
The silicone-based vocal fold model is shown in Figure 4, and its dimensions are those appropriate for the human scale. The glottal thickness of the human larynx is about 0.35 cm, and its glottal length is near 1.5 cm. Data will be reported below with two single-layer vocal fold models fabricated from mixtures of two-component Smooth-On EcoFlex 30 (Smooth-On, Inc., Macungie, PA, USA) and Smooth-On Silicone Thinner flexibilizer [17]. The first of these, Model 113, contains a smaller amount of silicone thinner than the second, Model 114. Accordingly, the Young’s modulus for Model 113 is 4.4 kPa, and that for Model 114 is 2.5 kPa. These values are in the range of those for which Zhang, Neubauer, and Berry [15] observed oscillations driven by aerodynamic forces. These Young’s moduli were determined with a hybrid experimental-numerical technique described in the papers of Rupitsch et al. [29] and Ilg et al. [30]. The geometry of the vocal folds shown in Figure 4 was chosen to closely approximate the model developed by Thomson, Mongeau, and Frankel [31,32]. Thomson et al. used the scaled-up rigid model M5 developed by Scherer et al. [33] as their guide. The larynx model shown in Figure 3 and Figure 4 readily developed oscillations whose frequencies ranged from about 110 Hz to 150 Hz when the flow rates were set in the range from 60 to 120 L/min.
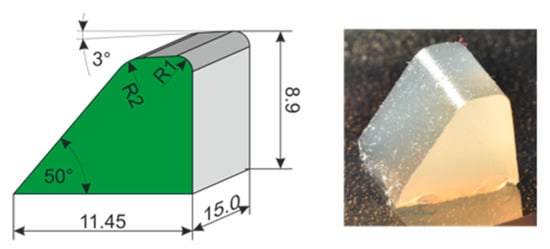
Figure 4.
(Color online) Schematic diagram and photograph of the synthetic silicone model of one of the vocal folds (distances are in millimeters). R1: radius 1 mm; R2: radius 2 mm.
The supraglottal channel with a variable lateral displacement D is shown [17] in Figure 5. It is bounded by two large glass plates that define the extent of one of the directions perpendicular to the direction of airflow and by two smaller aluminum plates that define the extent of the other direction perpendicular to the direction of airflow. The displacement D varied from 1.8 to 7.8 cm in the course of the experiments. Since the other perpendicular direction remains constant at 1.5 cm, the area of the vocal tract varies from 2.7 cm2 to 11.7 cm2 in the course of the experiments. The length of the vocal tract is 19.0 cm.
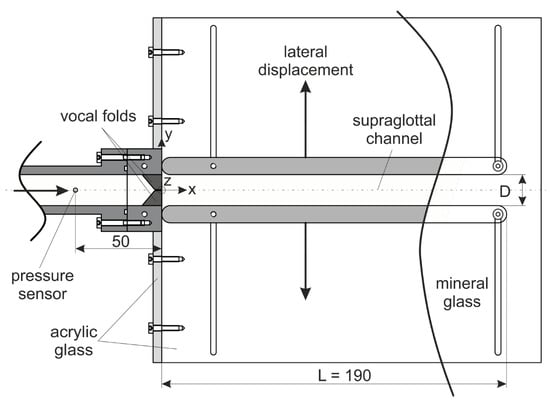
Figure 5.
Schematic diagram of the supraglottal channel that allows for the variation of the lateral displacement D (distances are in millimeters).
The supraglottal channel used for the variable length measurements [18] is shown in Figure 6. The vocal tract is now composed of sections. The first of these is 4.0 cm long, and each of the other sections is 5.0 cm long. Up to 11 of these 5.0 cm sections may be employed; thus, the vocal tract length varies from 4.0 cm to 59.0 cm. The cross-sectional area of each part of the vocal tract is 1.8 cm by 1.5 cm, or 2.7 cm2, which is the same as the smallest area used in the experiments with the variable cross-sectional dimensions. Each of the channel segments was fabricated by an Additive Manufacturing process controlled by an in-house, self-designed 3D printer. Due to its reliability and availability, fused layer modeling, which was invented by Scott Crump [34], was chosen to implement the additive manufacturing technology.
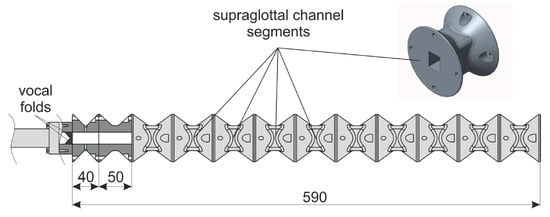
Figure 6.
Segmented vocal tract model used to vary the length of the vocal tract (distances are in millimeters).
The subglottal pressure was measured by a Kulite XCQ-093-SG pressure transducer (Kulite Semiconductor Products Inc., Leonia, NJ, USA). It was mounted flush with the wall in the subglottal channel, as shown in Figure 5, and located 5.0 cm upstream from the exit plane for the flow from the vocal folds. The signal of the transducer was amplified by a custom designed amplifier and sampled by an NI PXIe 6356 multi-functional acquisition board using a sampling rate of fs = 44.1 kHz.
2.3. Onset Detection: Methodology
The subglottal onset pressure (threshold pressure) was determined with the following systematic procedure similarly used [35]: pressure recordings began as the mass flow generator reached a flow rate near 65 L/min. Then, the flow rate was increased uniformly to about 120 L/min in 11.9 s. Subsequently, the flow rate was decreased uniformly to less than 65 L/min in the same time interval. The subglottal pressure readings are shown by the rapidly oscillating black curve of Figure 7.
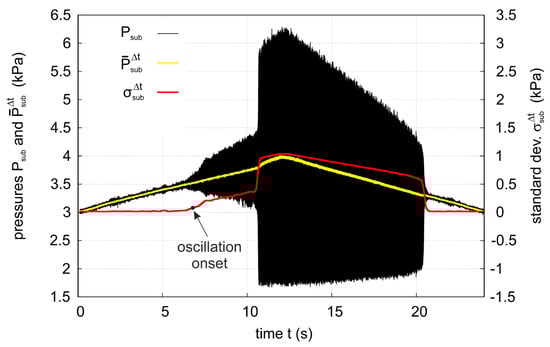
Figure 7.
(Color online) Subglottal pressure (black), its moving average (yellow), and its standard deviation (red) during one cycle of the variable flow rate.
The key to interpreting these data is the moving average subglottal pressure PΔtsub(tm) (equivalent to introducing a low-pass filter) defined in a time interval about tm as follows [17,36]:
where q = Δt fs = 10,000 counts the number of points in the sample. The time interval Δt is set to 0.23 s, so that the sum of Equation (10) includes pressure values from 32 oscillations for Model 113 and 25 oscillations for Model 114. The pressure PΔtsub(tm) is represented by the thick yellow curve of Figure 7. When the pressure is near 3.5 kPa, the character of the pressure oscillations changes because of a noticeable change of amplitude. This qualitative difference may be used to define the onset pressure. The change in the amplitude of the oscillations near the threshold is apparent, although the size of this amplitude is less than 100 Pa, which is about 3% of the size of the total pressure signal near the threshold. Pressure oscillations of this size are consistent with one’s expectation for small amplitude oscillations near the threshold. At the onset, the corresponding oscillation amplitude of the vocal folds is much smaller—less than 1 mm, as indicated in Lodermeyer et al. [36]. Furthermore, the typical convergent-to-divergent glottal duct shape evolution during an oscillation cycle is visible but less pronounced at the onset pressure.
A second qualitative change in the oscillation amplitude is observable between 10–11 s. This change defines the transition to a second type of oscillation, where the amplitude has become large enough so that the vocal folds close during the cycle. However, it is the pressure of the first type of oscillation at onset conditions that is the focus of this work [37,38]. Past 11 s, the amplitude of the pressure oscillation decreases at a more or less uniform rate, until it drops abruptly to a much smaller amplitude between 20–21 s, which is a signal that the vocal fold oscillations have ceased. This point of change is used to define a pressure offset, and one can see that it is lower than the onset threshold. The offset pressure values observed by Titze et al. were always smaller than the corresponding onset pressure [3,5]. The difference in oscillation onset and offset pressure is often described as a hysteresis phenomenon [39].
In order to define the pressure onset, it is convenient to introduce the moving standard deviation as a measure of the size of the oscillations about the moving average, whose square is given by:
This quantity is represented by the red curve in Figure 7, where its magnitude is given by the scale on the right side of the figure. For the smaller oscillations that occur when t < 5.0 s, σΔtsub is between 10–15 Pa. Thus, the criterion used to define onset pressure is that σΔtsub > 50 Pa. This criterion gives Psub near 3.5 kPa for the measurements of Figure 7. Each flow rate increase and decrease cycle was repeated five times, so that the procedure used to determine the subglottal pressure lasted about 120 s. The values for Psub required to initiate each of the five oscillations were averaged. Thus, the measured value of the Psub was recorded as 3.52 kPa for Model 113 when the lateral channel wall displacement was D = 1.8 cm. Five more measurements of Psub were made with D = 2.8 cm, 3.8 cm, 4.8 cm, 5.8 cm, and 7.8 cm, respectively.
3. Results and Discussion
Measurements of the threshold pressure for six vocal tract areas ranging from 2.70 cm2 to 11.70 cm2 are shown in Figure 8a. The value 1.0 is chosen for the entrance loss coefficient kent, since the measurements of kent for larger pressures [23] tend to approach 1.0. The geometrical parameters are determined from the dimensions of the experiments; that is, LVT = 19.0 cm, Lg = 1.5 cm, and T = 0.35 cm. The parameters B and c are chosen so that the calculated result is the same at the measured pressure (3520 Pa) at AVT = 2.70 cm2, and the parameters k and m are chosen so that the calculated frequency fits the measured frequency (139 Hz) at AVT = 2.70 cm2. The prephonatory half-width is ξ0 = 0.20 cm for each of the calculations shown in Figure 8. This value was not measured during the experiments, but it was considered to be reasonable from observations of the separation of the vocal folds at the pressure when sustained oscillations become possible [37]. The fit to the first four pressure measurements is very reasonable, but the measured pressures are substantially smaller than the calculations for the two larger areas.
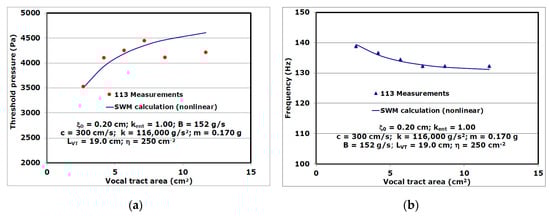
Figure 8.
(Color online) (a) Measured and calculated threshold pressures for vocal tracts with different areas for vocal fold model 113. (b) Measured and calculated frequencies for vocal tracts with different areas for vocal fold model 113.
One explanation is to add a small exit coefficient for the two larger areas. We have found that adding an exit coefficient of 0.05 at AVT = 8.7 cm2 is adequate to reduce the calculated pressure from 4460 Pa to 4040 Pa, which is enough to remove the discrepancy in Figure 8a. This value for the exit coefficient is similar to that calculated from the measurements at larger glottal widths in [23] (Figure 3). A similar reduction occurs at AVT = 11.7 cm2. Another possible source of the discrepancy is the nature of the supraglottal flow pattern, as shown in Figure 9. It was observed to change its character when the cross-section of the vocal tract was large in comparison with the smaller cross-sections [40]. The jet was found to be deflected to either lateral side for AVT = 2.7 cm2, due to the appearance of a large vortex that inhibited the jet from proceeding straight ahead. This large vortex increases the flow resistance in the vocal tract channel. As a consequence, the pressure increases in the supraglottal region immediately downstream of the vocal folds. Upon enlarging the vocal tract, the volume of the large vortex and thus its inertia rise, resulting in a further increase of the supraglottal pressure downstream to the vocal folds, and with it an increase of the subglottal threshold pressure.
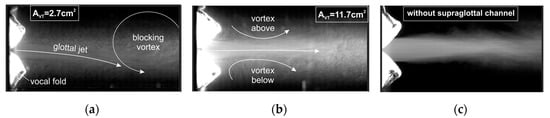
Figure 9.
Flow structures in the supraglottal channel for vocal tract areas (a) 2.7 cm2, (b) 11.7 cm2, and for (c) no vocal tract. Additional information about the flow structures can be found in [40].
For , this large vortex disappears, and two vortices located symmetrically on each side of the flow jet allowed the jet to proceed without deflection. As the flow resistance decreases owing to the vanishing of the inhibiting large vortex, the supraglottal pressure and the concomitant threshold pressure decrease for the larger areas in Figure 8a.
The calculated threshold pressure values in Figure 8a seem to be leveling off as the area of the vocal tract increases. One would expect this, since for larger areas, the vocal tract inertance becomes small (discussion following Equation (1)) and exerts less influence on the pressure required to produce sustained oscillations. Thus, it should be possible to make contact between the large area limit of Figure 8a and the result for no vocal tract. Further calculations confirm this. For example, at AVT = 60.0 cm2, Pth = 4960 Pa, and at AVT = 80.0 cm2, Pth = 4980 Pa. The formula listed in Equation (8) yields Pth = 4963 Pa for this limit, and thus, the calculations for these two larger areas are within 0.4% of the expected value.
Calculations for the frequency of the oscillation at threshold pressure for the six areas of Figure 8a are shown in Figure 8b, where they are compared with the measured frequencies. The fit to the data is very good. This fit requires a nonlinearity parameter (Equation (3)) η = 250 cm−2, which is also present in the calculation of Figure 8a. Adding a nonlinearity parameter is necessary because of the behavior of the amplitude of oscillation as the areas of Figure 8 increase. For example, at AVT = 2.70 cm2, the displacement of the vocal fold from equilibrium varies between −0.051 cm to 0.043 cm and at AVT = 11.70 cm2, the displacement varies from −0.0143 cm to 0.0135 cm. The amplitude decreases monotonically as the vocal tract area increases, and the effective stiffness of the vocal fold decreases, explaining the frequency decrease of Figure 8b. If the nonlinearity parameter is set to equal to zero, then the trend of the calculations does not match the trend of the data.
Given that the spring constant k and Young’s modulus E both measure the force required to produce a deformation ΔL in an object of length L, one would expect there to be a relationship between these two physical quantities. Giambatista et al. [41] show that this relationship may be expressed:
where A is the area of the cross-section of the solid object (perpendicular to L). The geometry of Model 113 and Model 114 was the same, and thus, the effective stiffness of these models should be proportional to the ratio of their Young’s moduli, (E113 = 4.4 kPa and E114 = 2.5 kPa). On the basis of these considerations, one would expect k = 65,900 g/s2 for Model 114.
In analyzing the damping of an oscillator, a dimensionless parameter is sometimes introduced. This parameter measures how close the damping [42,43] is to critical damping It also connects the damping constant B to the oscillator stiffness k and the mass m by the Equation [1]:
Using the parameters listed in Figure 8, the value of is 0.541. With the goal of minimizing the number of free parameters, the same value of is chosen for Model 114. Lowering the value of the mass by about 10% from that used in Figure 8 gives a damping constant B = 109 g/s for Model 114. The change of mass is necessary to fit the measured value of the frequency (110 Hz) for Model 114 at AVT = 2.70 cm2. The results based on Equations (12) and (13) are shown in Figure 10a, where they are compared with measurements. The fit of Figure 10a is of a similar quality to that of Figure 8a; that is, the calculated values for threshold pressure are in reasonable agreement with the measurements for the four smaller areas of Figure 10a. However, the same discrepancy appears at the two larger areas, and the cause of this discrepancy is likely to be the same as that for Figure 8a. Choosing the nonlinear parameter η = 190 cm−2 gives a good fit to the frequency data presented in Figure 10b.
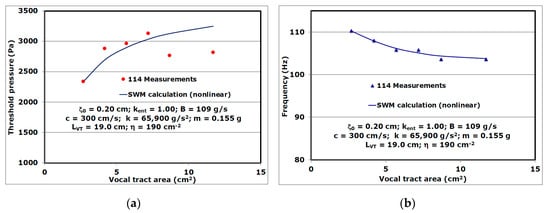
Figure 10.
(Color online) (a) Measured and calculated threshold pressures for vocal tracts with different areas for vocal fold model 114. (b) Measured and calculated frequencies for vocal tracts with different areas for vocal fold model 114.
The mixture of Ecoflex and Silicone Thinner used to make the vocal fold model for the length experiments is the same as that used for the 113 experiments, as described in Section 2.2. Thus, its Young’s modulus is expected to be 4.4 kPa, and all of the elastic and damping parameters are expected to be the same as those listed in Figure 8. The mass flow generator, the silencer, and the subglottal channel are the same as those used for the experiments of Figure 8, and the pressure sensor is located 5.0 cm upstream from the vocal tract, as before. The pressures and frequencies are determined in the same way as described in Section 2.3.
Twelve measurements [18] of the threshold pressure taken for vocal tracts of different lengths (Figure 6) are shown in Figure 11a. Since the elastic and damping parameters are the same as in the experiments shown in Figure 9a, one might expect the threshold pressure for LVT = 19.0 cm and AVT = 2.7 cm2 to be the same as that for the smallest area of Figure 8a. However, this is not the case. In order to account for the difference, the prephonatory half-width for Figure 11a is adjusted to 0.172 cm to fit the pressure (3061 Pa) at LVT = 19.0 cm. This difference in prephonatory half-width threshold pressure may have several causes, including slight differences in how the synthetic vocal folds were manually glued in the mounting device. The SWM calculations presented in Figure 11a produce a very reasonable fit to the trend of the threshold pressure data, but they are not especially accurate for either large or small values of LVT. Frequency measurements with the vocal tract of Figure 6 are shown in Figure 11b. Again, a small adjustment from the parameters of Figure 8 was required. In this case, the mass of the vocal folds was increased from 0.170 g to 0.184 g in order to decrease the frequency to 129 Hz at LVT = 19.0 cm and AVT = 2.70 cm. The calculations in Figure 11b reproduce the trends in the data at intermediate and large glottal lengths to a reasonable degree, but do not have the right trend at smaller lengths, where the difference becomes as large as 4% at the smallest length.
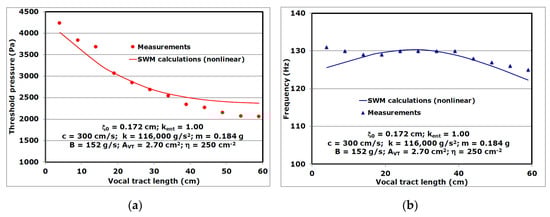
Figure 11.
(Color online) (a) Measured and calculated threshold pressures for model 113 as a function of vocal tract length. (b) Measured and calculated frequencies as a function of vocal tract length.
4. Limitations
In addition to an extensive examination of the validity of Equation (1), another important goal of this study is to evaluate the performance of the SWM. The experiments described in Section 2.2 may also be viewed in the context of validation experiments, although they are restricted to a one-layer silicone model. The effects of different vocal fold shapes and dynamics as well as prephonatory settings of the laryngeal cartilages cannot be analyzed with this experimental model. Furthermore, the model also includes a straight rectangular flow channel as a simplified vocal tract. The effects of supraglottal structures as ventricular folds or characteristic geometrical conditions associated with specific vowels (pharyngeal constrictions and partially obstructed channel exits) were neglected. Previous studies have shown that the presence of the ventricular folds significantly reduces the phonation threshold pressure as long as their positions and the gap in between is optimally selected [35,44,45]. Furthermore, the acoustical driving effect of vocal tract resonances was minimized. By considering the subglottal and supraglottal channel as quarter-wave resonators, the first resonance occurs at 451 Hz, which is significantly higher than the fundamental frequency of the vocal fold oscillation [40].
Beside these limitations and restrictions, the experimental model provides periodic vocal fold motion with corresponding sound production that shows characteristic features of human phonation process. Therefore, it is well applicable for the validation of the SVM model owing to its simplicity, and the ease with which the independent variables are controlled.
5. Conclusions
A number of calculations with lumped element models have used the inertance of the air in the vocal tract [1,2,6,7,8,9,10,11,12] to describe the effects of the airflow in the vocal tract (Equation (1)). In most cases, these calculations focused on a number of properties of phonation with little emphasis on the questions of the validity of using Equation (1) to describe the inertance. Thus, it is important to know under what circumstances the inertance of the air within the vocal tract is adequate to describe these effects. This study was undertaken in order to examine this question.
The inertance of the vocal tract depends directly on the vocal tract length LVT and inversely on the vocal tract area AVT. Thus, Equation (1) predicts how the vocal tract area and the vocal tract length should affect phonation properties near the threshold, such as the onset pressure and frequency near onset. In this work, Equation (1) is used in conjunction with the SWM developed by Titze [2], since the SWM introduces a smaller number of parameters than the two-mass model [1] or the three-mass model [46]. Qualitative arguments are presented in the Introduction chapter to show that increasing the vocal tract area should raise the onset pressure. These qualitative arguments are examined by the SWM calculations presented in Figure 8a and Figure 10a. Reasonable agreement between the calculations and measurements is presented in Figure 8a and Figure 10a for the four smaller areas, but the discrepancy is considerable for the two largest areas. An examination of the supraglottal flow reveals changes in the locations of the vortical structures downstream of the vocal folds, which may be the reason. However, a better understanding of the fluid dynamics would require a more fundamental calculation based on the Navier–Stokes equation to allow a more thorough examination of the discrepancy and further clarify the role that the inertial properties of the air in the vocal tract play in determining the phonation onset. The agreement between the SWM calculations and the measurements for the frequencies at threshold is much better, as shown in Figure 8b and Figure 10b, provided that the nonlinear stiffness effects are included.
The qualitative arguments discussed in the Introduction also predict that increasing the length of the vocal tract should lower the onset pressure. These arguments are supported by the SWM calculations. The results presented in Figure 11a show reasonable agreement between the SWM calculations and the measurements. The frequency calculations presented in Figure 11b show good agreement between the calculations and the measurements for most of the larger lengths, but the wrong trend at the two smallest lengths. Again, the nonlinearity in the stiffness is essential, since otherwise, the variation of the calculated frequencies with length would be much larger than that obtained in the measurements.
The experimental models and the SWM reproduce the same behavior: the phonation threshold pressure is reduced by increasing the vocal fold length and decreasing the vocal tract area.
Due to their inherent simplicity and the versatility of the models, they should have a potential role in optimization or deep learning algorithms. On the basis of endoscopic high-speed video footage from patients, the model can be applied to estimate the subglottal oscillation threshold pressure similar to the methodology reported by Gomez et al. [47,48]. Assuming a high accuracy of the estimation, the methods make an important parameter available for evaluating the effort that a patient has to make to phonate.
Author Contributions
Conceptualization, L.F., A.L. and S.K.; Methodology, L.F., A.L. and S.K.; software, L.F.; validation, A.L. and S.K.; formal analysis, L.F., G.K. and S.K.; investigation, L.F., A.L. and S.K.; resources, L.F. and S.B.; data curation, L.F., S.K. and G.K.; writing—original draft preparation, L.F. and S.K.; writing—review and editing, L.F., A.L. and S.K.; visualization, L.F., G.K. and S.K.; supervision, L.F., S.B. and S.K.; project administration, L.F., S.K.; funding acquisition, L.F. and S.K.
Funding
This research was funded by Alexander von Humboldt Stiftung and the Else-Kröner-Fresenius Stiftung, grant agreement no. 2016_A78.
Conflicts of Interest
The authors declare no conflict of interest. The funders had no role in the design of the study; in the collection, analyses, or interpretation of data; in the writing of the manuscript, or in the decision to publish the results.
References
- Ishizaka, K.; Flanagan, J. Synthesis of voiced sounds from a two-mass model of the vocal cords. Bell Syst. Tech. J. 1972, 51, 1233–1268. [Google Scholar] [CrossRef]
- Titze, I. The physics of small amplitude oscillation of the vocal folds. J. Acoust. Soc. Am. 1988, 83, 1536–1552. [Google Scholar] [CrossRef]
- Titze, I.; Schmidt, S.; Titze, M. Phonation threshold pressure in a physical model of the vocal fold mucosa. J. Acoust. Soc. Am. 1995, 97, 3080–3084. [Google Scholar] [CrossRef]
- Chan, R.; Titze, I.; Titze, M. Further studies of phonation threshold pressure in a physical model of the vocal fold mucosa. J. Acoust. Soc. Am. 1997, 101, 3722–3727. [Google Scholar] [CrossRef]
- Chan, R.; Titze, I. Dependence of phonation threshold pressure on vocal tract acoustics and vocal fold tissue mechanics. J. Acoust. Soc. Am. 2006, 119, 2351–2362. [Google Scholar] [CrossRef]
- Fulcher, L.; Scherer, R. Phonation threshold pressure: Comparison of calculations and measurements taken with physical models of the vocal fold mucosa. J. Acoust. Soc. Am. 2011, 130, 1597–1605. [Google Scholar] [CrossRef]
- Flanagan, J.; Landgraf, L. Self-oscillating source for vocal-tract synthesizers. IEEE Trans. Audio Electroacoust. 1968, 16, 57–64. [Google Scholar] [CrossRef]
- Koizumi, T.; Taniguchi, S.; Hiromitsu, S. Two-mass models of the vocal cords for natural sounding voice synthesis. J. Acoust. Soc. Am. 1987, 82, 1179–1192. [Google Scholar] [CrossRef]
- Koizumi, T.; Taniguchi, S.; Hiromitsu, S. Reply to ‘Two-mass model of the vocal cords for natural sounding voice synthesis‘. J. Acoust. Soc. Am. 1989, 85, 2221–2223. [Google Scholar] [CrossRef]
- Pelorson, X.; Hirschberg, A.; van Hassel, R.; Wijnands, A.; Auregan, Y. Theoretical and experimental study of quasisteady-flow separation within the glottis during phonation. Application to a modified two-mass model. J. Acoust. Soc. Am. 1994, 96, 3416–3431. [Google Scholar] [CrossRef]
- De Mul, F.; George, N.; Qiu, Q.; Rakhorst, G.; Schutte, H. Depth kymography of vocal fold vibrations: Part II. Simulations and direct comparisons with 3 D profile measurements. Phys. Med. Biol. 2009, 54, 3955–3977. [Google Scholar] [CrossRef]
- Cisonni, J.; van Hirtum, A.; Pelorson, X.; Willems, J. Theoretical simulation and experimental validation of inverse quasi-one-dimensional steady and unsteady glottal flow models. J. Acoust. Soc. Am. 2008, 124, 535–545. [Google Scholar] [CrossRef]
- Zhang, Z.; Neubauer, J.; Berry, D. The influence of subglottal acoustics on laboratory models of phonation. J. Acoust. Soc. Am. 2006, 120, 1558–1569. [Google Scholar] [CrossRef]
- Gupta, V.; Wilson, T.; Beavers, G. A model for vocal cord excitation. J. Acoust. Soc. Am. 1973, 54, 1607–1617. [Google Scholar] [CrossRef]
- Zhang, Z.; Neubauer, J.; Berry, D. Influence of vocal fold stiffness and acoustic loading on flow-induced vibration of a single-layer vocal fold model. J. Sound Vib. 2009, 322, 299–313. [Google Scholar] [CrossRef]
- Lucero, J.; Lourenco, K.; Hermant, N.; Van Hirtum, A.; Pelorson, X. Effect of source-tract acoustical coupling on the oscillation onset of the vocal folds. J. Acoust. Soc. Am. 2012, 132, 403–411. [Google Scholar] [CrossRef]
- Kniesburges, S. Fluid-Structure-Acoustic Interaction during Phonation in a Synthetic Larynx Model. Ph.D. Thesis, Friedrich-Alexander Universitaet Erlangen-Nuernberg, Erlangen, Germany, 2014. [Google Scholar]
- Kähler, G. Acoustic Phonetic Study of Additive Manufactured Supra-Glottal Geometries. Master’s Thesis, Friedrich-Alexander University Erlangen-Nürnberg, Erlangen, Germany, 2016. [Google Scholar]
- Titze, I. Phonation threshold pressure measurement with a semi-occluded vocal tract. J. Speech Lang. Hear. Res. 2009, 52, 1062–1072. [Google Scholar] [CrossRef]
- Titze, I. Voice training and therapy with a semi-occluded vocal tract: Rationale and scientific underpinnings. J. Speech Lang. Hear. Res. 2006, 49, 448–459. [Google Scholar] [CrossRef]
- Agarwal, M.; Scherer, R.; Holien, H. The false vocal folds: Shape and size in frontal view during phonation based on laminagraphic tracings. J. Voice 2003, 17, 97–113. [Google Scholar] [CrossRef]
- Plexico, L.; Sandage, M.; Faver, K. Assessment of phonation threshold pressure: A critical review and clinical applications. Am. J. Speech Lang. Pathol. 2011, 20, 348–366. [Google Scholar] [CrossRef]
- Fulcher, L.; Scherer, R.; Powell, T. Pressure distributions in a static physical model of the uniform glottis: Entrance and exit coefficients. J. Acoust. Soc. Am. 2011, 129, 1548–1553. [Google Scholar] [CrossRef] [PubMed]
- Fulcher, L.; Scherer, R.; Anderson, N. Entrance loss coefficients and exit coefficients for a physical model of the glottis with convergent angles. J. Acoust. Soc. Am. 2014, 136, 1312–1319. [Google Scholar] [CrossRef] [PubMed]
- Steinecke, I.; Herzel, H. Bifurcations in an asymmetric vocal fold model. J. Acoust. Soc. Am. 1995, 97, 1874–1884. [Google Scholar] [CrossRef] [PubMed]
- Tokuda, I.; Horacek, J.; Svec, J.; Herzel, H. Comparison of biomechanical modeling of register transitions and voice instabilities with excised larynx experiments. J. Acoust. Soc. Am. 2007, 122, 519–531. [Google Scholar] [CrossRef] [PubMed]
- Lucero, J. Dynamics of the two-mass model of the vocal folds: Equilibria, bifurcations, and oscillation region. J. Acoust. Soc. Am. 1993, 94, 3104–3111. [Google Scholar] [CrossRef]
- Durst, F.; Heim, U.; Ünsal, B.; Kullik, G. Mass flow rate control system for time-dependent laminar and turbulent flow investigations. Meas. Sci. Technol. 2003, 14, 893–903. [Google Scholar] [CrossRef]
- Rupitsch, S.; Ilg, J.; Sutor, A.; Lerch, R.; Döllinger, M. Simulation based estimation of dynamic mechanical properties of viscoelastic materials used for vocal fold models. J. Sound Vib. 2011, 330, 4447–4459. [Google Scholar] [CrossRef]
- Ilg, J.; Rupitsch, S.; Sutor, A.; Lerch, R. Determination of dynamic material properties of silicone rubber using one-point measurements and finite element simulations. IEEE Trans. Instrum. Meas. 2012, 61, 3031–3038. [Google Scholar] [CrossRef]
- Thomson, S.; Mongeau, L.; Frankel, S. Physical and numerical flow-excited vocal fold model. In Proceedings of the Third International Workshop MAVEBA, Florence, Italy, 10–12 December 2003; pp. 147–150. [Google Scholar]
- Thomson, S.; Mongeau, L.; Frankel, S. Aerodyamic transfer of energy to the vocal folds. J. Acoust. Soc. Am. 2005, 118, 1689–1700. [Google Scholar] [CrossRef]
- Scherer, R.; Shinwari, D.; De Witt, K.; Zhang, C.; Kucinsch, B.; Afjeh, A. Intraglottal pressure profiles for a symmetric and oblique glottis with a divergence angle of 10 degrees. J. Acoust. Soc. Am. 2001, 109, 1616–1630. [Google Scholar] [CrossRef]
- Crump, S. Apparatus and Method for Creating Three-Dimensional Objects. US Patent US5121329 A, 10 October 1989. [Google Scholar]
- Kniesburges, S.; Birk, V.; Lodermeyer, A.; Schützenberger, A.; Bohr, C.; Becker, S. Effect of the ventricular folds in a synthetic larynx model. J. Biomech. 2017, 55, 128–133. [Google Scholar] [CrossRef]
- Roderer, H. Digitale Signalverarbeitung, 1st ed.; Vogel Buchverlag: Würzburg, Germany, 2010. [Google Scholar]
- Lodermeyer, A.; Becker, S.; Döllinger, M.; Kniesburges, S. Phase-locked flow field analysis in a synthetic human larynx model. Exp. Fluids 2015, 56, 1–13. [Google Scholar] [CrossRef]
- Lodermeyer, A.; Tautz, M.; Becker, S.; Döllinger, M.; Birk, V.; Kniesburges, S. Aeroacoustic analysis of the human phonation process based on a hybrid PIV approach. Exp. Fluids 2018, 59, 1–15. [Google Scholar] [CrossRef]
- Lucero, J. A theoretical study of the hysteresis phenomenon at vocal fold onset-offset. J. Acoust. Soc. Am. 1999, 105, 423–431. [Google Scholar] [CrossRef] [PubMed]
- Kniesburges, S.; Hesselmann, C.; Becker, S.; Schlücker, E.; Döllinger, M. Influence of vortical structures on the glottal jet location in the supraglottal, region. J. Voice 2013, 27, 531–544. [Google Scholar] [CrossRef] [PubMed]
- Giambattista, A.; Richardson, B.; Richardson, R. College Physics, 3rd ed.; McGraw Hill: Boston, MA, USA, 2010. [Google Scholar]
- Marion, J.; Thornton, S. Classical Dynamics of Particles and Systems, 4th ed.; Saunders College Publishing: Philadelphia, PA, USA, 1995. [Google Scholar]
- Fowles, G.; Cassidy, G. Analytical Mechanics, 7th ed.; Thomson Learning: Boston, MA, USA, 2005. [Google Scholar]
- Bailly, L.; Pelorson, X.; Henrich, N.; Ruty, N. Influence of a constriction in the near field of the vocal folds: Physical modeling and experimental validation. J. Acoust. Soc. Am. 2008, 124, 3296–3308. [Google Scholar] [CrossRef]
- Sadeghi, H.; Kniesburges, S.; Falk, S.; Kaltenbacher, M.; Schützenberger, A.; Döllinger, M. Towards a clinically applicable computational larynx model. Appl. Sci. 2019, 9, 2288. [Google Scholar] [CrossRef]
- Story, B.; Titze, I. Voice simulation with a body-cover model of the vocal folds. J. Acoust. Soc. Am. 1995, 97, 1249–1260. [Google Scholar] [CrossRef]
- Gómez, P.; Schützenberger, A.; Kniesburges, S.; Bohr, C.; Döllinger, M. Physical parameter estimation from porcine ex vivo vocal fold dynamics in an inverse problem framework. Biomech. Model. Mechanobiol. 2018, 17, 777–792. [Google Scholar] [CrossRef]
- Gómez, P.; Schützenberger, A.; Semmler, M.; Döllinger, M. Laryngeal pressure estimation with a recurrent neural network. IEEE J. Transl. Eng. Health Med. 2019, 7, 8590726. [Google Scholar] [CrossRef]


© 2019 by the authors. Licensee MDPI, Basel, Switzerland. This article is an open access article distributed under the terms and conditions of the Creative Commons Attribution (CC BY) license (http://creativecommons.org/licenses/by/4.0/).