Featured Application
The prepared MIHs doped with positively charged Au NPs show excellent surface-enhanced Raman scattering activity, could be used as efficient SERS substrates for the detection of synthetic colorants.
Abstract
A polyacrylamide-based molecularly imprinted hydrogel (MIH) doped with positively charged gold nanoparticles (Au NPs) has been synthesized via a free radical polymerization of acrylamide (AM) aqueous solution containing positively charged Au NPs as a Raman active substrate, New Red colorant as a template molecule, N,N’-methylenebis(acrylamide) as a crosslinking agent, and potassium persulfate as an initiator. The Au NPs-doped MIHs were subsequently explored as a Raman active substrate for the sensitive and selective detection of New Red colorant via surface-enhanced Raman spectroscopy (SERS). The logarithmic intensity of the characteristic peak of New Red at 1572 cm−1 was proportional to the logarithmic concentration of New Red with a detection linear range of 1.64 × 10⁻⁶ to 1.64 × 10⁻⁴ M and a limit of detection (LOD) of 1.64 × 10⁻⁷ M. The recoveries ranged from 86.3% to 100.6% with a relative standard deviation (RSD) in the range of 2.3% to 7.7%. The RSD and recovery rates for the detection of New Red spiked in a sports drink sample were 1.8% to 7.7% and 91.0% to 97.1%, respectively. These results showed that SERS combined with MIHs as Raman active substrates could provide a sensitive, selective, and effective approach for the detection of the New Red colorant in beverage matrix.
1. Introduction
New Red is a water-soluble azo synthetic colorant, which was synthesized by Chinese researchers [1] and permitted for use only in China. As a color additive, New Red can be used in beverages, decorative fruits and vegetables, candies, and other foods in China according to Chinese national standard GB2760-2014. It has been reported that azo-dyes may cause severe damages like hypersensitivity reactions [2,3,4], cytotoxicity [5,6,7], hyperactivity [8,9], carcinogenicity, and mutagenicity [10,11,12]. Therefore, the presence of synthetic azo colorants in foods is rigidly controlled by laws and regulations in China and some other countries. The maximal addition limit for New Red is 50.0–100 μg/kg in foods and beverages in China according to GB2760-2014. However, New Red might be illegally used because of its advantages of low price, high solubility, effective tinting, and good stability. In order to prevent food fraud and for food safety reasons, there remains an urgent need to develop a sensitive, selective, rapid, and effective analytical method for detection of New Red in food and beverage matrix.
Currently, New Red is generally determined by high-performance liquid chromatography (HPLC) coupled with various detectors such as diode array detector (DAD) [13,14,15], ultraviolet detector [16], and tandem mass spectrometry (MS/MS) [15,17]. However, the HPLC equipment is relatively expensive, and the detection via HPLC involves complicating operations. Especially, the HPLC cannot complete on-site detections due to the non-portability of the equipment. Therefore, novel portable analytical methods featured with low cost, high sensitivity and high selectivity are especially desirable.
Surface-enhanced Raman spectroscopy (SERS) is a convenient technique with high sensitivity, fast determination, and low cost, and has been widely applied in food safety analysis [18,19,20,21,22,23,24], environmental monitoring [25,26], protein immunoassay [27,28,29,30,31], and other fields. In recent years, SERS has attracted considerable attention because it can reveal structure, composition, and concentration of target molecules even at a single-molecule level by measuring fingerprint characteristics of target molecules [32,33]. However, a satisfactory SERS sensor requires not only high sensitivity but also tunable selectivity, high stability, and multiple recyclability during practical applications. In particular, considering the complicated fingerprint spectrum of each molecule, it is very challenging to selectively identify a specific molecule in a complicated sample matrix due to the interference of other components in the samples.
Molecularly imprinted hydrogels (MIHs) are a type of molecularly imprinted polymers (MIPs), which contain specific cavities designed for a target molecule (template) [34]. These three-dimensional cavities are complementary to the template in terms of shape recognition, hydrogen bonding, size, and functional groups and therefore MIHs have very high specificity and absorbability for the template molecules. Recently, the combination of MIPs and SERS were constructed to detect and quantify histamine [35], melamine [36], chloramphenicol [37], Sudan I [38], chlorpyrifos [39], and α-tocopherol [40] in different food products. However, the major disadvantage of MIPs is the slow binding process caused by the sluggish diffusion of template molecules into and out of the binding sites due to the rigid cross-linked MIPs networks in the MIPs matrix. MIPs usually have high crosslinking densities and the dense and highly cross-linked networks in MIPs block the diffusion of the template molecules and slow down the binding process [41,42,43]. A hydrogel is a jelly-like solid that contains a network of polymer chains and is highly absorbent for water. MIHs remain a large quantity of water in the gels and thus MIHs have excellent biocompatibilities and have been widely applied in biomedical areas [44,45,46,47]. The large quantity of water plays a role as a solvent and promotes fast diffusion of the template molecules into and out of the cavities. Accordingly, MIHs often exhibit fast diffusion and binding kinetics.
It has been reported that Ag-doped MIHs could be employed as a substrate for SERS measurement of bovine serum albumin (BSA) [44]. The limit of the detection of BSA was as low as 10−8 mol/L, indicating the strong feasibility of combining MIHs and SERS to acquire rapid and sensitive biomarker detections. The primary objective of this study is to combine the MIHs and SERS together to construct a novel positively charged gold nanoparticles (Au NPs)-embedded MIHs for a fast, sensitive, and selective detection of New Red. New Red molecule contains functional groups of sulfonate (-SO3H) and thus, the sulfonate anions show strong affinity to positively charged Au NPs through electrostatic adsorption interactions. The MIH was prepared by free radical polymerization of acrylamide (AM) aqueous solution containing positively charged Au NPs as a SERS active substrate, New Red as a template molecule, N,N’-methylenebis(acrylamide) as a crosslinking agent, and potassium persulfate as an initiator, as shown in Figure 1. After polymerization, the New Red template was washed out and the MIH was dried and crushed. The dry MIHs could quickly swell up in aqueous solution and selectively reuptake New Red from water. This process was promoted by the electrostatic interactions. As positively charged Au NPs in the swelled MIHs was an excellent SERS active substrate, the subsequent laser excitation on MIHs produced strong SERS signals characteristic of New Red. Therefore, the positively charged gold nanoparticles-embedded MIHs provided a selective and sensitive SERS substrate for the detection of New Red. The synthesis and characterization of positively charged Au NPs and MIHs, the selectivity of MIPs for New Red, and the limit of detection (LOD) of New Red as well as the corresponding linearity range were investigated in this work.
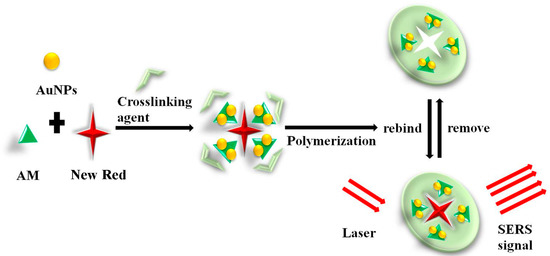
Figure 1.
Schematic illustration of the preparation and recognition of molecularly imprinted hydrogel (MIH) and its application in surface-enhanced Raman spectroscopy (SERS) detection of New Red.
2. Materials and Methods
2.1. Instruments and Reagents
The morphology of colloidal gold particles and Au NPs-embedded MIHs were observed on a transmission electron microscope (TEM, Tecnai G2 F30 S-Twin, FEI Company, Hillsboro, OR, Netherlands) operating at an acceleration voltage of 300 kV. The TEM was equipped with an energy dispersive X-ray (EDX) analyzer (DPP-II). The zeta potential and the size of Au NPs were measured using dynamic light scattering instrument (DLS, Nano-ZS90, Malvern Instrument, Worcs, UK) equipped with a 628 nm laser source. SERS spectra were collected on a DeltaNu 785 Raman spectrometer (DeltaNu Inc., Laramie, WY, USA). The laser power of the spectrometer is 120 mW with an excitation wavelength at 785 nm and a spectral range of 200 to 2000 cm−1. The spectra were acquired with baseline off using NuSpec software (Copyright DeltaNu 2009) and analyzed using GRAMS/AI software (Ver 9.1, Thermo Fischer Scientific, Waltham, MA, USA).
Chloroauric acid (HAuCl4·4H2O, 99%) was purchased from Shanghai Civi Chemical Technology Co., Ltd. (Shanghai, China). Cysteamine (95%), Erythrosin B sodium (85%), and Allura Red (85%) were supplied by Shanghai Macklin Biochemical Co., Ltd. (Shanghai, China). New Red (98%) and Amaranth (98%) were bought from Shanghai Jinpan Biotechnology Co., Ltd. (Shanghai, China). Acrylamide (98%) was obtained from Shanghai Aladdin Bio-Chem Technology Co., Ltd. (Shanghai, China). Sodium borohydride (NaBH4, 98%) and N,N’-methylenebis(acrylamide) (97%) were from Shanghai Aladdin Bio-Chem Technology Co., Ltd. (Shanghai, China). Potassium persulfate (AR) was purchased from Sinopharm Chemical Reagent Co., Ltd. (Shanghai, China). Methanol (≥99.5%) and acetic acid (≥99.5%) were obtained from Shanghai Lingfeng Chemical Reagent Co., Ltd. (Shanghai, China). Distilled water was used throughout the experiments.
2.2. Synthesis of Positively Charged Au NPs
Prior to experiments, all glasswares were bathed in freshly prepared aqua regia (v/v HNO3:HCl = 1:3) for 4 h, then rinsed thoroughly with distilled water, and dried prior to use. The positively charged gold nanoparticles were synthesized according to the literature [48]. Briefly, 50.0 mL of HAuCl4·4H2O solution (1.42 mM) and 500 μL of cysteamine solution (213 mM) were added to a clean round-bottomed flask. The solution was mildly stirred with a magnetic bar at a stirring speed of 100 rpm for 1 h at room temperature. Subsequently, 12.5 μL of NaBH4 solution (10.0 mM) was added to the mixture, and it was vigorously stirred at a stirring speed of 500 rpm at room temperature in dark for 1 more hour. Finally, a wine-red solution of positively charged gold nanoparticles with an average diameter of 49.0 ± 0.9 nm was obtained and stored in a refrigerator at 4 °C for later use.
2.3. Preparation of Positively Charged Au NPs-embedded MIHs and Non-Imprinted Hydrogels (NIHs)
A typical procedure for the synthesis of positively charged Au NPs-embedded MIHs is as follows. First, 1.0 g of acrylamide was dissolved in 4.0 mL above positively charged Au NPs solution in a 20 mL glass tube, and then 0.1 g of N,N’-methylenebis(acrylamide) and 1.0 mg of New Red were added to the solution. The solution was degassed with nitrogen gas and kept in an ultrasonic bath for 10 min to achieve complete homogenization at room temperature. Then, 0.1 mL of potassium persulfate solution (0.15 M in water) was injected into the reaction tube. The glass tube was tightly sealed, and the polymerization was carried out at 50 °C for 12 h. After the polymerization, a red, jelly-like, Au NPs and New Red-containing MIH was obtained.
In order to remove the New Red template from MIHs, the obtained MIHs were dried and crushed in a mortar and ground to pass through a 300-mesh stainless-steel sieve. Then, the MIH powders were put into a Soxhlet extractor and were washed with a solution of methanol:acetic acid (9:1, v/v) for 60 h until the New Red could not be detected in the MIHs by SERS.
By comparison, positively charged Au NPs-containing non-imprinted hydrogels (NIHs) were synthesized according to the same procedure in the absence of New Red. All hydrogels were vacuum dried overnight before they were used in re-binding studies.
2.4. Detection of New Red using Positively Charged Au NPs-Embedded MIHs as a Substrate
For the re-binding studies of New Red, 5.0 mg of positively charged Au NPs-embedded MIHs were mixed with 1.0 mL of New Red aqueous solutions at different concentrations (1.64 × 10⁻⁷, 1.64 × 10⁻⁶, 1.64 × 10⁻⁵, 8.18 × 10⁻⁵, 1.64 × 10⁻⁴ M), and the mixture was incubated at room temperature under shaking for 2 h. Then, the mixture was centrifuged at 8000 rpm for 10 min and the supernatant was removed. The precipitated tiny pieces of swelled hydrogels were washed with distilled water and separated by centrifugation. Then, the swelled hydrogels were transferred to a concave glass slide with pipettes and observed under the microscope of Raman spectrometer. The spectrum was recorded, and each spectrum are an average of 10 independent results taken at an integration time of 10 s. The logarithmic intensity of the characteristic peak of New Red at 1572 cm−1 was used to plot against the logarithmic concentration of New Red to build a calibration curve. The detection of New Red using positively charged Au NPs-embedded NIHs as a substrate was performed according to the same procedure described above except that the MIHs were replaced with NIHs.
2.5. Application of the Positively Charged Au NPs-Embedded MIHs in Food Samples
A beverage sample (Gatorade, orange flavored) used in this work was purchased from a local supermarket in Hangzhou, Zhejiang, China. New Red was not detected in the origin sample. To obtain a calibration curve for the detection of New Red, the sample solution was centrifuged at 10,000 rpm for 10 min and then filtered through a 0.25 μm filter membrane. A series of aliquot samples (1.0 mL) were spiked with New Red at concentrations of 1.64 × 10⁻⁶, 8.18 × 10⁻⁵, and 1.64 × 10⁻⁴ M, respectively. Then, the New Red-spiked samples were handled and determined by the procedures described in Section 2.5. Recoveries were calculated and three parallel analyses were performed for each beverage sample. The data are expressed as the mean ± standard deviation (SD).
3. Result and Discussion
3.1. Characterization of the Positively Charged Au NPs
Figure 2a shows the TEM image of positively charged Au NPs. Obviously, the Au NPs have a size range of about 10–50 nm with a number-average diameter of 44.3 ± 6.8 nm (measured by Nano measurer 1.2). The zeta potentials of the Au NPs were determined to be 46.6 ± 1.9 mV by DLS (Figure 2b), indicating that the Au NPs were highly positively charged, and the Au NP solution was stable. Figure 2c demonstrates that the hydrodynamic diameter of the positively charged Au NPs detected by DLS was monomodal with an average size of 49.0 ± 0.9 nm, which was comparable to the average diameter of Au NPs measured by TEM. The EDX spectrum of the Au NPs (Figure 2d) displays Au signal peaks from Au nanoparticles and Cu peaks as well as C peaks from the ultrathin carbon-coated copper grid.
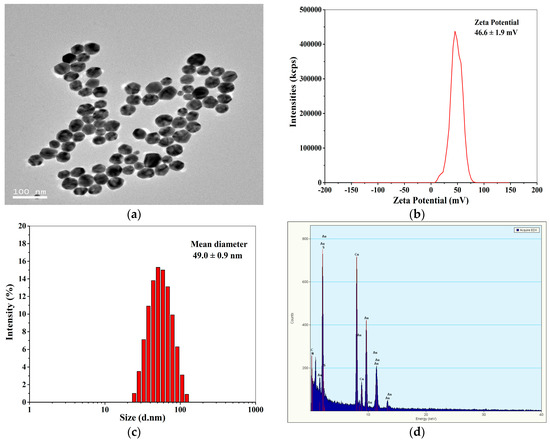
Figure 2.
TEM image (a), Zeta potential distribution (b), size (c), and energy dispersive X-ray (EDX) spectrum (d) of the positively charged Au NPs.
3.2. Characterization of the Positively Charged Au NPs in MIHs
Dry MIHs were ground into fine powders, ultrasonically dispersed in tetrahydrofuran (THF) at room temperature, and transferred onto a carbon-coated copper grid by dipping. The elemental distribution of MIHs was then determined by EDX mapping technique in high-angle annular dark-field scanning transmission electron microscopy (HAADF-STEM) mode. In a selected area (outlined in red in Figure 3a), the corresponding element mapping of gold (Figure 3c,d) from positively charged Au NPs and the mapping of nitrogen (Figure 3e), oxygen (Figure 3f), and carbon (Figure 3g) from polyacrylamide hydrogels clearly indicate that there were a lot of gold nanoparticles distributed in the MIHs, and the MIHs could be served as an SERS active substrate for the detection of New Red.
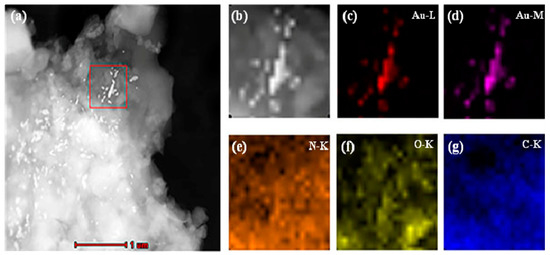
Figure 3.
High-angle annular dark-field scanning transmission electron microscopy (HAADF-STEM) images (a,b) and compositional maps of gold (c,d), nitrogen (e), oxygen (f), and carbon (g) of the positively charged Au NPs-embedded MIHs.
3.3. SERS Selectivity of the Positively Charged Au NPs-Embedded MIHs
To investigate the SERS selectivity of the positively charged Au NPs-embedded MIHs, both the MIHs and the positively charged Au NPs-embedded NIHs were used to adsorb New Red from an aqueous solution of New Red at a concentration of 8.18×10⁻⁵ M, followed by SERS measurements using the two swelled hydrogels as substrates. Figure 4a presents the SERS spectrum of New Red solid powders. Figure 4b shows the spectrum obtained using the Au NPs-embedded MIHs as a substrate. Strong characteristic signals of New Red at 1572 cm−1, 1513 cm−1, 1439 cm−1, 1359 cm−1, 1238 cm−1, and 1144 cm−1 were clearly observed. By contrast, Figure 4c displays the SERS spectrum using Au NPs-embedded NIHs as a substrate, and no notable signal of New Red could be detected. These results demonstrate that the selectivity of the MIHs towards the detection of New Red was quite satisfactory.
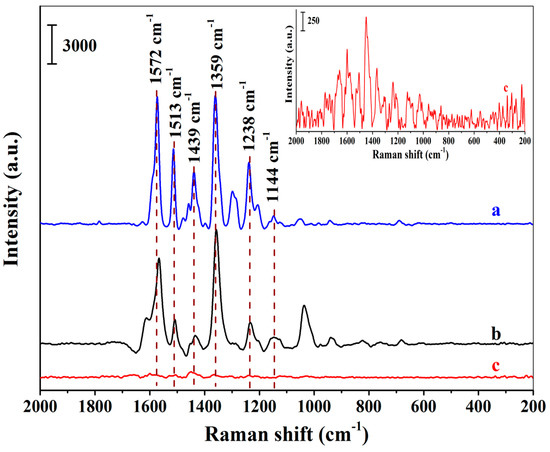
Figure 4.
Surface-enhanced Raman spectroscopy (SERS) spectra of New Red solid powders (a), MIHs absorbing 8.18 × 10⁻⁵ M of New Red (b), and NIHs absorbing 8.18 × 10⁻⁵ M of New Red (c); (Inset: The enlarged spectrum of c).
3.4. SERS Specificity of the Positively Charged Au NPs-Embedded MIHs
To evaluate the specificity of MIHs for the detection of New Red, New Red and its structural analogues (Amaranth, Erythrosine B sodium, and Allura Red) were chosen, and 5.0 mg of the MIHs were incubated with 1.0 mL of aqueous solution of each colorant at a concentration of 1.64 × 10⁻⁵ M for 2 h. Then, the MIHs were used as substrates to measure SERS spectrum of each colorant.
Figure 5a–d demonstrates the SERS spectra using the MIHs as substrates after the MIHs were, respectively, incubated with the solutions of New Red, Erythrosine B sodium, Amaranth, and Allure Red at the concentration of 1.64 × 10⁻⁵ M. Obviously, the four colorants can be readily distinguished according to their corresponding spectrum fingerprint. Strong characteristic signals of New Red at 1572 cm−1, 1513 cm−1, and 1439 cm−1 were observed in Figure 5a. Fairly weak signals of Erythrosine B sodium were detected in Figure 5b. Both Amaranth (Figure 5c) and Allura red (Figure 5d) show no signals at 1572 cm−1, 1513 cm−1, and 1439 cm−1. The results indicate that the three structural analogues did not interfere the detection of New Red when using the positively charged Au NPs-embedded MIHs as substrates and the MIHs indeed possessed imprinted cavities. MIHs were prepared using New Red as a template and, thus, MIHs contained a lot of specific cavities after New Red molecules were removed by washing. These three-dimensional cavities were complementary to New Red molecules in terms of shape recognition, hydrogen bonding, and electrostatic interactions. As a result, Erythrosine B sodium, Amaranth, and Allura Red molecules were very difficult to diffuse into the cavities, and accordingly, cause no interferences to the detection of New Red.
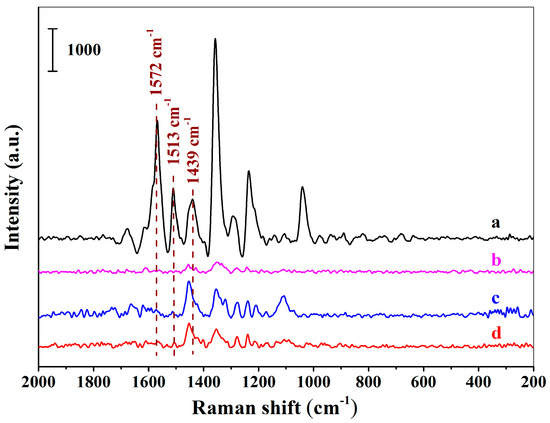
Figure 5.
The SERS spectra acquired using the positively charged Au NPs-embedded MIHs as substrates after the MIHs were respectively incubated with the solutions of New Red (a), Erythrosine B sodium (b), Amaranth (c), and Allure Red (d) for 2 h at the concentration of 1.64 × 10⁻⁵ M.
3.5. Detection of New Red Spiked in Water Using Positively Charged Au NPs-Embedded MIHs as a Substrate
Figure 6 demonstrates a series of SERS spectra of New Red when the positively charged Au NPs-embedded MIH substrate was incubated with a series of New Red aqueous solution at different concentrations. A progressive increment in signal intensity was observed when the New Red concentration increased from 1.64 × 10⁻⁷ to 1.64 × 10⁻⁴ M. A linear plot of the logarithmic intensity of the signal at 1572 cm−1 versus the logarithm of the New Red concentration indicates that the detection is linear within the concentration range from 1.64 × 10⁻⁶ to 1.64 × 10⁻⁴ M with the LOD of New Red at 1.64 × 10⁻⁷ M in water. The linear equation was lgI1572 = 5.66 + 0.46lgCNew Red (lgI1572 refers to the logarithmic intensity at 1572 cm−1; lgC refers to the logarithmic concentration of New Red) and the coefficient of this regression was determined to be R2 = 0.99949.
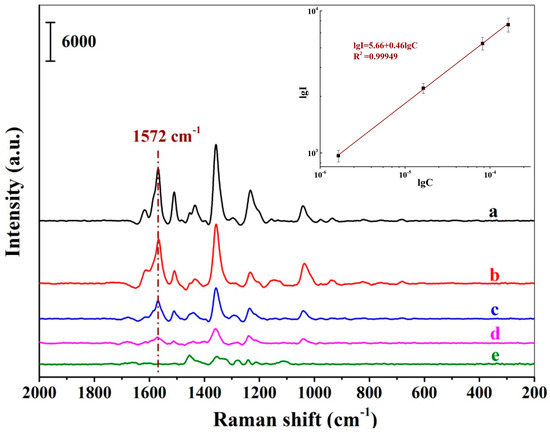
Figure 6.
SERS spectra of New Red using the MIH substrate incubated with aqueous solutions of New Red at concentrations of 1.64 × 10⁻⁴ M (a), 8.18 × 10⁻⁵ M (b), 1.64 × 10⁻⁵ M (c), 1.64 × 10⁻⁶ M (d), and 1.64 × 10⁻⁷ M (e); (Inset: Linear correlation of the logarithmic peak intensity at 1572 cm−1 versus the logarithmic concentrations of New Red).
Table 1 summarizes the recovery and the relative standard deviation (RSD) of the detection of New Red. It can be seen that the recoveries were found to be 86.3% to 100.6% and the values of RSD were in the range of 2.3% to 7.7%. The high recovery and low RSD values achieved in this study illustrated good precision and accuracy of the detection of New Red based on SERS using the MIHs as substrates.

Table 1.
Percentage recoveries and relative standard deviation (RSD) of the detection of New Red spiked in water samples (mean ± SD, N = 3).
3.6. Detection of New Red Spiked in a Sports Drink Using the MIHs as a Substrate
The MIHs were further applied to detect New Redspiked in a sports drink (Gatorade, orange flavored). As shown in Table 2, the recoveries of samples were found to be in the range of 91.0% to 97.1% and the values of RSD were between 1.8% and 7.7%. The good recovery and RSD indicated that the positively charged Au NPs-embedded MIHs were suitable for the detection of New Red in real samples. As the data collection time for a single SERS measurement is 10 s, the total detection time for a real sample would be less than 2.5 h even when the incubation (2 h) and centrifugation (10 min) pretreatments are included.
Table 2.
Percentage recoveries and RSD of the detection of New Red spiked in a sports drink (mean ± SD, N = 3).
The general detection parameters reported in the literature for the determination of New Red are outlined in Table 3. Obviously, the linear range of current method is comparable with other reported methods, and the LOD of current method is better than that of HPLC-UV and HPLC-MS/MS.
Table 3.
Comparison of different methods developed for the detection of New Red with the present work.
4. Conclusions
A new method for the detection of New Red based on SERS using positively charged Au NPs-embedded MIHs as substrates has been established. The MIHs which were synthesized via a free radical polymerization of acrylamide aqueous solution containing positively charged Au NPs, New Red, and N,N’-methylenebis(acrylamide) exhibited high selectivity and specificity to New Red. The linear range was 1.64 × 10⁻⁶ to 1.64 × 10⁻⁴ M and the LOD was 1.64 × 10⁻⁷ M for the detection of New Red spiked in water, and the corresponding recoveries ranged from 86.3% to 100.6% with RSD in the range of 2.3% to 7.7%. The RSD and recovery rates for the detection of New Red spiked in a sports drink sample (Gatorade, orange flavored) were 1.8% to 7.7% and 91.0% to 97.1%, respectively.
Author Contributions
J.N. is responsible for the conceptualization, funding acquisition, and manuscript editing. K.X. performed the synthesis of MIHs doped with positively charged Au NPs, investigated applications of the MIHs doped with positively charged Au NPs as SERS substrates to detect New Red in drink samples, and wrote the original draft; Y.W. and K.J. developed the method for the synthesis of MIHs doped with positively charged Au NPs and used GRAMS/AI software to process the SERS data. Q.Z. analyzed the SERS spectra and verified the SERS data; P.S. contributed the project administration and supervision and provided chemical reagents and materials.
Funding
This research was funded by the National Natural Science Foundation of China (grant number: 31301483). We also appreciate the Natural Science Foundation of Zhejiang Province (grant number: LY17C200016) for support of the experimental studies.
Conflicts of Interest
We declare that there is no conflict of interests in connection with the manuscript submitted. The founding sponsors had no role in the design of the study; in the collection, analyses, or interpretation of data; in the writing of the manuscript, and in the decision to publish the results.
References
- Liu, Z.; Gao, Y. Fundamental Food Additives, 1st ed.; Chinese Light Industry Publishing House: Beijing, China, 1994; pp. 79–80. [Google Scholar]
- Michaelsson, G.; Juhlin, L. Urticaria induced by preservative and dye additives in food and drugs. Br. J. Dermatol. 1973, 88, 525–532. [Google Scholar] [CrossRef] [PubMed]
- Thune, P.; Granholt, A. Provocation tests with antiphlogistica and food additives in recurrent urticaria. Dermatology 1975, 151, 360–367. [Google Scholar] [CrossRef]
- Gross, P.A.; Lance, K.; Whitlock, R.J.; Blume, R.S. Additive allergy: Allergic gastroenteritis due to yellow dye #6. Ann. Intern. Med. 1989, 111, 87–88. [Google Scholar] [PubMed]
- Sako, F.; Kobayashi, N.; Watabe, H.; Taniguchi, N. Cytotoxicity of food dyes on cultured fetal rat hepatocytes. Toxicol. Appl. Pharmacol. 1980, 54, 285–292. [Google Scholar] [CrossRef]
- Ashida, H.; Hashimoto, T.; Tsuji, S.; Kanazawa, K.; Danno, G.I. Synergistic effects of food colors on the toxicity of 3-amino-1,4-dimethyl-5h-pyrido[4,3-b]indole (trp-p-1) in primary cultured rat hepatocytes. J. Nutr. Sci. Vitaminol. 2000, 46, 130–136. [Google Scholar] [CrossRef] [PubMed]
- Kreindler, J.J.; Slutsky, J.; Haddad, Z.H. The effect of food colors and sodium benzoate on rat peritoneal mast cells. Ann. Allergy 1980, 44, 76–81. [Google Scholar] [PubMed]
- McCann, D.; Barrett, A.; Cooper, A.; Crumpler, D.; Dalen, L.; Grimshaw, K.; Kitchin, E.; Lok, K.; Porteous, L.; Prince, E.; et al. Food additives and hyperactive behaviour in 3-year-old and 8/9-year-old children in the community: A randomised, double-blinded, placebo-controlled trial. Lancet 2007, 370, 1560–1567. [Google Scholar] [CrossRef]
- Rowe, K.S.; Rowe, K.J. Synthetic food coloring and behavior: A dose response effect in a double-blind, placebo-controlled, repeated-measures study. J. Pediatr. 1994, 125, 691–698. [Google Scholar] [CrossRef]
- Chung, K.T. Mutagenicity and carcinogenicity of aromatic amines metabolically produced from azo dyes. J. Environ. Sci. Health Part C 2000, 18, 51–74. [Google Scholar] [CrossRef]
- Tsuda, S.; Murakami, M.; Matsusaka, N.; Kano, K.; Taniguchi, K.; Sasaki, Y.F. DNA damage induced by red food dyes orally administered to pregnant and male mice. Toxicol. Sci. 2001, 61, 92–99. [Google Scholar] [CrossRef]
- McCann, J.; Choi, E.; Yamasaki, E.; Ames, B.N. Detection of carcinogens as mutagens in the Salmonella/microsome test assay of 300 chemicals. Proc. Natl. Acad. Sci. USA 1975, 72, 5135–5139. [Google Scholar] [CrossRef] [PubMed]
- Sun, H.; Sun, N.; Li, H.; Zhang, J.; Yang, Y. Development of multiresidue analysis for 21 synthetic colorants in meat by microwave-assisted extraction–solid-phase extraction–reversed-phase ultrahigh performance liquid chromatography. Food Anal. Methods 2012, 6, 1291–1299. [Google Scholar] [CrossRef]
- Tang, B.; Xi, C.; Zou, Y.; Wang, G.; Li, X.; Zhang, L.; Chen, D.; Zhang, J. Simultaneous determination of 16 synthetic colorants in hotpot condiment by high performance liquid chromatography. J. Chromatogr. B Anal. Technol. Biomed. Life Sci. 2014, 960, 87–91. [Google Scholar] [CrossRef] [PubMed]
- Qi, P.; Lin, Z.H.; Chen, G.Y.; Xiao, J.; Liang, Z.A.; Luo, L.N.; Zhou, J.; Zhang, X.W. Fast and simultaneous determination of eleven synthetic color additives in flour and meat products by liquid chromatography coupled with diode-array detector and tandem mass spectrometry. Food Chem. 2015, 181, 101–110. [Google Scholar] [CrossRef] [PubMed]
- Chen, Q.C.; Mou, S.F.; Hou, X.P.; Riviello, J.M.; Ni, Z.M. Determination of eight synthetic food colorants in drinks by high-performance ion chromatography. J. Chromatogr. A 1998, 827, 73–81. [Google Scholar] [CrossRef]
- Feng, F.; Zhao, Y.; Yong, W.; Sun, L.; Jiang, G.; Chu, X. Highly sensitive and accurate screening of 40 dyes in soft drinks by liquid chromatography-electrospray tandem mass spectrometry. J. Chromatogr. B Anal. Technol. Biomed. Life Sci. 2011, 879, 1813–1818. [Google Scholar] [CrossRef]
- Neng, J.; Tan, J.; Jia, K.; Sun, P. A fast and cost-effective detection of melamine by surface enhanced Raman spectroscopy using a novel hydrogen bonding-assisted supramolecular matrix and gold-coated magnetic nanoparticles. Appl. Sci. 2017, 7, 475. [Google Scholar] [CrossRef]
- Jahn, M.; Patze, S.; Bocklitz, T.; Weber, K.; Cialla-May, D.; Popp, J. Towards SERS based applications in food analytics: Lipophilic sensor layers for the detection of Sudan III in food matrices. Anal. Chim. Acta 2015, 860, 43–50. [Google Scholar] [CrossRef]
- Müller, C.; David, L.; Chiş, V.; Pînzaru, S.C. Detection of thiabendazole applied on citrus fruits and bananas using surface enhanced Raman scattering. Food Chem. 2014, 145, 814–820. [Google Scholar] [CrossRef]
- Wijaya, W.; Pang, S.; Labuza, T.P.; He, L. Rapid detection of acetamiprid in foods using surface-enhanced Raman spectroscopy (SERS). J. Food Sci. 2014, 79, T743–T747. [Google Scholar] [CrossRef]
- Chen, X.; Nguyen, T.H.D.; Gu, L.; Lin, M. Use of standing gold nanorods for detection of malachite green and crystal violet in fish by SERS. J. Food Sci. 2017, 82, 1640–1646. [Google Scholar] [CrossRef] [PubMed]
- Lin, X.; Hasi, W.L.J.; Lou, X.T.; Lin, S.; Yang, F.; Jia, B.S.; Cui, Y.; Ba, D.X.; Lin, D.Y.; Lu, Z.W. Rapid and simple detection of sodium thiocyanate in milk using surface-enhanced Raman spectroscopy based on silver aggregates. J. Raman Spectrosc. 2014, 45, 162–167. [Google Scholar] [CrossRef]
- Lee, K.M.; Herrman, T.J. Determination and prediction of fumonisin contamination in maize by surface-enhanced Raman spectroscopy (SERS). Food Bioprocess Technol. 2016, 9, 588–603. [Google Scholar] [CrossRef]
- Rakkesh, R.A.; Durgalakshmi, D.; Balakumar, S. Graphene based nanoassembly for simultaneous detection and degradation of harmful organic contaminants from aqueous solution. RSC Adv. 2016, 6, 34342–34349. [Google Scholar] [CrossRef]
- Tijunelyte, I.; Betelu, S.; Moreau, J.; Ignatiadis, I.; Berho, C.; Lidgi-Guigui, N.; Guénin, E.; David, C.; Vergnole, S.; Rinnert, E.; et al. Diazonium salt-based surface-enhanced Raman spectroscopy nanosensor: Detection and quantitation of aromatic hydrocarbons in water samples. Sensors 2017, 17, 1198. [Google Scholar] [CrossRef] [PubMed]
- Cao, Y.C.; Jin, R.; Nam, J.M.; Thaxton, C.S.; Mirkin, C.A. Raman dye-labeled nanoparticle probes for proteins. J. Am. Chem. Soc. 2003, 125, 14676–14677. [Google Scholar] [CrossRef] [PubMed]
- Driskell, J.D.; Uhlenkamp, J.M.; Lipert, R.J.; Porter, M.D. Surface-enhanced Raman scattering immunoassays using a rotated capture substrate. Anal. Chem. 2007, 79, 4141–4148. [Google Scholar] [CrossRef]
- Gong, J.L.; Liang, Y.; Huang, Y.; Chen, J.W.; Jiang, J.H.; Shen, G.L.; Yu, R.Q. Ag/SiO2 core-shell nanoparticle-based surface-enhanced Raman probes for immunoassay of cancer marker using silica-coated magnetic nanoparticles as separation tools. Biosens. Bioelectron. 2007, 22, 1501–1507. [Google Scholar] [CrossRef]
- Neng, J.; Harpster, M.H.; Zhang, H.; Mecham, J.O.; Wilson, W.C.; Johnson, P. A versatile SERS-based immunoassay for immunoglobulin detection using antigen-coated gold nanoparticles and malachite green-conjugated protein A/G. Biosens. Bioelectron. 2010, 26, 1009–1015. [Google Scholar] [CrossRef]
- Neng, J.; Harpster, M.H.; Wilson, W.C.; Johnson, P. Surface-enhanced Raman scattering (SERS) detection of multiple viral antigens using magnetic capture of SERS-active nanoparticles. Biosens. Bioelectron. 2013, 41, 316–321. [Google Scholar] [CrossRef]
- Patra, P.P.; Kumar, G.V.P. Single-molecule surface-enhanced Raman scattering sensitivity of Ag-core Au-shell nanoparticles: Revealed by bi-analyte method. J. Phys. Chem. Lett. 2013, 4, 1167–1171. [Google Scholar] [CrossRef] [PubMed]
- Stranahan, S.M.; Willets, K.A. Super-resolution optical imaging of single-molecule SERS hot spots. Nano Lett. 2010, 10, 3777–3784. [Google Scholar] [CrossRef] [PubMed]
- Xu, S.; Lu, H. Mesoporous structured MIPs@CDs fluorescence sensor for highly sensitive detection of TNT. Biosens. Bioelectron. 2016, 85, 950–956. [Google Scholar] [CrossRef] [PubMed]
- Gao, F.; Grant, E.; Lu, X. Determination of histamine in canned tuna by molecularly imprinted polymers-surface enhanced Raman spectroscopy. Anal. Chim. Acta 2015, 901, 68–75. [Google Scholar] [CrossRef] [PubMed]
- Hu, Y.; Lu, X. Rapid detection of melamine in tap water and milk using conjugated “one-step” molecularly imprinted polymers-surface enhanced Raman spectroscopic sensor. J. Food Sci. 2016, 81, N1272–N1280. [Google Scholar] [CrossRef] [PubMed]
- Gao, F.; Feng, S.; Chen, Z.; Li-Chan, E.C.Y.; Grant, E.; Lu, X. Detection and quantification of chloramphenicol in milk and honey using molecularly imprinted polymers: Canadian penny-based SERS nano-biosensor. J. Food Sci. 2014, 79, N2542–N2549. [Google Scholar] [CrossRef] [PubMed]
- Gao, F.; Hu, Y.; Chen, D.; Li-Chan, E.C.Y.; Grant, E.; Lu, X. Determination of Sudan I in paprika powder by molecularly imprinted polymers–thin layer chromatography–surface enhanced Raman spectroscopic biosensor. Talanta 2015, 143, 344–352. [Google Scholar] [CrossRef]
- Feng, S.; Hu, Y.; Ma, L.; Lu, X. Development of molecularly imprinted polymers-surface-enhanced Raman spectroscopy/colorimetric dual sensor for determination of chlorpyrifos in apple juice. Sens. Actuators B. 2016, 241, 750–757. [Google Scholar] [CrossRef]
- Feng, S.; Gao, F.; Chen, Z.; Grant, E.; Kitts, D.D.; Wang, S.; Lu, X. Determination of α-tocopherol in vegetable oils using a molecularly imprinted polymers–surface-enhanced Raman spectroscopic biosensor. J. Agric. Food Chem. 2013, 61, 10467–10475. [Google Scholar] [CrossRef]
- Malitesta, C.; Mazzotta, E.; Picca, R.A.; Poma, A.; Chianella, I.; Piletsky, S.A. MIP sensors–the electrochemical approach. Anal. Bioanal. Chem. 2012, 402, 1827–1846. [Google Scholar] [CrossRef]
- Das, K.; Penelle, J.; Rotello, V.M. Selective picomolar detection of hexachlorobenzene in water using a quartz crystal microbalance coated with a molecularly imprinted polymer thin film. Langmuir 2003, 19, 3921–3925. [Google Scholar] [CrossRef]
- Kriz, D.; Mosbach, K. Competitive amperometric morphine sensor based on an agarose immobilised molecularly imprinted polymer. Anal. Chim. Acta 1995, 300, 71–75. [Google Scholar] [CrossRef]
- Chen, S.; Dong, L.; Yan, M.; Dai, Z.; Sun, C.; Li, X. Rapid and sensitive biomarker detection using molecular imprinting polymer hydrogel and surface-enhanced Raman scattering. R. Soc. Open Sci. 2018, 5, 171488. [Google Scholar] [CrossRef] [PubMed]
- Byrne, M.E.; Hilt, J.Z.; Peppas, N.A. Recognitive biomimetic networks with moiety imprinting for intelligent drug delivery. J. Biomed. Mater. Res. Part A 2008, 84, 137–147. [Google Scholar] [CrossRef] [PubMed]
- Hilt, J.Z.; Byrne, M.E. Configurational biomimesis in drug delivery: Molecular imprinting of biologically significant molecules. Adv. Drug Deliv. Rev. 2004, 56, 1599–1620. [Google Scholar] [CrossRef] [PubMed]
- Byrne, M.E.; Salian, V. Molecular imprinting within hydrogels II: Progress and analysis of the field. Adv. Drug Deliv. Rev. 2008, 364, 188–212. [Google Scholar] [CrossRef]
- Niidome, T.; Nakashima, K.; Takahashi, H.; Niidome, Y. Preparation of primary amine-modified gold nanoparticles and their transfection ability into cultivated cells. Chem. Commun. 2004, 17, 1978–1979. [Google Scholar] [CrossRef]
© 2019 by the authors. Licensee MDPI, Basel, Switzerland. This article is an open access article distributed under the terms and conditions of the Creative Commons Attribution (CC BY) license (http://creativecommons.org/licenses/by/4.0/).