Featured Application
This study determines the wind loads for a photovoltaic (PV) array at a high angle of tilt. The data is useful for the detailed structural design of an offshore PV array.
Abstract
This study experimentally determines the wind loads on a stand-alone solar array (length-to-width ratio of 0.19; 1/10-scale commercial modules). The freestream velocity in a uniform flow is 14.5 ± 0.1 m/s, and the turbulence intensity is 0.3%. The angle of tilt ranges from 10° to 80° and the wind is incident at angle of 0°–180°. Mean surface pressure measurements on the upper and the lower surface of the inclined solar panels are used to calculate the lift coefficient. For the angle of incidence of 0°–60° for the wind, the variation in the lift coefficient with the angle of tilt is U-shaped. The formation of a strong windward corner vortex results in greater lift force on the right half of the inclined plate for the angle of incidence of 30°–45° for the wind.
1. Introduction
The use of solar energy has increased, due to public concerns about climate change and environmental pollution. The total respective capacity for solar photovoltaic (PV) systems was 303 GW and 402 GW in 2016 and 2017 [1]. A PV system consists of inclined panels, which are usually mounted on the rooftops of residential or commercial buildings. Floating PV on reservoirs, ponds, or lakes are another emergent solar energy system [2,3,4,5]. In nearshore areas, a PV system floats in the ocean using a buoyancy system [6].
To harness solar energy, PV panels for roof-top or ground systems are installed at an optimal tilt angle that allows the sunlight to fall perpendicular to the panels’ surface. Wind loads depend on the tilt angle, the angle of incidence of the wind, and the spacing and sheltering of the arrays [7,8,9,10,11]. For an inclined panel with a length-to-width ratio, L/W, of 2 that faces a uniform flow, Chung et al. [12] showed that there is a decrease in the sectional lift coefficient as the angle of tilt increases (α = 15°–25°). Corner vortices are also observed. For an inclined panel (L/W = 0.22) on flat roofs, an increase in α (= 20°–45°) produces greater suction [13]. Cao et al. [14] noted that wind-induced loads on an inclined panel are due primarily to pressure equalization at large angles of tilt and turbulence at small angles of tilt. The effect of the angle of incidence of wind, β, was investigated by Chou et al. [15]. There is greater suction on the upper surface near the windward corner for β = 15°–60°. A study by Shademan and Hangan [16] obtained similar results.
For a PV system, wind loads are significantly reduced by the presence of neighboring upwind arrays (sheltering effect) [17,18]. Therefore, this study only determines wind loads for a stand-alone PV array (nine panels, L/W = 0.19). In addition, the wind loads on the PV panels in a sea environment are not the same as those for PV panels that are located on land. The motion of a pontoon results in the variation in α during a wave cycle. The safety of PV panels in environments that feature large waves is a practical issue for the system design. To ensure that the system functions properly, the effect of α (up to 80°) and β is determined.
2. Experimental Setup
The experiments were performed in a closed-loop wind tunnel at the Architecture and Building Research Institute (Tainan, Taiwan). The wind tunnel has a working cross section of 2.6 m (height) × 4 m (width) × 36.5 m (length) and a contraction ratio of 4.71. To determine the critical wind loads, a 1/10 scale stand-alone array (nine inclined panels, P1–P9; L = 168 mm and W = 900 mm) was constructed, as shown in Figure 1. The origin of the coordinates (x/L = 0 and y/W = 0) is located at the upper left corner of the inclined plate. When the low surface faces the flow, this corresponds to β of 0°. The lift coefficient, CL, is negative in the upward direction. The model sits 10 mm above the tunnel floor and the blockage ratio is up to 1.4%.
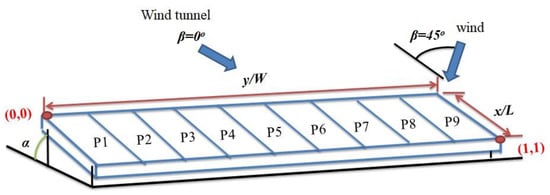
Figure 1.
Test configuration for a stand-alone array.
Meteorological data from nearshore buoys in Taiwan (Qigu, Longdong and Hsinchu) were collected [19] to determine the test conditions. The most common values of β for Qigu (23°05″42″ N) were 210°–225° and 315°–360° for the period of 2013–2017. In Longtong (25°05″48″ N) and Hsinchu (24°45″19″ N), the respective values for β were 0° and 30°–45°. The variation in α for PV panels with respect to wind was ±45°. In this study, the value of α was between 10° and 80° (in increments of 10°) and the value of β ranged from 0° to 180° (in increments of 15°). Note that the angle between the PV arrays and the surface of the sea is fixed for an offshore-type PV system. This is not the case for the wind tunnel tests. However, the experimental results of this study can be used for preliminary structural designs of an offshore PV array and to validate the numerical simulation.
For an inclined panel for which L/W = 2, Chung et al. [12] showed that there is a small increase in wind load when there is an increase in the intensity of the freestream turbulence. Therefore, the experiments for this study used a uniform flow. The freestream velocity was 14.5 ± 0.1 m/s, and the turbulence intensity was 0.3%. A Pitot-static tube was positioned at the same height as the front edge of the inclined panels to determine the static, p∞, and the dynamic pressure, q, for the incoming flow. The Reynolds number, which is based on the length of the inclined panels, was 1.64 × 10⁵. Note that there is Reynolds number independence for an inclined panel [20]. A total of 434 pressure taps were drilled on the upper and lower surfaces of the model. Flexible polyvinyl chloride tubes of 1.1 mm in diameter and 60 cm in length were connected to SCANIVALVE multichannel modules (Model ZOC 33/64Px 64-port; Model RAD3200 pressure transducer, Scanivalve Co., Liberty Lake, WA, USA) to measure the mean surface pressure. The full-scale range of the sensors was ±2490 Pa, and the accuracy was ±0.15% of the full scale. The sampling rate was 250 Hz, and each record had 32,768 data points. The mean pressure coefficient, Cp (= (p − p∞)/q), and CL (= were calculated. The differential pressure coefficient, ΔCp (= Cp,up − Cp,low) was determined using the value of Cp for the upper and lower surfaces.
3. Results and Discussion
3.1. Longitudinal Pressure Distributions
Examples of the pressure distribution in the longitudinal direction, Cpl, (α = 20°–80°) for β = 0° at y/W = 0.5 are shown in Figure 2. Negative values for Cpl (or suction) were observed on the upper surface for all test cases. For α = 20° and 40°, the value of Cpl decreased along the longitudinal direction. The location with the lowest Cpl value moved upstream for α = 60° and 80°. The variation in Cpl ranged from 4.6% (α = 20°) to 10.9% (α = 60°). For an inclined panel with L/W = 2, Chou et al. [21] showed that there is a significant change in the value of Cpl for α ≤ 30°. This is due to the formation of intense side-edge vortices. On the lower surface, the value of α had a significant effect on the Cpl distribution. For α = 20° and 40°, the value of Cpl decreased initially, and then the distributions flattened. The values of Cpl for α = 60° and 80° were greater for the first half of the inclined array. This demonstrates that the localized load was most significant near the front edge for greater values of α. The value of Cpl for L/W = 0.19 (an array) was less than that for L/W = 2 (a panel).
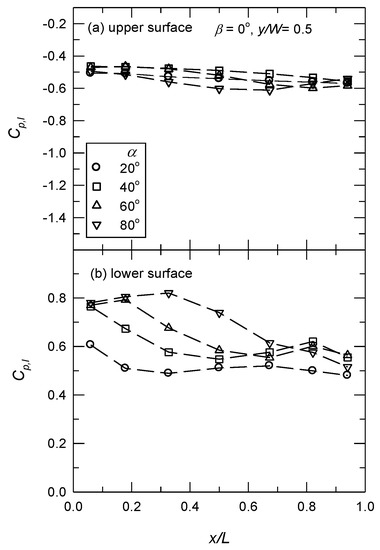
Figure 2.
Mean longitudinal pressure distributions for y/W = 0.5 and β = 0°.
The Cpl distributions for β = 30°at y/W = 0.5 are shown in Figure 3. On the upper surface, the distributions were flat for α = 40°, 60°, and 80° but not for α = 20°. The value of Cpl decreased significantly for the second half of the inclined array. On the lower surface, the Cpl distributions were similar to those for β = 0°. The values for Cpl were lower for β = 30°. For β = 45°, Kopp et al. [22] observed the peak system torque at angles for approaching wind that are close to the angle of the diagonal axes of an inclined panel. Figure 4 shows that the variation in Cpl on the upper surface was more significant at lower values of α. The lowest value of Cpl was observed at x/L = 0.5–0.7 for α = 20°, 40°, and 60°. This corresponds to the formation of the windward corner vortex. An increase in the value of β resulted in a decrease in the value of Cpl on the lower surface. For β = 135°, Figure 5 shows that the flow decelerated along the longitudinal direction on the upper surface. An increase in α produced a more positive value for Cpl on the upper surface and a more negative value for Cpl on the lower surface. The sectional lift coefficient increased as α increased; hence, there is a greater downward force.
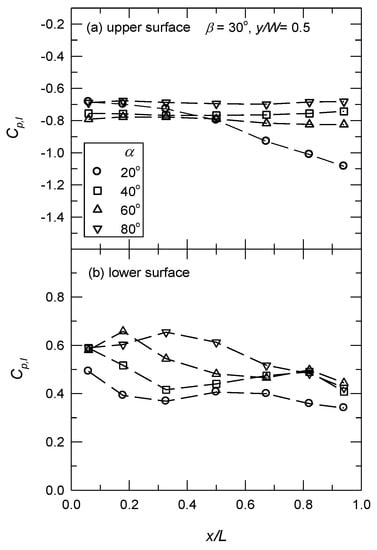
Figure 3.
Mean longitudinal pressure distributions for y/W = 0.5 and β = 30°.
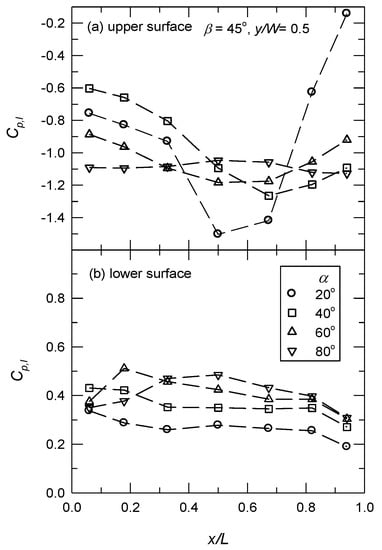
Figure 4.
Mean longitudinal pressure distributions for y/W = 0.5 and β = 45°.
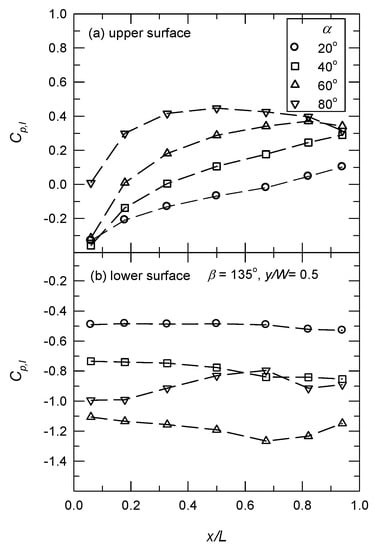
Figure 5.
Mean longitudinal pressure distributions for y/W = 0.5 and β = 135°.
3.2. Spanwise Pressure Distributions
For x/L = 0.5, the spanwise pressure, Cps, distributions for β = 0° are shown in Figure 6. On the upper and lower surfaces, there was an inverted U-shape for α = 20°, 40°, and 60°, which corresponds to side-edge vortices. This agrees with the results for an inclined panel for which L/W = 2 [21]. Therefore, the side panels (P1 and P9) experienced greater suction on the upper surface and less lift force on the lower surface. For α = 80°, the distributions were quite flat. The difference in the pressure between the upper (highly separated flow with lower value in Cps) and lower surfaces (near stagnation region with greater value in Cps) was greater than that for α = 20°, 40°, and 60°.
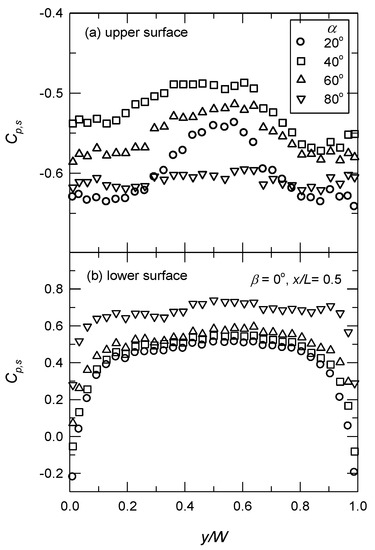
Figure 6.
Mean spanwise pressure distributions for x/L = 0.5 and β = 0°.
For β = 30°, the Cps distributions are shown in Figure 7. For the left half (P1–P4), the value of Cps on the upper surface decreased slightly toward the right side and increased as the value of α increased. For the right half, the opposite was true. Expansion and compression were observed for α = 20°, due to the formation of a strong windward corner vortex and a greater lift force on P6–P8. On the lower surface, the value of Cps increased from the left to the right sides as the value of α increased. The location of the maximum Cps moved to the right side when α increased.
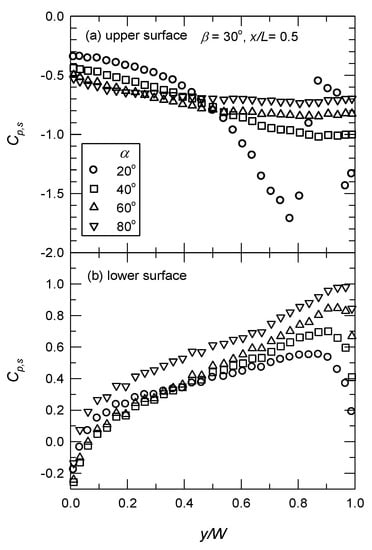
Figure 7.
Mean spanwise pressure distributions for x/L = 0.5 and β = 30°.
For β = 45°, Figure 8 shows that the Cps distributions were similar to those for β = 30°. However, there was a greater pressure gradient on the upper surface. For α = 20°, a larger windward corner vortex was formed, and the location of the lowest value of Cps moved to the left. For β = 135°, wind blew over the lower surface of the inclined panels. The Cps distributions on the lower surface showed similar patterns to those on the upper surface for β = 45°, as shown in Figure 9. This shows the downward force increased from the left to the right edges.
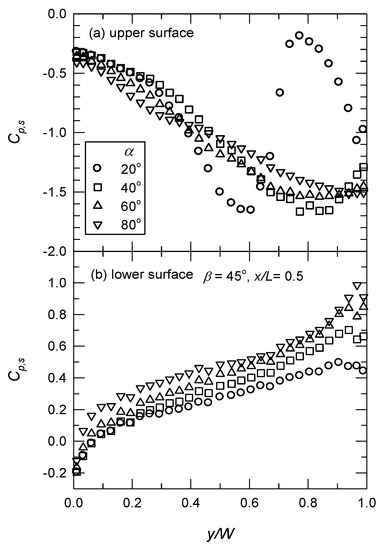
Figure 8.
Mean spanwise pressure distributions for x/L = 0.5 and β = 45°.
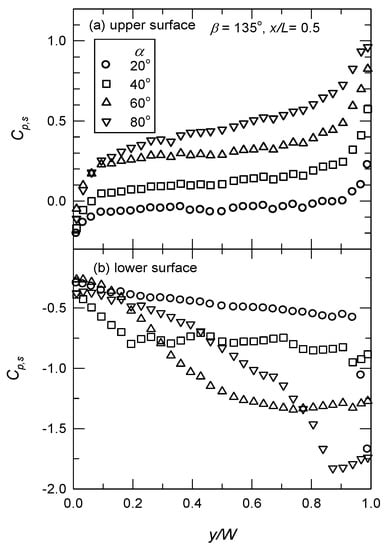
Figure 9.
Mean spanwise pressure distributions for x/L = 0.5 and β = 135°.
3.3. The Lift Coefficient
CL was calculated by integrating ΔCp (differential pressure between upper and lower surface). The variation in CL with α and β is shown in Figure 10. The value of CL was negative for β ≤ 75°. The lowest value for CL was observed for α = 30° and β = 45°. This is similar to the results of Chou et al. [21] for an inclined panel, for which L/W = 2. The value of CL was relatively small for β = 90°, and it was positive for β ≥ 105°, which represents a downward force. The critical wind loads on the inclined panels occurred for lower values of β; hence, the effect of α on CL is only shown for β = 0°–60° in Figure 11. For an inclined panel, for which L/W = 2, the value of CL for β ≤ 75° decreased linearly with α (≤30°), following an increase for α = 50°. At high values of α (= 60°–80°), CL remained approximately constant for α = 30° and 40° [21]. For β of 0°, 30°, 45°, and 60°, for which L/W = 0.19, the variation of CL with α was U-shaped. The lowest value of CL for β = 0° and 30° was observed at α = 20°. For β = 45° and 60°, it respectively corresponded to α = 30° and 40°. For high values of α (= 60°–80°), β had a less significant effect on the amplitude of CL. Therefore, for an inclined array at lower values of α (≤30°) and β (≤45°), there were lower values in CL, which was critical to the safe design of the system.
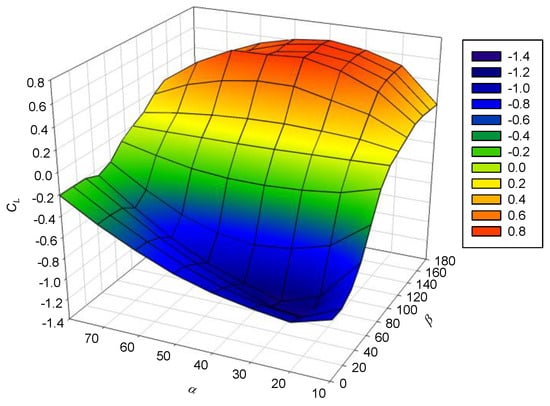
Figure 10.
Lift coefficient.
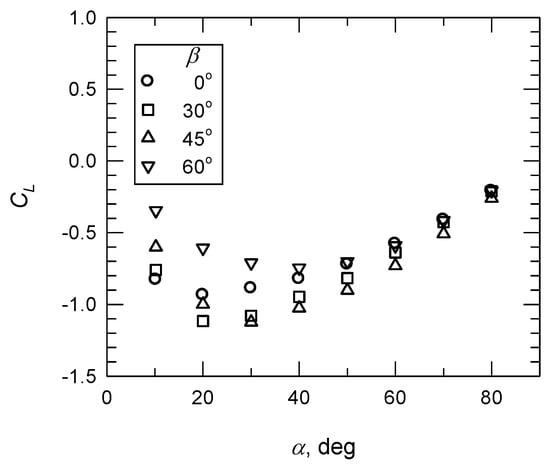
Figure 11.
Lift coefficient. β: 0°, 30°, 45°, 60°.
Figure 12 shows the effect of β on CL for α of 0°–80°. For β ≤ 30°, the value of CL decreased as α increased (≥ 20°). For β = 75°–105°, the value of α had a less significant effect. This agrees with the results of Chou et al. [21]. The value of CL for β ≥ 120° decreased as α (= 40°–80°) increased, and the opposite was true for α =10°–30°.
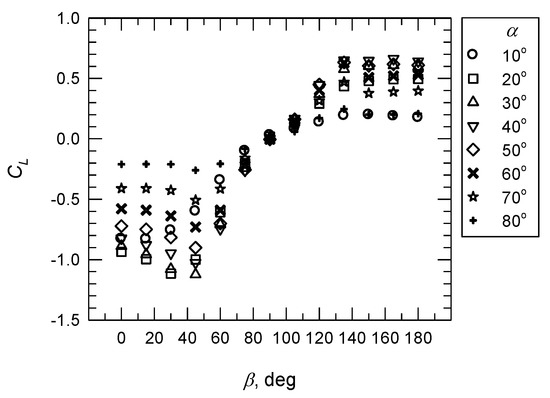
Figure 12.
Lift coefficient. α: 0°–80°.
The wind load on each inclined panel was of interest. For α = 30°, the variation in CL with β is shown in Figure 13. For P1 (the left-most panel), the value of CL increased linearly as β increased. The variation in CL with β for P2 and P3 was similar to that for P1. However, there was a sudden increase at β = 60°–75°. For P5–P9, the value of CL decreased initially, following an increase. The lowest value for CL, which decreased from P5 to P9, was observed for β = 30°–45°. For β ≥ 90°, the variation in CL for P1–P9 was less significant. This demonstrates that the wind loads on the inclined array were unsymmetrical at lower β (≤60°).
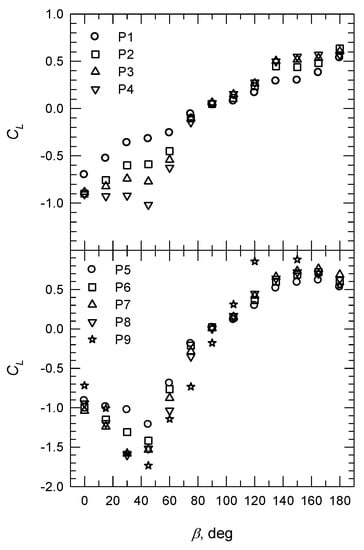
Figure 13.
Lift coefficient for P1–P9 for α = 30°.
4. Conclusions
Wind loading on inclined solar panels is a key factor in the proper functioning of the system during its lifetime. This study determined the effect of the angle of tilt and the angle of the incidence of the wind on the mean surface pressure, as well as the lift coefficient for an inclined array (L/W = 0.19). There was a significant localized load near the front edge at greater angles of tilt but less than for L/W = 2. For β of 0°–60°, the variation in CL with the angle of tilt was U-shaped. The formation of a strong windward corner vortex induced a greater lift force on the right half of the inclined plate for β = 30°–45°. Unsymmetrical wind loads on the inclined array at lower angles of incidence for the wind (≤60°) in the spanwise direction induced a greater bending moment. Wind loads on an inclined array at lower angles of tilt and angles of incidence for the wind are a cause for concern in the design of a system.
Author Contributions
Conceptualization/methodology/data curation, C.-C.C., P.-H.C. and C.-Y.C.; writing (original draft preparation), P.-H.C.; writing (review and editing), R.-Y.Y.
Funding
This research was funded by Industrial Technology Research Institute.
Acknowledgments
The technical support of the staff of the Aerospace Science and Technology Research Center, National Cheng Kung University, is greatly appreciated.
Conflicts of Interest
The authors declare no conflict of interest.
Nomenclature
| CL | lift coefficient |
| Cp | pressure coefficient in the longitudinal direction, (p–p∞)/q |
| Cp,low | pressure coefficient on the lower surface |
| Cps | pressure coefficient in the spanwise direction |
| Cp,up | pressure coefficient on the upper surface |
| L | length of tilted panel |
| p∞, | freestream static pressure |
| q | dynamic pressure |
| W | width of tilted panel |
| x | coordinate in the longitudinal direction |
| y | coordinate in the spanwise direction |
| α | angle of tilt |
| β | wind incidence angle |
| ΔCp | differential pressure, Cp,up − Cp,low |
References
- REN21. Renewables 2018, Global Status Report; Ren21 Secretariat: Paris, France, 2018. [Google Scholar]
- Trapani, K.; Santafe, M.R. A review of floating photovoltaics installations: 2007–2013. Prog. Photovolt. 2015, 23, 524–532. [Google Scholar] [CrossRef]
- Sahu, A.; Yadav, N.; Sudhakar, K. Floating photovoltaic power plant: A review. Renew. Sustain. Energy Rev. 2016, 66, 815–824. [Google Scholar] [CrossRef]
- Castellano, N.N.; Parra, J.A.G.; Valls-Guirado, J.; Manzano-Agugliaro, F. Optimal displacement of photovoltaic array’s rows using a novel shading model. Appl. Energy 2015, 144, 1–9. [Google Scholar] [CrossRef]
- Kim, S.M.; Oh, M.; Park, H.D. Analysis and Prioritization of the Floating Photovoltaic System Potential for Reservoirs in Korea. Appl. Sci. 2019, 9, 365. [Google Scholar] [CrossRef]
- Trapani, K.; Millar, D.L.; Smith, H.C.M. Novel offshore application of photovoltaics in comparison to conventional marine renewable energy technologies. Renew. Energy 2013, 50, 879–888. [Google Scholar] [CrossRef]
- Chung, K.-M.; Chang, K.-C.; Chou, C.-C. Wind loads on residential and large-scale solar collector models. J. Wind Eng. Ind. Aerodyn. 2011, 99, 59–64. [Google Scholar] [CrossRef]
- Jubayer, C.M.; Hangan, H. Numerical simulation of wind effects on a stand-alone ground mounted photovoltaic (PV) system. J. Wind Eng. Ind. Aerodyn. 2014, 134, 56–64. [Google Scholar] [CrossRef]
- Aly, A.M. On the evaluation of wind loads on solar panels: The scale issue. Sol. Energy 2016, 135, 423–434. [Google Scholar] [CrossRef]
- Naeiji, A.; Raji, F.; Zisis, I. Wind loads on residential scale rooftop photovoltaic panels. J. Wind Eng. Ind. Aerodyn. 2017, 168, 228–246. [Google Scholar] [CrossRef]
- Guo, M.; Zang, H.; Gao, S.; Chen, T.; Xiao, J.; Cheng, L.; Wei, Z.; Sun, G. Optimal tilt angle and orientation on photovoltaic modules using HS algorithm in different climates in China. Appl. Sci. 2017, 7, 1028. [Google Scholar] [CrossRef]
- Chung, K.-M.; Chou, C.-C.; Chang, K.-C.; Chen, Y.-J. Effect of a vertical guide plate on the wind loading of an inclined flat plate. Wind Struct. Int. J. 2013, 17, 537–552. [Google Scholar] [CrossRef]
- Stathopoulos, T.; Zisis, I.; Xypnitou, E. Local and overall wind pressure and force coefficients for solar panels. J. Wind Eng. Ind. Aerodyn. 2014, 125, 195–206. [Google Scholar] [CrossRef]
- Cao, J.; Yoshida, A.; Saha, P.K.; Tamura, Y. Wind loading characteristics of solar arrays mounted on flat roofs. J. Wind Eng. Ind. Aerodyn. 2013, 123, 214–225. [Google Scholar] [CrossRef]
- Chou, C.-C.; Chung, K.-M.; Chang, K.-C. Wind Loads of Solar Water Heaters: Wind Incidence Effect. J. Aerodyn. 2014, 2014, 1–10. [Google Scholar] [CrossRef]
- Shademan, M.; Hangan, H. Wind Loading on Solar Panels at Different Inclination Angles. In Proceedings of the 11th Americas Conference on Wind Engineering, San Juan, PR, USA, 22–26 June 2009. [Google Scholar]
- Radu, A.; Axinte, E. Wind forces on structures supporting solar collectors. J. Wind Eng. Ind. Aerodyn. 1989, 32, 93–100. [Google Scholar] [CrossRef]
- Warsido, W.P.; Bitsuamlak, G.T.; Barata, J.; Chowdhury, A.G. Influence of spacing parameters on the wind loading of solar array. J. Fluids Struct. 2014, 48, 295–315. [Google Scholar] [CrossRef]
- Central Weather Bureau (CWB), Ministry of Transportation and Communication. Available online: https://www.cwb.gov.tw/V7/climate/marine_stat/wave.htm (accessed on 22 May 2018).
- Chung, K.; Chang, K.-C.; Liu, Y. Reduction of wind uplift of a solar collector model. J. Wind Eng. Ind. Aerodyn. 2008, 96, 1294–1306. [Google Scholar] [CrossRef]
- Chou, C.C.; Chung, P.H.; Yang, R.Y. Wind loads on a solar panel at high tilt angles. Appl. Sci. 2019, 9, 1594. [Google Scholar] [CrossRef]
- Kopp, G.A.; Surry, D.; Chen, K. Wind loads on a solar array. Wind Struct. 2002, 5, 393–406. [Google Scholar] [CrossRef]
© 2019 by the authors. Licensee MDPI, Basel, Switzerland. This article is an open access article distributed under the terms and conditions of the Creative Commons Attribution (CC BY) license (http://creativecommons.org/licenses/by/4.0/).