Article

Study of 2,4-D Spectral Characteristics and Its Detection in Zizania Latifolia Using Terahertz Time-Domain Spectroscopy

1
College of Biosystems Engineering and Food Science, Zhejiang University, Hangzhou 310058, China
2
Key Laboratory of Spectroscopy Sensing, Ministry of Agriculture, Hangzhou 310058, China
3
State Key Laboratory of Modern Optical Instrumentation, Zhejiang University, Hangzhou 310058, China
*
Author to whom correspondence should be addressed.
Appl. Sci. 2019, 9(11), 2248; https://doi.org/10.3390/app9112248
Submission received: 25 April 2019 / Revised: 28 May 2019 / Accepted: 29 May 2019 / Published: 31 May 2019
(This article belongs to the Section Optics and Lasers)

Abstract

:

Featured Application

Identification and detection of pesticide residues in crops.

Abstract

2,4-Dichlorophenoxyacetic acid (2,4-D) is a common plant growth regulator, which can remain in food and, with long-term consumption, threaten human health. Therefore, it is necessary to propose an effective detection method. Terahertz time-domain spectroscopy technique (THz-TDS) has good advantages in the quantitative and qualitative analysis of most biomolecules due to its rich fingerprint characteristics. In this paper, density functional theory (DFT) was applied to geometry optimization and frequency vibration calculation of 2,4-D, and THz-TDS was used to quantitatively detect 2,4-D in Zizania latifolia. The results showed that there were three characteristic absorption peaks of 2,4-D at 1.36, 1.60, and 2.38 THz, respectively, and the theoretical spectra were in good consistency with experimental spectra, with slight discrepancies. Additionally, the absorption peak at 1.36 THz had the best absorption characteristics and was chosen as the main peak for 2,4-D quantitative analysis. It was demonstrated that the limits of detection (LOD) of 2,4-D in Zizania latifolia were found to be as low as 5%, the absorbance intensity at 1.36 THz showed a good linear relationship (R2 = 0.9854) with 2,4-D concentration from 5% to 30%, and the recovery was 93.29%–98.75%. Overall, this work enriched the fingerprint database of pesticide molecules on the basis of terahertz spectroscopy and could provide a technical support for the detection of 2,4-D in food by terahertz spectroscopy.

1. Introduction

2,4-Dichlorophenoxyacetic acid (2,4-D) is a widely used plant growth regulator [1]. A small amount of it can promote crop growth and contribute to the improvement of fruit quality, and a large amount of it can help in weeding [2]. As an antistaling agent, it can enhance the disease resistance of fruits and vegetables and delay their aging. However, 2,4-D is difficult to decompose and can remain in water, crops, and soil because of its low water solubility [3,4,5]. Improper usage of it will affect the environment pollution and threaten the human body’s immune system [6,7,8]. Also, long-term consumption of 2,4-D would greatly increase the incidence of cancer [9]. In view of these hazards, some countries and international organizations have made clear provisions on the residue limit of 2,4-D. Codex Alimentarius stated that the maximum residue limit of 2,4-D in food and feed varied from 0.01–400 mg/kg [10]. Therefore, it is of great significance to explore the detection method of 2,4-D. At present, the main methods for detecting 2,4-D include high-performance liquid chromatography (HPLC) [11,12], gas chromatography (GC) [13], and enzyme-linked immunosorbent assay [14]. However, the pre-process of these methods is complicated, with low detection efficiency. Therefore, it is necessary to propose a new detection method with simple operation and high efficiency.
In recent years, analysis of spectral fingerprint peaks has gradually become one of the important methods for qualitative and quantitative analysis of compounds. In the past few years, some researchers applied spectral characterization techniques to the detection of 2,4-D. Jin-Liang et al. [15] applied surface-enhanced Raman scattering technology for detection of 2,4-D using laser excitation at 632.8 nm. The result showed enhancement factors of Au nanorods substrates and Au nanospheres substrates were 6.2×10⁵ and 5.7×10⁴, respectively. Wells et al. [16] compared quantitative nuclear magnetic resonance spectroscopy (QNMR) with chromatographic methods for the determination of the purity of 2,4-D. The result showed that QNMR is more precise and accurate than the chromatographic methods. Trivedi et al. [17] applied the UV–Vis spectrophotometer to detect the concentration of 2,4-D absorbed on mustard plant ash. Still, these spectroscopy technologies had some shortcomings. NMR spectroscopy mainly detected hydrogen-containing groups, which was inadequate. Raman spectra could be influenced by fluorescence, and a UV spectrophotometer could only be used to detect liquid.
THz detection technology is a novel characterization technology, which has been gradually applied in many fields. The vibration and rotation frequencies of many macromolecules are in terahertz band. Therefore, they show strong absorption and dispersion characteristics in this band [18,19,20]. The spectral properties through resonance absorption of materials to terahertz radiation can be studied by terahertz time-domain spectroscopy (THz-TDS) technology [21,22]. Compared with traditional spectroscopy, terahertz spectroscopy can simultaneously provide amplitude and phase information of terahertz signal [23]. Additionally, THz radiation has strong penetrability for many nonpolar materials, which can detect internal components of the tested object more adequately [24]. Researchers have made significant progress in studying and analyzing chemical composition using terahertz in the past few years, which has provided a foundation for the study of terahertz in the detection and analysis of substance components. Baek et al. [25] investigated the feasibility of detecting methomyl, a carbamate in wheat and rice flours, using THz-TDS. The results showed that three absorption peaks were found in 0.1–3 THz, 1, 1.64, and 1.89 THz at room temperature, with the regression coefficient higher than 0.974, and the limit of detection of less than 3.74%. Hua et al. [26] applied THz-TDS technology to qualitatively and quantitatively detected four pesticides and three food powders in the frequency range of 0.5–1.6 THz. It was showed that the limits of detection (LOD) of imidacloprid was lower than 8% and the relative error was less than 5% in predicting the weight ratio of imidacloprid in these two mixtures by the partial least squares (PLS) model. Shen et al. [27] found that the THz spectral of caffeine and 3-acetylmorphine in the range of 0.2–2.6 THz were in good consistency with the spectra calculated by density functional theory (DFT) and Hartree-Fock (HF). Redo-Sanchez et al. [28] explored THz spectral properties of eleven antibiotics and found that eight of the antibiotics had THz fingerprint peaks. Moreover, two antibiotics in three kinds of food were detected by the THz system, which indicated the feasibility of THz technology for detection of antibiotics in food. These researches illustrated the existence of molecular terahertz fingerprint peaks and the potential of terahertz technology for quantitative detection of matters.
In this paper, terahertz time-domain spectroscopy (THz-TDS) was used to investigate 2,4-D spectral characteristics, including analysis of time-domain waveform, frequency-domain spectrum, and absorption spectrum. Additionally, DFT was applied to 2,4-D geometry optimization and vibration frequency calculation, and the generation mechanism of fingerprint peaks was explored. Then, feasibility of quantitative detection of 2,4-D in Zizania latifolia was explored by a terahertz system. The linear relationship between terahertz absorbance intensity and 2,4-D content was established. Overall, it is believed that this work provides a theoretical and experimental basis for fingerprint peaks analysis of 2,4-D and a rapid method to detect 2,4-D in Zizania latifolia.

2. Materials and Methods

2.1. Chemicals and Instrumentation

In this experiment, 2,4-D (C8H6Cl2O3) selected for this experiment was from Hangzhou Mumu Biological Technology Co., Ltd (Hangzhou, China), whose purity reached 99%. Zizania latifolia was from Hangzhou, China. The apparatus used in the experiment was a Terahertz time-domain spectrometer (CCT-1800), produced by China Communication Technology Co., Ltd (Shenzhen, China). CCT-1800 mainly consists of femtosecond laser sources, an optical delay system, and a free space terahertz emitter and detector. THz pulse was photoexcited by a 100 fs pulse, with a center wavelength of 780 nm. The usable bandwidth spanned 0–4 THz, with a spectral resolution of 20 GHz. A tablet machine purchased from Tianjin Tuopu Instrument Co., Ltd (Tianjin, China) was applied to sample preparation. The Nitrogen generator was from Shandong Saikesaisi Hydrogen Energy Co., Ltd (Jinan, China).

2.2. Sample Preparation

The method of 2,4-D tablet preparation was that 200 mg of 2,4-D powder (particle size < 75 μm) was pressed at 18 MPa for 4 minutes with a diameter of 13 mm. Pressure of 18 MPa for 4 minutes met the compaction requirement of experiment (compaction optimization experiment in Table S1). In order to reduce multiple reflections from affecting the experimental results, the upper and lower surfaces of the flat cylindrical sheet were parallel to each other. In addition, the method of mixed 2,4-D and Zizania latifolia tablet was prepared as follows. First, Zizania latifolia was ground to a sufficiently small particle size. Second, Zizania latifolia powder was sieved through 200 mesh filter (75 μm). Third, 200 mg of 2,4-D and Zizania latifolia powder were mixed at a mass ratio of different concentrations of 2,4-D (5%, 10%, 15%, 17%, 20%, 23%, 25%, 27%, 30%, and 33%) for a period of time until uniform. Fourth, the mixed 2,4-D and Zizania latifolia powder was pressed at 18 MPa for 4 minutes with a diameter of 13 mm.

2.3. Spectral Acquisition

In this work, the transmission module of apparatus was used to detect samples. First, the sample bin was filled with dry N2 for 2 minutes to eliminate interference of moisture in the air before THz spectra acquisition. Second, the terahertz time-domain spectrum of N2 was collected as a reference signal. Third, THz spectra of samples were acquired. Fourth, each time-domain spectrum was converted into a frequency-domain spectrum by Fourier transform. In order to ensure that the spectral data were not affected by random interference, each spectrum was obtained by re-sampling for 100 times.

2.4. Theoretical Density Functional Theory Calculations

DFT [29,30] is a common method for molecular geometry optimization and frequency vibration calculation. The principle of DFT is the exchange-correlation functionals [31]. DFT not only has higher calculation accuracy and less computational complexity, but can also consider the correlation effects such as electron energy and spin to a certain degree, which is suitable for analysis of most molecular structures. It has been demonstrated that DFT can achieve higher accuracy in molecular structure optimization and harmonic vibrational frequencies calculation than the more computationally demanding MP2 method [32]. Moreover, the performance of B3LYP [33] hybrid density functional in combination with various basis sets has been widely used for molecular geometries, vibrational frequencies, ionization energies and electron affinities, dipole and quadrupole moments, atomic charges, infrared intensities, and magnetic properties [34].
In this work, B3LYP with three different basis sets, 6-31G, 6-31G (d, p), and 6-31G++ (d, p), respectively, were applied to DFT calculation using Gaussian 09 software, where (d, p) denoted the addition of polarization function and ++ denoted the addition of diffusive function to the hydrogen atom and heavy atom.

3. Results and Discussion

3.1. Experimental Terahertz Spectra of 2,4-D

Figure 1A shows the terahertz time-domain waveforms of reference and 2,4-D, Figure 1B are the terahertz frequency-domain spectra of reference and 2,4-D, and Figure 1C is terahertz absorption spectra of 2,4-D in the range of 0–4 THz. As shown in Figure 1A, the 2,4-D time-domain terahertz waveform had a spectral phase difference and an amplitude difference in comparison with the reference time-domain waveform. The reason was that the optical path of the terahertz wave passing through 2,4-D was larger than N2. Therefore, the terahertz spectrum of 2,4-D lagged behind the reference spectrum. Beside this, the amplitude of the terahertz spectrum of 2,4-D was lower than that of the reference signal because of the absorption, reflection, and scattering of terahertz by 2,4-D.
Moreover, compared with the amplitude of reference signal, the frequency-domain amplitude of 2,4-D was lower (Figure 1B). Also, there were three positions with absorption characteristics in the frequency-domain spectrum of 2,4-D at 1.36, 1.60, and 2.38 THz, respectively, among which, the position at 1.36 THz had the most obvious absorption effect. In a previous experiment, the third peak of 2,4-D was detected at 2.67 THz [35], which was different from the results obtained in this work. A THz time-domain spectrometer (Teraview, UK) was used in the previous experiment. Therefore, the different experimental results were probably caused by the difference of instrument components and performance. In Figure 1C, with the increase of frequency, the baseline of the absorption spectrum rose, which may have been caused by the scattering effects [36]. It can be seen that whether the frequency-domain spectrum or absorption spectrum, the usable frequency range of the sample was in the range of 0.1 to 3 THz. When the THz spectrum was below 0.1 THz, the signal-to-noise ratio (SNR) significantly reduced. Low frequency of the TDS system was mainly limited by diffraction losses and bandwidth of the antenna. When the THz spectrum was greater than 3 THz, the high-frequency oscillations noise was too large.

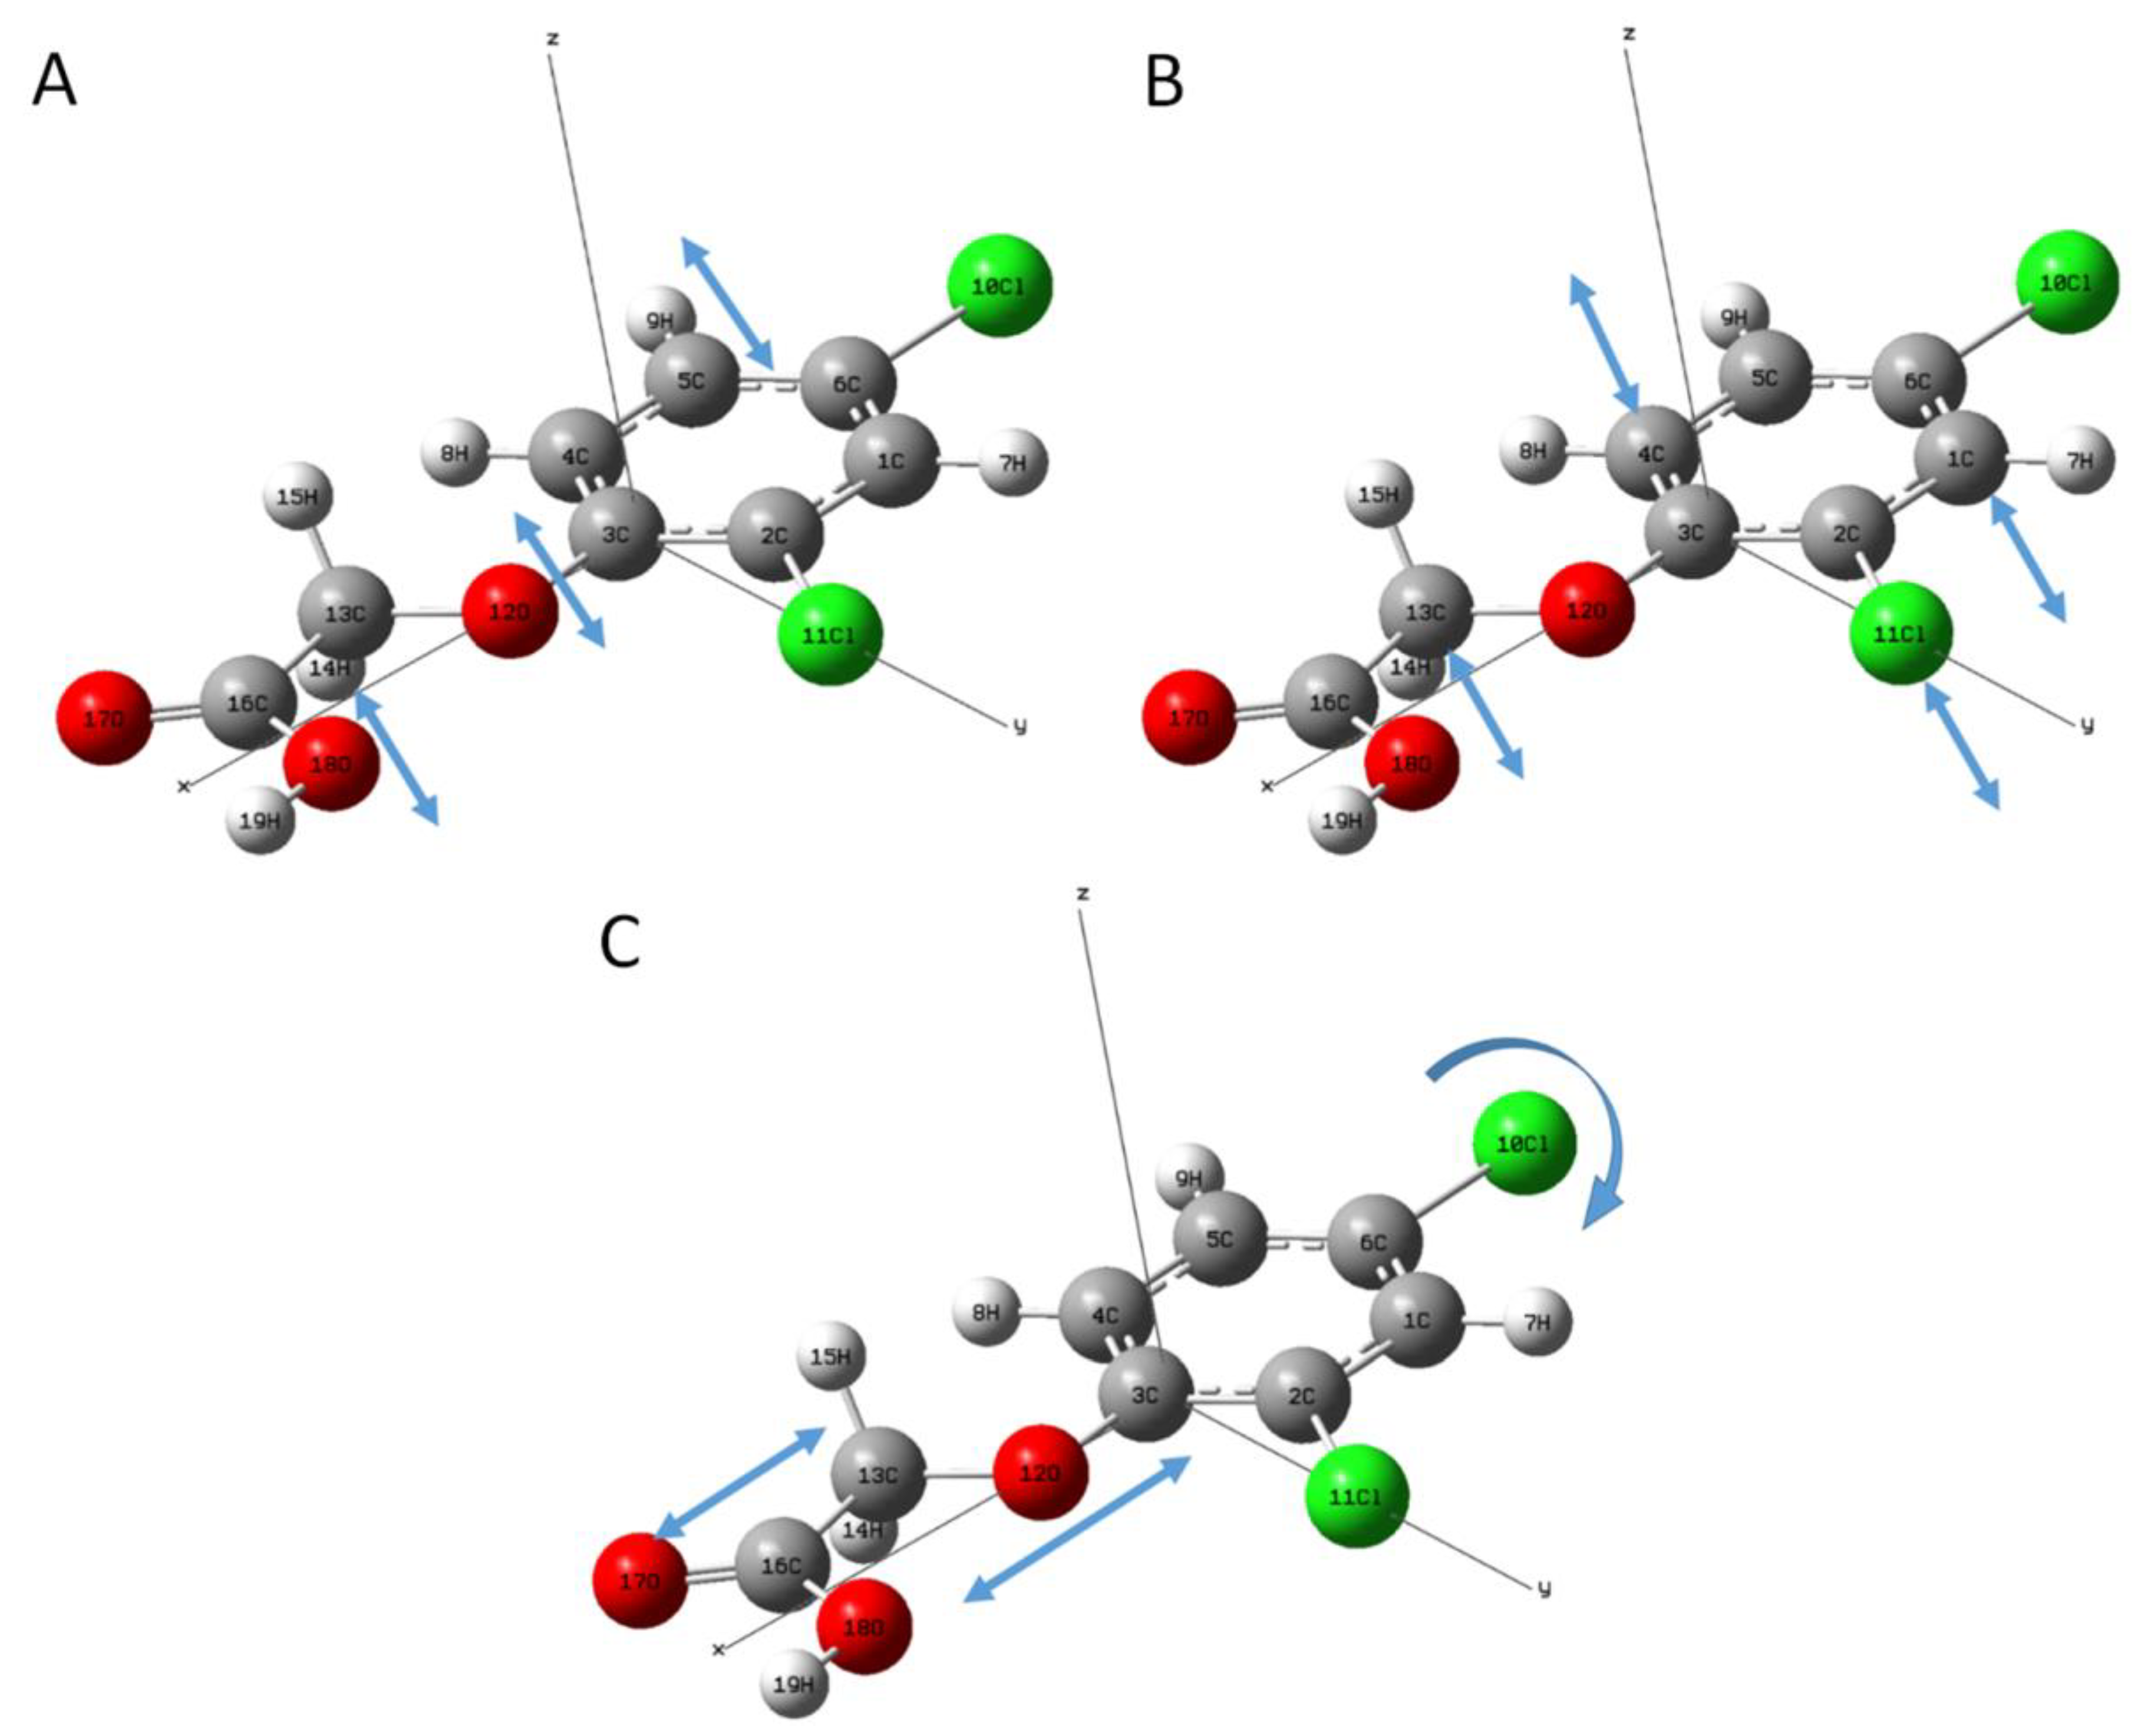
3.2. Theoretical Calculation and Analysis

For detailed analysis of spectral characteristics, DFT was applied to 2,4-D geometry optimization and frequency calculation. Figure 2 shows the comparison between the 2,4-D experimental spectrum and the theoretical spectrum calculated by B3LYP with three basis sets in the range of 1.1–2.8 THz. Furthermore, in order to analyze the absorption spectrum more intuitively, the baseline correction was conducted to the experimental obtained spectrum. In addition, the assignment of the calculated absorption peaks are summarized in Table 1.
It can be seen from Figure 2 that there were four DFT-calculated absorption peaks of 2,4-D for all the three basis sets. The four absorption peaks calculated by three basis sets had similar peak positions, at around 1.36, 1.57, 1.93, and 2.59 THz, respectively. Moreover, according to the frequency RMSD (root-mean-square deviation) values of 2,4-D theoretical absorption peaks, compared to experimental absorption peaks in Table 1, it shows that all the basis sets had good calculation results. Comparing spectra calculated by 6-31G with 6-31G (d, p), it can be seen that the addition of a polarization function caused all the absorption peaks to blue shift. Moreover, it shows that theoretical spectra calculated by 6-31G (d, p) and 6-31G++ (d, p) had better consistency with the experimental spectrum on the first two absorption peak positions than theoretical spectra calculated by 6-31G.
The theoretical spectra absorption peaks had a good consistency with experimental spectra, especially at 1.36 and 1.60 THz, which indicated that the theoretical calculation was feasible. However, there were some slight discrepancies between experimental absorption spectra and DFT-calculated absorption spectra. For instance, there was a blue shift phenomenon for the absorption peak at around 2.38 THz in the theoretical spectra. First, the theoretical calculation was to calculate isolated molecule without considering the intermolecular forces. Second, it might be that theoretical spectra were calculated based on the environment of 0 K, while the experimental spectra were performed at 294 K. The experimental spectra obtained at 294K showed broader absorption than theoretical spectra, especially at 2.38 THz, which was mainly due to the high temperature of the molecule (294 K, or 25 meV) compared with the THz photon energy (2–8 meV). Therefore, a lower energy resonance will have a contribution from hot-band transitions, which results in broadening [37]. An absorption peak at around 1.92 THz was not detected in the previous experiment, which might be caused by limitation of apparatus performance.
In order to further analyze the formation mechanism of the terahertz fingerprint peaks, the vibrational modes of 2,4-D molecular at the absorption peaks of 1.36, 1.60, and 2.38 THz are shown in Figure 3. The experimental results showed that the absorption peaks of 2,4-D at these three peaks were caused by the action of different bonds. The absorption peak at 1.36 THz was mainly caused by the joint motion of the two parts. One part was the out-plane stretching vibration and deformation vibration of C–O–C (3C, 12O, 13C) along the Z-axis direction. The other part was the ring vibration. Simultaneously, these two movements were accompanied by the stretching and deformation vibration of C–O and O–H (16C, 18O, 19H) along the Z-axis direction. The absorption peak at 1.60 THz was also mainly generated by the combination of two parts of motions. One was the out-plane stretching vibration and deformation vibration of two C–H (13C, 14H, 15H) along the Z-axis direction. The other was the out-plane stretching vibration and deformation vibration of C–Cl (2C, 11Cl) along the Z-axis direction. In addition, these motions were also accompanied with the ring vibration. The absorption peak at 2.38 THz was mainly formed by the in-plane stretching vibration of C–O–C (3C, 12O, 13C) along the X-axis and the in-plane stretching and deformation vibration of C–Cl (6C, 10Cl) in the X-Y plane. In addition, these motions were companied with stretching and deformation vibration of carboxyl group along the X-axis.

3.3. Quantitative Analysis of 2,4-D in Zizania Latifolia

In this paper, we further studied the feasibility of quantitative detection of 2,4-D in Zizania latifolia by THz technology. Figure 4 shows the frequency-domain spectrum of pure Zizania latifolia in the range of 0–4 THz. Absorbance spectra of Zizania latifolia mixtures at six different concentrations of 2,4-D (5%, 10%, 15%, 20%, 25%, and 30%) were detected, and the results are shown in Figure 4B.
From Figure 4A, it can be seen that there was no absorption peak of Zizania latifolia at a usable detection range. Therefore, it would not influence quantitative analysis of 2,4-D. In the region with frequency greater than 2.5 THz, the SNR decreased significantly. Therefore, the usable range should be below 2.5 THz, which was smaller than for pure 2,4-D. From Figure 4B, it can be seen that only the absorption peak at 1.36 THz could be detected clearly. The second absorption peak could not be detected because its signal was too weak, and the third absorption peak was submerged in the noise. Moreover, it shows that the spectra had different degrees of baseline drift, which made it difficult for quantitative analysis. The baseline drift was mainly caused by a scattering effect, which might be related to sample particle size [38]. Therefore, baseline correction was conducted to these spectra for further analysis.
It can be seen from Figure 4C, the 2,4-D absorption peak at 1.36 THz was detected obviously, and the absorption peak intensity at 1.36 THz had a corresponding increase trend with increase of 2,4-D concentration, which could be used as the main peak for quantitative analysis. At 1.36 THz, the LOD of 2,4-D was lower than 5%, which was close to the LOD of pesticide residues in food obtained by other researchers using terahertz. Figure 5 shows the fitting curve between 2,4-D concentration and absorbance at 1.36 THz. The fitting curve achieved a good linear regression relationship with an R2 of 0.9854. To verify the accuracy of the model, 17%, 23%, 27%, and 33% concentrations of 2,4-D in Zizania latifolia were detected by THz-TDS, and the results are shown in Table 2. The result showed that the recovery was 93.29%–98.75%, which fully demonstrated the great potential of THz technology in the detection of 2,4-D in Zizania latifolia. However, the LOD still could not reach the detection requirement for actual application, and further researches on improving apparatus sensitivity and designing usable signal enhancement materials need to be conducted.

4. Conclusions

In this paper, THz spectra of 2,4-D were obtained by using THz-TDS, and its spectral characteristics were analyzed. It was found that there were three distinct characteristic absorption peaks of 2,4-D at 1.36, 1.60, and 2.38 THz, respectively. Combined with DFT, single molecule of 2,4-D geometry optimization and frequency vibration calculation were conducted. It was shown that the theoretical calculation results were in good consistency with the experimental results, except the absorption peak at around 1.93 THz. Then, we demonstrated the feasibility of THz-TDS in the quantitative detection of 2,4-D in Zizania latifolia. The absorption peaks at 1.36 THz could be used as the main peak for 2,4-D quantitative analysis. The limit of detection was lower than 5%. The fitting curve between 2,4-D in Zizania latifolia concentration and absorbance achieved a good linear regression relationship. This work enriches the fingerprint database of pesticide molecules on the basis of terahertz spectroscopy and can provide a technical support for the detection of 2,4-D in food by terahertz spectroscopy. However, the detection of limit is not low enough, and it may be optimized by improving instrument performance and designing suitable signal enhancement materials in the future.

Supplementary Materials

The following are available online at https://www.mdpi.com/2076-3417/9/11/2248/s1, Table S1: Thickness measure of tablet under different pressure.

Author Contributions

The work presented here was carried out in collaboration between all authors. P.N. and C.C. conceived the idea. F.Q., L.L. and T.D. co-worked on associated data collection and carried out the experimental work. C.C. drafted the manuscript, P.N. and Y.H. provided their experience and co-wrote the paper. All authors contributed to, reviewed and improved the manuscript.

Funding

This work was supported in part by National key research and development plan (2018YFD0700704).

Acknowledgments

We would like to thank Qi Zhenyu from Zhejiang University for his experimental guidance and help.

Conflicts of Interest

The authors declare no conflict of interest.

References

  1. Li, K.; Wu, J.Q.; Jiang, L.L.; Shen, L.Z.; Li, J.Y.; He, Z.H.; Wei, P.; Lv, Z.; He, M.F. Developmental toxicity of 2,4-dichlorophenoxyacetic acid in zebrafish embryos. Chemosphere 2017, 171, 40–48. [Google Scholar] [CrossRef] [PubMed]
  2. Song, Y. Insight into the mode of action of 2,4-dichlorophenoxyacetic acid (2,4-D) as an herbicide. J. Integr. Plant Biol. 2014, 56, 106–113. [Google Scholar] [CrossRef]
  3. Salman, J.M.; Hameed, B.H. Adsorption of 2,4-dichlorophenoxyacetic acid and carbofuran pesticides onto granular activated carbon. Desalination 2010, 256, 129–135. [Google Scholar] [CrossRef]
  4. Itoh, K.; Kinoshita, M.; Morishita, S.; Chida, M.; Suyama, K. Characterization of 2,4-dichlorophenoxyacetic acid and 2,4,5-trichlorophenoxyacetic acid-degrading fungi in Vietnamese soils. Fems Microbiol. Ecol. 2013, 84, 124–132. [Google Scholar] [CrossRef]
  5. Xia, Z.Y.; Zhang, L.; Zhao, Y.; Yan, X.; Li, S.P.; Gu, T.; Jiang, J.D. Biodegradation of the Herbicide 2,4-Dichlorophenoxyacetic Acid by a New Isolated Strain of Achromobacter sp. LZ35. Curr. Microbiol. 2017, 74, 193–202. [Google Scholar] [CrossRef] [PubMed]
  6. Ma, J.Y.; Quan, X.C.; Yang, Z.F.; Li, A.J. Biodegradation of a mixture of 2,4-dichlorophenoxyacetic acid and multiple chlorophenols by aerobic granules cultivated through plasmid pJP4 mediated bioaugmentation. Chem. Eng. J. 2012, 181–182, 144–151. [Google Scholar] [CrossRef]
  7. Salman, J.M.; Njoku, V.O.; Hameed, B.H. Batch and fixed-bed adsorption of 2,4-dichlorophenoxyacetic acid onto oil palm frond activated carbon. Chem. Eng. J. 2011, 174, 33–40. [Google Scholar] [CrossRef]
  8. Rosa, P.D.L.; Barnett, J.B.; Schafer, R. Characterization of thymic atrophy and the mechanism of thymocyte depletion after in vivo exposure to a mixture of herbicides. J. Toxicol. Environ. Health Part A 2005, 68, 81–98. [Google Scholar] [CrossRef]
  9. Holland, N.T.; Duramad, P.; Rothman, N.; Figgs, L.W.; Blair, A.; Hubbard, A.; Smith, M.T. Micronucleus frequency and proliferation in human lymphocytes after exposure to herbicide 2,4-dichlorophenoxyacetic acid in vitro and in vivo. Mutat. Res. Genet. Toxicol. Environ. Mutagen. 2002, 521, 165–178. [Google Scholar] [CrossRef]
  10. Codex Alimentarius. FAO-WHO. Available online: http://www.fao.org/fao-who-codexalimentarius/en/ (accessed on 11 April 2019).
  11. Chen, X.; Zhang, H.; Wan, Y.; Chen, X.; Li, Y. Determination of 2,4-Dichlorophenoxyacetic acid (2,4-D) in rat serum for pharmacokinetic studies with a simple HPLC method. PLoS ONE 2018, 13, e0191149. [Google Scholar] [CrossRef]
  12. Geng, Z.M.; Chen, M.; Wang, R.; Zheng, Q. Determination of 2,4-dichlorophenoxyacetic Acid Residue in Orange Using High Performance Liquid Chromatography. Jiangsu J. Agric. Sci. 2007, 23, 67–70. [Google Scholar]
  13. González, A.J.; Gallego, A.; Gemini, V.L.; Papalia, M.; Radice, M.; Gutkind, G.; Planes, E.; Korol, S.E. Degradation and detoxification of the herbicide 2,4-dichlorophenoxyacetic acid (2,4-D) by an indigenous Delftia sp. strain in batch and continuous systems. Int. Biodeterior. Biodegrad. 2012, 66, 8–13. [Google Scholar] [CrossRef]
  14. Vdovenko, M.M.; Stepanova, A.S.; Eremin, S.A.; Van, C.N.; Uskova, N.A.; Yu, S.I. Quantification of 2,4-dichlorophenoxyacetic acid in oranges and mandarins by chemiluminescent ELISA. Food Chem. 2013, 141, 865–868. [Google Scholar] [CrossRef]
  15. Jin-Liang, J.; Han-Hong, X.; Gui-Rong, Z.; Zhun, H.; Bo-Qing, X. High quality gold nanorods and nanospheres for surface-enhanced Raman scattering detection of 2,4-dichlorophenoxyacetic acid. Nanotechnology 2012, 23, 495710. [Google Scholar]
  16. Wells, R.J.; Hook, J.M.; Al-Deen, T.S.; Hibbert, D.B. Quantitative nuclear magnetic resonance (QNMR) spectroscopy for assessing the purity of technical grade agrochemicals: 2,4-dichlorophenoxyacetic acid (2,4-D) and sodium 2,2-dichloropropionate (Dalapon sodium). J. Agric. Food Chem. 2002, 50, 3366–3374. [Google Scholar] [CrossRef]
  17. Trivedi, N.S.; Mandavgane, S.A.; Kulkarni, B.D. Mustard plant ash: A source of micronutrient and an adsorbent for removal of 2,4-dichlorophenoxyacetic acid. Environ. Sci. Pollut. Res. 2016, 23, 1–13. [Google Scholar] [CrossRef]
  18. Ma, Y.; Wang, Q.; Li, L. PLS model investigation of thiabendazole based on THz spectrum. J. Quant. Spectrosc. Radiat. Transf. 2013, 117, 7–14. [Google Scholar] [CrossRef]
  19. Haddad, J.E.; Miollis, F.D.; Sleiman, J.B.; Canioni, L.; Mounaix, P.; Bousquet, B.; Chem, A. Chemometrics applied to quantitative analysis of ternary mixtures by terahertz spectroscopy. Anal. Chem. 2014, 86, 4927–4933. [Google Scholar] [CrossRef]
  20. Baxter, J.B.; Guglietta, G.W. Terahertz spectroscopy. Anal. Chem. 2011, 83, 4342–4368. [Google Scholar] [CrossRef]
  21. Zhan, H.; Wu, S.; Bao, R.; Ge, L.; Zhao, K. Qualitative identification of crude oils from different oil fields using terahertz time-domain spectroscopy. Fuel 2015, 143, 189–193. [Google Scholar] [CrossRef]
  22. Mccrindle, I.J.H.; Grant, J.; Drysdale, T.D.; Cumming, D.R.S. Multi-Spectral Materials: Hybridisation of Optical Plasmonic Filters and a Terahertz Metamaterial Absorber. Adv. Opt. Mater. 2014, 2, 149–153. [Google Scholar] [CrossRef]
  23. Siegel, P.H. Terahertz technology. IEEE Trans. Microw. Theory Tech. 2002, 50, 910–928. [Google Scholar] [CrossRef]
  24. Qu, F.; Lei, L.; Yong, H.; Nie, P.; Cai, C.; Tao, D.; Yi, P.; Yu, T.; Luo, S. Terahertz Multivariate Spectral Analysis and Molecular Dynamics Simulations of Three Pyrethroid Pesticides. J. Infrared Millim. Terahertz Waves 2018, 39, 1148–1161. [Google Scholar] [CrossRef]
  25. Baek, S.H.; Ju, H.K.; Hwang, Y.H.; Kang, M.O.; Kwak, K.; Chun, H.S. Detection of Methomyl, a Carbamate Insecticide, in Food Matrices Using Terahertz Time-Domain Spectroscopy. J. Infrared Millim. Terahertz Waves 2016, 37, 486–497. [Google Scholar] [CrossRef]
  26. Hua, Y.; Zhang, H. Qualitative and Quantitative Detection of Pesticides With Terahertz Time-Domain Spectroscopy. IEEE Trans. Microw. Theory Tech. 2010, 58, 2064–2070. [Google Scholar]
  27. Shen, J.; Wang, G.; Jiang, D.; Liang, L.; Xu, X. Terahertz spectroscopic investigations of caffeine and 3-acetylmorphine. Opt. Int. J. Light Electron Opt. 2010, 121, 1712–1716. [Google Scholar] [CrossRef]
  28. Albert, R.S.; Gerard, S.; Regina, G.; Eva, R.; José-Antonio, G.R.; Massimo, C.; Javier, T. Assessment of terahertz spectroscopy to detect antibiotic residues in food and feed matrices. Analyst 2011, 136, 1733–1738. [Google Scholar]
  29. Emel’Yanova, N.; Krivenko, A.; Manzhos, R.; Bozhenko, K.; Aldoshin, S. Comparison of pure and hybrid DFT functionals for geometry optimization and calculation of redox potentials for iron nitrosyl complexes with “μ-SCN” bridging ligands. Theor. Chem. Acc. 2013, 132, 1316–1323. [Google Scholar] [CrossRef]
  30. Bechstedt, F. Density Functional Theory. Oyobuturi 2015, 181, 39–59. [Google Scholar]
  31. Marques, M.A.L.; Oliveira, M.J.T.; Burnus, T. LIBXC: A library of exchange and correlation functionals for density functional theory. Comput. Phys. Commun. 2012, 183, 2272–2281. [Google Scholar] [CrossRef]
  32. Lee, C.; Yang, W.; Parr, R.G. Development of the Colle-Salvetti correlation-energy formula into a functional of the electron density. Phys. Rev. B 1988, 37, 785–789. [Google Scholar] [CrossRef] [Green Version]
  33. Becke, A.D. Density-functional thermochemistry. III. The role of exact exchange. J. Chem. Phys. 1993, 98, 5648–5652. [Google Scholar] [CrossRef]
  34. Pellizzeri, S.; Delaney, S.P.; Korter, T.M.; Zubieta, J. Using solid-state density functional theory and terahertz spectroscopy to spectroscopically distinguish the various hydrohalide salts of 5-(4-pyridyl) tetrazole. J. Mol. Struct. 2013, 105, 27–34. [Google Scholar] [CrossRef]
  35. Qu, F.; Lin, L.; Cai, C.; Dong, T.; He, Y.; Nie, P. Molecular Characterization and Theoretical Calculation of Plant Growth Regulators Based on Terahertz Time-Domain Spectroscopy. Appl. Sci. 2018, 8, 420. [Google Scholar] [CrossRef]
  36. Garet, F.; Hofman, M.; Meilhan, J.; Simoens, F.; Coutaz, J.L. Evidence of Mie scattering at terahertz frequencies in powder materials. Appl. Phys. Lett. 2014, 105, 031106-1–031106-4. [Google Scholar] [CrossRef]
  37. Neu, J.; Nikonow, H.; Schmuttenmaer, C.A. Terahertz Spectroscopy and Density Functional Theory Calculations of dl-Norleucine and dl-Methionine. J. Phys. Chem. A 2018, 122, 5978–5982. [Google Scholar] [CrossRef]
  38. Bandyopadhyay, A.; Sengupta, A.; Barat, R.B.; Gary, D.E.; Federici, J.F.; Chen, M.; Tanner, D.B. Effects of Scattering on THz Spectra of Granular Solids. Int. J. Infrared Millim. Waves 2007, 28, 969–978. [Google Scholar] [CrossRef]
Figure 1. THz spectra of the reference and 2,4-dichlorophenoxyacetic acid. (A) Time-domain waveforms; (B) Frequency-domain spectra; (C) Absorption spectrum of 2,4-D.
Applsci 09 02248 g001
Figure 2. Comparison between experimental and theoretical absorption spectra of 2,4-dichlorophenoxyacetic acid. (A) Theoretical spectra calculated by B3LYP/6-31G; (B) Theoretical spectra calculated by B3LYP/6-31G (d, p); (C) Theoretical spectra calculated by B3LYP/6-31G++ (d, p).
Applsci 09 02248 g002
Figure 3. Absorption peak vibration modes of 2,4-dichlorophenoxyacetic acid. (A) Absorption peak vibration at 1.36 THz; (B) Absorption peak vibration at 1.60 THz; (C) Absorption peak vibration at 2.38 THz.
Applsci 09 02248 g003
Figure 4. THz spectra of 2,4-dichlorophenoxyacetic acid and Zizania latifolia mixtures. (A) Frequency-domain spectrum of Zizania latifolia; (B) Absorption spectra of Zizania latifolia mixtures with six different concentrations of 2,4-D from 0 to 3 THz; (C) Absorption spectra after baseline correction from 1.2 to 1.5 THz.
Applsci 09 02248 g004
Figure 5. Fitting curve between 2,4-D concentration and absorbance at 1.36 THz.
Applsci 09 02248 g005
Table 1. The assignment of the calculated absorption peaks.
ExperimentB3LYP/
6-31G
B3LYP/
6-31G(d, p)
B3LYP/
6-31G++(d, p)
Assignment
1.361.321.371.36υring+δ(3C-12O-13C)oop
1.601.551.581.57υring+δ(13C-14/15H)oop+δ(2C-11CL)oop
-1.921.941.93υ(6C-18CL)ip+υ(2C-11CL)ip+υ(13C-12O)ip
2.382.592.642.56υ(3C-12O-13C)ip+υ(6C-10CL)ip
RMSD0.130.150.11-
υ: telescopic vibration, δ: deformation vibration, oop: surface external bending, ip: surface internal bending.
Table 2. Recovery of 2,4-D detection in Zizania latifolia.
Actual Concentration (%)Predicted Concentration (%)Recovery (%)
1716.4096.47
2321.4693.29
2725.7295.26
3332.5998.75

