Featured Application
1. By calculation, the signal-to-noise ratio of some infrared bands imaging for high-orbit extended spacecrafts is sufficient under the right conditions. 2. Successfully build a K-band infrared imaging terminal applied on a 1.23 m photoelectric telescope. 3. Through the observational imaging experiment, the results of high-orbit objects verified the simulation calculation.
Abstract
To determine the feasibility of observing high-orbit targets with a large aperture telescope, we created a simulation based on electronics to evaluate the signal-to-noise ratio (SNR) model for an infrared ground-based photoelectric system. Atmosphere transmission and sky background radiation data were obtained using MODTRAN software, then the SNRs of the high-orbit target (HOT) in different temperatures and orbit heights were calculated separately. The results showed that the observation of the HOT in a short band was possible, and the effect of short-wave was excellent at low temperatures. On the basis of this model, some space targets were observed by a K-band photoelectric telescope for verification and had constructive results. Thus, the model can be used as a basis for whether a HOT can be detected.
1. Introduction
Contemporary ground-based monitoring techniques mainly include optical telescopes and radars. Radar systems searching for a typical target at a high orbit must employ high-power transmitters, which are large and heavy [,]. Furthermore, a radar system must emit signals actively, which can easily expose its presence and location []. In contrast, optical telescopes have the advantages of high resolution and the capacity to detect stealth targets, and they provide indications of satellite health, status, and activity. Ground-based imaging of targets in multiple infrared wavebands can also provide information from spatially resolved temperature maps that can be analyzed []. Lambert [], using thermal information from the Space Surveillance Network Analysis Model database, developed a computer model to predict the infrared brightness of satellites. The predicted value can be compared with observed values of various satellites to enhance the stability of payloads. Jin [] developed a R-band filter optical telescope for observing brightness variations of satellites to determine the reflectance of artificial objects versus the sun phase angle. This work benefits the brightness changes of other unknown objects. Anil [] developed an analytical method for isolating the spectral radiances of solar and low-orbit satellites using an infrared photoelectric system. His model is useful for processing single-band radiometric data, as well as multispectral and hyperspectral data from the perspective of object detection. Liu [] used a large F-number mid-waveband infrared camera with a cold stop applied on a 1.23 m photoelectric telescope. It had detected the International Space Station and some typical low-Earth orbit objects. Signal-to-noise ratio (SNR) is an important index for detecting whether a space object can be detected. High-orbit targets (HOT) usually have a small SNR, and are limited by weather factors, the distance from observer to object, etc. This paper developed a SNR model relating the orbit height, target temperature, atmospheric transmittance, sky background radiation, and many parameters of a 1.23 m optical system. The goal of our model was to determine whether a given satellite could be detected reliably at the necessary range by our system.
The remainder of this paper is organized as follows. In Section 2, a SNR math model of the satellite is presented. In Section 3, we simulate the SNR of HOT at different zenith angles and infrared bands. In Section 4, we analyze the result of calculate values. In Section 5, a simple space target observation experiment of the K-band is built, and conclusions follow in Section 6.
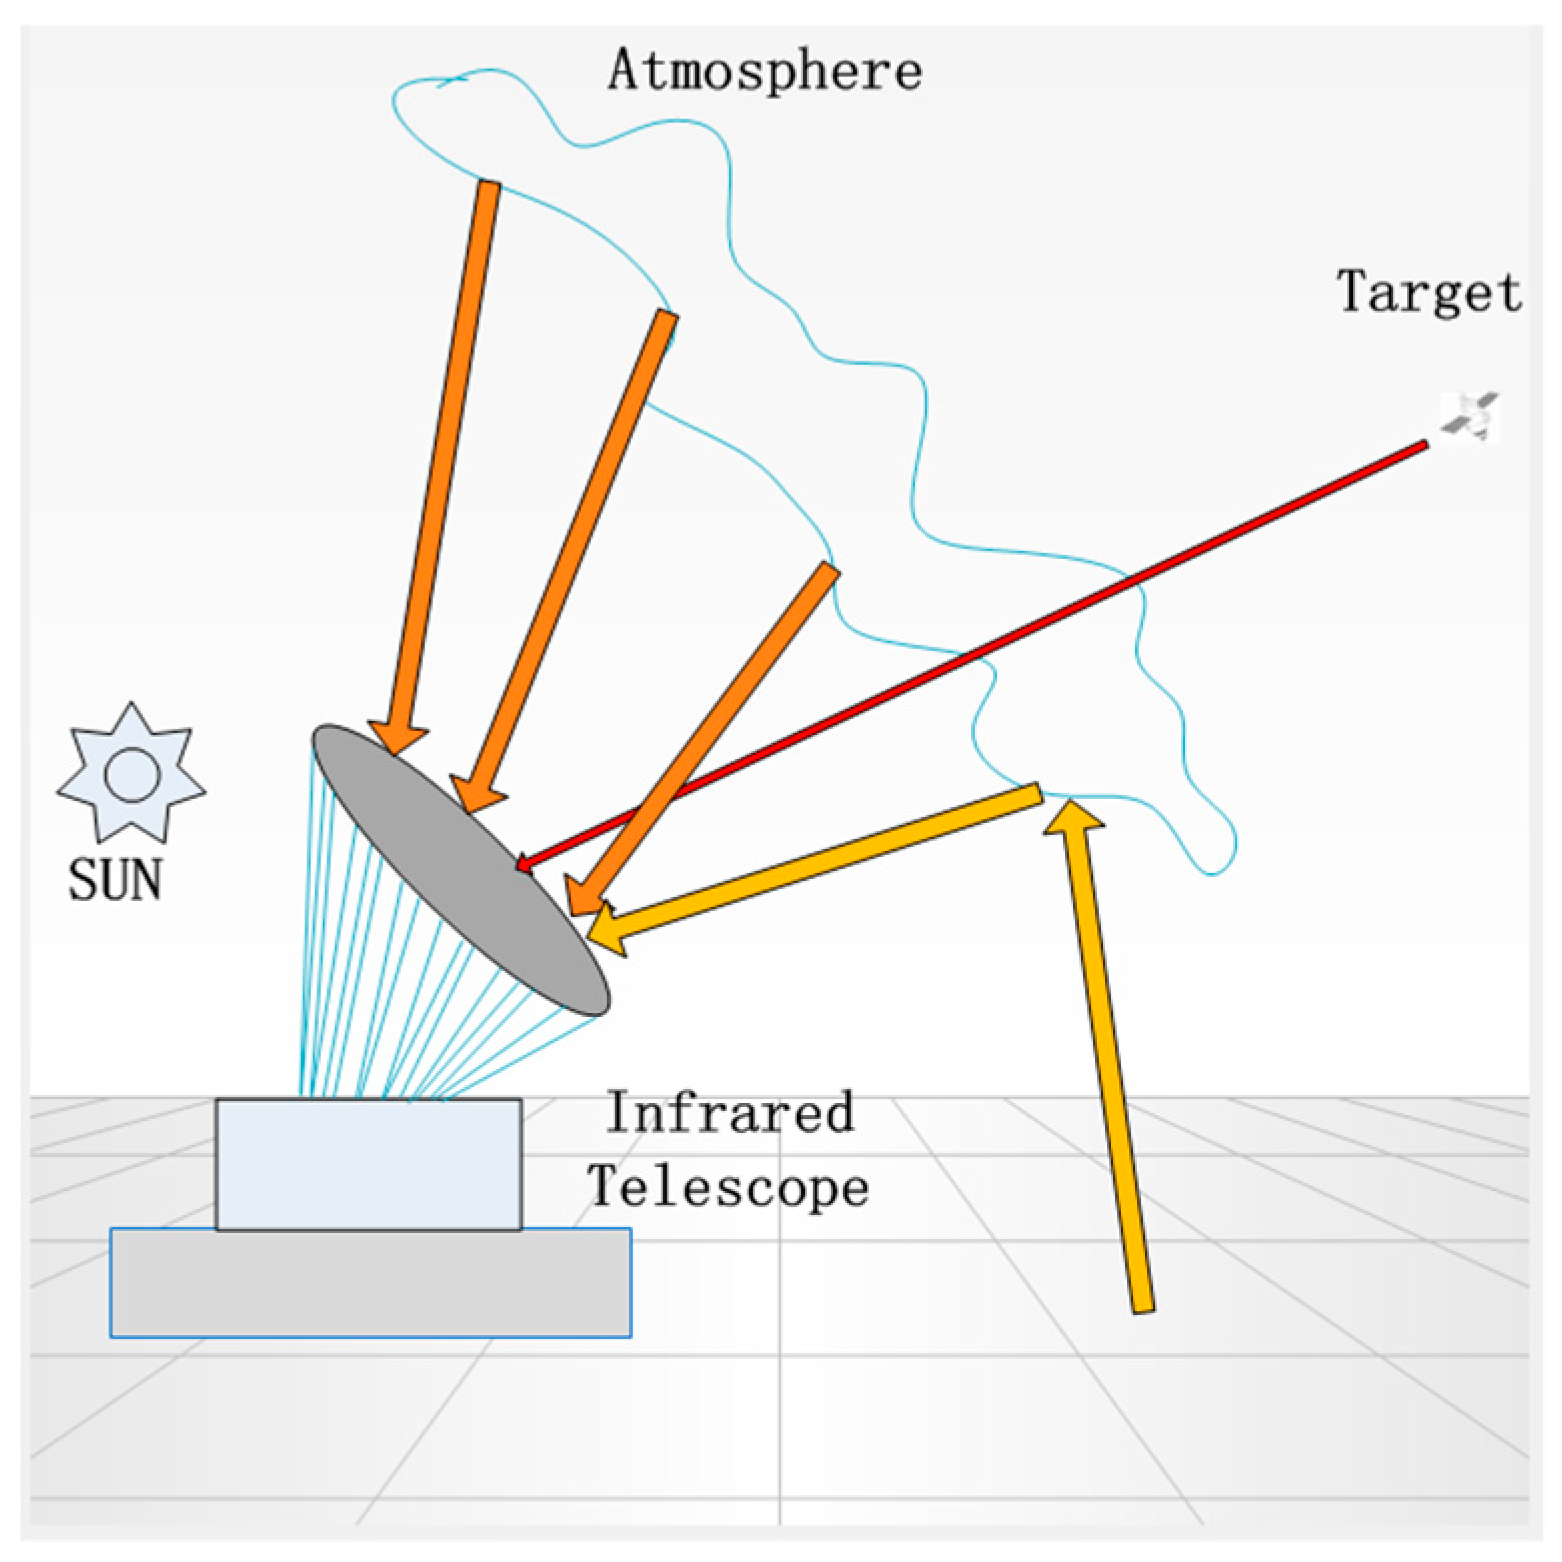
2. Signal-to-Noise Model of Satellite
The HOT works at a distance farther than 8000 km above the Earth, where the environment around the target is at absolute zero temperature; therefore, the target can be regarded as a point source black-body from the observer, the schematic of target model is shown in Figure 1.
Figure 1.
The schematic of infrared telescope detecting the high-orbit target (HOT).
According to the definition of Planck’s black-body radiation spectrum formula, the total spectral radiance of the target relative to the observer can be obtained by
where T is the temperature of the radiation cavity of the black-body, is the area seen from the observer, is the detecting band, is the effective emissivity, h is the Planck constant, and c is the speed of light.
The power of the target through the atmospheric incidence on the telescope pupil entrance can be expressed as
where is the atmospheric transmission, is the input pupil area of the telescope, and R is the distance from target to observer.
The energy received by the telescope was reflected repeatedly by an optical system, then it reached an infrared focal plane array. The integration time of the detector varied with different circumstances, so the energy that eventually reached the focal plane can be expressed as follows []:
where is the transmission of the optics and t is exposure time of detector.
When telescopes track targets, the sky background covers the entire view of the telescope. The individual field of view for one pixel can be defined as the source area, and the power incident on one pixel is expressed by Reference []:
where is the spectral radiation of the sky, F is the f-number of the system, and Ad is the area of the detector pixel.
Infrared detector noises included readout noise, dark current noise, and photon noise []. Therefore, the energy of the target and sky background was converted into electronics to calculate the SNR using the formula to convert joules to photons. In the range of the infrared shortwave, photons and electrons are converted equally; however, the availability electronic number depends on the quantum efficiency of the detector. So, the electronic of the target and sky background is
As HOTs were too far away from the telescope, the target was projected on the focal plane in point form. Assuming that the target occupied only one pixel, the SNR can be expressed as
where is the number of read noise electrons per pixel, is the dark current noise expressed in electrons, and is the noise of stray light.
3. Parameters for Simulation
Using MODTRAN, we simulated six form data from short infrared to long infrared, and the specific band division is shown in Table 1. The atmospheric transmission and radiation are shown in Figure 2. The excellent atmospheric transmission lines in the wavelength region were in the H and K bands, while the M band had a very low transmission. Radiances were lower than 5.0 × 10⁻⁵ , except in the J and H bands.
Table 1.
Main window from short infrared to long infrared.
Figure 2.
Average transmittance and sky radiance of infrared band with the Mid-Latitude Summer model at a different Zenith angle: (a) Atmospheric transmittance trend of each infrared band at different Zenith angles; (b) The radiance sky radiance trend of each infrared band at different Zenith angles.
The model was run for an observer at 43.85 latitude and 125.4 longitude in the Changchun area. The phase angle of the sun was set at 60 degrees, and the target-included angle (the sun-target-Earth angle, where the vertex is the target) was larger than 100 degrees []. In this case, the direct light of sun exposure to the telescope could be neglected.
Ground-based detection systems are mainly composed of optical telescopes (which collect the radiation of the target) and photoelectric sensors (which convert photons into electrons). Optic transmission included the transmission of telescope mirrors and Dewar windows, and the parameters are listed in Table 2.
Table 2.
List of parameters used to calculate signal-to-noise ratio (SNR) for simulation.
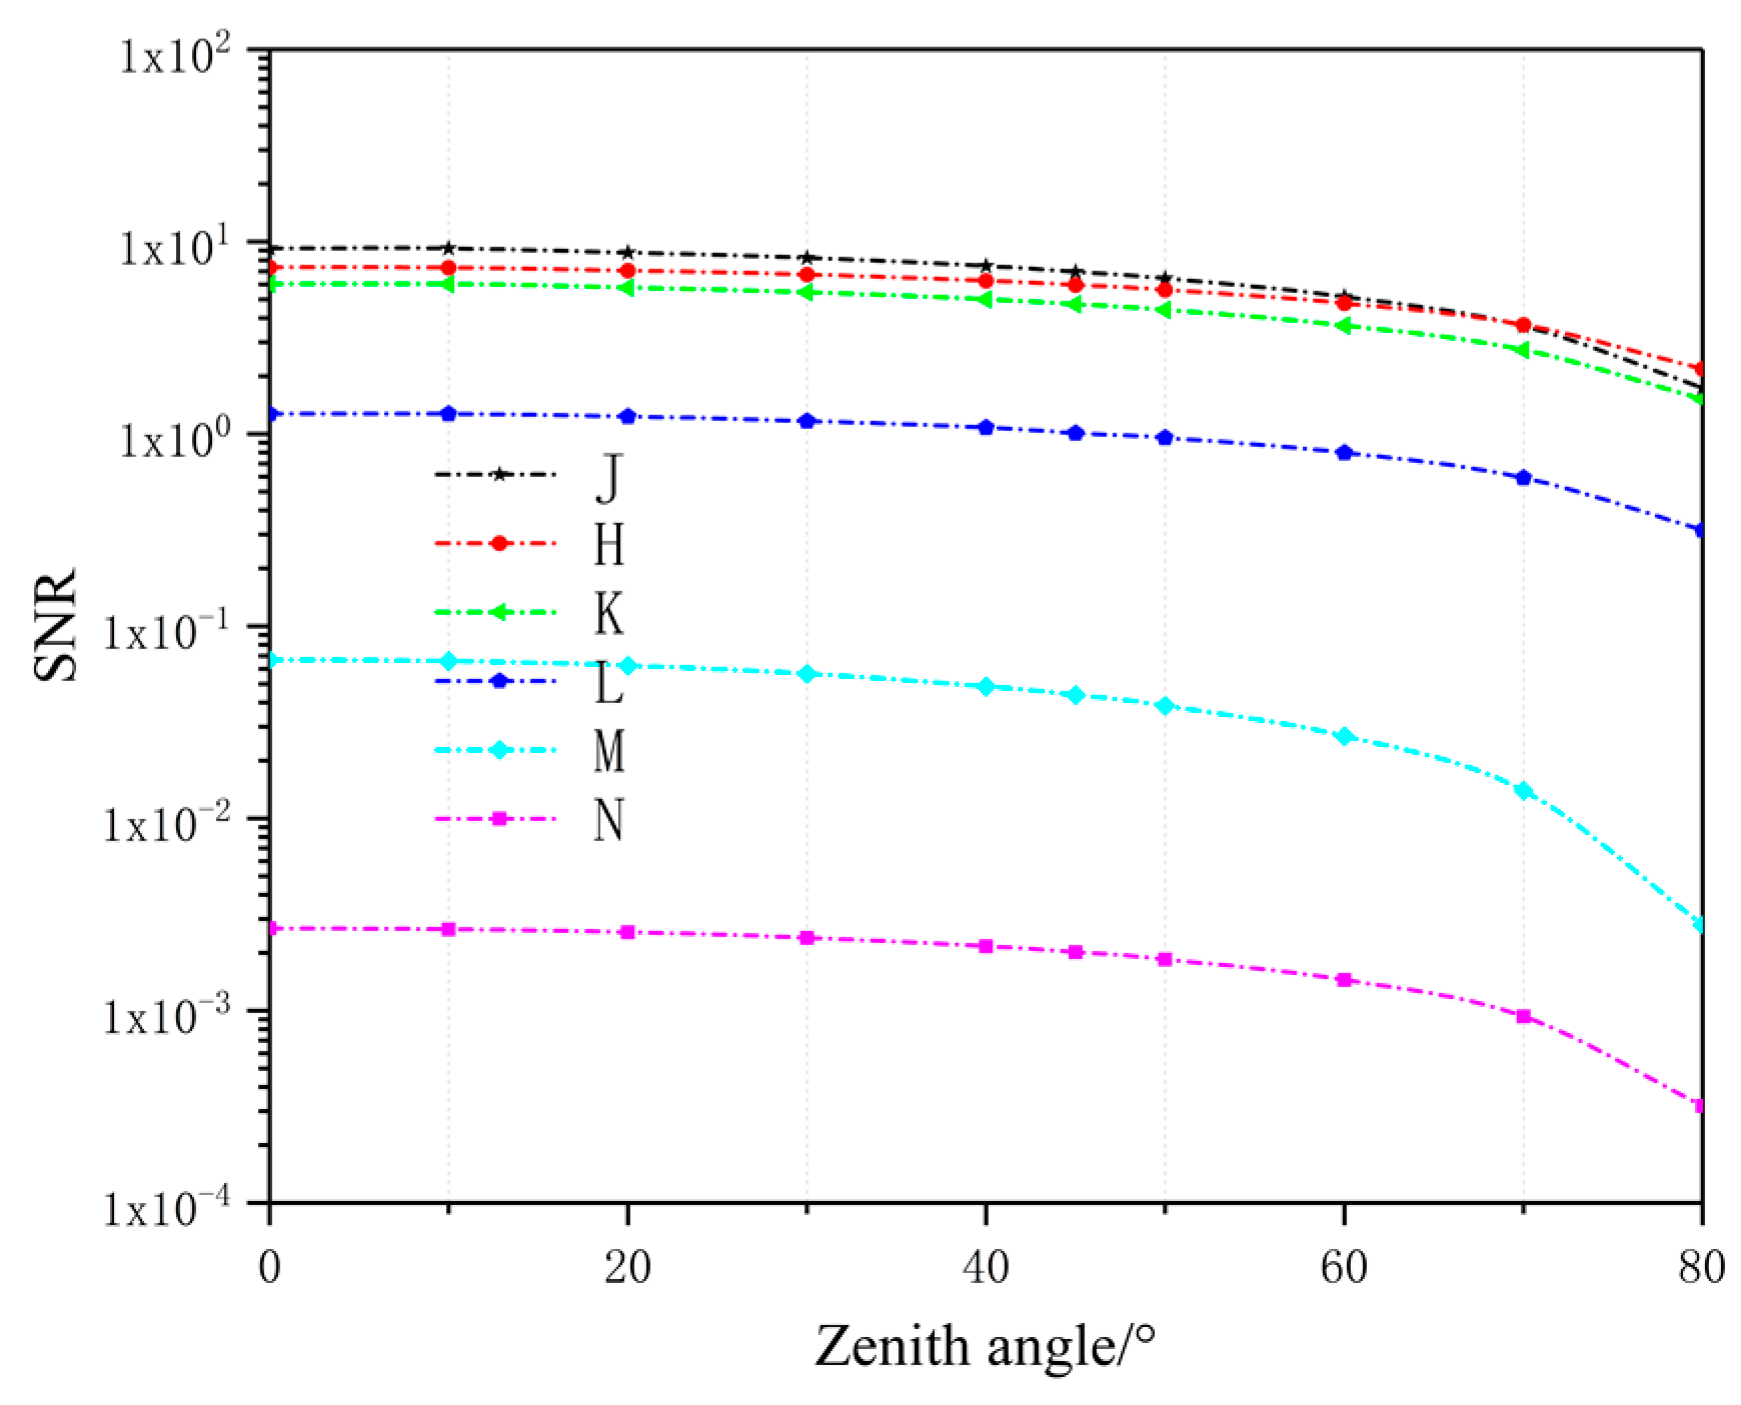
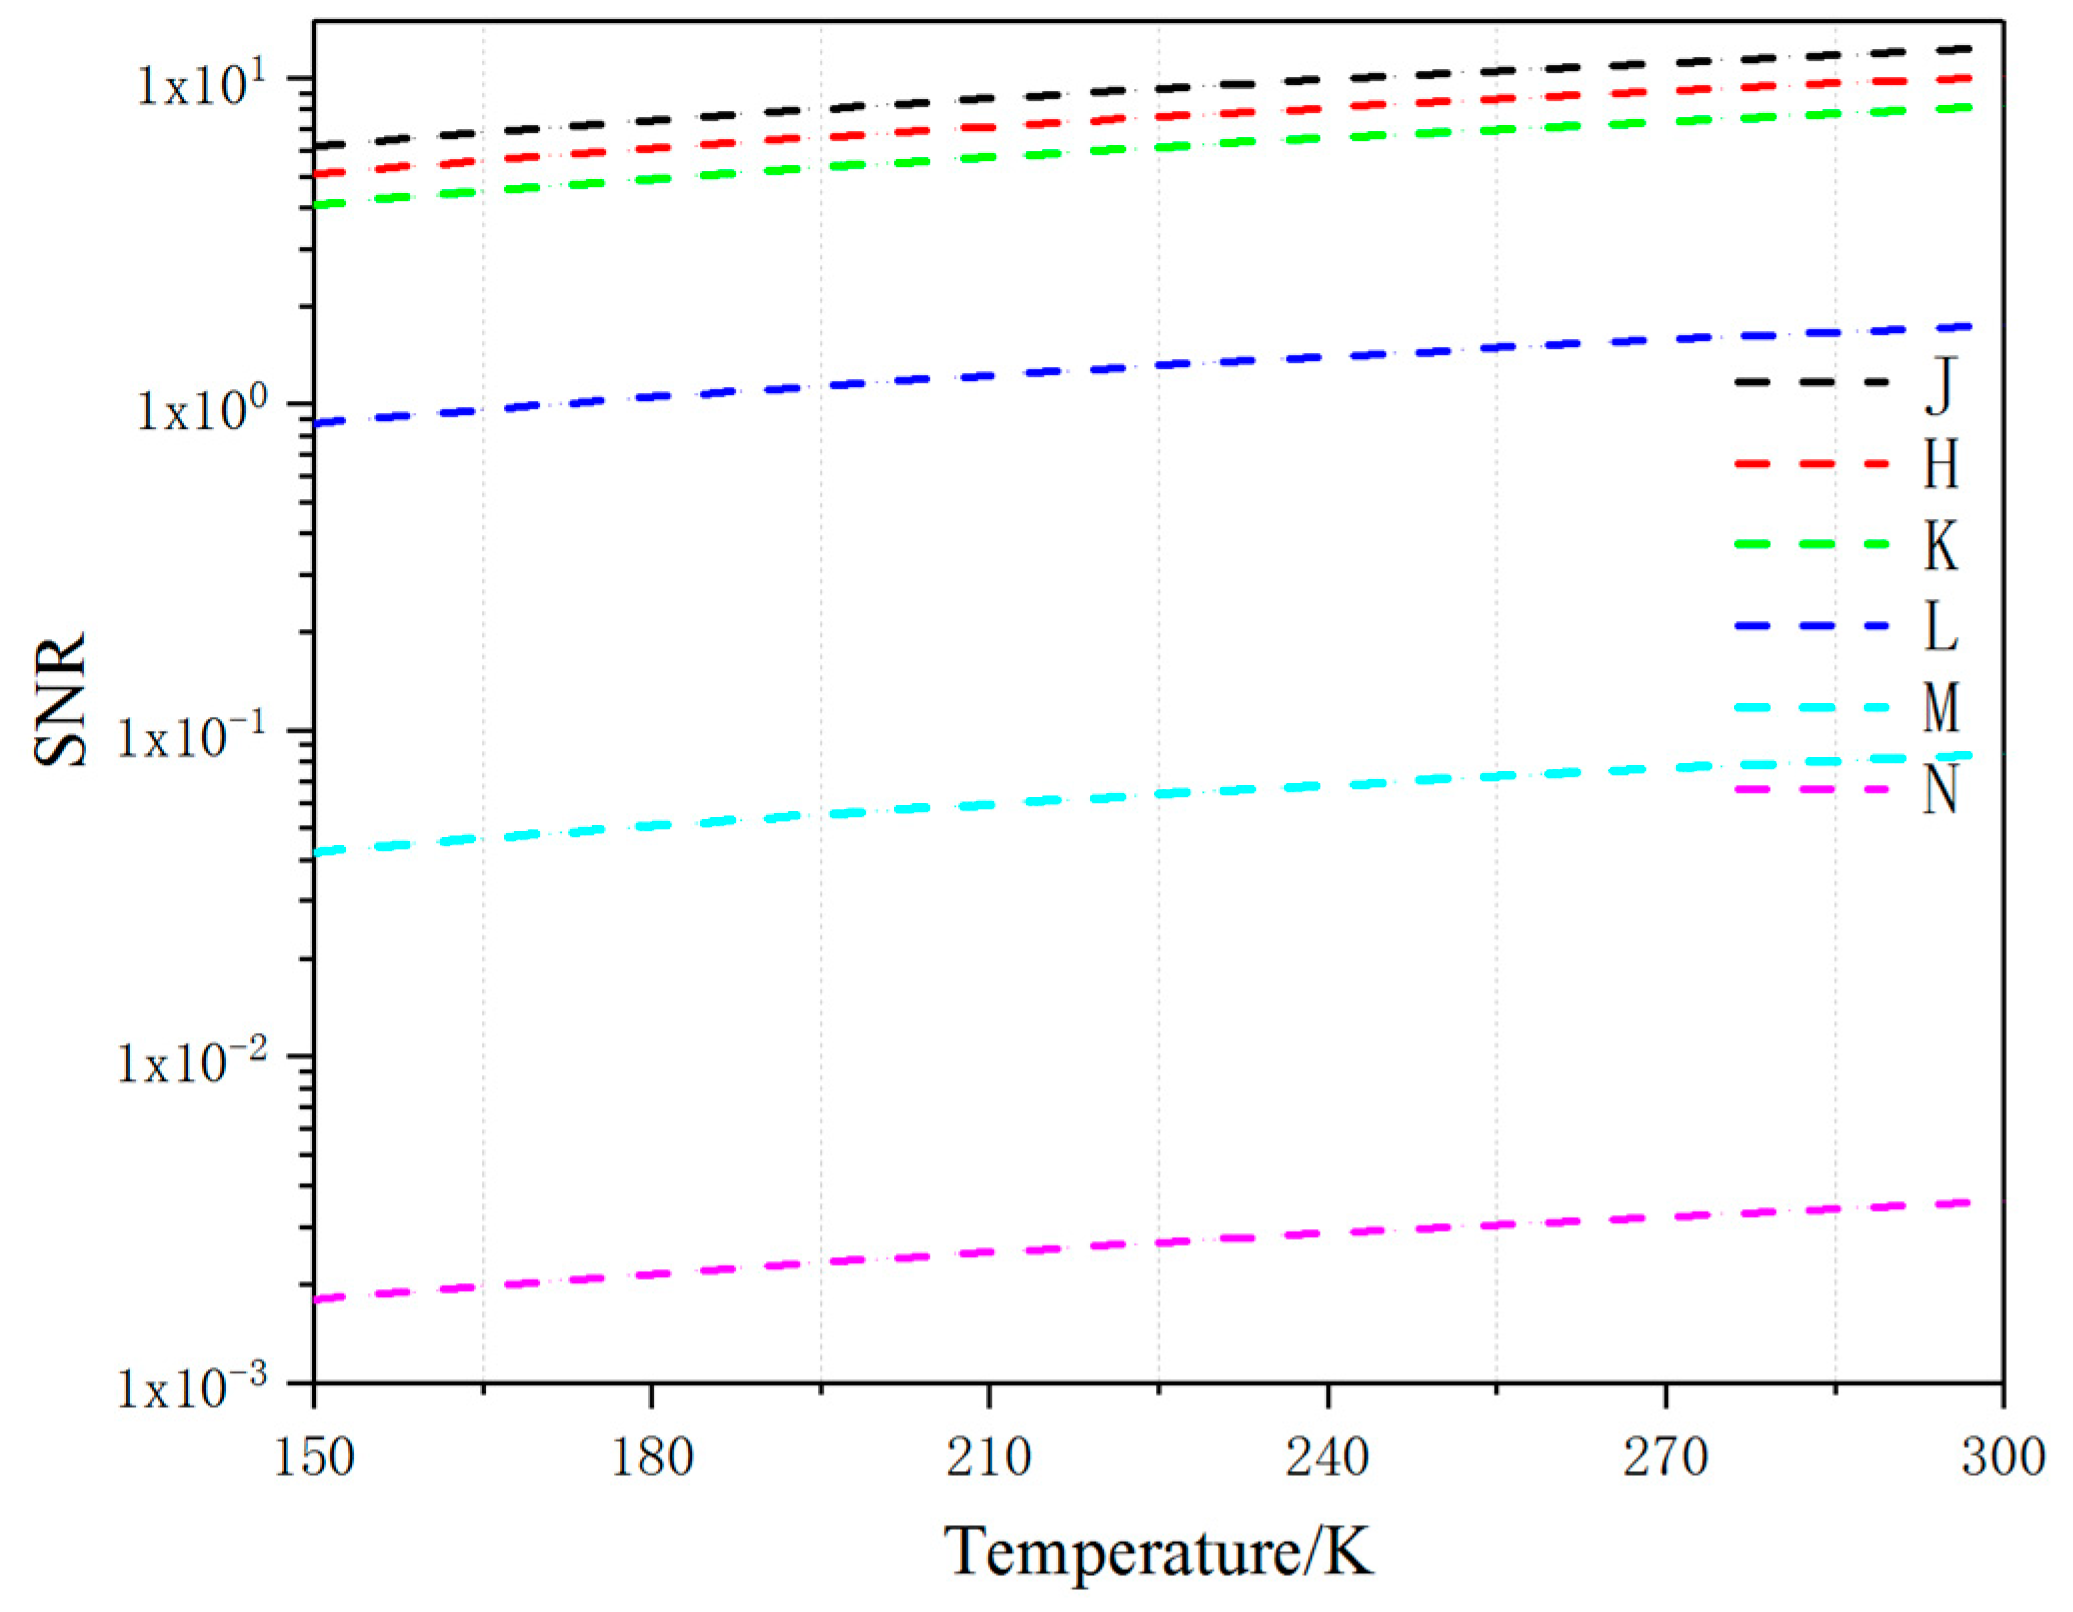
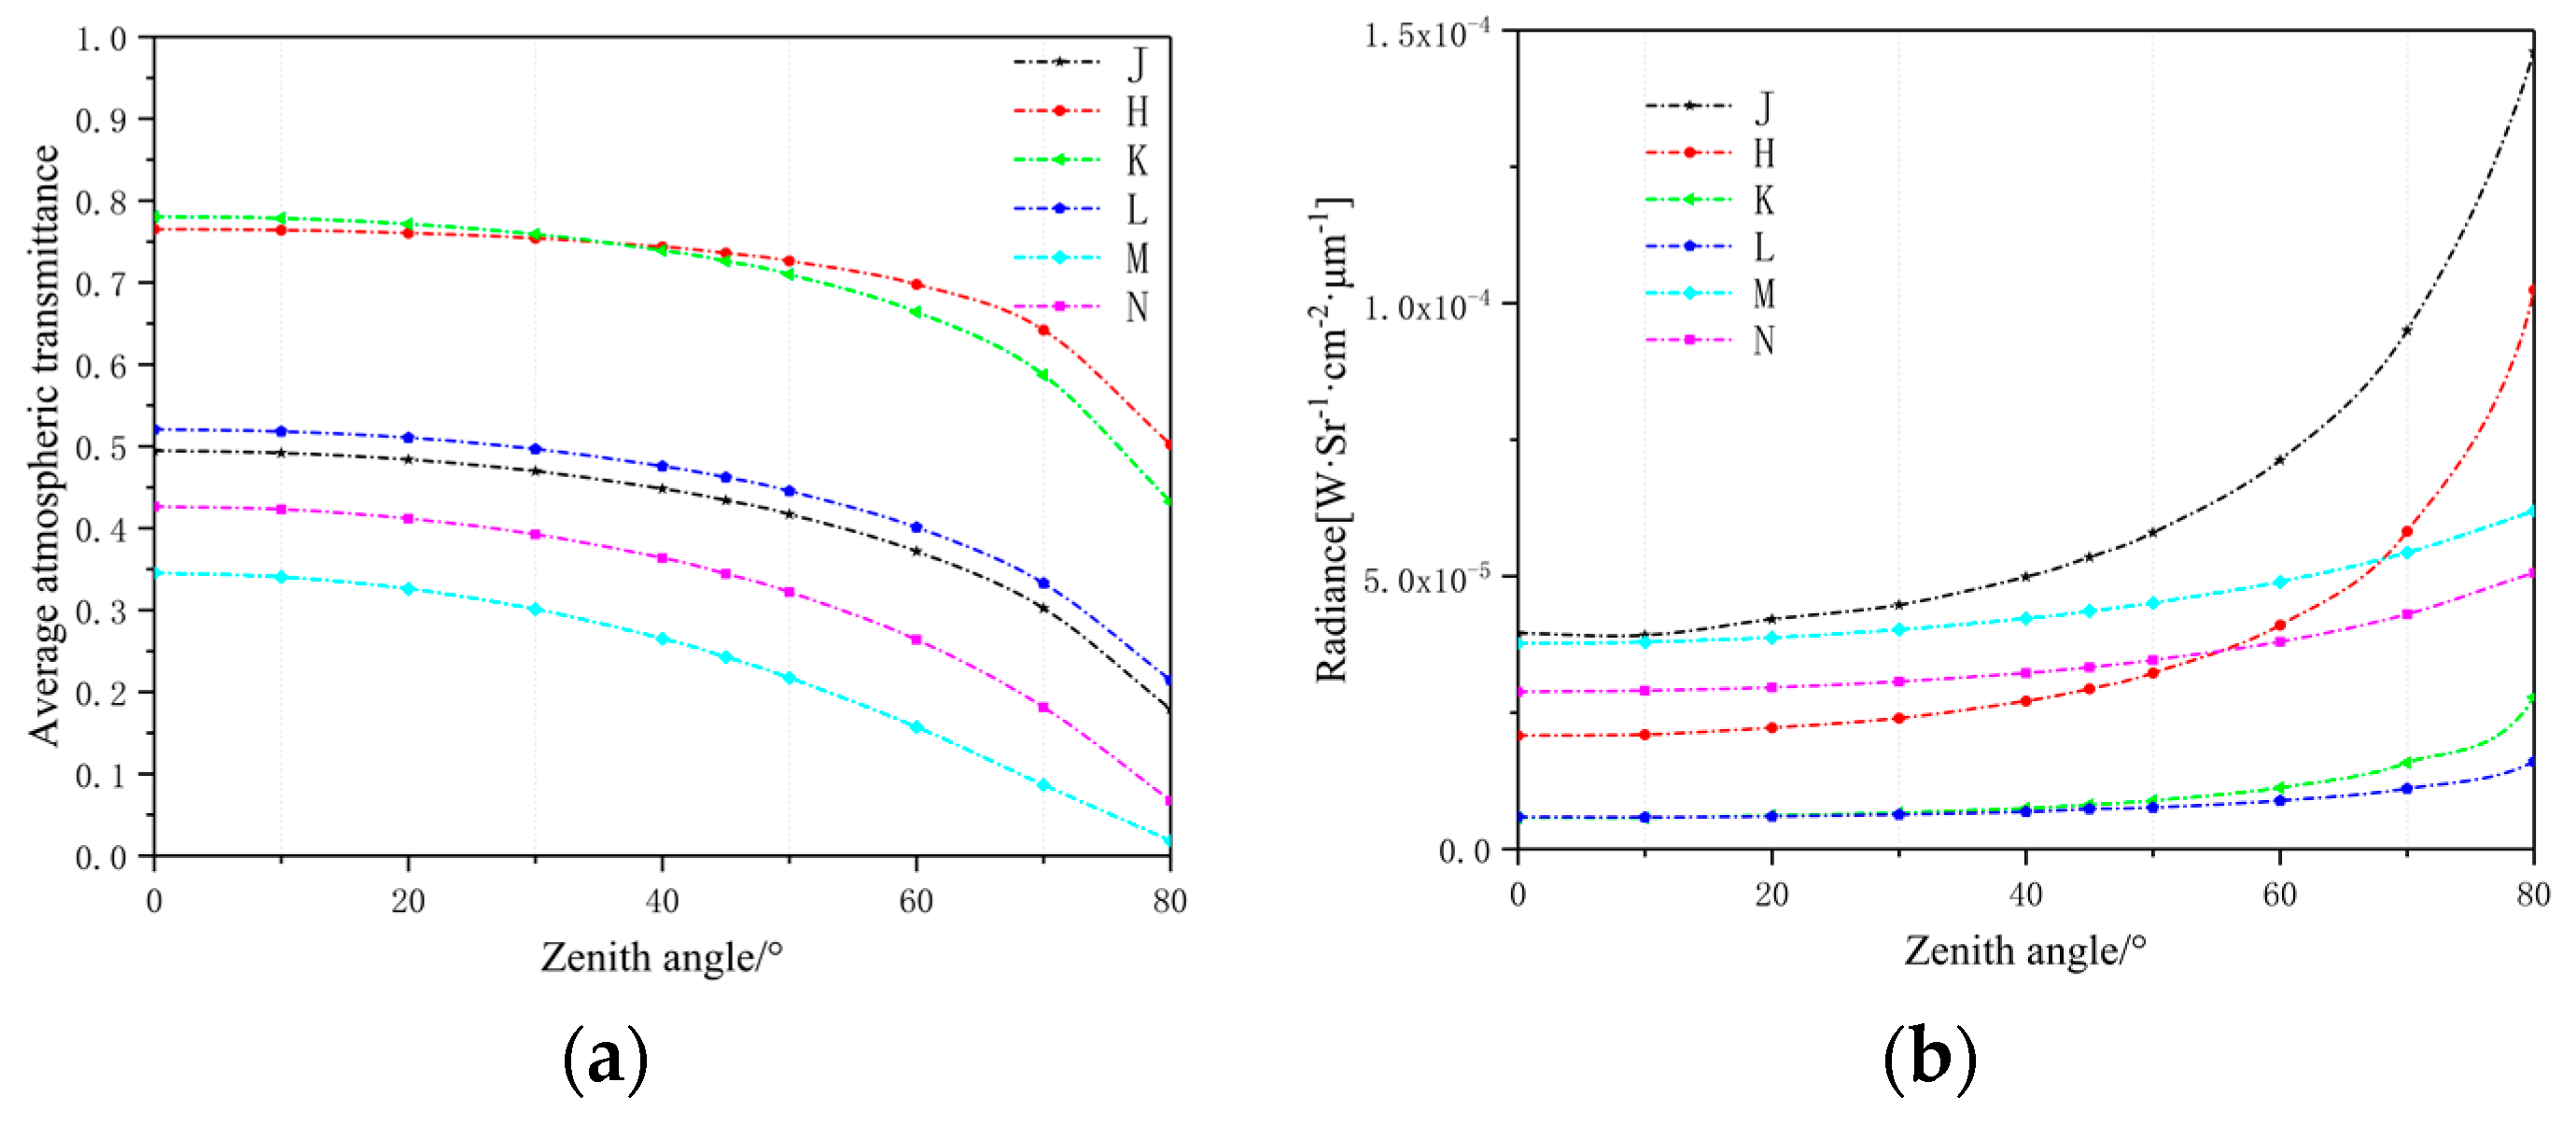
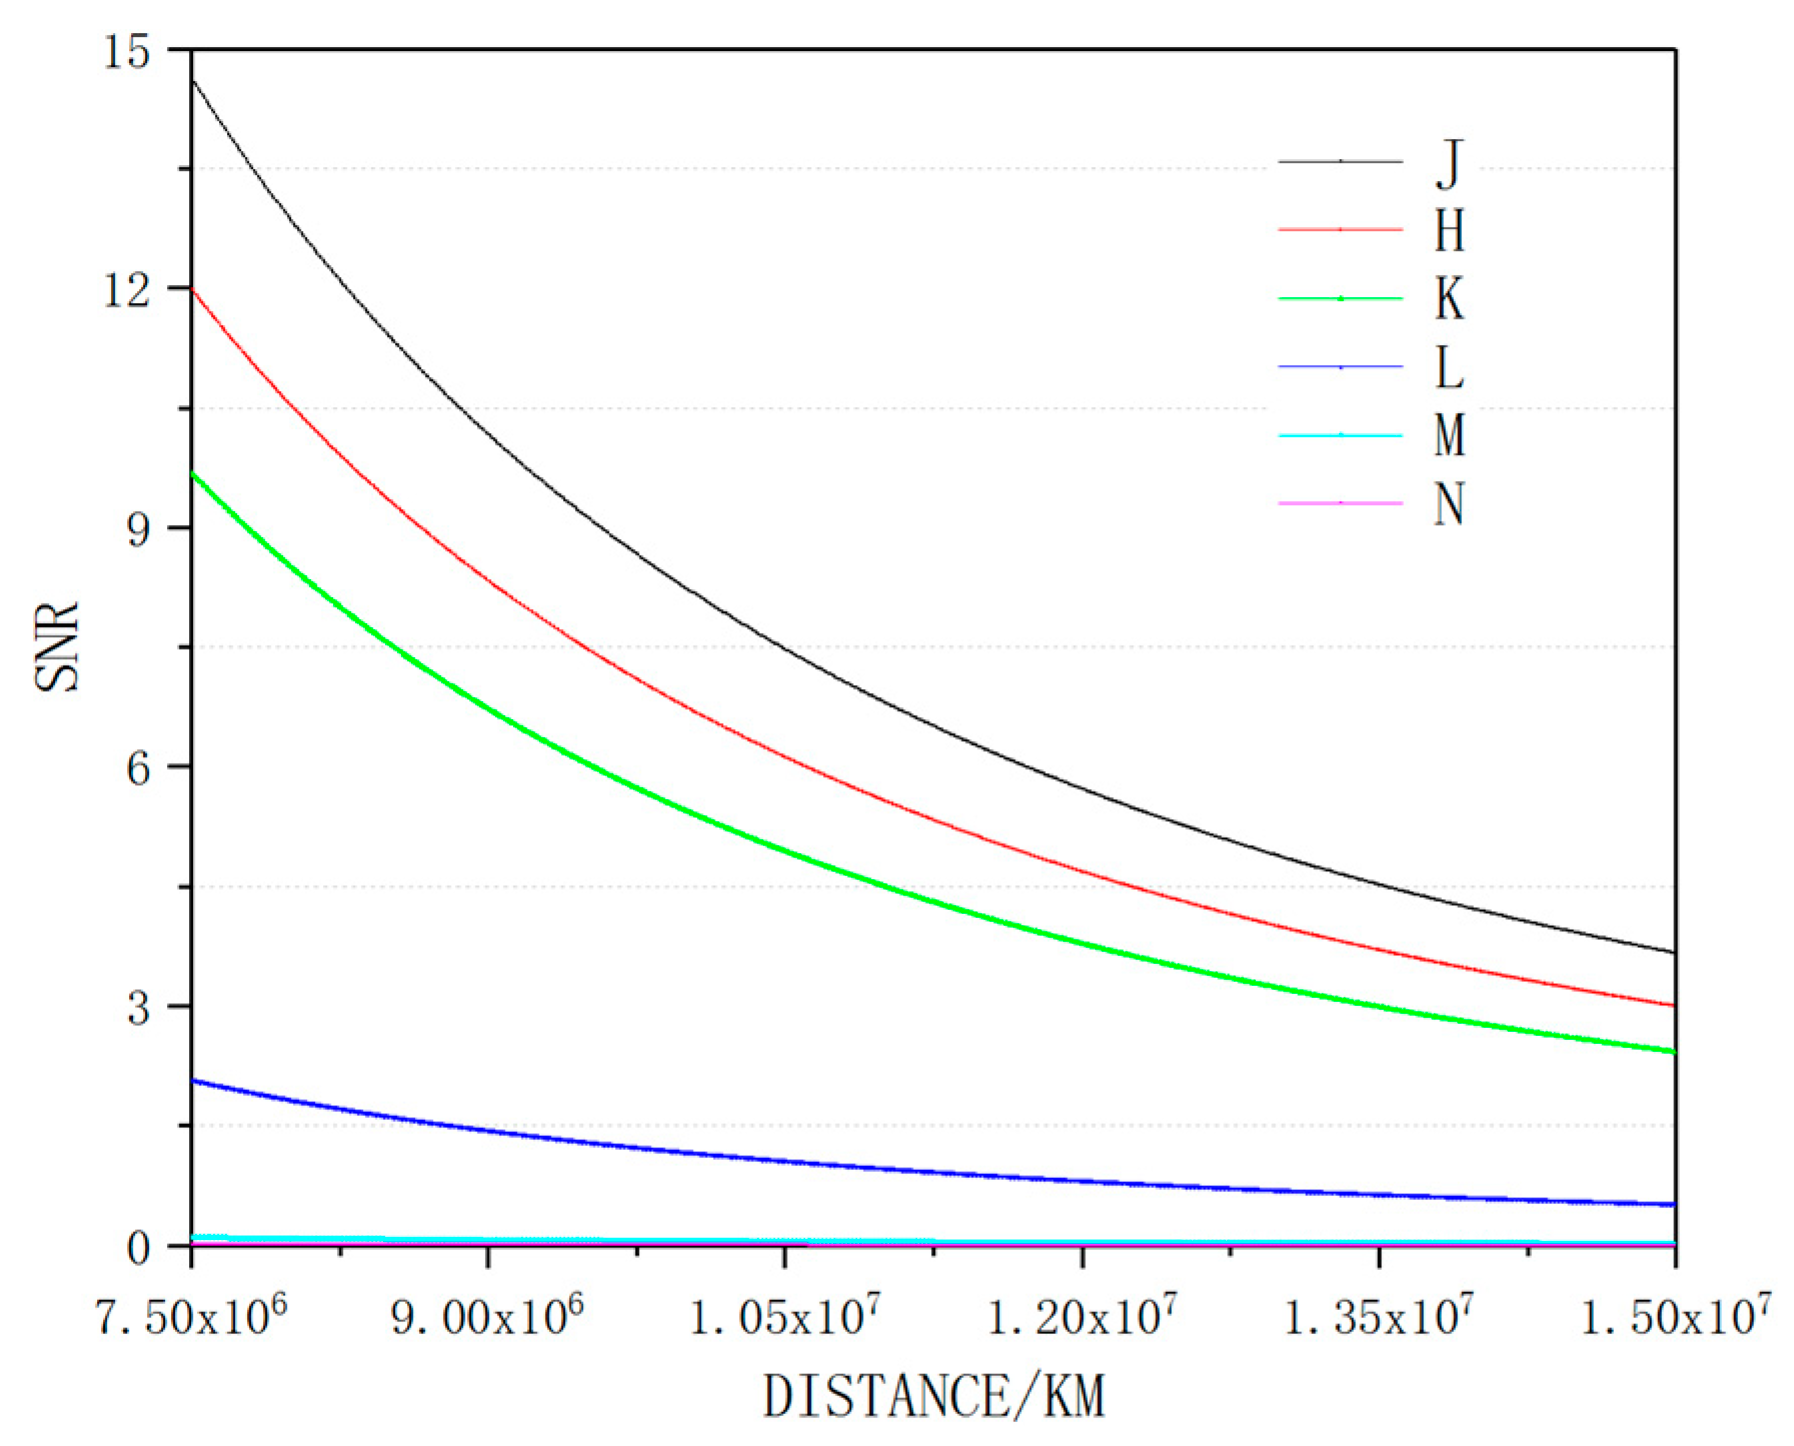
4. Simulation Results
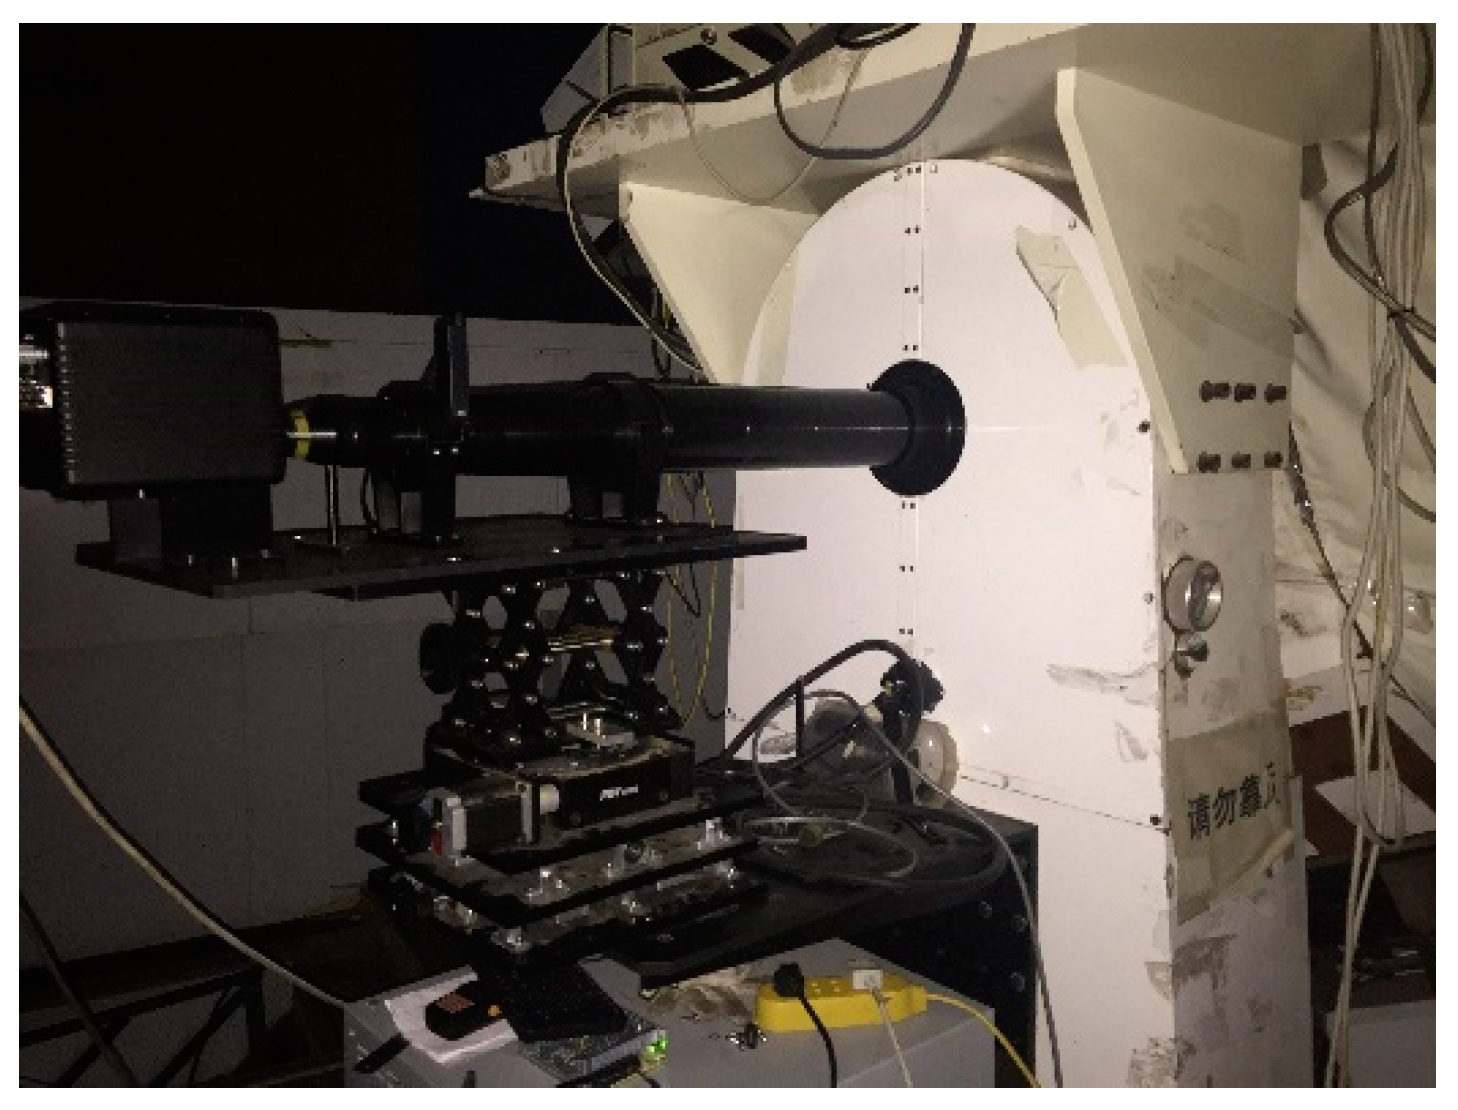
As HOTs are low SNR objects, integration time was set at less than 40 ms due to the brightness of the sky background. The telescope aperture was 1.2 m, and the area of the target was 1 and consisted of material in 200 K. First, we assumed that the target was at an orbit of 10,000 km above the observer. Combined with the data calculated from MODTRAN, the SNR of the target at different Zenith angles is shown in Figure 3.
Figure 3.
SNR of the target in different infrared bands.
The short infrared band had a better response. Generally, SNR defined as greater than five at the basis of the target can be effectively detected. Using our calculation parameters, only the J, H, and K bands could identify the target due to the elliptical trajectory of the satellite. With the increase of the zenith angle, the gap between the J band and H band became smaller. Until 68 degrees of the zenith angle, the detectability of the H band was better than the J band. The K band was always smaller than the other two bands.
The moving orbit of the spatial target was dynamic, and the range was assumed to be 7500–15,000 km. The relationship between distance and SNR is shown in Figure 4. Detection SNR was greater than 10 at the perigee, and with the increase of orbit distance, the SNR was gradually reduced. The SNR had the best response at the J band, which was 3.6 at the apogee. The three kinds of short-wave limit detection distances were 1.283 × 10⁴ km, 1.161 × 10⁴ km, and 1.044 × 10⁴ km. Therefore, the target could not be effectively detected when approaching the apogee.
Figure 4.
SNR at different detection distances.
The use of reflected sunlight as a target energy is inaccurate, as the constant motion of the target causes the reflected sunlight to become irregular, and the satellite’s own working components also radiate energy. Therefore, our model used temperature as a standard for calculation [,]. The space target temperature ranged from 150–300 K at a zenith angle of 45 degrees, as shown in Figure 5. At different center wavelengths, the bandwidth was proportional to the sensitivity of the SNR [] and the N band had the most notable promotion. Thus, at the same range of temperature, the selection of bandwidth had an influence on the noise immunity of the system.
Figure 5.
Relationship between target surface temperature and SNR.
5. Experiment
An infrared-K band photoelectric system was assembled to verify this model, and a few emblematical objects were observed by this system. The scene of the experiment is shown in Figure 6. The main mirror of photoelectric system was too large, no equipment or light source in the laboratory could match it. So, the moon was chosen as an ideal far-distance light source to set up the optical path. On a clear and cloudless night, the infrared detector and optical system were focused with on moon source. The observed picture of the moon shows that the imaging quality of this whole system is quite excellent.
Figure 6.
Infrared-K band photoelectric system practicality picture.
The motion tracking data of objects was received from the heavens above []. When satellites transit overhead the photoelectric system, the main servomotor detects tracking shots according to the satellite information. As the satellites only have a few transit times, the same target’s next transit time is irregular. At the same time, the target moves very fast and has a self-rotation, so the observational area is equivocal. Therefore, the SNR of the target in observation images has a dynamic range, so the average SNR of multi-frames is defined as the result of one observation. Three targets were computed in Table 3 as follows:
Table 3.
Average SNR of the observed target by the K-band photoelectric system.
As the targets have their own orbital motion and are composed of different surface materials, the observation of the average SNR has some errors with the simulation value. However, the average SNR can present a good judgement of whether the target can be effectively observed. Target 1962-060-A was tracked in the morning, while targets 13114 and 13777 were tracked while the sun set. We can inference from observation data that there is obvious interference to the target signal with the daylight background.
6. Conclusions
A simplified model was developed for use in predicting the SNR of a high-orbit object. The fidelity of the model was constrained by MODTRAN and the parameters of a photoelectric system. In our basic calculations, the targets were modeled as a remote black-body to evaluate their SNR. From the simulation results, shortwave infrared had high detection capability. The maximum detection range was 1.283 × 10⁴ km, and at an orbit of 1 × 10⁴ km, the minimum detection temperature was 184 K. Atmosphere has different windows, creating many transmittances and radiances at different wavelengths. From MODTRAN calculation values and parameters of the optical system, short infrared bands have better imaging effects of HOTs. The short infrared bandwidth was more sensitive to the SNR of the target, so our model can be used as a convenient and effective standard to judge whether a target can be detected. On the basis of the simulation system, we built a K-band infrared terminal camera on a large aperture optoelectronic system, and some effective observations of space targets were carried out. Obtained data from observations were few, and the obtained band was relatively simple. In future research, we will develop more infrared filters and cameras in the imaging terminal, so that more infrared bands will be taken in the large aperture optoelectronic system to obtain more data to improve this simulation model.
Author Contributions
Z.H. conceived the presented idea and developed the theoretical formalism; Z.H. and R.H. analysed the data; Z.H. and X.X. wrote the paper.
Conflicts of Interest
The authors declare no conflict of interest.
References
- Ciuonzo, D.; Maio, A.D.; Orlando, D. A unifying framework for adaptive radar detection in homogeneous plus structured interference—Part II: Detectors design. IEEE Trans. Signal Process. 2016, 64, 2907–2919. [Google Scholar] [CrossRef]
- Robey, F.C.; Fuhrmann, D.R.; Kelly, E.J.; Nitzberg, R. A CFAR adaptive matched filter detector. IEEE Trans. Aerosp. Electron. Syst. 1992, 28, 208–216. [Google Scholar] [CrossRef]
- Ciuonzo, D.; Maio, A.D.; Orlando, D. A Unifying Framework for Adaptive Radar Detection in Homogeneous Plus Structured Interference—Part I: On the Maximal Invariant Statistic. IEEE Trans. Signal Process. 2016, 64, 2907–2919. [Google Scholar] [CrossRef]
- Shi, X.; Xu, X. Detector material and sensitivity analysis for space-based infrared sensors. Optoelectron. Lett. 2010, 6, 27–30. [Google Scholar] [CrossRef]
- Lambert, J.V.; Africano, J.L.; Kervin, P. Radiometric Sizing of Small Orbital Objects. In Proceedings of the 2002 Space Control Conference, Lexington, KY, USA, 23–25 April 2002. [Google Scholar]
- Jin, H.; Song, Y.; Lee, Y.; Kim, K.S.; Lee, C.U.; Choi, Y.; Moon, H.K.; Lee, D.J.; Yoon, J.N. The light curves of a Geostationary Satellite and its model. In Proceedings of the Advanced Maui Optical and Space Surveillance Technologies Conference, Maui, HI, USA, 14–17 September 2010. [Google Scholar]
- Chaudhary, A.; Payne, T.; Wilhelm, S.; Gregory, S.; Skinner, M.A.; Rudy, R.; Russell, R.; Brown, J.; Dao, P. Analysis of Unresolved Spectral Infrared Signature for the Extraction of Invariant Features. In Proceedings of the Advanced Maui Optical and Space Surveillance Technologies Conference, Maui, HI, USA, 14–17 September 2010. [Google Scholar]
- Liu, Y.; Yang, Q.; Liu, J.; Wang, B.; Zhang, Z.; Wang, H. MWIR imaging experiments with large F-number optics on LEO spacecraft. Infrared Phys. Technol. 2014, 67, 315–317. [Google Scholar] [CrossRef]
- Jim, K.T.C.; Scott, B.; Knox, R. Simulations of Non-resolved, Infrared Imaging of Satellites. In Proceedings of the Advanced Maui Optical and Space Surveillance Technologies Conference, Maui, HI, USA, 1–4 September 2009; pp. 636–645. [Google Scholar]
- Liu, Y. Inversion of space target infrared multi-band temperature distribution. Infrared Laser Eng. 2013, 42, 556–561. [Google Scholar]
- Hardie, R.C.; Baxley, F.; Brys, B.; Hytla, P. Scene-Based Nonuniformity Correction with Reduced Ghosting Using a Gated LMS Algorithm. Opt. Express 2009, 17, 14918–14933. [Google Scholar] [CrossRef] [PubMed]
- Cognion, R. Observations and Modeling of GEO Satellites at Large Phase Angles. In Proceedings of the Advanced Maui Optical and Space Surveillance Technologies Conference, Maui, HI, USA, 10–13 September 2013. [Google Scholar]
- Butkus, A.; Roe, K.; Mitchell, B.; Payne, T. Space Surveillance Network and Analysis Model (SSNAM) Performance Improvements. In Proceedings of the 2007 DoD High Performance Computing Modernization Program Users Group Conference, Pittsburgh, PA, USA, 18–21 June 2007; pp. 469–473. [Google Scholar]
- Yan, M.; Luo, P.L.; Iwakuni, K.; Millot, G.; Hänsch, T.W.; Picqué, N. Mid-infrared dual-comb spectroscopy with electro-optic modulators. Light Sci. Appl. 2017, 6, e17076. [Google Scholar] [CrossRef] [PubMed]
- Xu, Q.; Ma, T.; Danesh, M.; Shivananju, B.N.; Gan, S.; Song, J.; Qiu, C.W.; Cheng, H.M.; Ren, W.; Bao, Q. Effects of edge on graphene plasmons as revealed by infrared nanoimaging. Light Sci. Appl. 2017, 6, e16204. [Google Scholar] [CrossRef] [PubMed]
- Chadwick, S.R.; Pavioursmith, M. The Great Canoes in the Sky; Springer International Publishing: Berlin, Germany, 2017. [Google Scholar]
© 2018 by the authors. Licensee MDPI, Basel, Switzerland. This article is an open access article distributed under the terms and conditions of the Creative Commons Attribution (CC BY) license (http://creativecommons.org/licenses/by/4.0/).