1. Introduction
Water is an indispensable resource for life. It is considered one of the fundamental rights of people. Its availability is not uniform, but depends on geographical location and climate. In some countries, basic needs, including water availability, are not assured. In July 2010, the United Nations General Assembly recognized the right for everyone to have access to sufficient water for personal and domestic use. Other institutions have also identified other water requirements, such as quantity (50–100 L per person per day; WHO), its cost (not over 3% of household income; United Nations Development Programme) and distance travelled (not over 1 km from home) [
1]. Moreover, water quality is important as its quantity: poor quality water causes health problems for about half of the population in developing countries.
In other areas, where the quality of life is higher, resource use is often affected by low efficiency and the cost of water is high. Water charges should be met by citizens if public administrations are unable to charge for water supplies. In this situation, more sustainable management of water production and distribution is needed.
Several technologies have been studied and used in the past to obtain water from the ground, the air or the sea. The technologies vary depending on community needs and resources. In developed countries with coastal geographies, desalinization plants can produce large amounts of water for building use in cities. In the same countries, as well as several other regions, however, air conditioning systems are widespread. Therefore, the use of condensed water from air conditioning systems appears to be of potential interest, in addition to the much more widespread use of seawater desalination.
The processes for extracting water from the sea are well known and has been studied for a long time. In contrast, the possibility of recovering water from processes used to produce cold and hot air from HVAC (Heating, Ventilation and Air Conditioning) systems has been only recently considered, partly due to their growing use and spread. Like drinking water, air conditioning is a valuable resource, particularly in hot and dry regions.
Statistics suggest 25% of global HVAC systems are in use in Europe, 30% are in North America and 40% are in the Asia-Pacific region. The rest of the world thus accounts for 5%. The global HVAC systems market is expected to experience compound growth of 5.5–5.9% in the 2015–2023 period, due mostly to Europe and North America, with Asia Pacific the largest regional market over the period [
2]. Therefore, in hot, dry or humid climates in arid regions where refrigeration processes represent a basic need for indoor comfort, the advantages of an integrated design of HVAC systems optimized for water production, rather than for air treatment, should be evaluated.
During the past fifteen years, research interest regarding the use of condensed water from air conditioning systems has increased. This kind of application has been studied mainly in climatic conditions where HVAC systems are widely used for refrigeration. Water production efficiency of an evaporator coil was calculated referring to the hot, humid weather of Jeddah (Saudi Arabia). The simulated production amount was found to strictly depend on air speed through the coil [
3].
From the results of a wide-ranging review on air-conditioning condensate recovery and applications, total costs of mechanical systems have been found to be 3–5% higher for integrated systems if appropriate planning is undertaken at the design stage of new buildings [
4].
Studied solutions have usually considered water coming from low-quality sources and intended for low-grade uses, such as toilet flushing, irrigation, etc. This is usually because the energy performance target has been considered independent from the interest in obtaining water from these systems. Research on technologies for water production from air conditioning units has identified areas with interesting collection potential, represented mainly by the coastal regions of the Arabian Peninsula, Sub-Saharan Africa areas, and South Asian countries [
5].
A sustainable way of approaching this topic should simultaneously consider maximizing water production, the internal thermal comfort provided by the air conditioning system, and the efficiency of the system depending on local climate conditions and variations. Other aspects related to heat exchange should also be considered in order to optimize the whole system.
Studies on the possibility of extracting water produced by air conditioning units, based on an experimental setup in a laboratory climate chamber, were carried out with a split system, considering its air-cooling target design [
6]. Other preliminary studies have shown promising potential for technological improvement towards more sustainable processes and systems [
7,
8].
The current work presents a real application that embodies both energy and drinking water savings. It represents an evolution of an integrated system [
9], which provides both air conditioning and water to a hotel. The system [
9] behavior was analyzed, taking into account the climatic conditions of the Arab Emirates coast. The results show that, for the simulated case study, the water extracted from air by condensation covers approximately half of the hotel’s water requirements. Energy efficiency was also taken into account to consider the sustainability of the process from various points of view.
The system analyzed in the present research is a real installation developed on the basis of the results of previous research: its primary duty is to meet drinking water requirements, and, secondly, to provide domestic water heating and primary air for a non-conditioned zone (the laundry area of the hotel). The integrated system was built and placed on the roof of a hotel in Villahermosa, Tabasco, Mexico. In the following paragraphs its features are outlined, the needs of the hotel are described, and the calculations of water and energy savings are presented. Moreover, a simulation tool was developed with the aim to evaluate possible water savings in a one-year period and to improve the efficiency of the system. With this tool, validated by means of experimental results, it is possible to simulate the real behaviour of the whole system. A method to verify the effectiveness of the integrated system is also described.
2. Case Study
2.1. Hotel Characteristics and Needs
The building chosen for the experiment is a hotel in Villahermosa, Tabasco, Mexico. It has a rectangular shape and 154 double rooms (308 guests maximum). Its main needs, related to the current research, are represented by drinking water, domestic water heating and air cooling, as indicated below.
- (1)
Drinking water, daily required by the hotel, can be divided into two categories:
Water offered to guests: Two × 0.5 dm3 for each guest (maximum 308 guests, corresponding to a maximum of 308 dm3/day), provided in bottles and representing a cost to hotel management of 7 pesos/dm3.
Water for kitchen uses and ice making. For kitchen uses, at least 1000 dm3/day of water is required, but 1600–1800 dm3/day was considered desirable. If bought in tanks, the water costs 1.4 pesos/dm3.
- (2)
Domestic hot water (DHW): Based on hotel records, it was calculated that about 140 dm3/day per guest at an average temperature of 40 °C (corresponding to 280 dm3/room) was required.
The existing plant meeting these requirements has the following elements:
one heat generator, which burns LPG fuel, characterized by thermal power of 820 kW;
domestic water thermal storage with a capacity of 12,000 dm3;
one recirculating pump between the boiler (heat generator) and the thermal storage unit.
The existing equipment heats domestic water, up to 55 °C, by means of direct heating inside the heat generator. The heated water is collected in the storage tank. There are no auxiliary heat exchangers between the heat generator and the storage tank, and no electric heating coils are used as back up. The heating efficiency of the existing boiler was estimated to be about 70%. The boiler is also employed to produce high temperature steam.
- (3)
Cool air—The hotel currently employs a traditional air conditioning system, which serves guest rooms and common rooms. The system does not reach the laundry room, which has a surface area of about 150 m
2 and a height of 3 m. The laundry currently employs only an extractor fan, and its internal environment is not comfortable, sharing the hot and humid characteristics of the external environment and exacerbated by steam used for cleaning operations. It was decided, in compliance with hotel owner requirements, to deliver a portion of the fresh and dry airflow from the integrated system to the laundry in order to increase indoor comfort. A ratio of 13 air changes per h—that is, 5850 m
3/h of fresh air—was taken into account [
10].
2.2. Climatic Data
According to the Koppen climate classification, the subtype climate of Villahermosa, Tabasco, Mexico, is “Af” (tropical rainforest). Monthly average temperature (T) and relative humidity (RH) data have been calculated on the basis of hourly records of the past five years (2013–2017) (
Table 1), referring to measurements taken at the International Airport of Carlos Rovirosa Perez, which is located 13 km from Villahermosa and has an altitude above sea level of 16 m. Thus, the atmospheric pressure taken into account for all the following psychrometric calculations is 101,325 Pa.
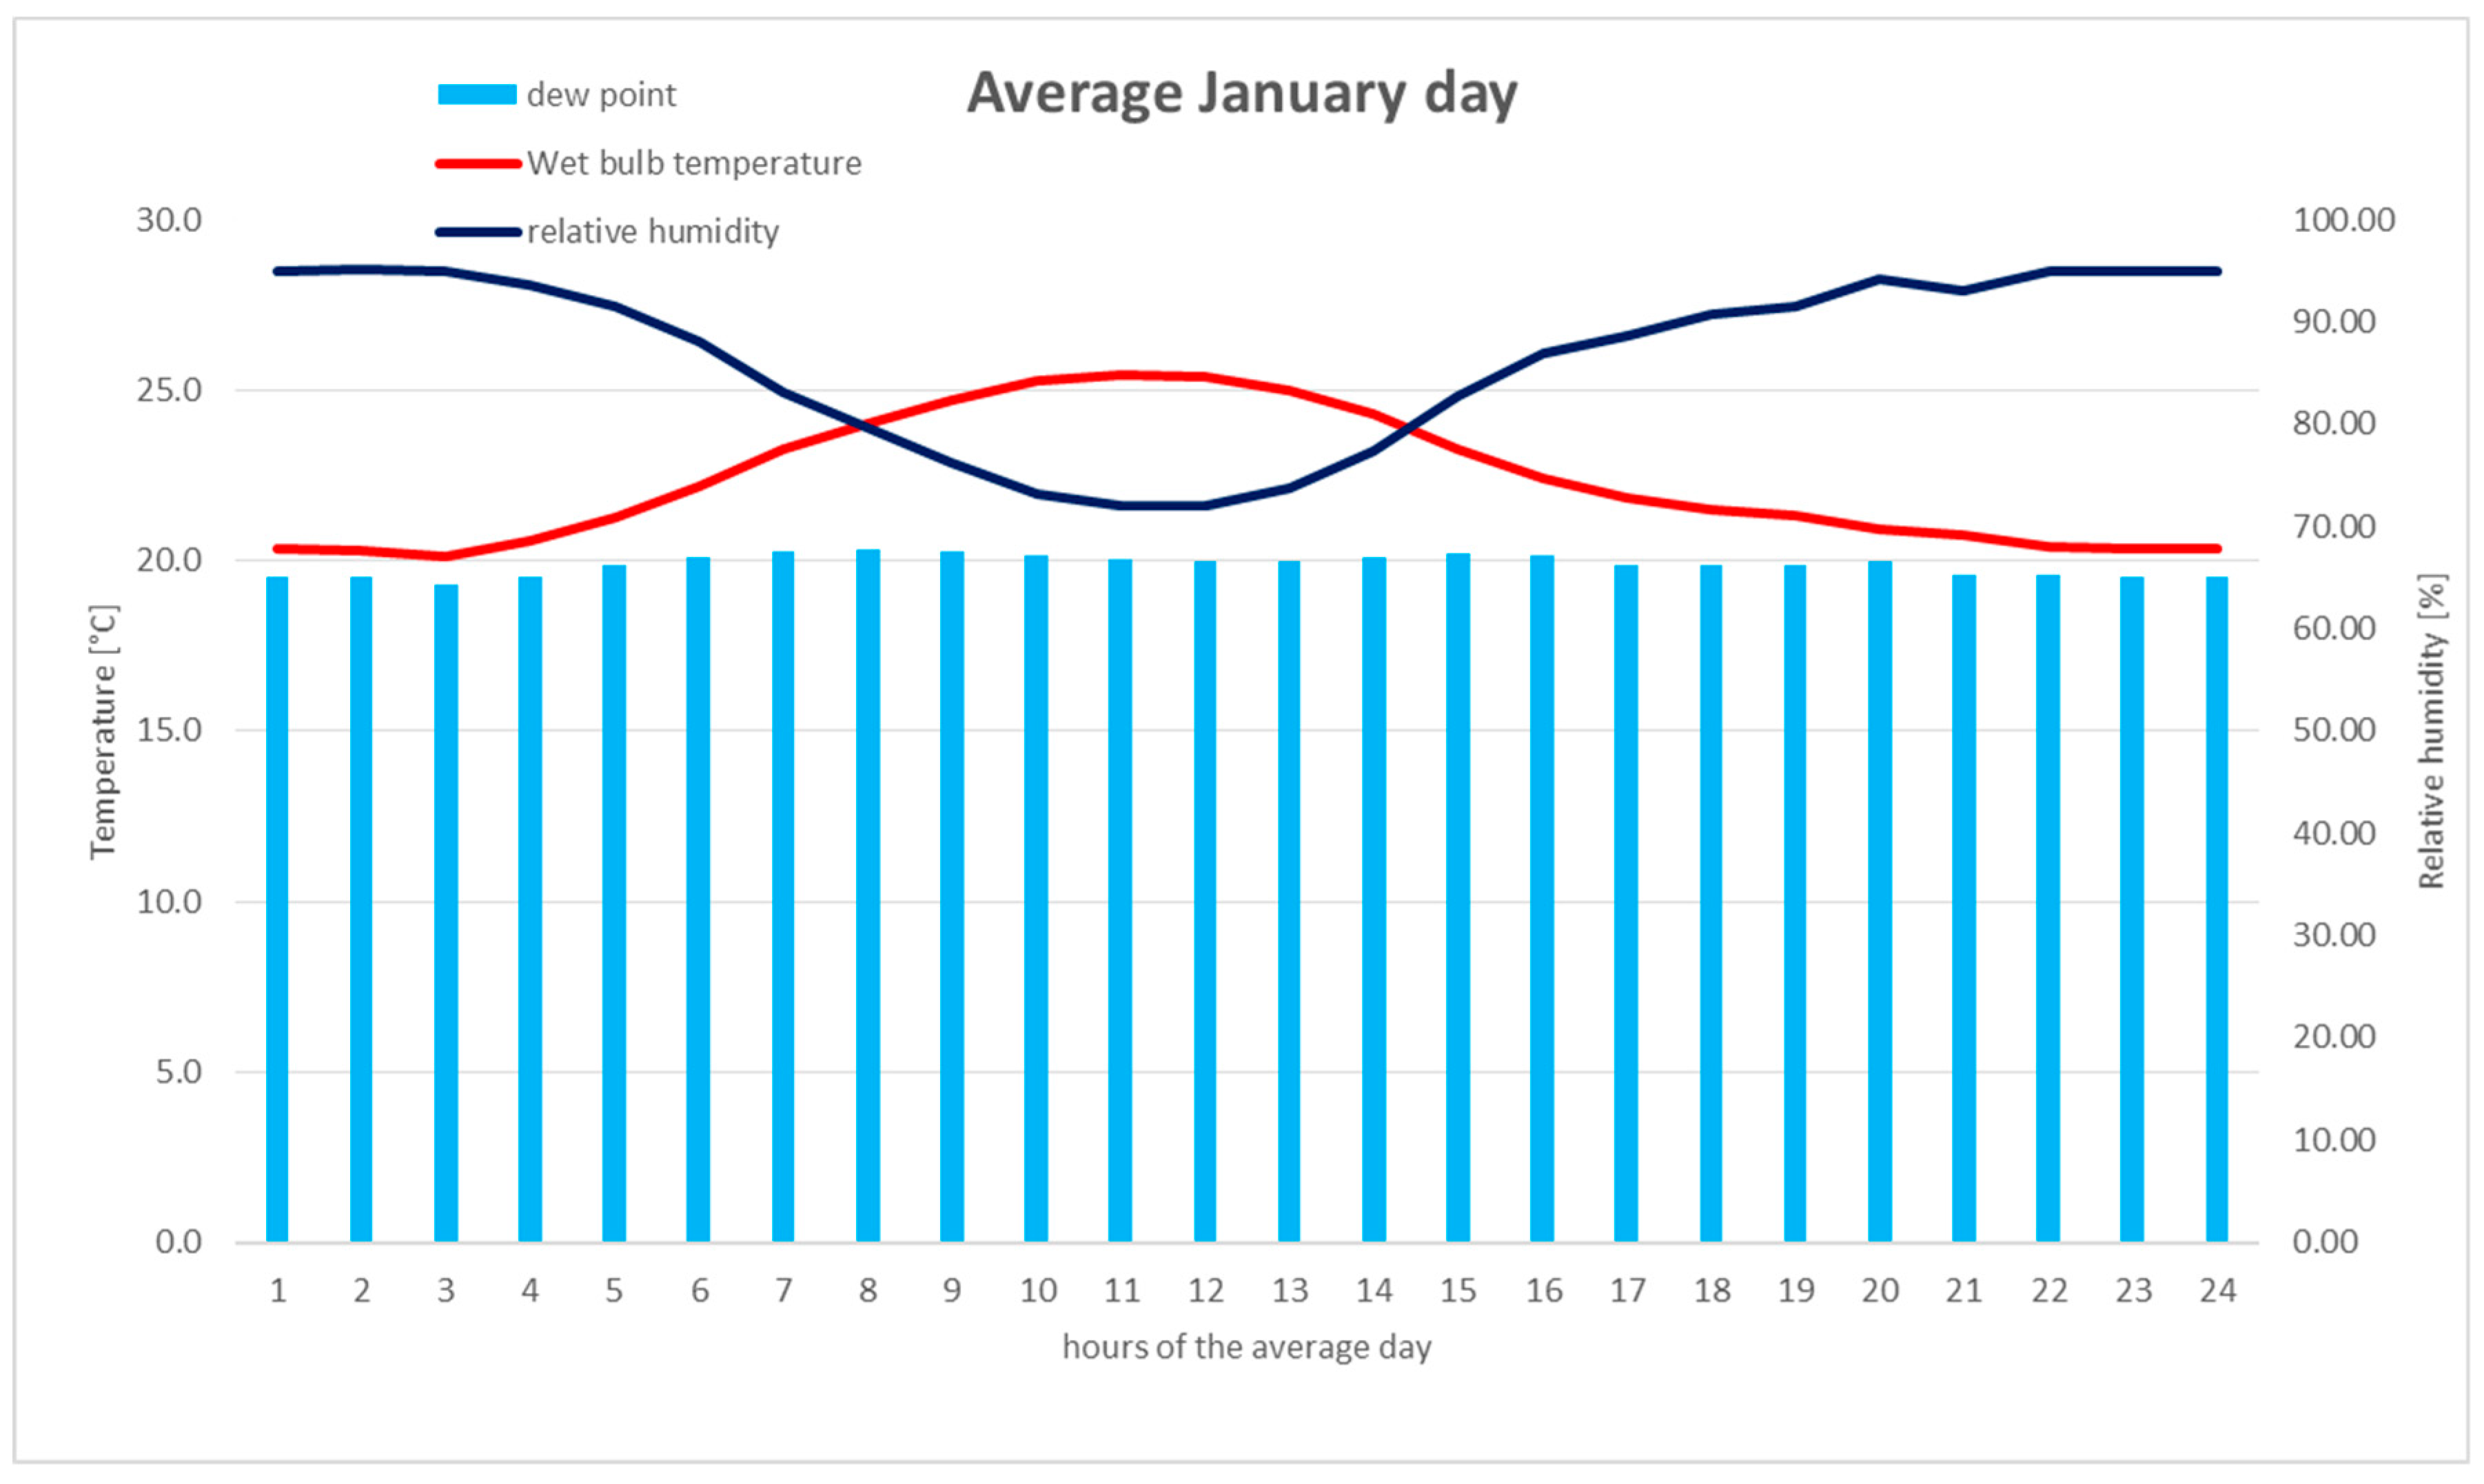
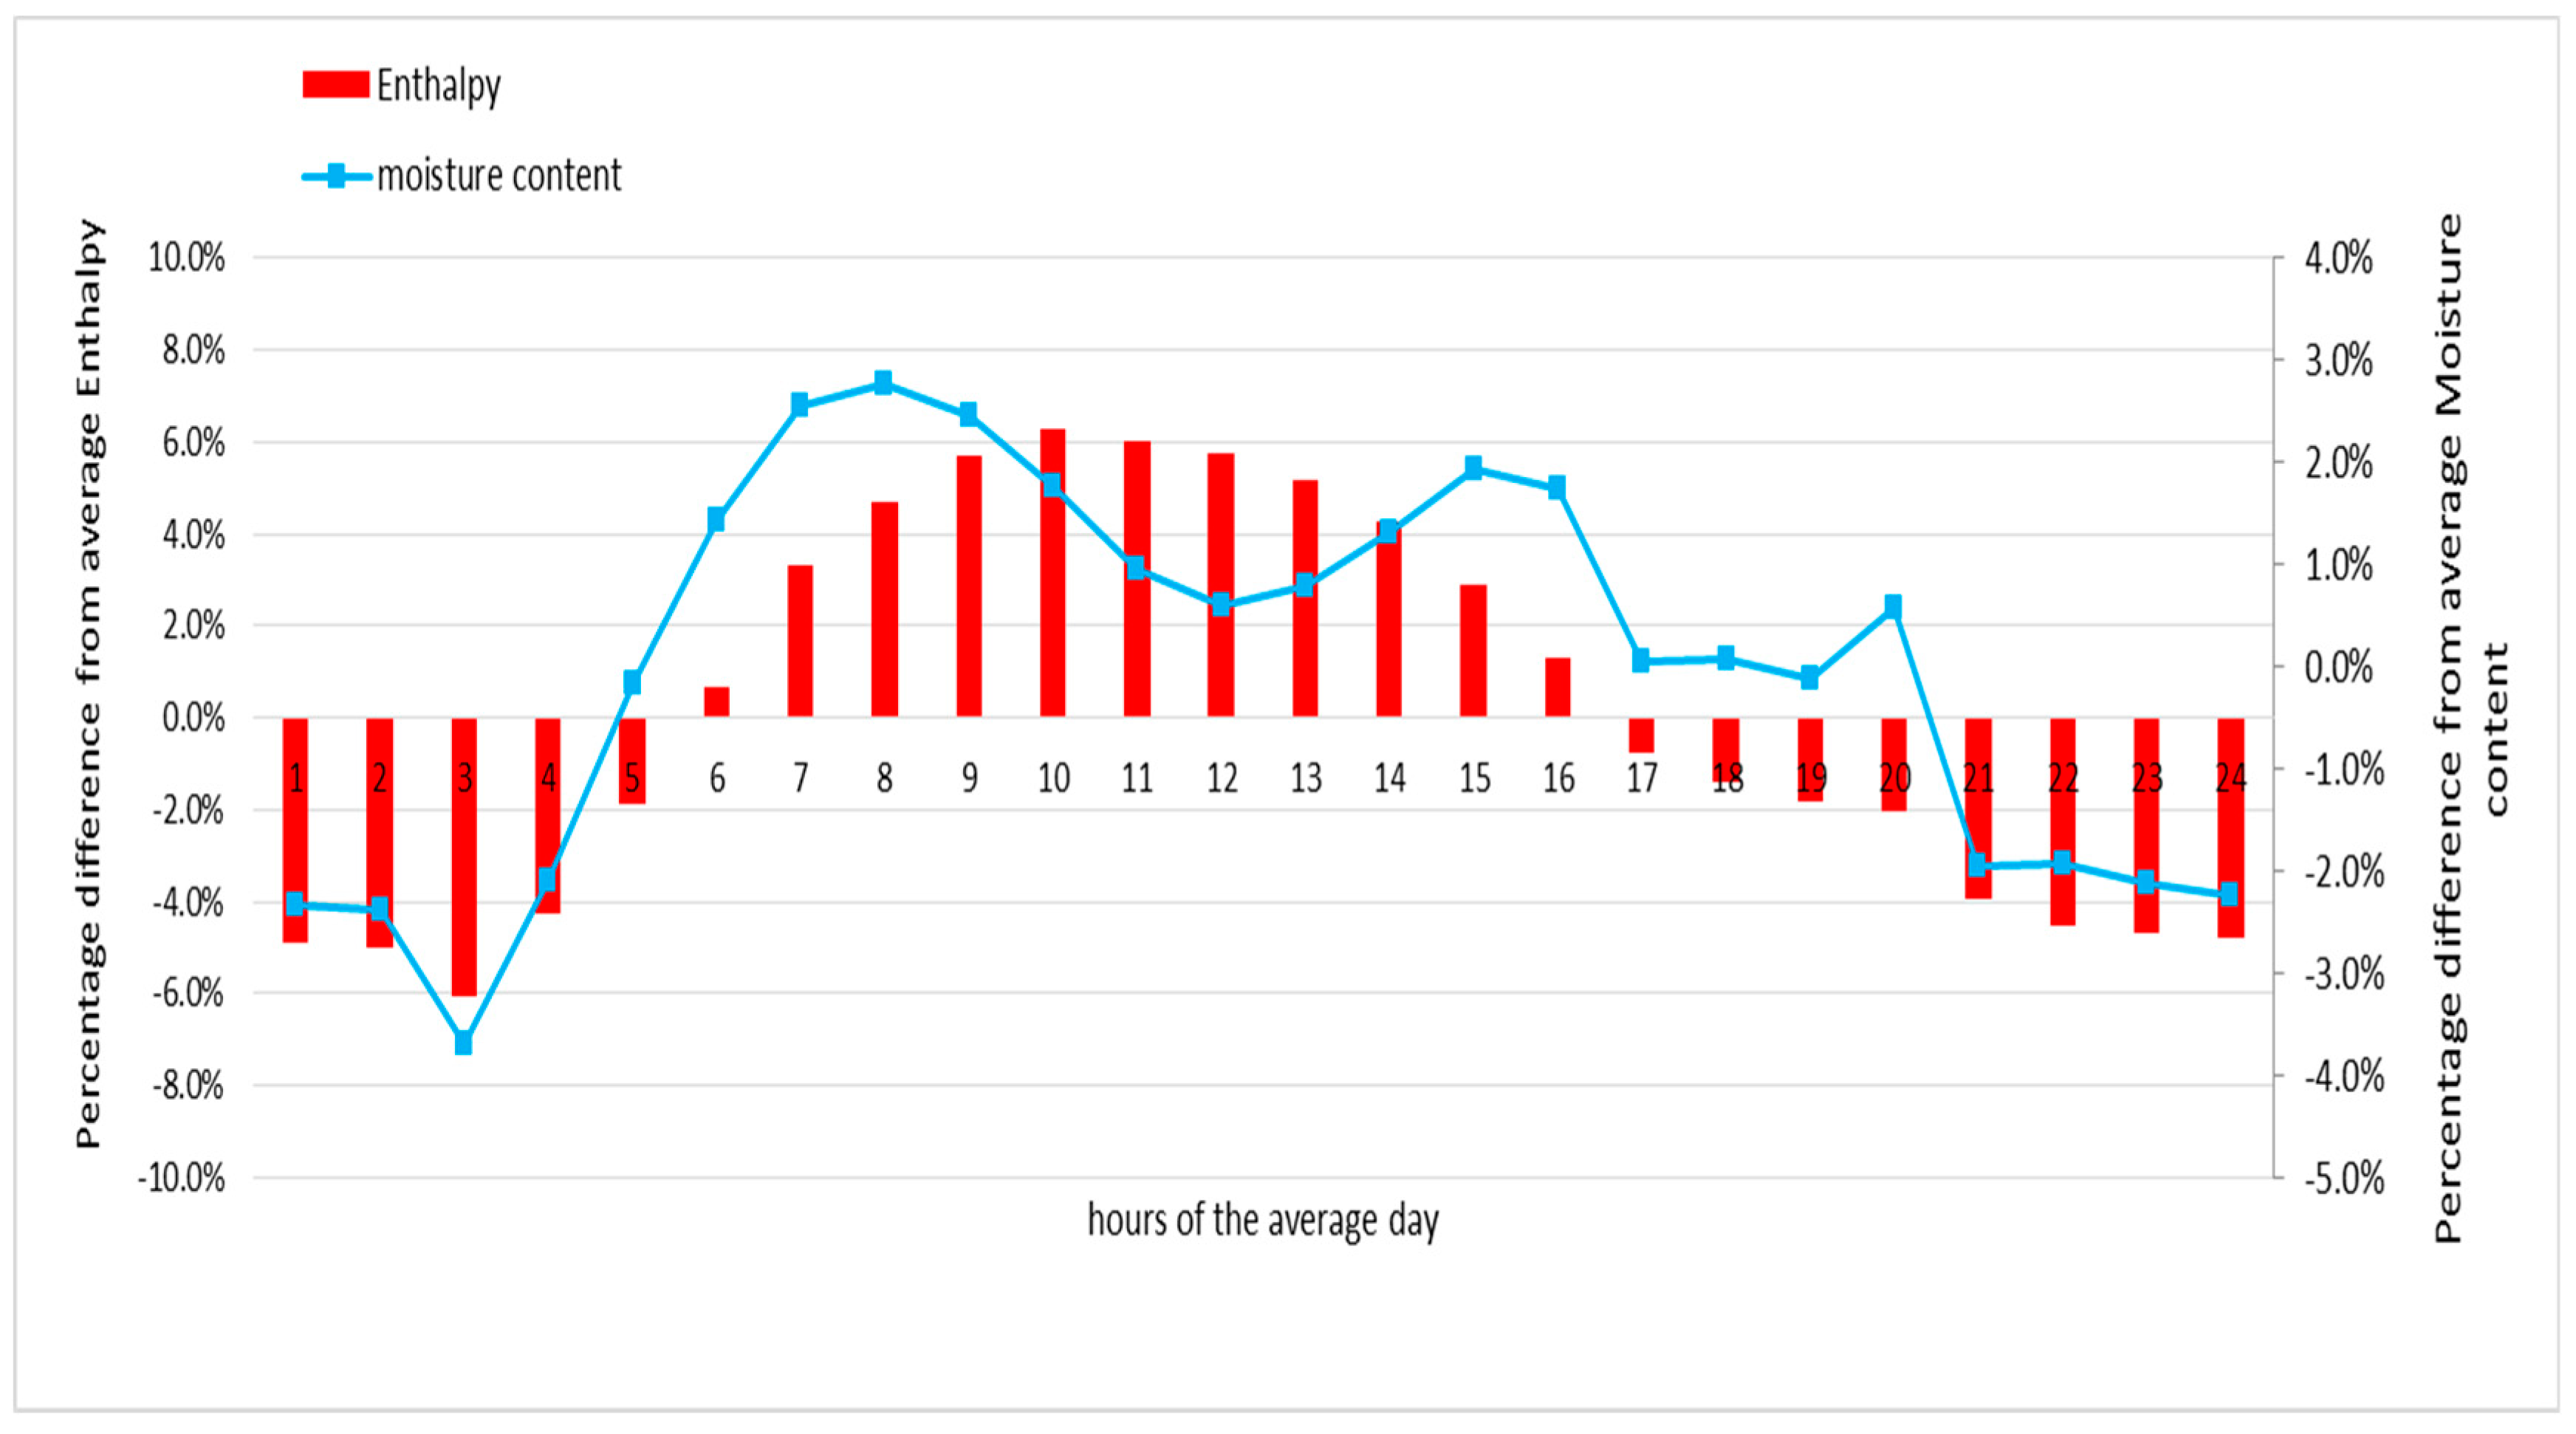
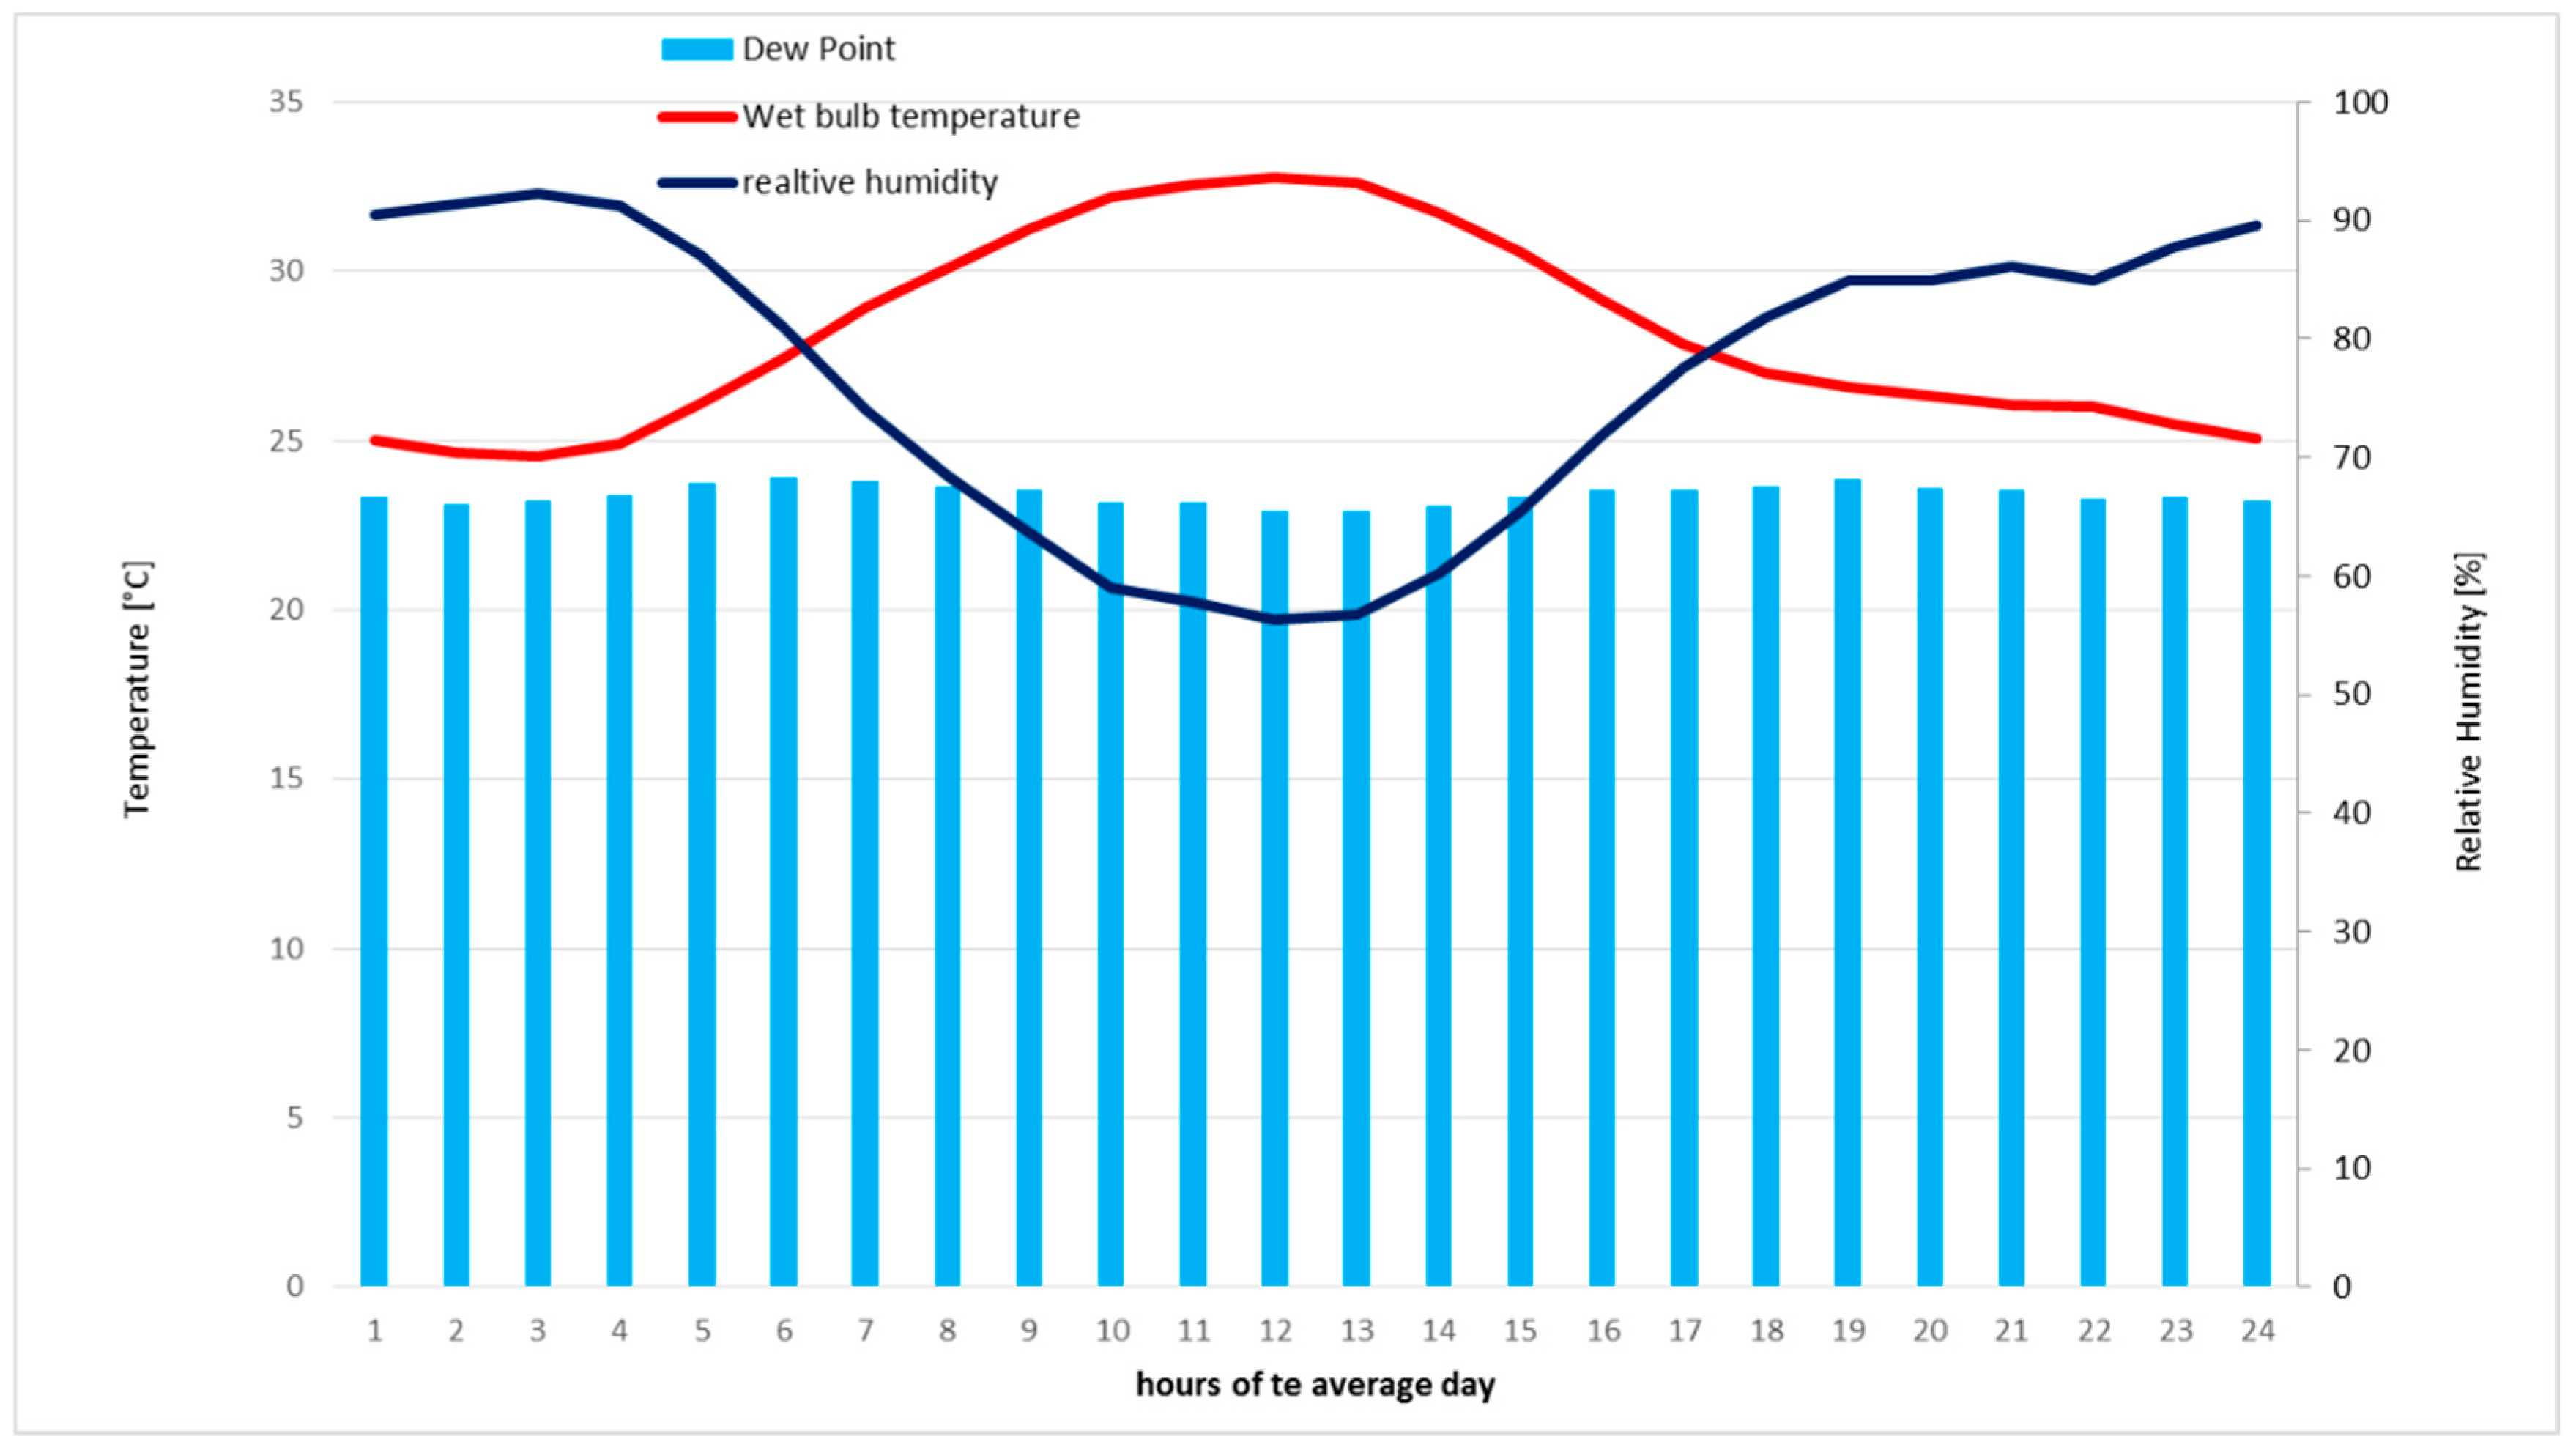
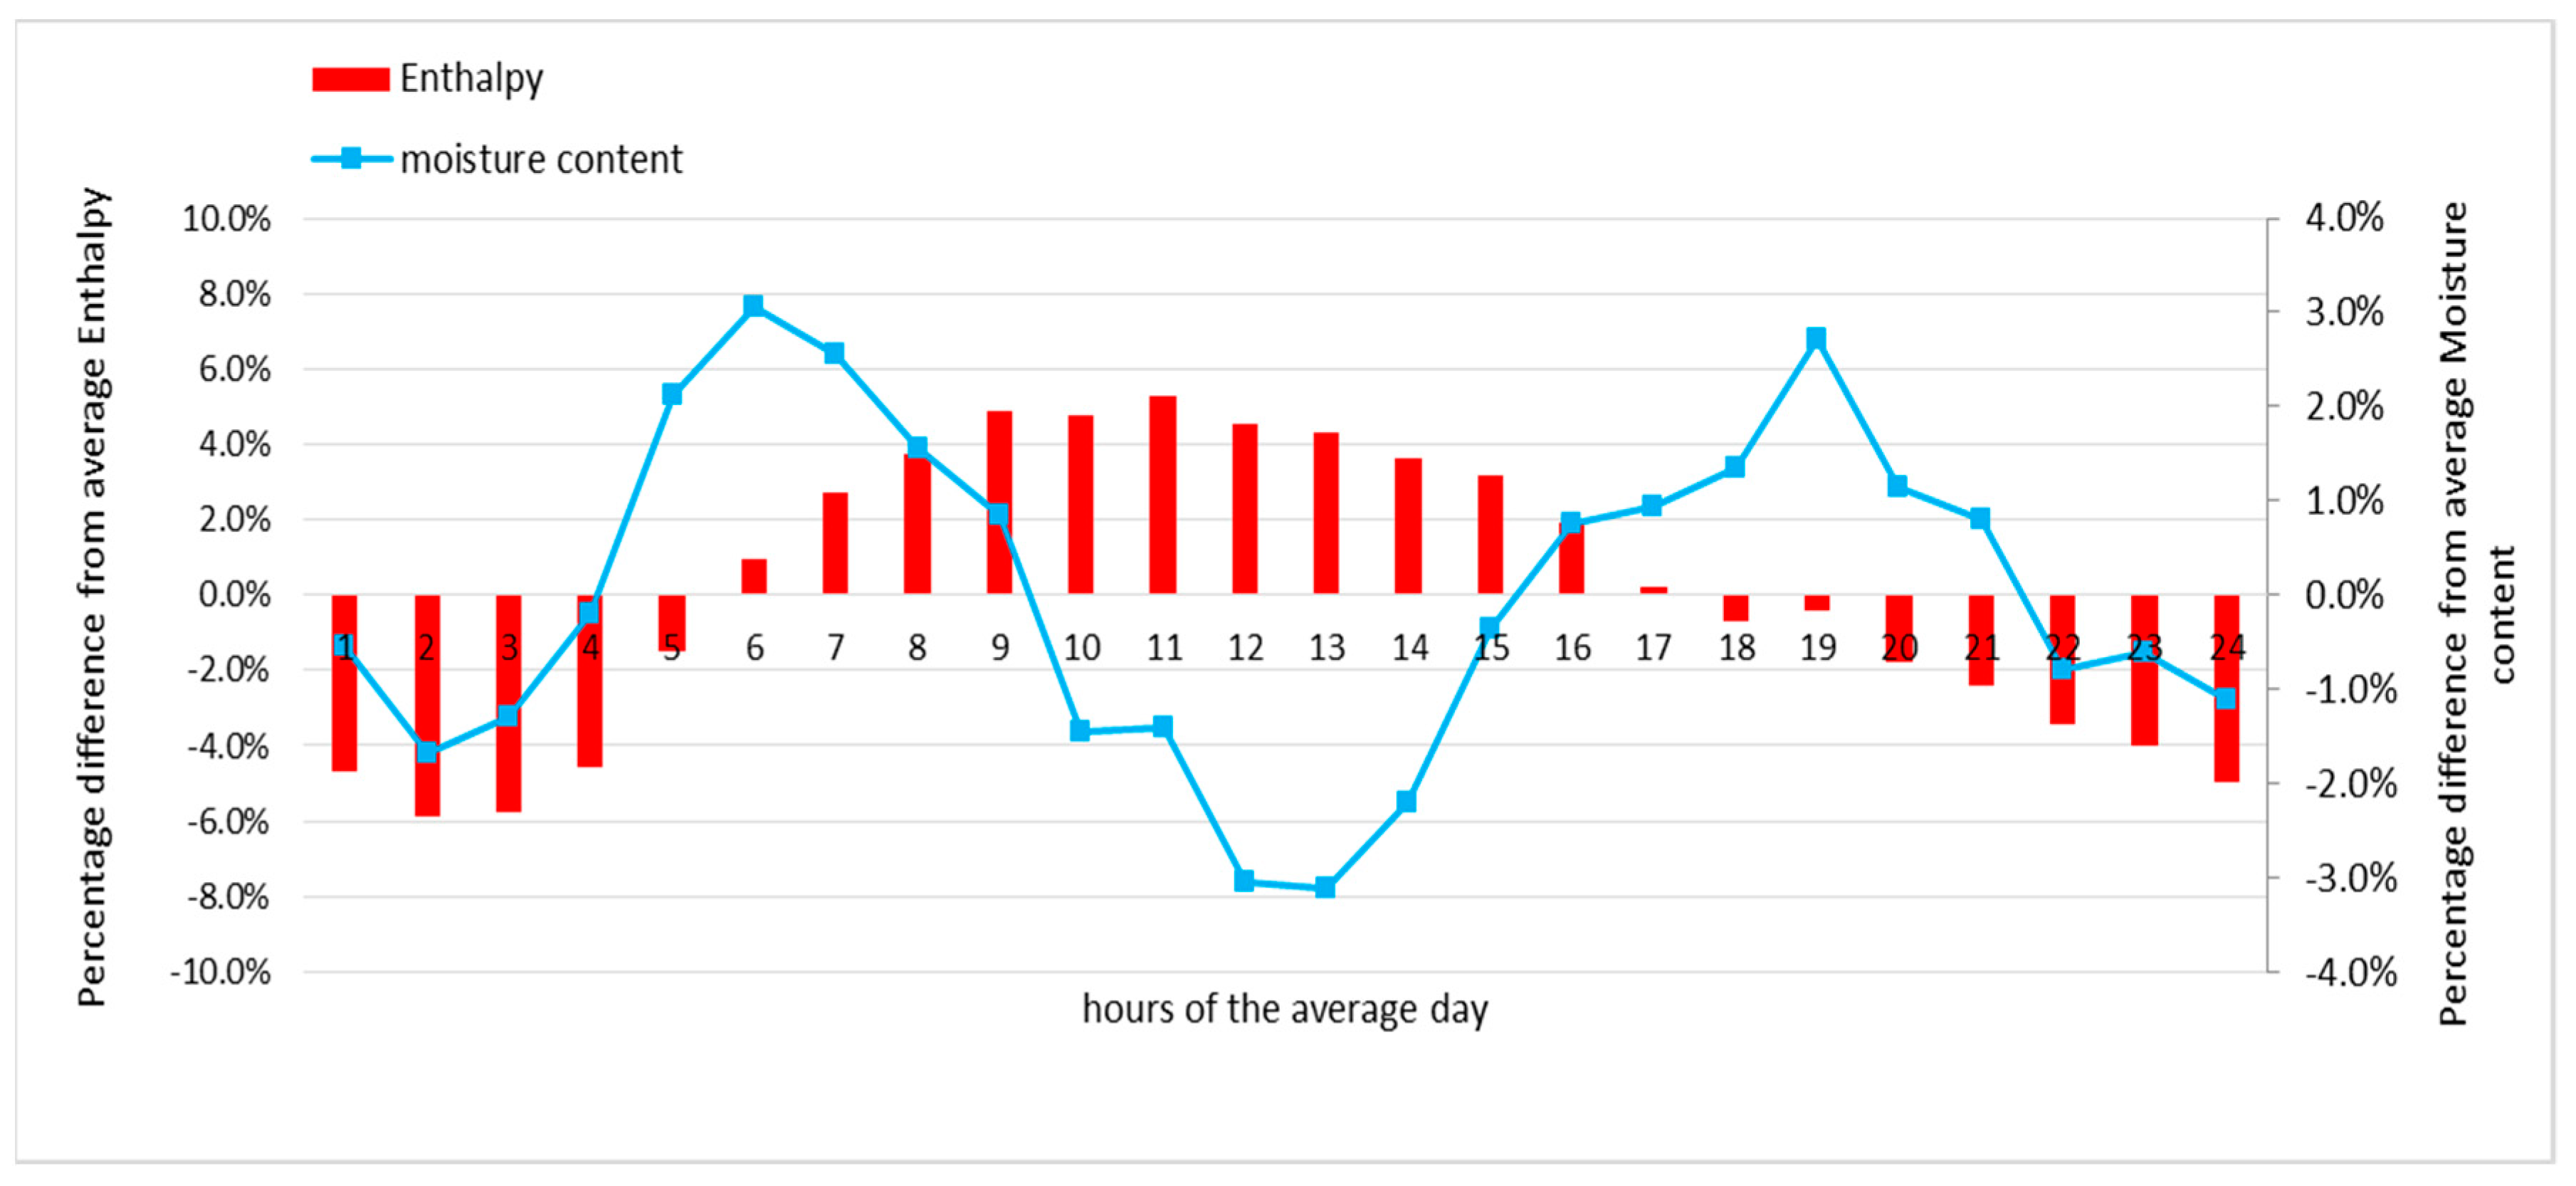
Analysis of hourly values showed that moderated daily variations of temperature and relative humidity characterize Villahermosa climate. In particular, data for the average day of January (the coldest month,
Figure 1 and
Figure 2) and of August (the warmest month,
Figure 3 and
Figure 4) show that temperature and relative humidity do not have significant differences. Enthalpy, dew point, and moisture content are also almost equal in the two months. The maximum differences between the hourly values and the average in August are 5.9% for enthalpy and 3.1% for moisture content, while during January the differences are, respectively, 6.3% and 3.7%.
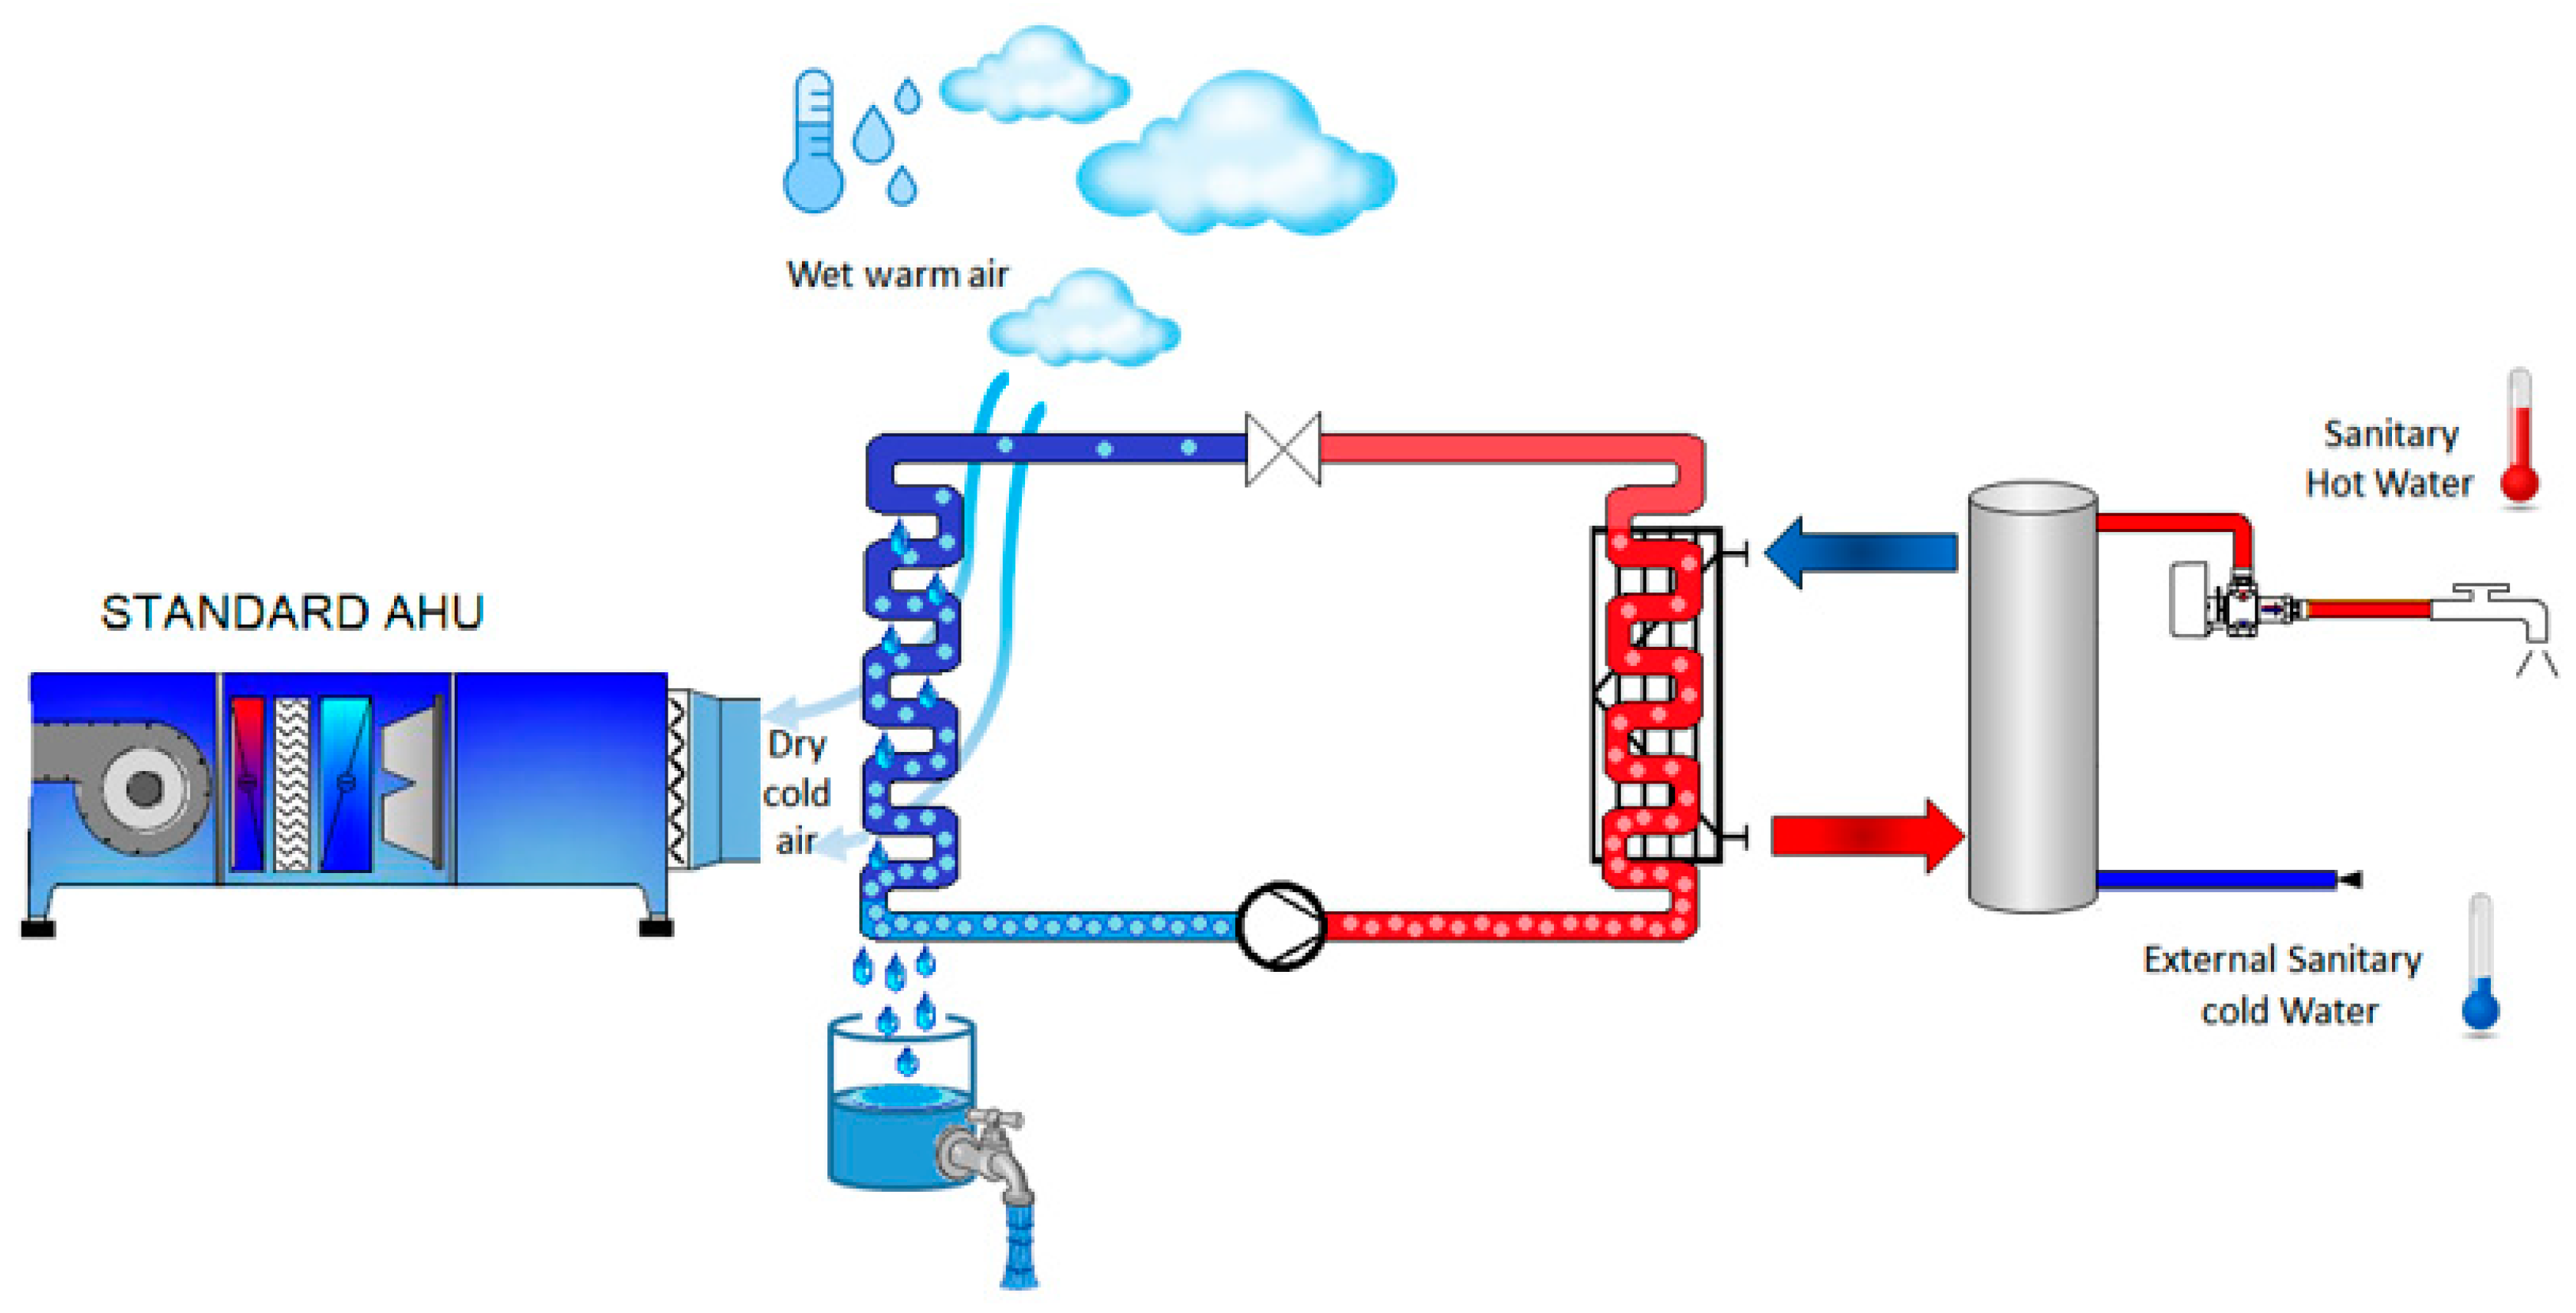
2.3. The Integrated System
The integrated air to water system works by means of a compression reverse cycle. Outdoor air is cooled below its dew point through a direct expansion evaporator, and condensed water is collected and sent to the water treatment unit.
The main aim of the system is water production, but two secondary effects of the reverse cycle are considered for efficient use: fresh and dry airflow exiting after water condensation and heat coming from the condensation stage of the coolant. Therefore, the machine has been designed to collect the exiting fresh, dry airflow in a duct in order to deliver it to an air conditioning system, or directly to an indoor environment. Moreover, an alternative circuit to the air condenser employs a coolant-water plate fin heat exchanger to collect the heat flow for domestic water heating. The integrated system’s working scheme is illustrated in
Figure 5.
This circuit was designed in order to be easily integrated in an existing system and to exploit all useful effects of the compression reverse cycle. Its effectiveness is related to the integration of the existing plant and to the real needs and use of those effects.
As discussed in [
9], these kinds of systems are particularly suited to hotels, as they generally require drinking water, heating (at least for domestic water), and air conditioning. Moreover, hotel needs can meaningfully affect the management of the municipality in terms of water and energy requirements, particularly if their occupancy rate is not constant and above all if they are located in places affected by water and energy issues [
11]. Thus, significant energy and water savings for such a building can result in an economic advantage not only for hotel owners, but also an improvement for the whole community.
The integrated system’s design is based on previous research [
9] and, in general, adopts the same scheme:
a cooling circuit, equipped with a screw compressor;
an air treatment unit, provided with a heat recovery system;
a condensed water treatment system.
The plant of the previous design was scaled to about a one-quarter of its size: the compressor has a cooling capacity, in design conditions, of 100 kW, instead of 400 kW. Evaporation fans are sized in order to provide an average airflow of 8000 m3/h passing through the inlet section, which is fitted with pre filters G4 (90% ≤ Am of ASHRAE (American Society of Heating, Refrigerating and Air-Conditioning Engineers) test for dust, in compliance with standard EN779:2012) and pocket filters F9 (95% ≤ Em of 0.4 μm particles—minimum efficiency of 0.4 μm particles of 70% in compliance with standard EN779:2012), as used in the previous design.
An important difference from the previous design is that air-cooling is carried out by means of a direct evaporation of the coolant (R134a), and evaporating coils and heat recovery coils, as well as the condensation collector tank, are built with materials that are certified compatible for food and beverage contact. Fresh and dry air coming from the evaporation coil and the heat recovery system can be collected in a duct and, in turn, be delivered directly to zones which should be provided with primary air.
Another difference from the previous design relates to the double circuit for coolant condensation. The first circuit links the compressor to a condenser coil, equipped with fans, which is cooled by means of outdoor air. The second circuit links the compressor to a plate fin heat exchanger. This coil is linked to the domestic water circuit and provides coolant condensation by means of domestic water heating. Its thermal power capacity is 120 kW.
The condensed water treatment unit was designed in order to guarantee safety, healthiness and quality of the final product. Without treatment, water coming extracted from air is not safe nor suitable for human consumption [
4].
Therefore, all components which come in contact with condensed water must be in compliance with food and beverage norms. Moreover, particular attention must be paid to those families of chemical substances that are subject to Fick’s law of water-gas diffusion. In addition, biological hazards must be avoided with continuous sterilization.
It is also important to highlight that water coming from air contains, due to the nature of its source, molecules of nitrogenous substances as the most relevant chemical pollutants. Several studies have been conducted to identify the most important pollutants that affect water coming from such a source as air. A detailed description of these is not the subject of the present research, and will be provided in a dedicated paper. However, it can be anticipated that nitrogenous substances and microorganisms can be mentioned as common pollutants in condensed water coming from air.
For water treatment in the current application, the plant design was composed of:
With this configuration, it is possible to obtain, first, sterilized demineralized water, and second, safe mineralized water. The plant was equipped with probes for pressure, pH and electric conductivity monitoring, allowing continuous monitoring of the plant’s behaviour.
During employment of the system at the hotel, water tests were carried out before the mineralization stage. Results demonstrated that the produced water was suitable for human consumption, both from a chemical and from a microbiological point of view, not only in compliance with Mexican laws, but also with Italian laws (which have some of the strictest global limits).
The main components of the integrated machine can be therefore briefly summarized as follows:
an air handling unit, incorporating a heat recovery system and a coil for direct evaporation, pocket filters and pre-filters;
a screw compressor, with cooling power of 100 kW;
a plate fin heat exchanger for domestic water heating;
a condenser coil, cooled by external air;
temperature and humidity probes on the air flux, in order to monitor system behaviour;
pressure probes;
a water treatment unit, complete with microfiltration, activated carbon, adsorption resin, reverse osmosis, salt cartridges, UV lamps, manometers, and pH and conductivity probes; and,
a PLC (Programmable Logic Controller) that regulates the machine behaviour, providing overall control, from the water treatment unit to the shift between the air condenser coil and the plate fin heat exchanger.
3. Experimental Setup and Results
3.1. Machine Integration into the Existing Plant and Measures
The machine was integrated into the existing heating equipment by means of a simple circuit: two pipelines, with a diameter of 2 inches (0.0508 m) linked the plate exchanger to the inlet and outlet sections of the existing storage tank. In order to regulate the switch between the air condenser and the plate fin heat exchanger, two thermocouples were placed on the inlet and outlet sections of the pipeline, and connected to the PLC.
Furthermore, a pump, with a delivery capacity of 18 m3/h and a head pressure of 80 kPa, was mounted in order to guarantee the circulation between the integrated machine and the storage tank. The maximum heating temperature for the domestic water was set at 55 °C, and the average heating temperature was set between 48 °C and 50 °C. The PLC regulated the pump on the basis of the inlet and outlet temperatures, indicated by the two probes, by means of a PID (Proportional Integral Derivative controller) regulation.
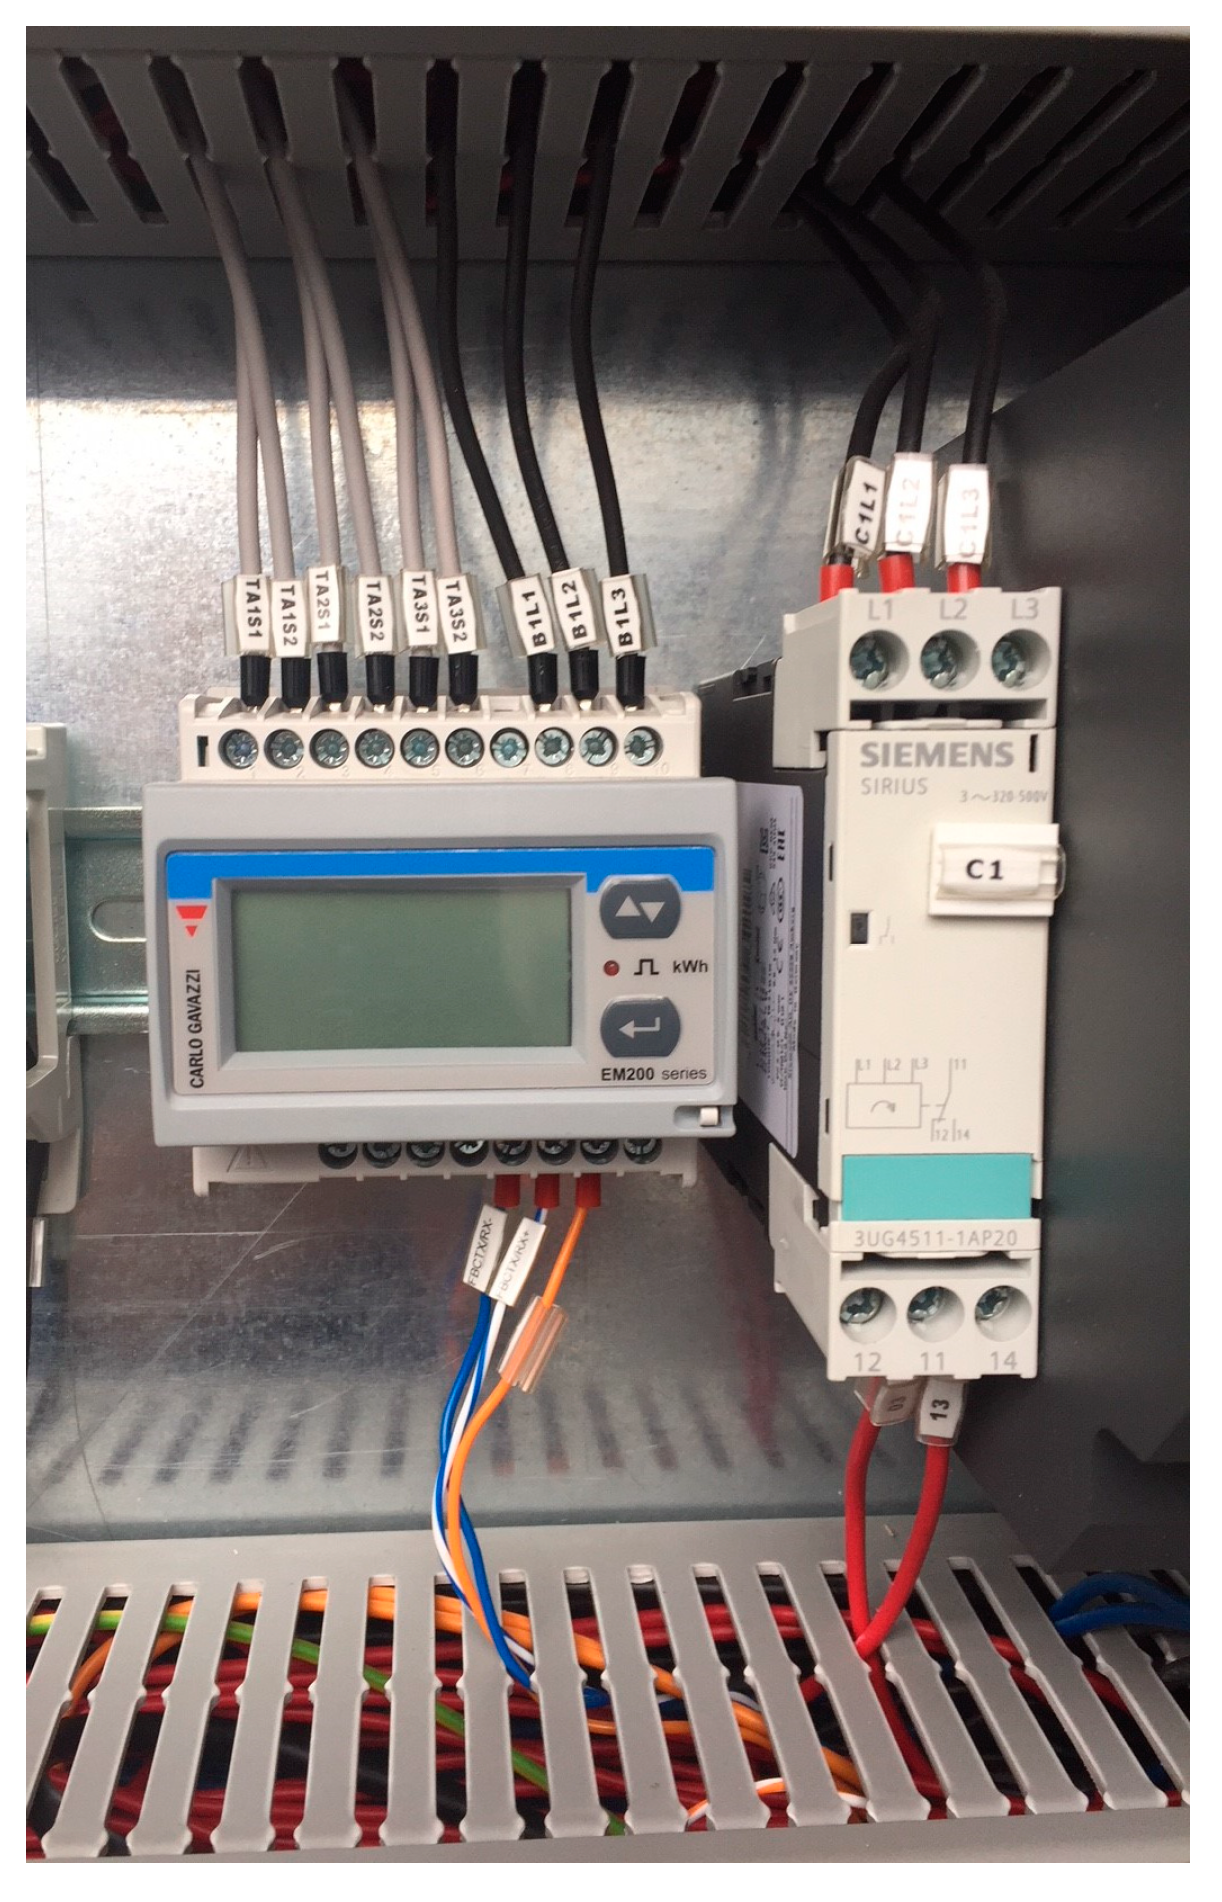
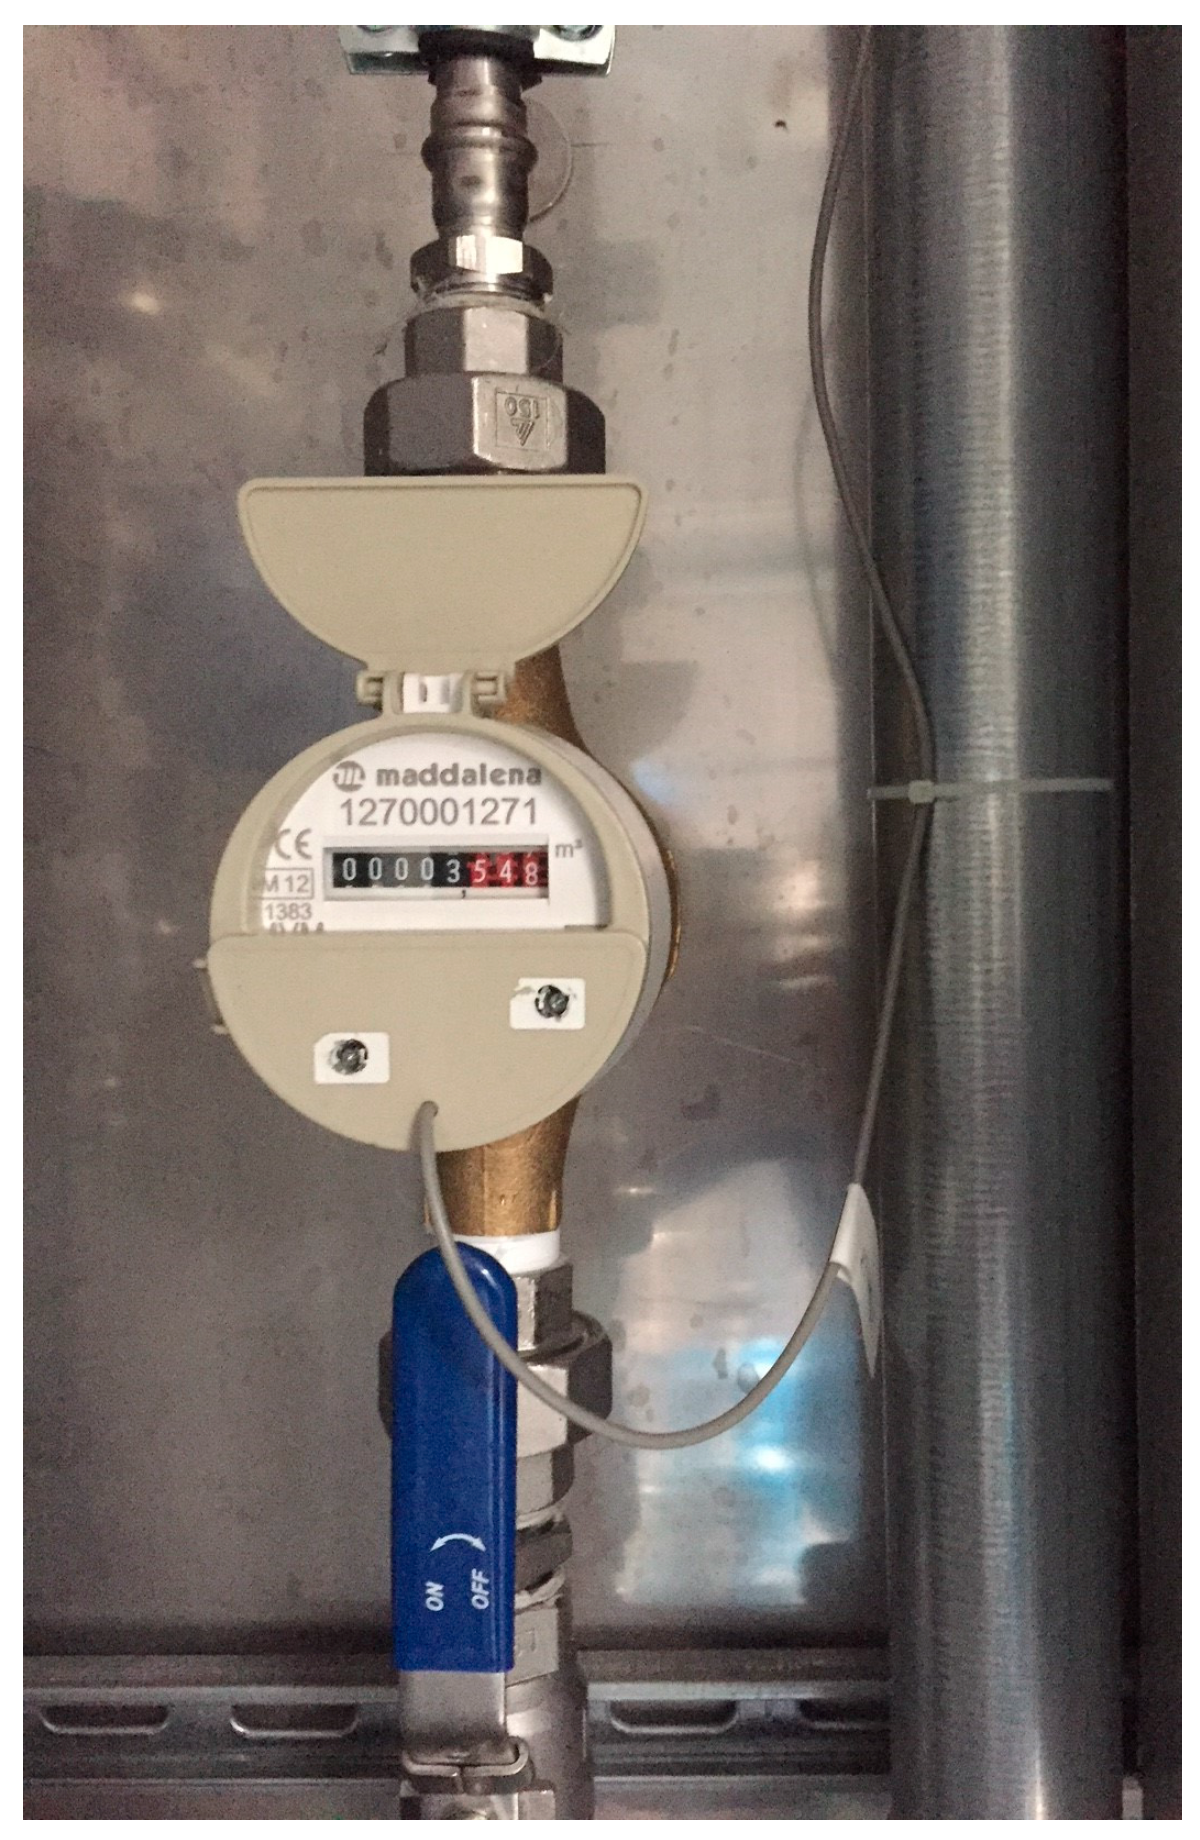
The existing heat generator was maintained as a backup system. Its start point was set to a temperature of 43 °C. Such a threshold guaranteed that the boiler would start working only if strictly necessary. During the test period, the integrated system was monitored by means of on-board probes. In particular, the parameters recorded have been represented by: water production, with a water counter (
Figure 6); energy consumption, with an energy meter (
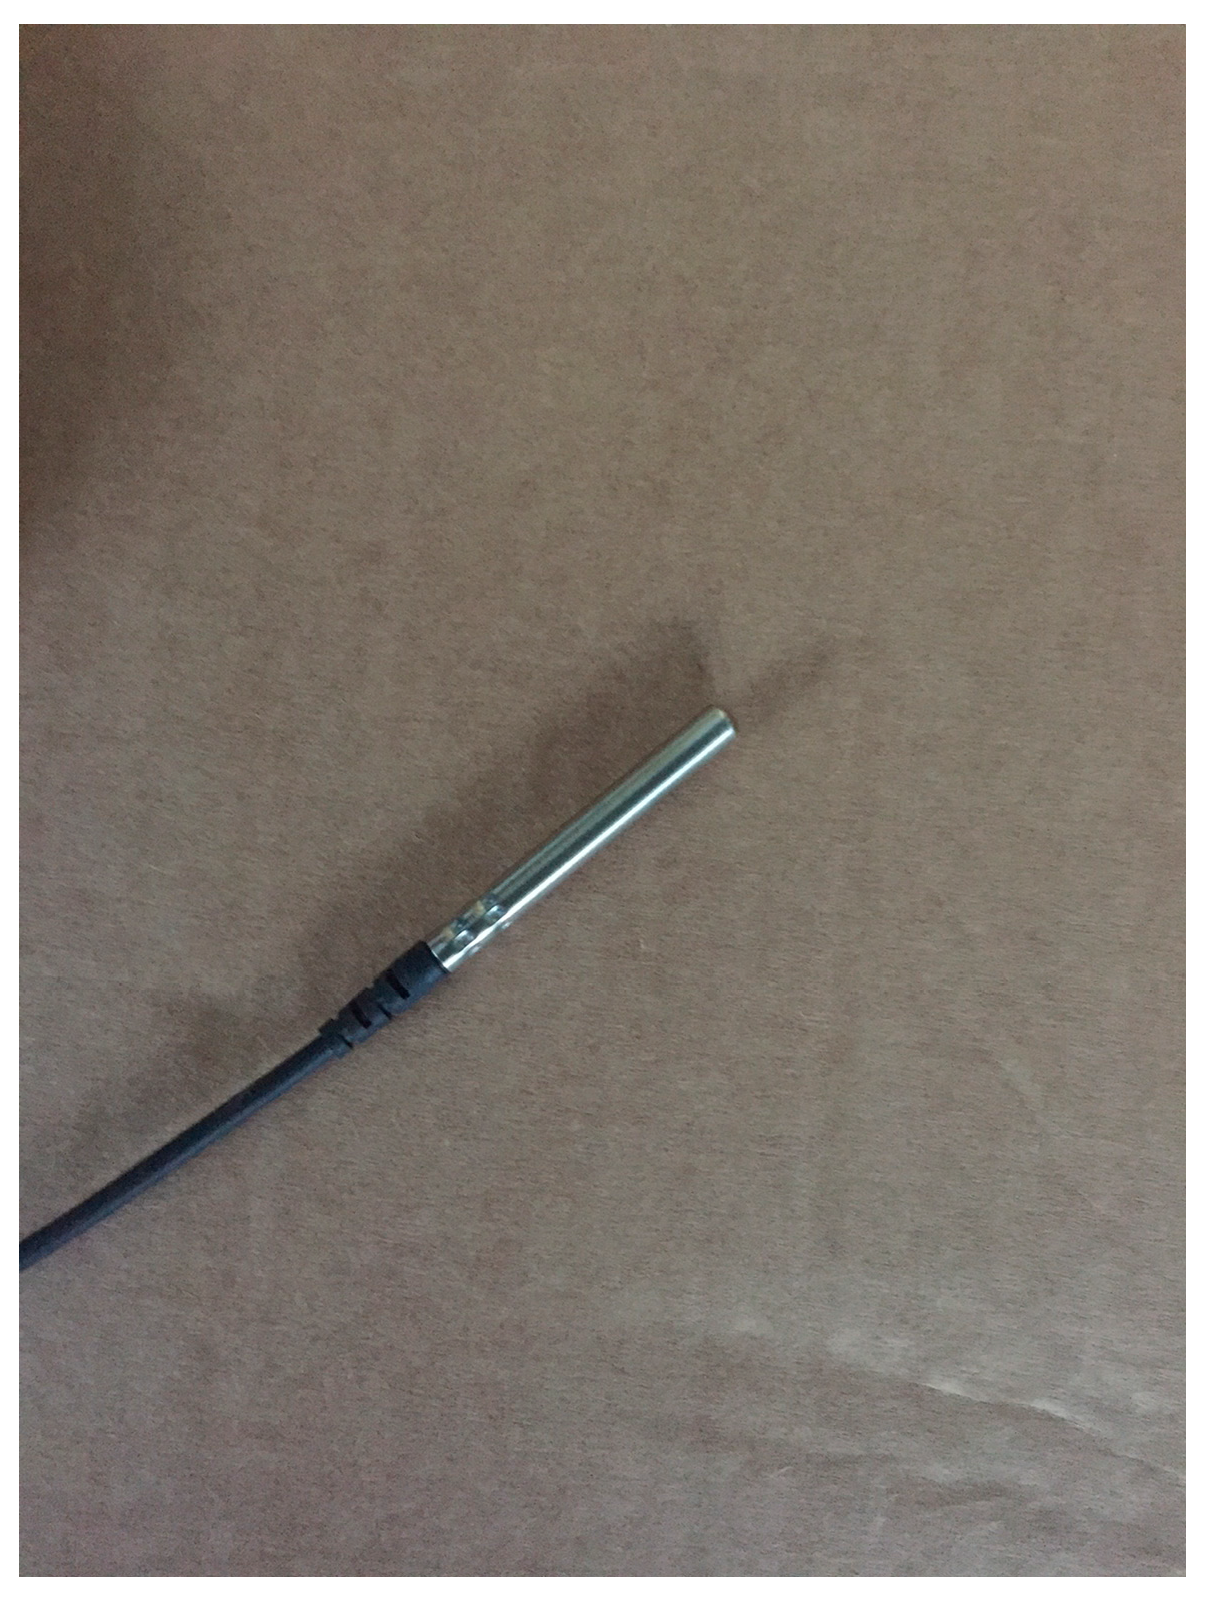
Figure 7); domestic water heating temperatures by temperature probes NTC (Negative Temperature Coefficient) connected to pipes (
Figure 8); and, environmental temperature and humidity, by means of the local weather station. At the same time, the hotel management staff collected daily LPG consumption data, by means of their own measurement system. All data were collected with a daily frequency, except temperature and relative humidity, which were collected hourly.
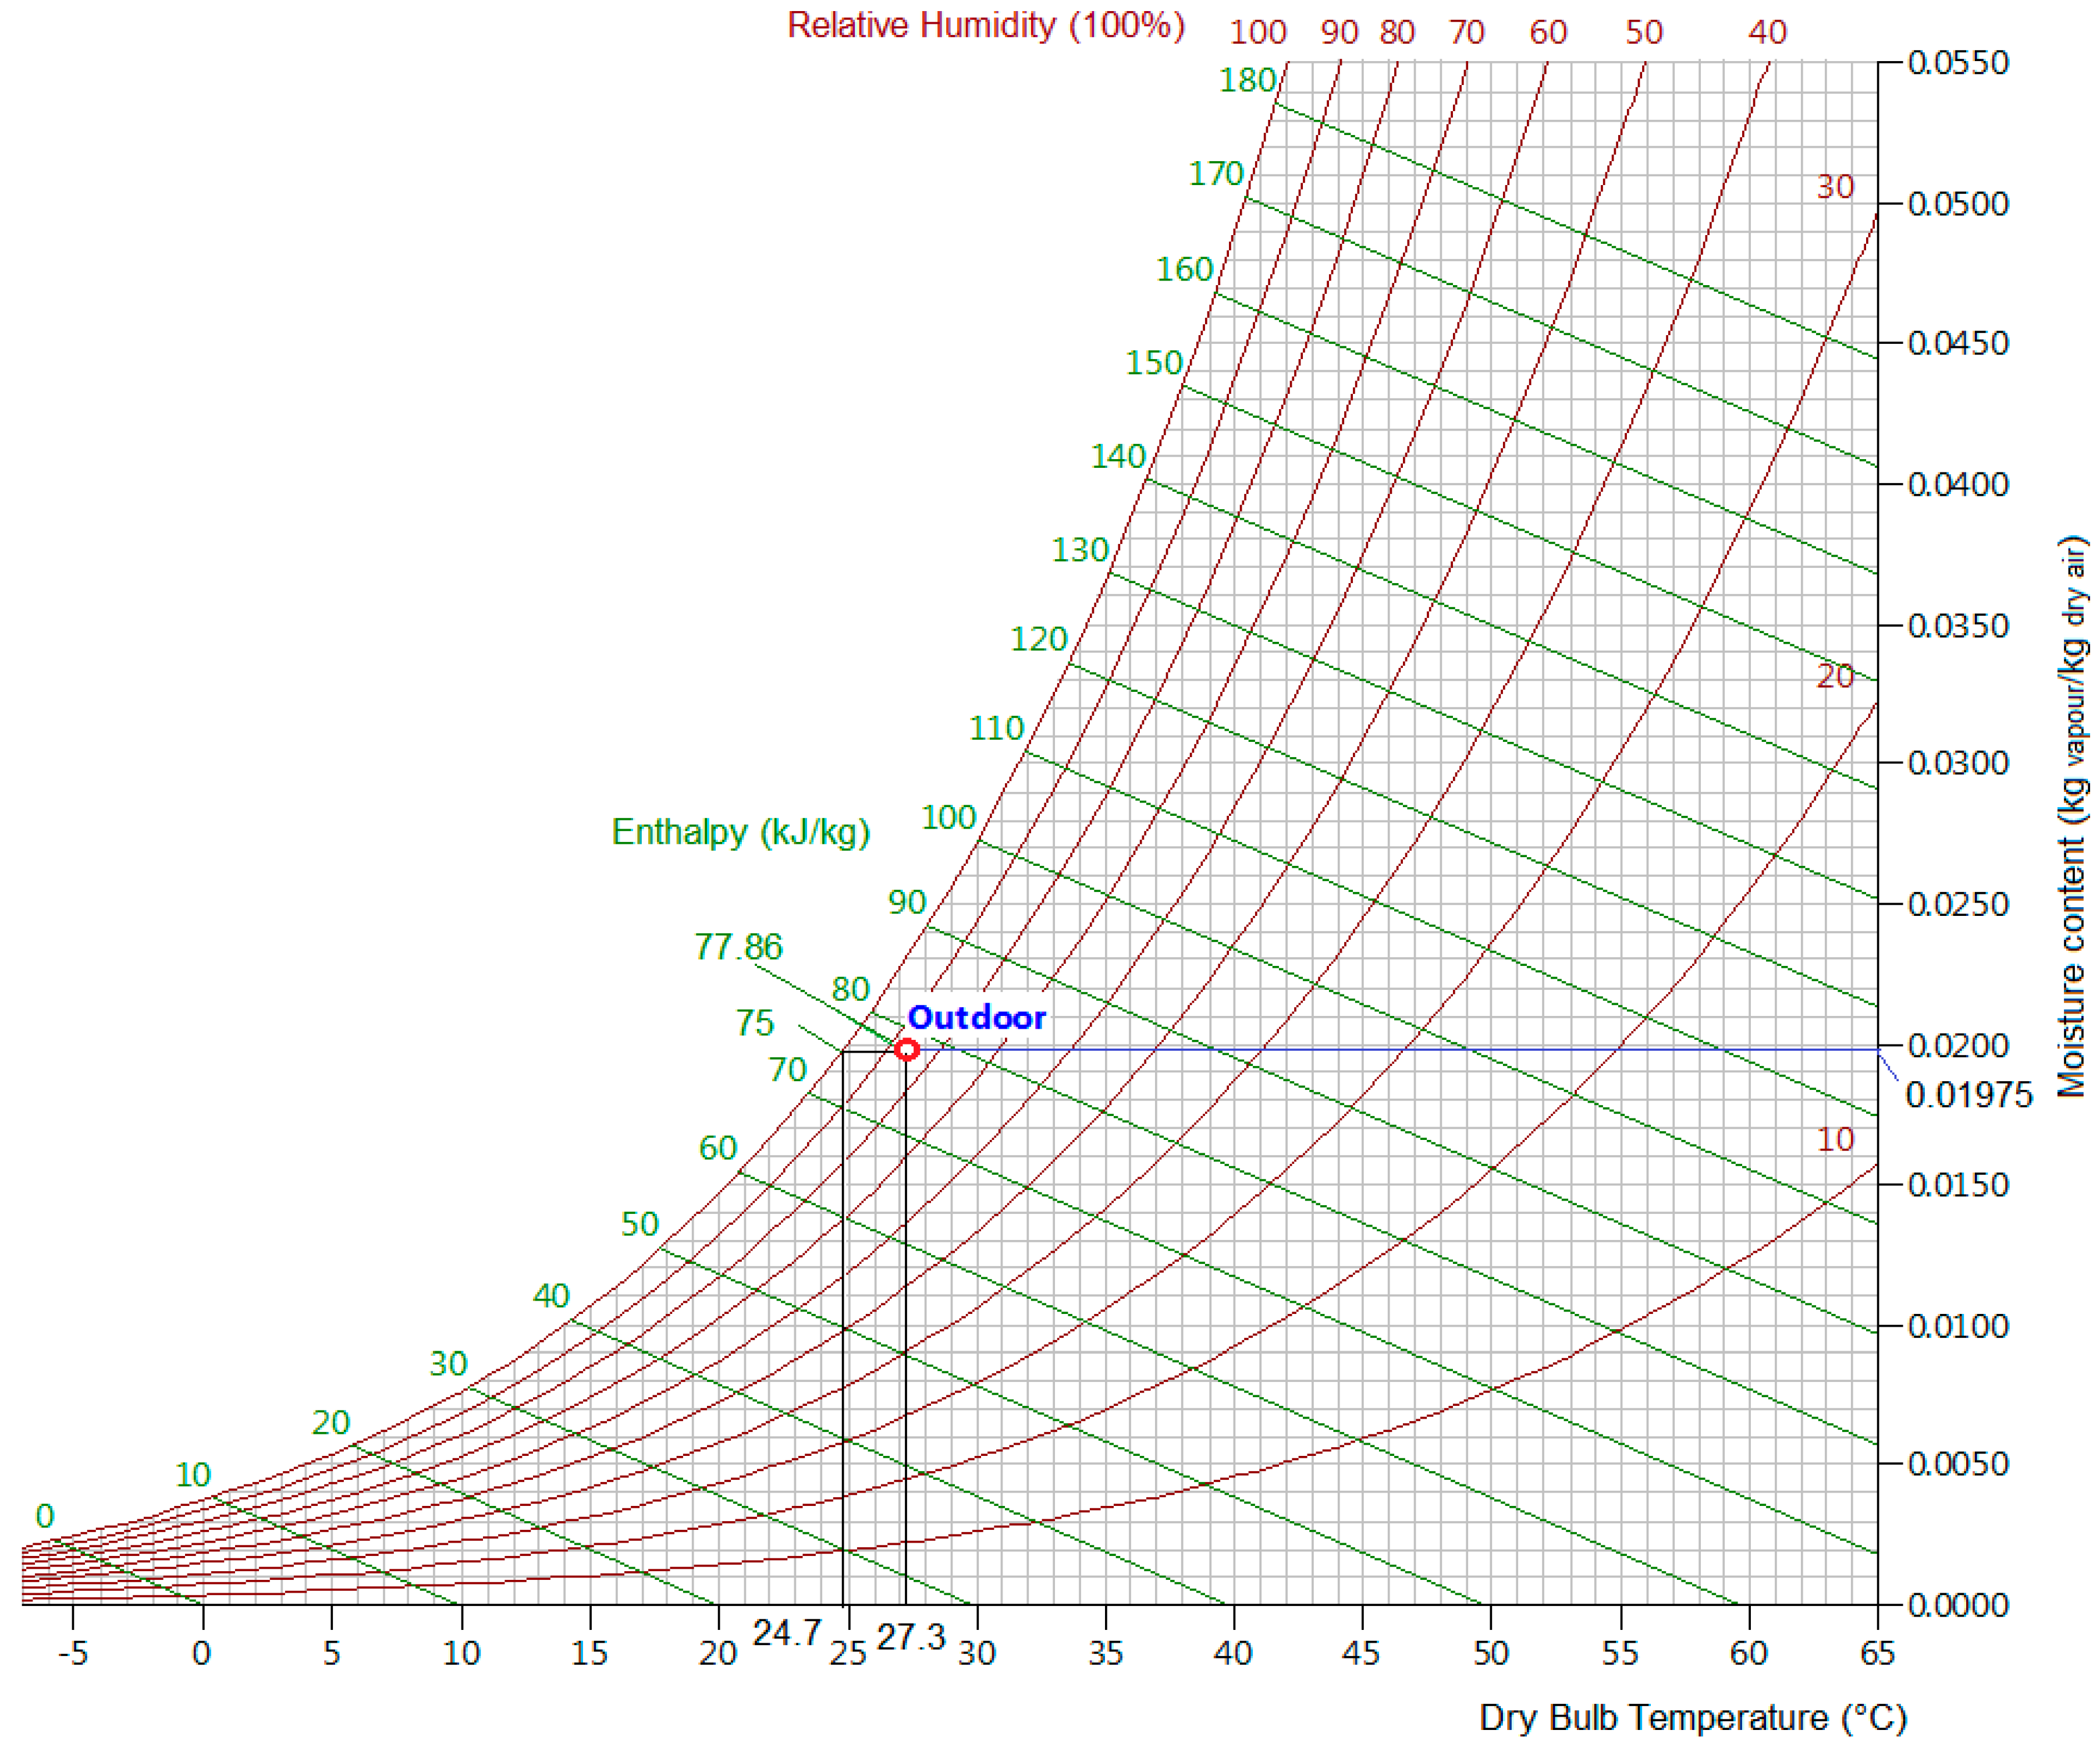
3.2. Results—Outlet Air Conditions and Water Production
The test was carried out from 6th to 27th of November 2015. During this period, temperature and relative humidity values were somewhat different from historical statistics: in fact average temperature and relative humidity were 27.3 °C and 86%, respectively [
12]. Calculated thermo-hygrometric parameters for these conditions are shown in
Table 2, and indicated on the psychrometric chart (
Figure 9 and 9 bis).
During the testing period, the integrated system ran continuously for 24 h/day, with average production of 1882 dm3/day of drinking water, which was entirely used for human consumption (drinking and kitchen uses). This production corresponds to an estimated saving of 158 dm3/day of bottled drinking water, corresponding to the number of guests during the test period (two half-liter bottles for each guest), and 1724 dm3/day of water from tanks, used for kitchen and restaurant uses. At the same time, domestic water was heated at an average temperature of 49.4 °C, by means of the heat flux coming from the integrated machine.
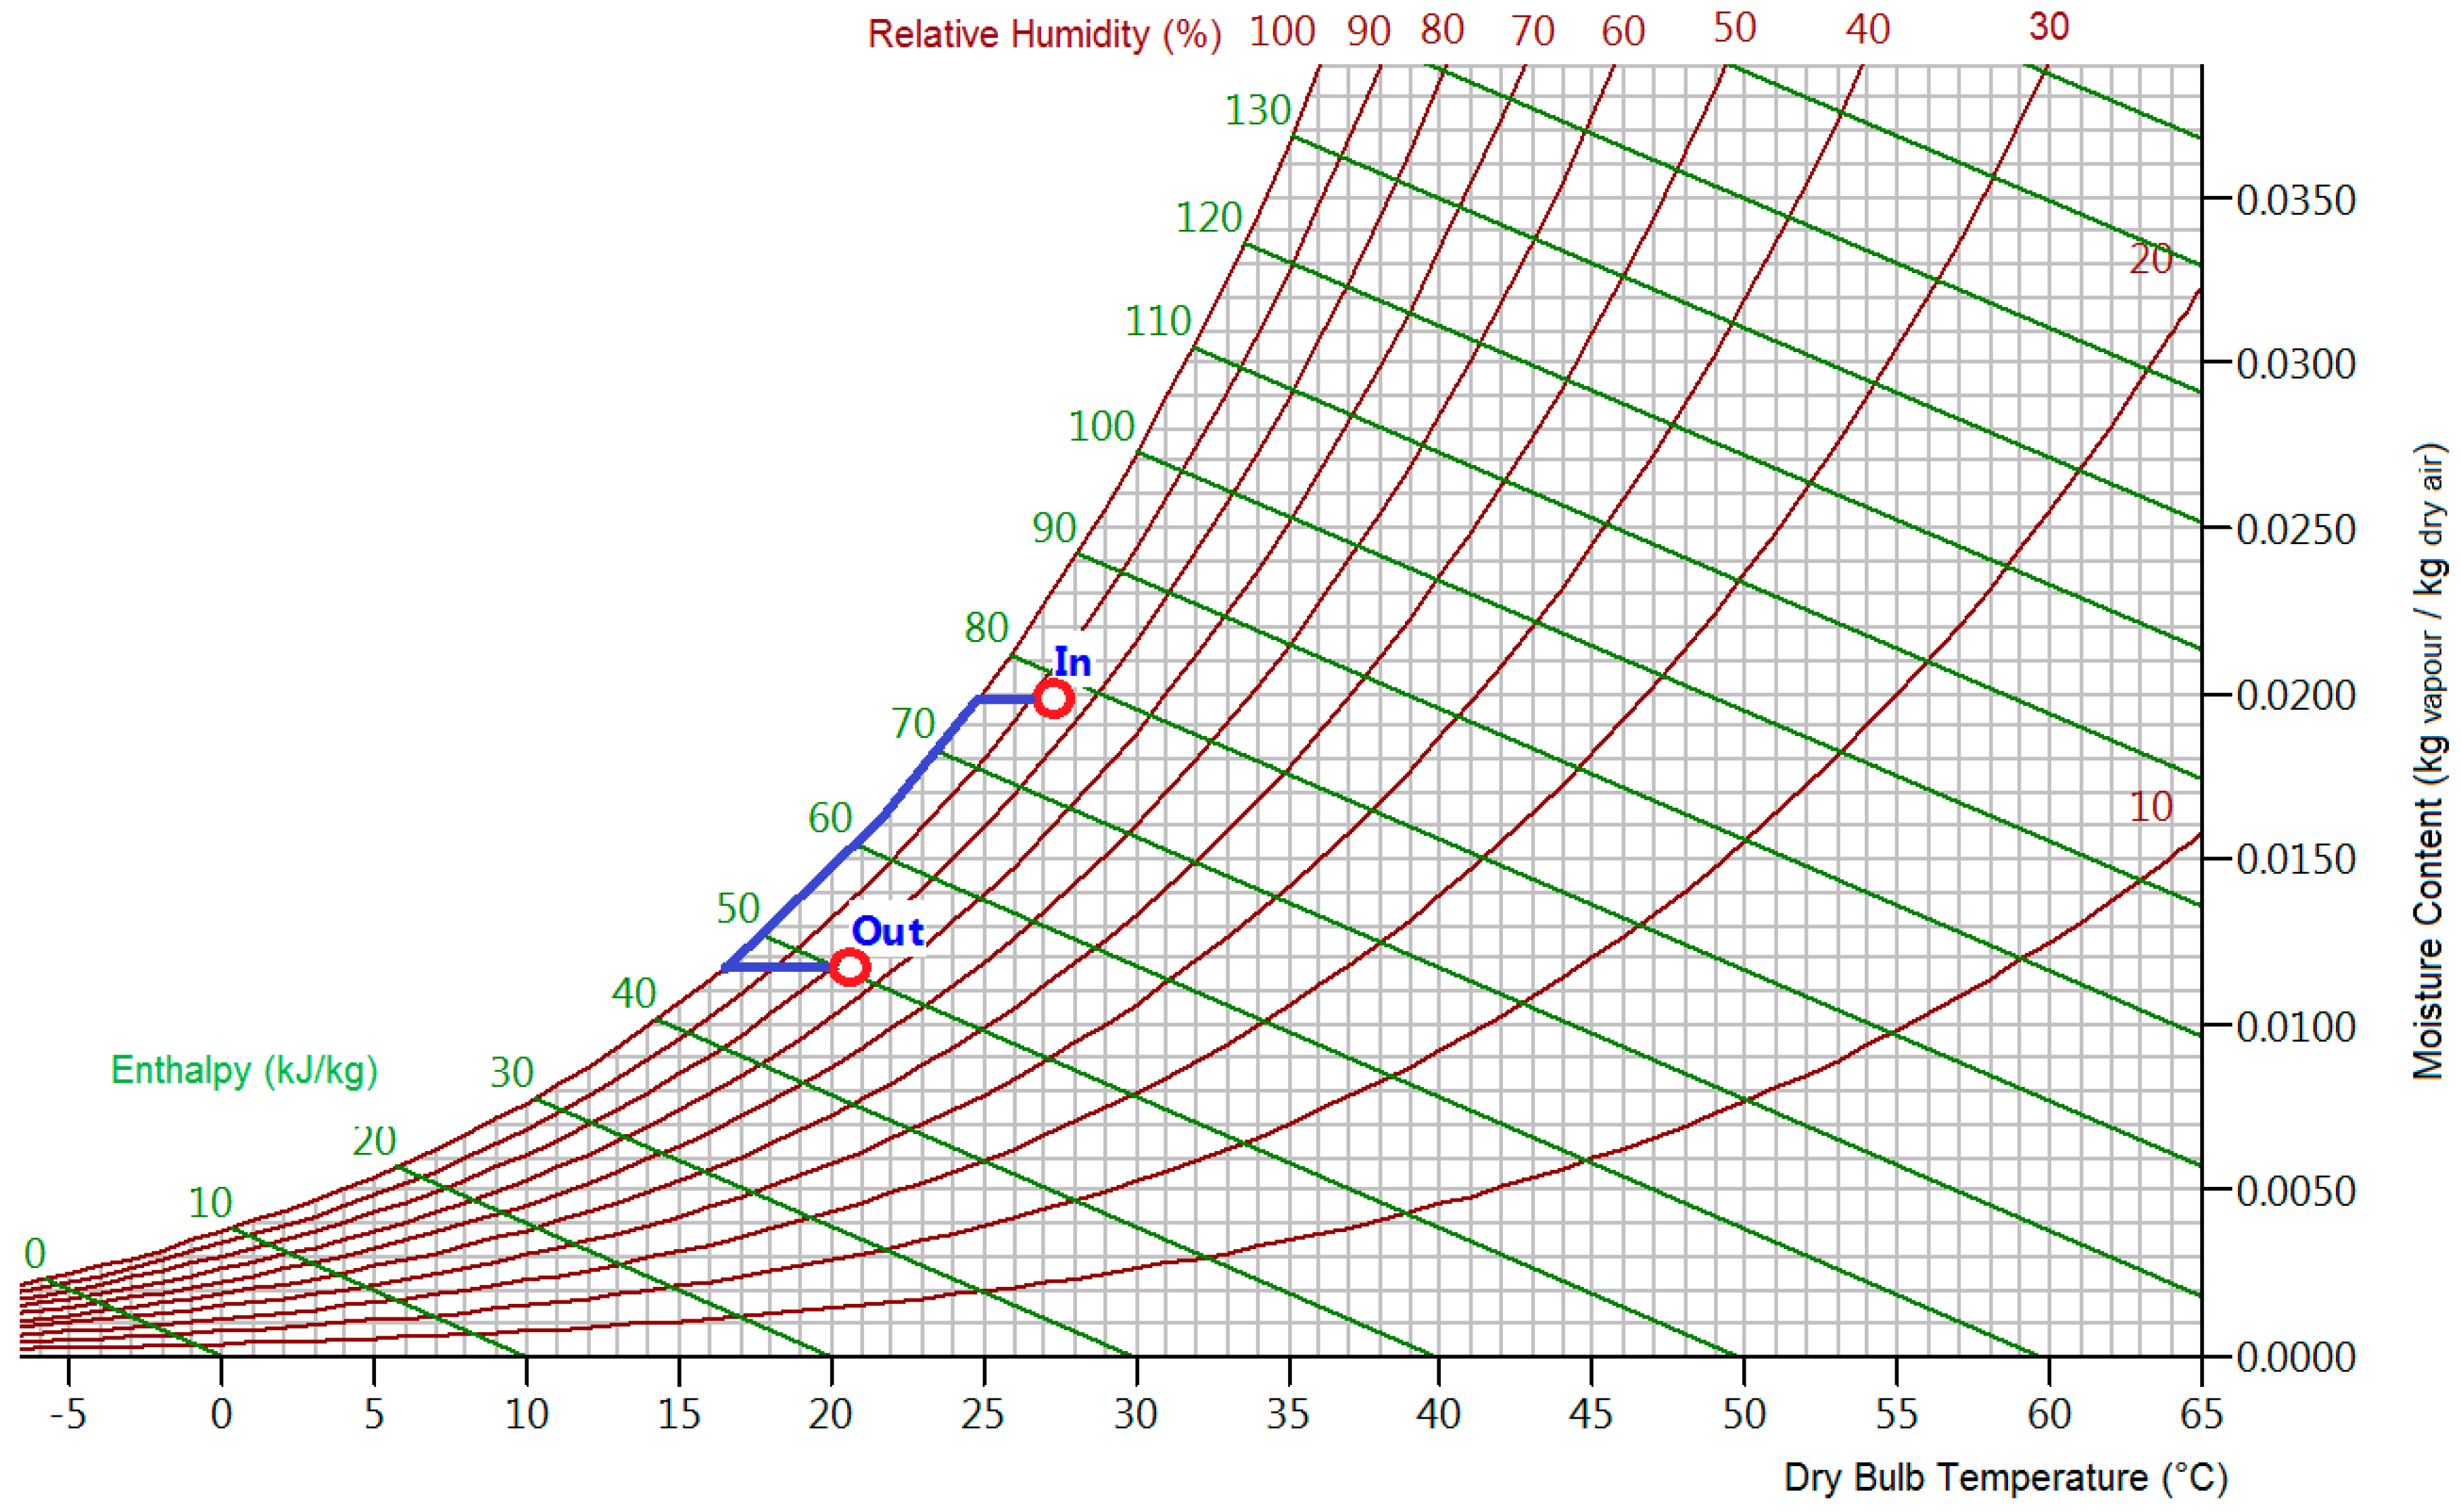
In order to produce 1882 dm
3/day of water, the system treated an environmental average airflow of 8500 m
3/h, which was cooled and dried to 20.7 °C and 77% RH. The corresponding calculated thermo-hygrometric parameters are shown in
Table 3. The wet air processes performed by means of the integrated system are shown in
Figure 10, considering inlet air in outdoor conditions (
Table 2).
3.3. Results—Energy Consumption and Saving Evaluations
The average electric power required by the system to generate these effects, including water treatment, was measured to be equal to 34.67 kW. Overall energy consumption during the test period was 17,655 kWh.
The fuel consumption calculation was more complex, as LPG fuel is used not only for domestic hot water (DHW) production but also to obtain steam used in the SPA (Wellness Center) and the laundry in a closed loop. Because the two plants are linked to the same reservoir tank it was not possible to identify LPG consumption for each of the two uses.
The following points were thus considered in estimating the LPG fuel needed for DHW production. Domestic water consumption is strongly related to guest numbers, i.e., it is a function of hotel occupancy. In order to understand the effectiveness of the application, it was necessary to carry out a comparison between the LPG consumption during the testing period and its consumption during a previous period, characterized by a similar occupation. From hotel records, it was possible to collect LPG consumption for the months from August to November. It was also possible to obtain the room occupancy ratio, calculated based on the hotel’s total capacity, for each month (
Table 4).
The data show that October had an occupation very similar to November, and thus was considered the reference month for comparing consumption. Average LPG consumption in October was 371 L/day while in November, during the testing period, it decreased to 207.1 L/day. The difference, of 163.9 L/day, represents 44% of total LPG consumption.
As noted earlier, total LPG consumption is due to two uses (steam production and domestic water heating) carried out by means of two different systems. During the test period, the existing boiler, devoted to domestic water heating, was not required. In other words, all domestic water heating was performed by the integrated system. Experimental results are confirmed by means of a rough energy calculation based on the domestic water consumption. The maximum temperature of the existing plant, as noted, was set at 55 °C, and the average temperature of the domestic water was 40 °C. The temperature of the external aqueduct water was 10 °C. Allowing for 140 dm
3/day of hot domestic water consumption for each guest, daily domestic consumption is about 21,950 dm
3 in November. Assuming an LPG inferior calorific value of C
LPG = 24.012 MJ/dm
3, and the existing plant efficiency of 0.7, fuel consumption related to domestic water heating can be calculated to be equal to 164 dm
3/day. The net thermal power, φ = 120 kW, of the integrated system heats this volume of water in about 6 h. The details of the calculations are shown in
Table 5. In the case of 100% occupancy, the integrated plant will take about 12 h to cover the heating needs.
In order to estimate the energy saving related to the fresh and dry airflow supplied to the laundry area, comparison with a traditional, but efficient, air conditioning system was made. As noted earlier, a ratio of 13 air changes per h, i.e., 5850 m3/h of fresh air, was taken into account, corresponding to humid air airflow Gha = 1.958 kg/s.
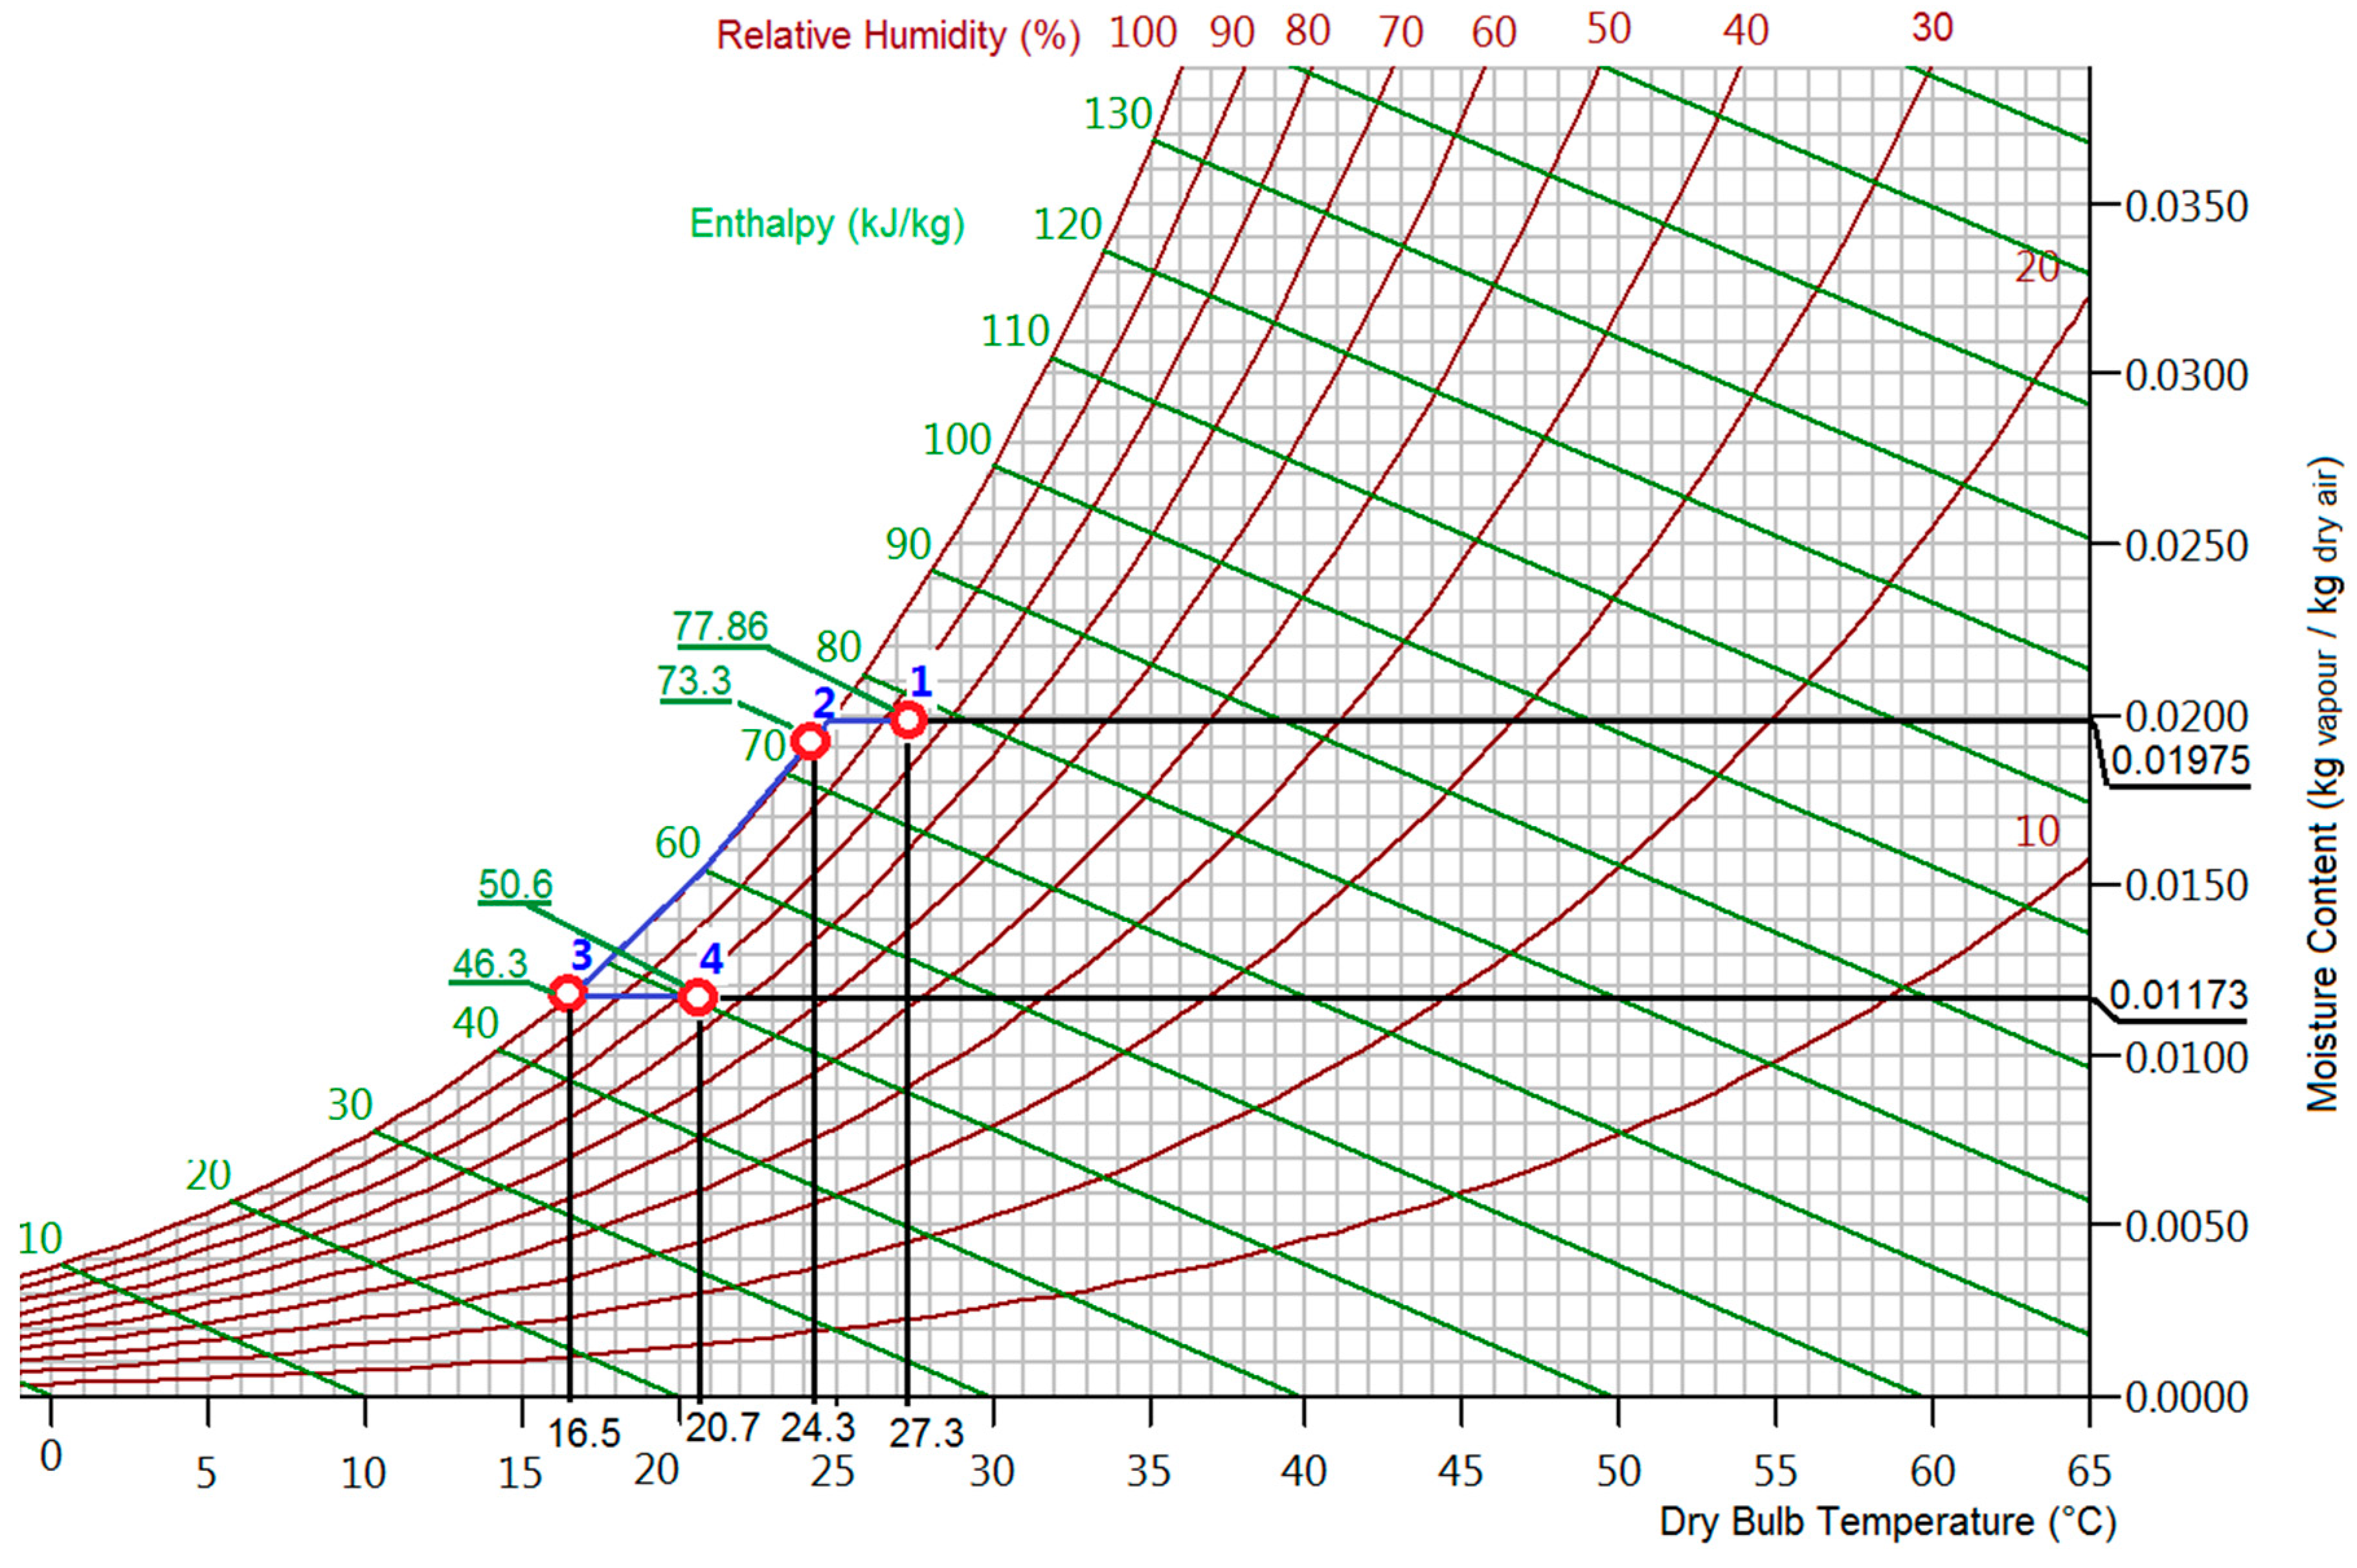
A plant with an energy efficiency ratio (EER) of 3.5 in average November climate conditions and a heat recovery system for post heating (33% of efficiency in terms of enthalpy) were considered as reference, to obtain the same temperature and relative humidity achieved by the integrated system, with an environmental airflow of 6000 m
3/h. In order to make a conservative calculation, the EER of 3.5 was considered even in the case of partial load. In the psychrometric chart (
Figure 11), humid air transformations are highlighted. Points 1 and 4 correspond to the conditions of the inlet and outlet air, indicated in
Figure 10. The air transformations 1–2 (cooling) and 3–4 (heating) can be attributed to the heat recovery system. The heat recovery system carries out the first air cooling under the dew point.
In these conditions, the electric energy consumption of such a plant can be calculated to be 150 kWh/day. This also represents the energy saving of the combined system (
Table 6).
3.4. Results—Economic Evaluations
During the testing period, the integrated system produced the following savings:
Bottled water saving: 158 dm3/day;
Kitchen water saving: 1724 dm3/day;
LPG saving: 164 dm3/day;
Electric energy (laundry cooling): 150 kWh/day.
As noted, the environmental conditions in Villahermosa are very steady during each month, thus, it is reasonable to extend the results obtained in the test period to the whole month of November.
In order to calculate the corresponding economic savings, in addition to bottled and kitchen water costs, information about LPG and electric energy costs were obtained from hotel owners (referring to 2015). With these data, the economic saving for November accounts for 125,444 Pesos. At the 2015 exchange rate ( 17.3735 pesos/USD [
13]), this yields a monthly saving of USD 7220.4 (
Table 7).
As described above, during the test, fresh and dry air coming from the integrated system was only partially used as primary air, in order to increase the environmental quality of the laundry. However, the hotel also has an air conditioning system dedicated to guest rooms and common areas, composed of fan coils and a primary air delivery system, that works throughout the year for 24 h/day.
The ATU (Air Treatment Unit), which treats primary air, is situated on the roof and therefore it is possible to directly link the treated air outlet section of the integrated system to the existing ATU in order to employ the total airflow coming from the integrated system for 24 h/day, instead of only 10 h.
It is important to highlight that the volume of external air treated by the existing ATU is significantly greater than 8500 m3/h (i.e., the average airflow amount produced by the integrated system in test conditions). Thus, all the fresh and dry air from the integrated machine can be delivered to the ATU. In this case, it is also possible to determine the electric energy saving achievable by means of such a pre-treated air flow.
The EER of the existing air conditioning system was estimated to be about 3.5, in the November climate, also under the hypothesis of partial load. It is unknown if the ATU includes a heat recovery system or if post heating is performed by means of condensation heat or electric coils. We applied the same conservative assumptions made for the laundry cooling energy calculation; in other words, we postulated the existence of a heat recovery system that was able to cover the post heating. With these considerations, the daily electric energy saving rose to 510 kWh/day and total monthly saving rose to 134,346 pesos (or USD 7733).
4. Simulations
In order to verify the system’s behaviour, the study authors developed Java software which allows a real-time simulation of the integrated system, featuring custom-developed, physical-based models of the major components (i.e., heating coils, compressors, fans and pumps). In particular, a proprietary semi-empirical model was developed for heating coils, also supported by [
14].
The software integrates energy and mass equations numerically, and uses environmental conditions of temperature and relative humidity as input data. The software is a real-time simulation of the integrated system, and works by calculating the circulation of fluids in the pipeline network (mass conservation) and the power exchange (energy conservation) in the different components of the machine.
At each time-step the “actuator” components (pumps, vents, etc.) force the movement of a fraction of fluids (air, coolant, water, etc.) that enters/exits the “exchanging” components (heat exchangers). The amount of power exchanged at such a time-step is calculated and added/removed to/from the fraction of fluids involved. The process is then iterated until the machine reaches a steady-state condition (thus replicating the real system), calculating not only the final “static” result but also the transient behaviour. The software is thus well suited to correctly predicting the system’s behaviour in continuously changing conditions (i.e., in terms of temperature and humidity variations during the day). A detailed description of the simulation will be provided in another paper.
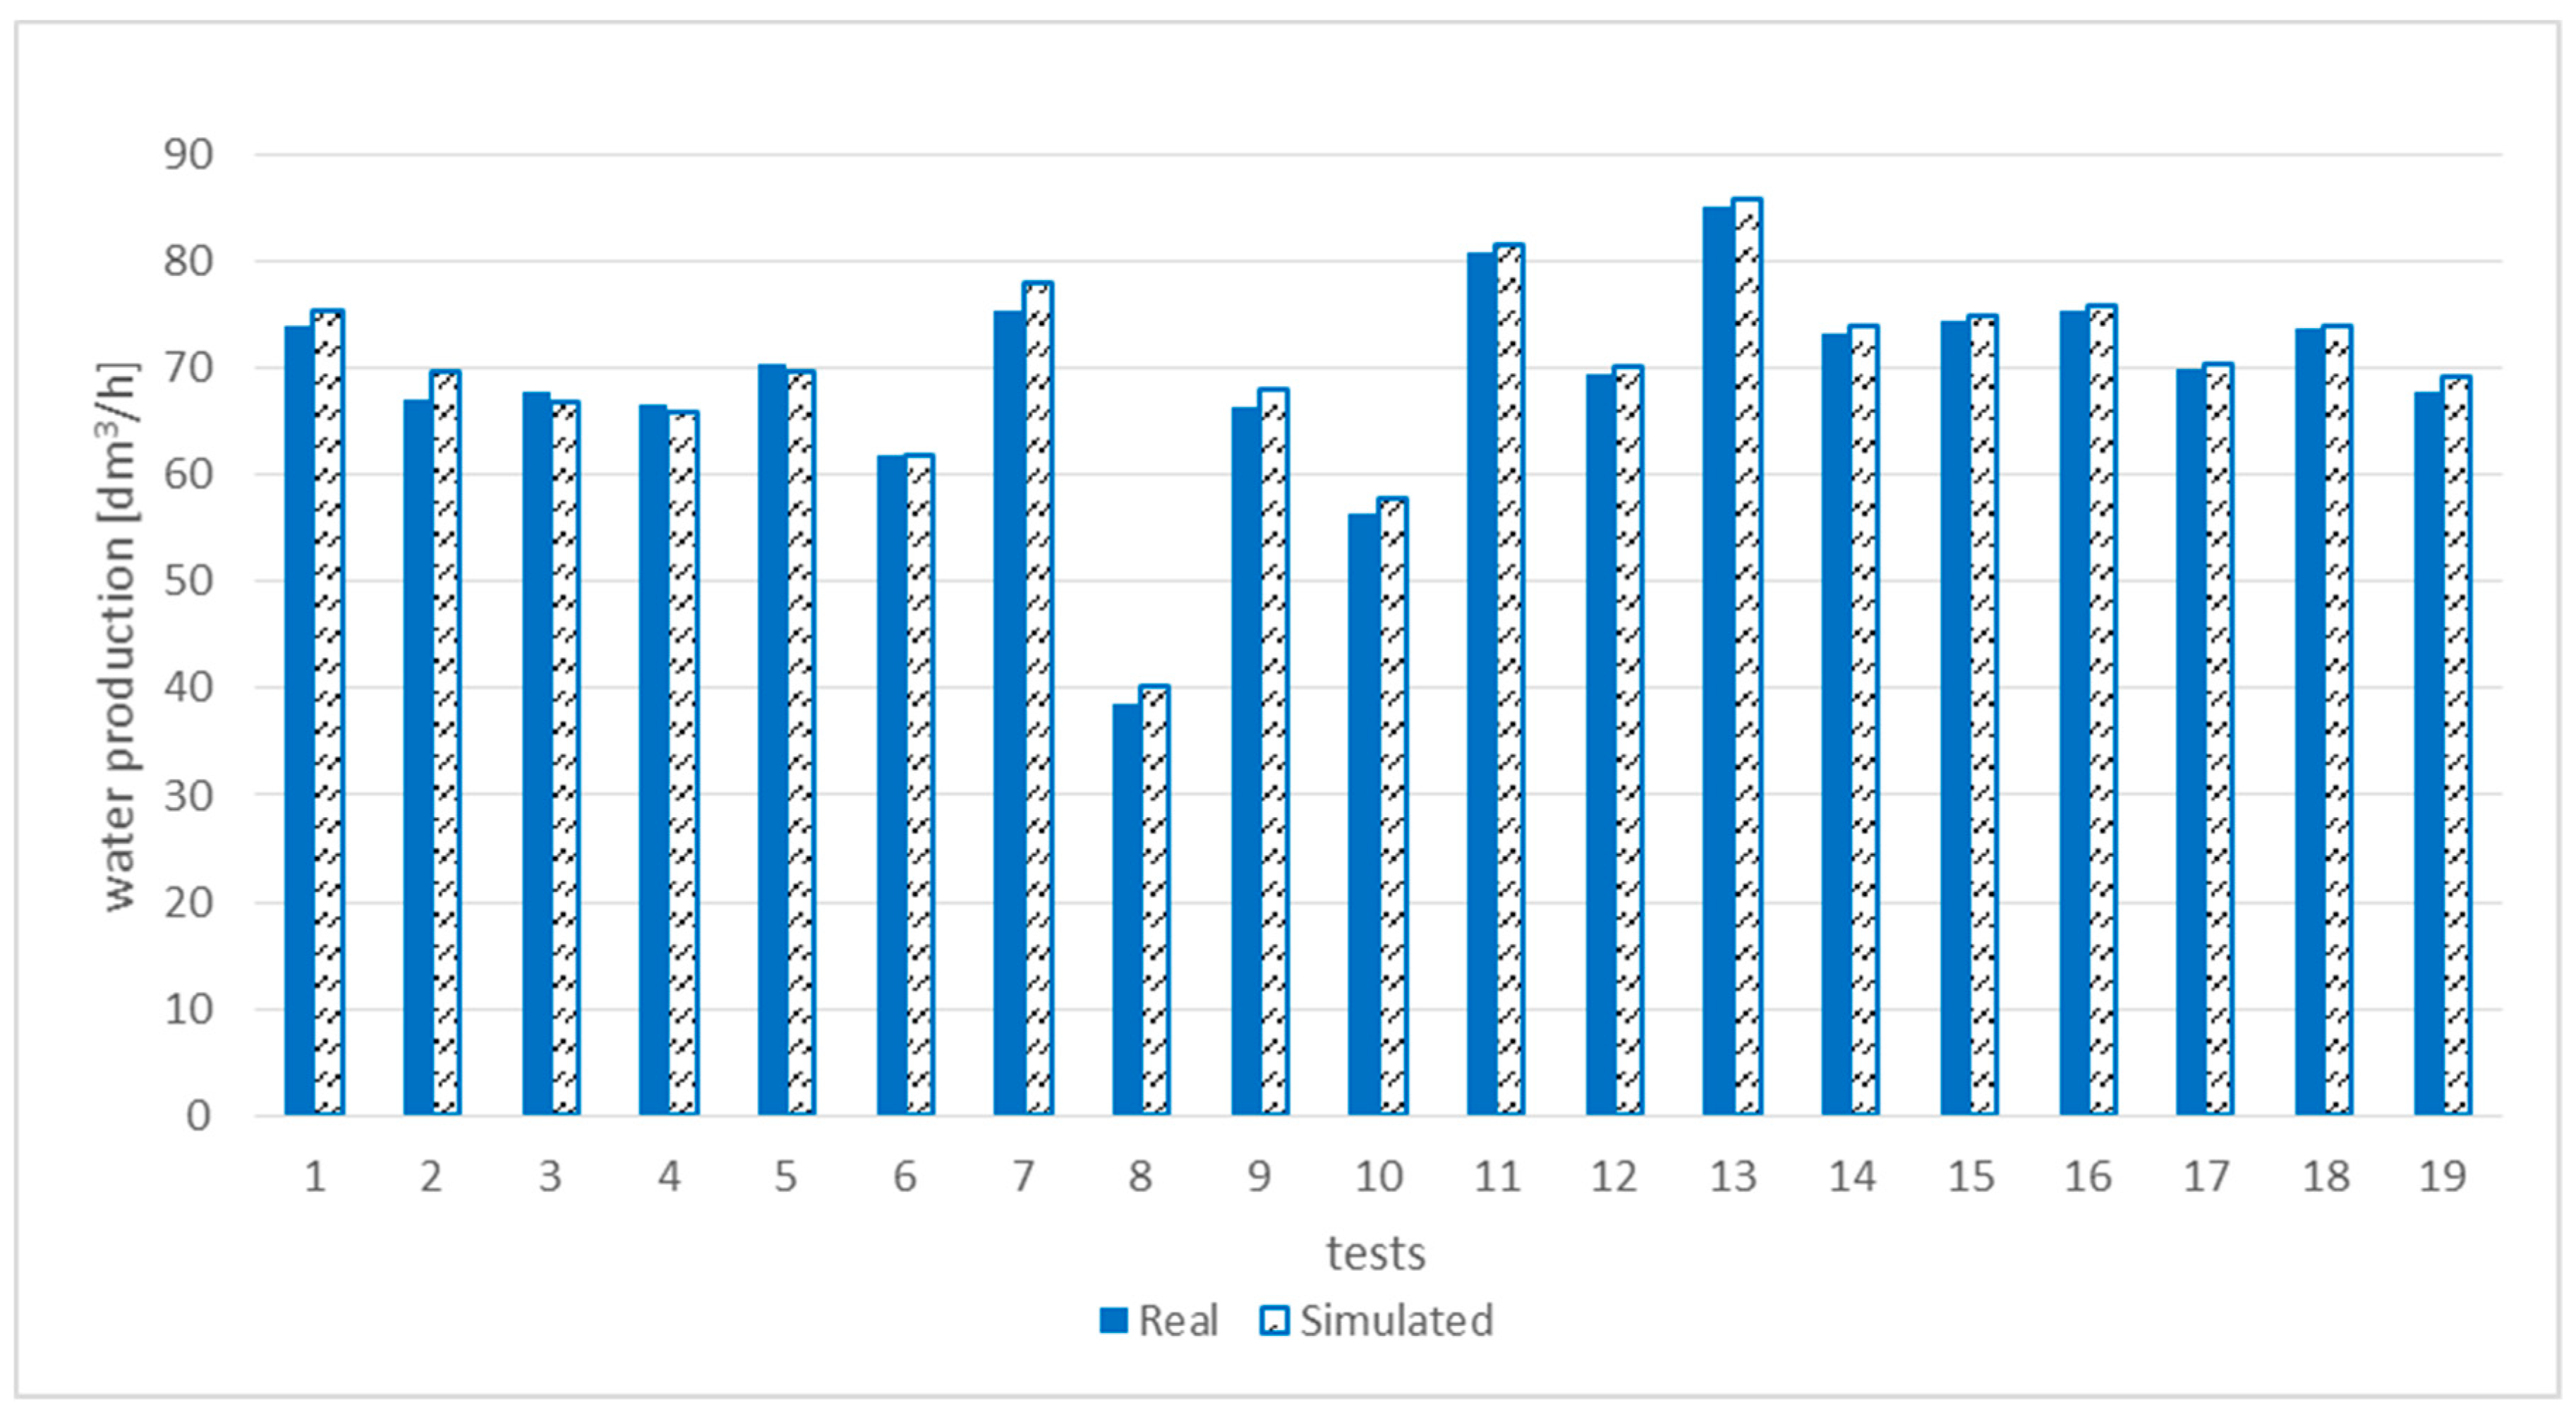
In the current work, the model was calibrated and tested based on experimental results, obtaining, for water production estimation, an average error less than 2% and maximum error less than 5% (
Figure 12).
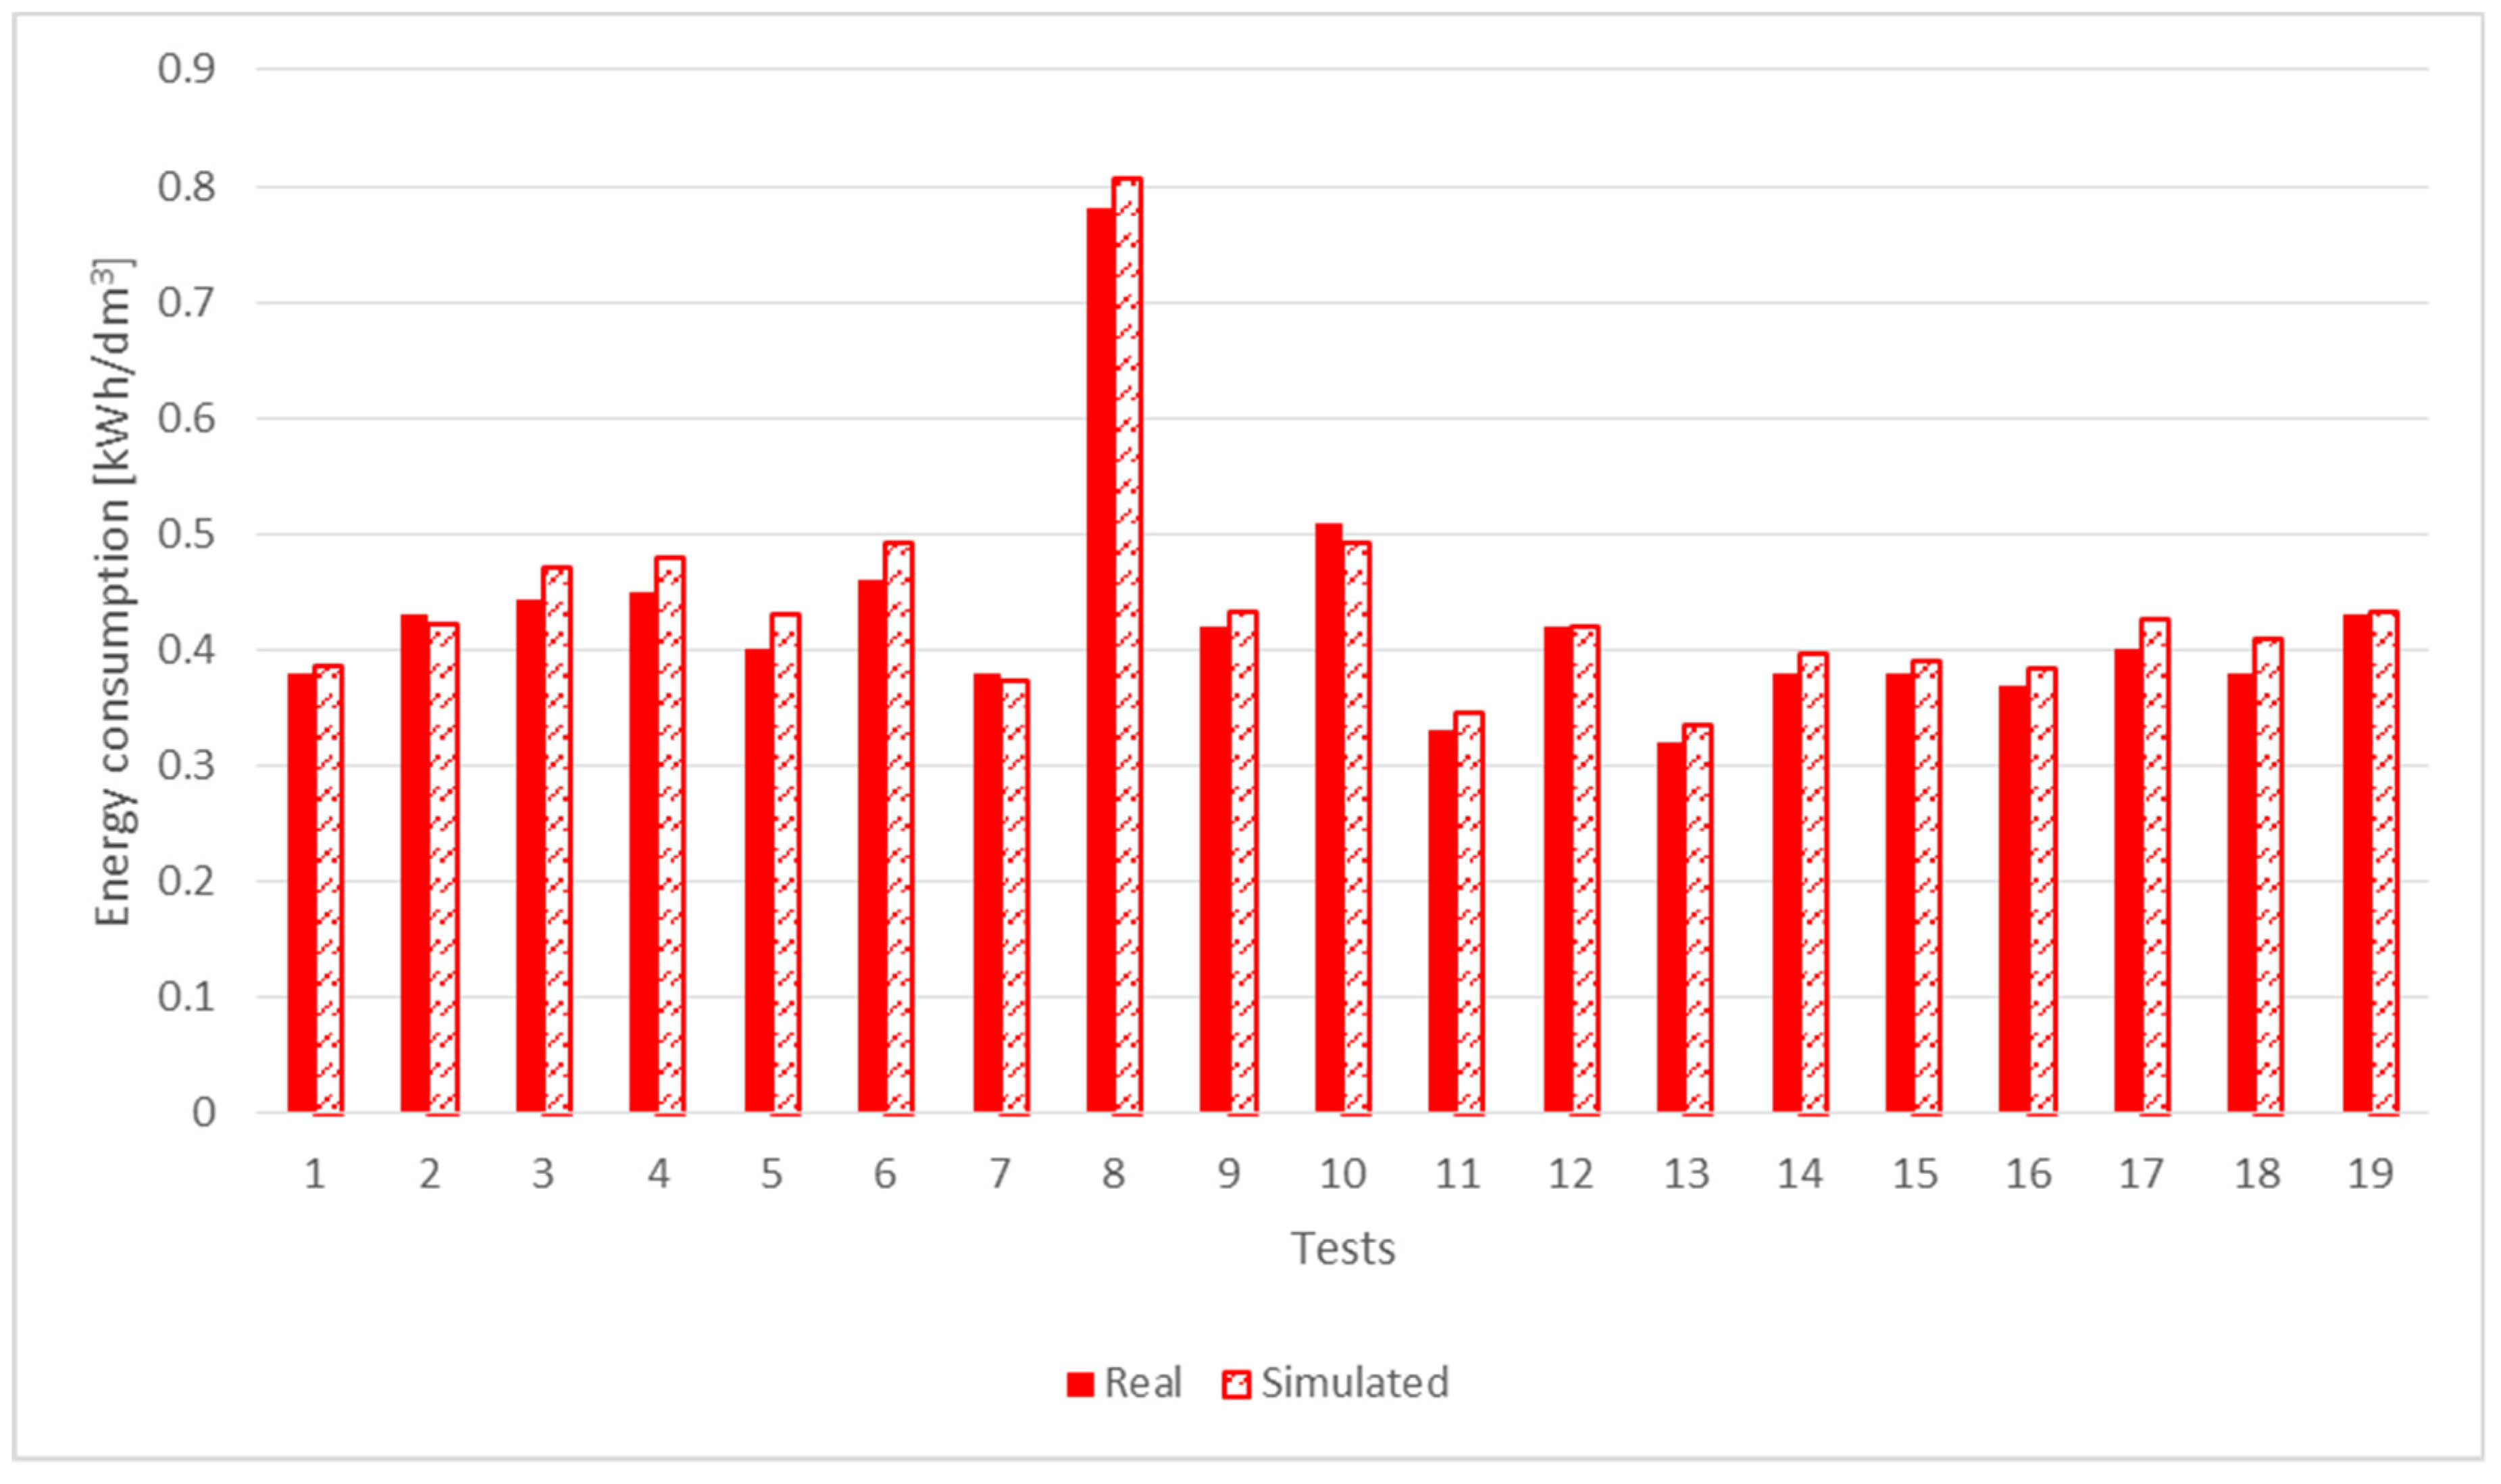
A testing campaign, using a second integrated system similar to that described above, was carried out for approximately one working month (20 days). For energy consumption, the average error was less than 5% and the maximum error was less than 8%, comparable with the accuracy of measurement instruments (
Figure 13). During the campaign, real machine behaviour was monitored by means of on-board and external instruments. An external thermohygrometer, calibrated and certified, measured temperature and humidity of environmental air, with a sampling collection frequency of 1 per s. An external precision scale measured water production, and an external energy meter measured the energy consumption of fans, with a sampling collection frequency of 1 per each 10 min or 15 min. The treated airflow quantity was measured by means of an external anemometer with an average frequency of 15 min. Moreover, by means of internal instruments, temperature and humidity of the airflow were collected in each stage of air treatment (before and after evaporation coils, and after the heat recovery coil), with a frequency of 10 min or 20 min. It also measured compressor behaviour, collecting evaporation and condensation pressures and temperatures. Energy consumption was measured by means of an on-board energy meter. Sampling collection frequency was decided on the basis of an evaluation of steadiness. In other words, if parameters where stable, frequency was lower. By means of some of the collected values, it was possible to tune each parameter of the simulator, including, for example, compressor efficiency and regulation, fan real absorption curve, coil transmittance, and enthalpy correction. Further particulars will be described in a dedicated paper.
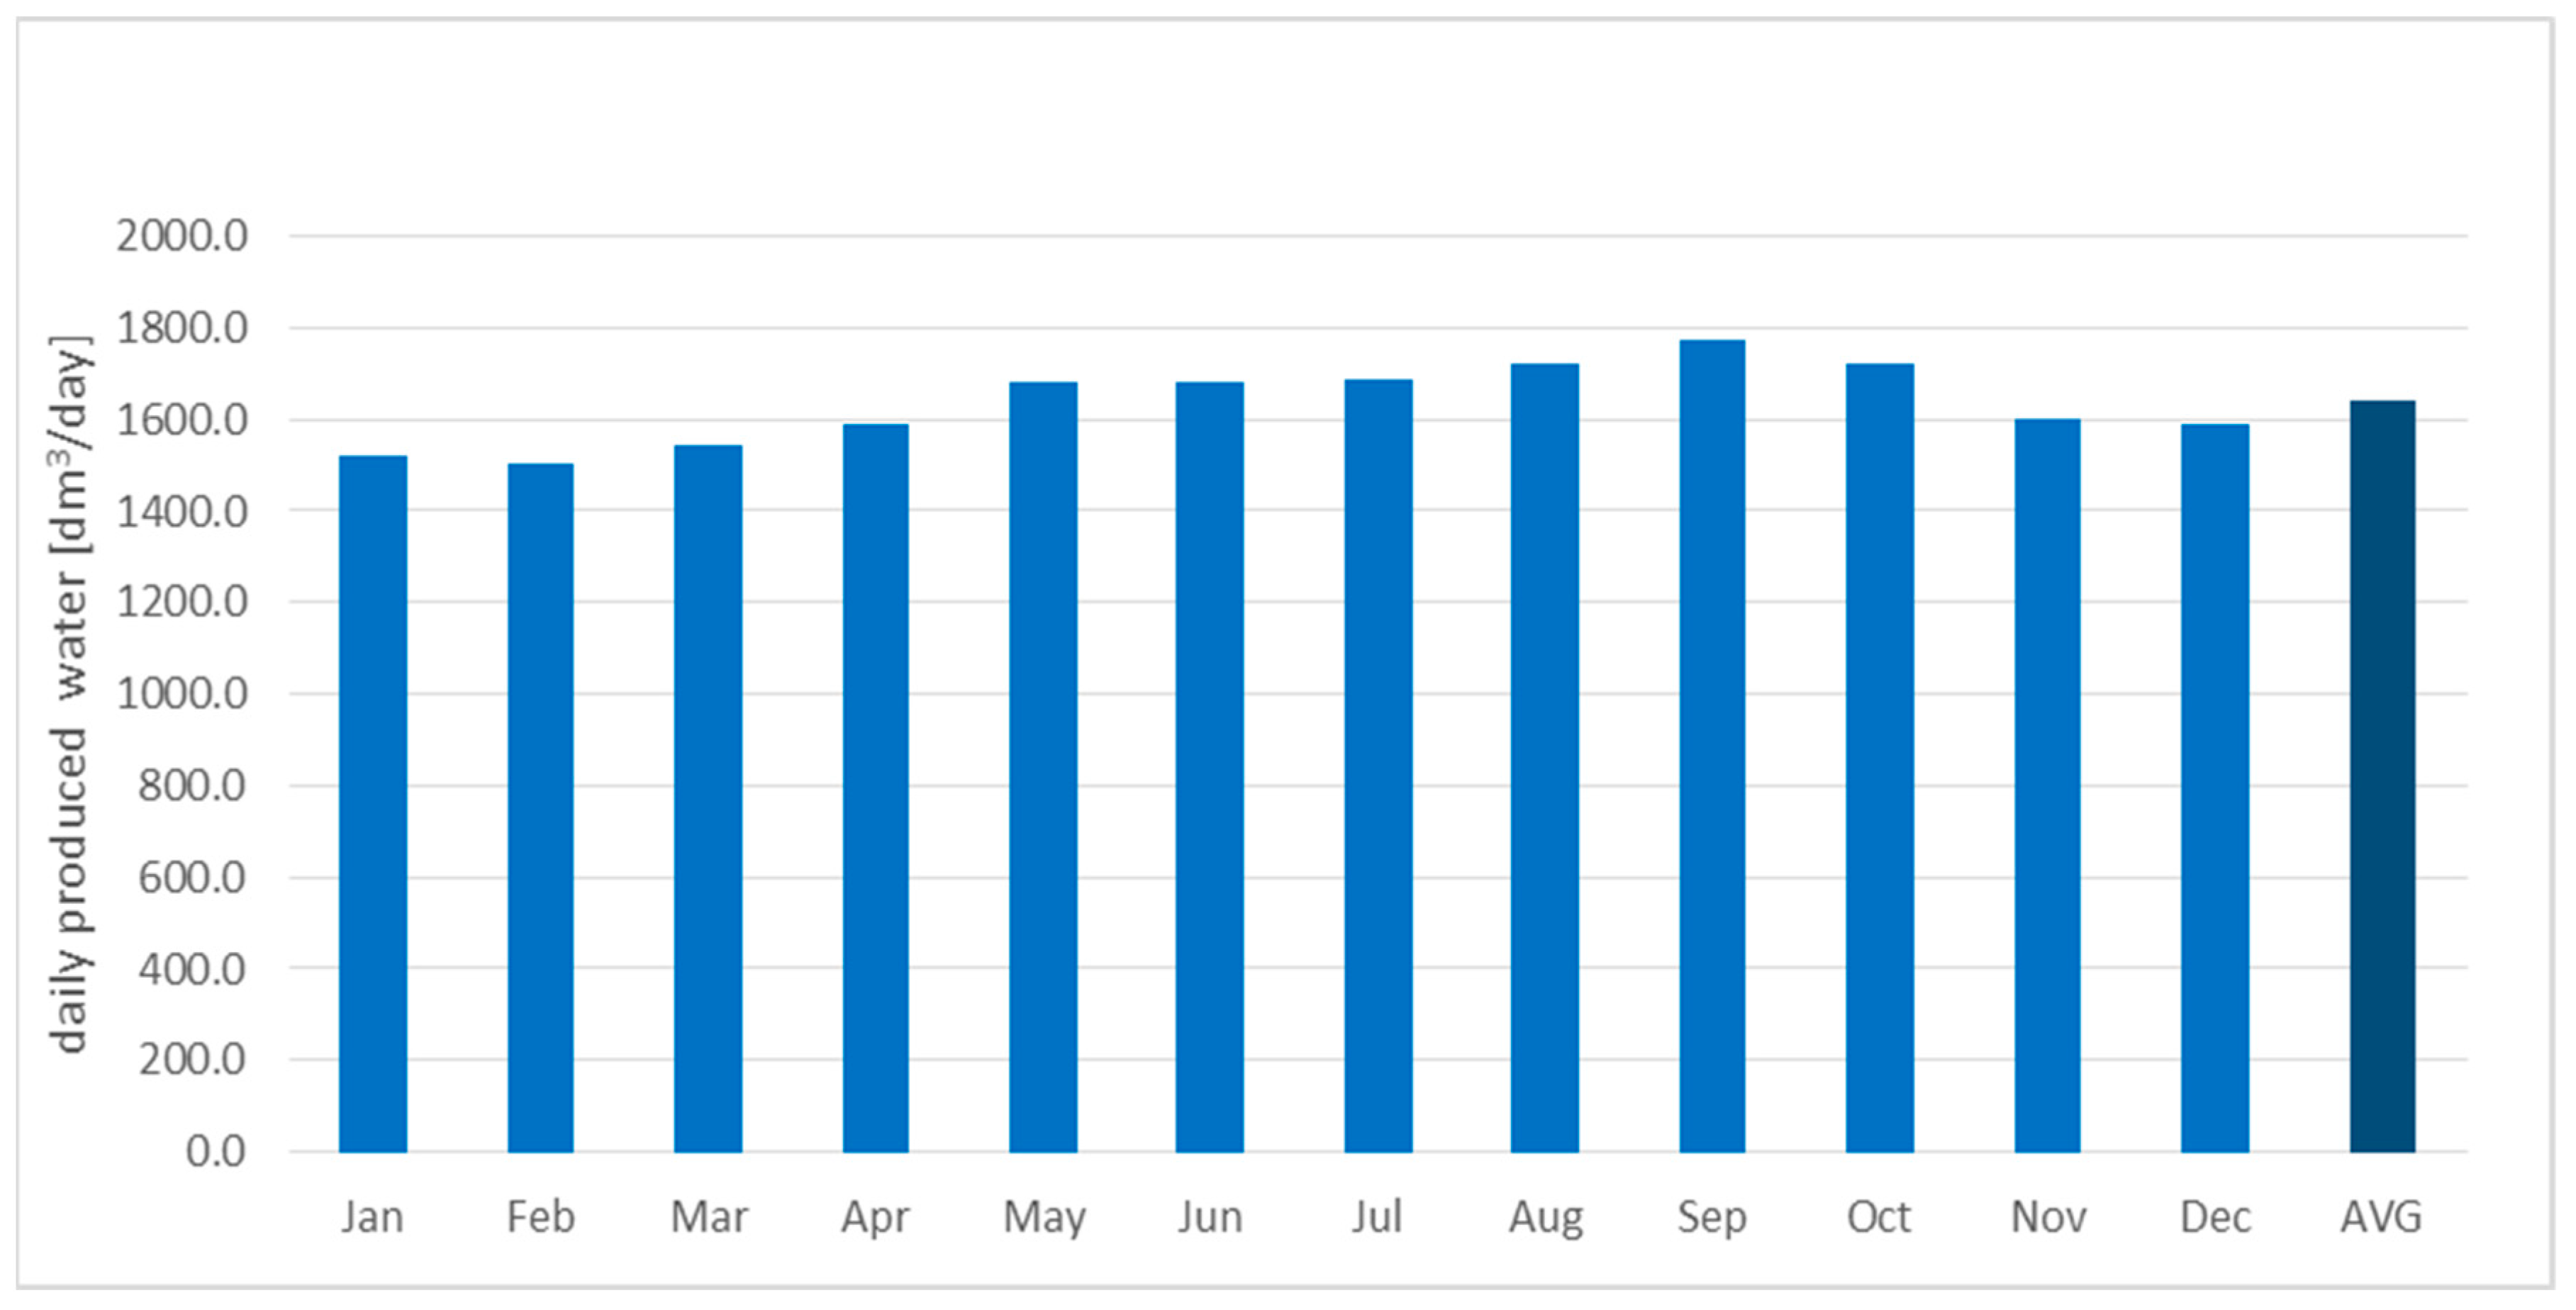
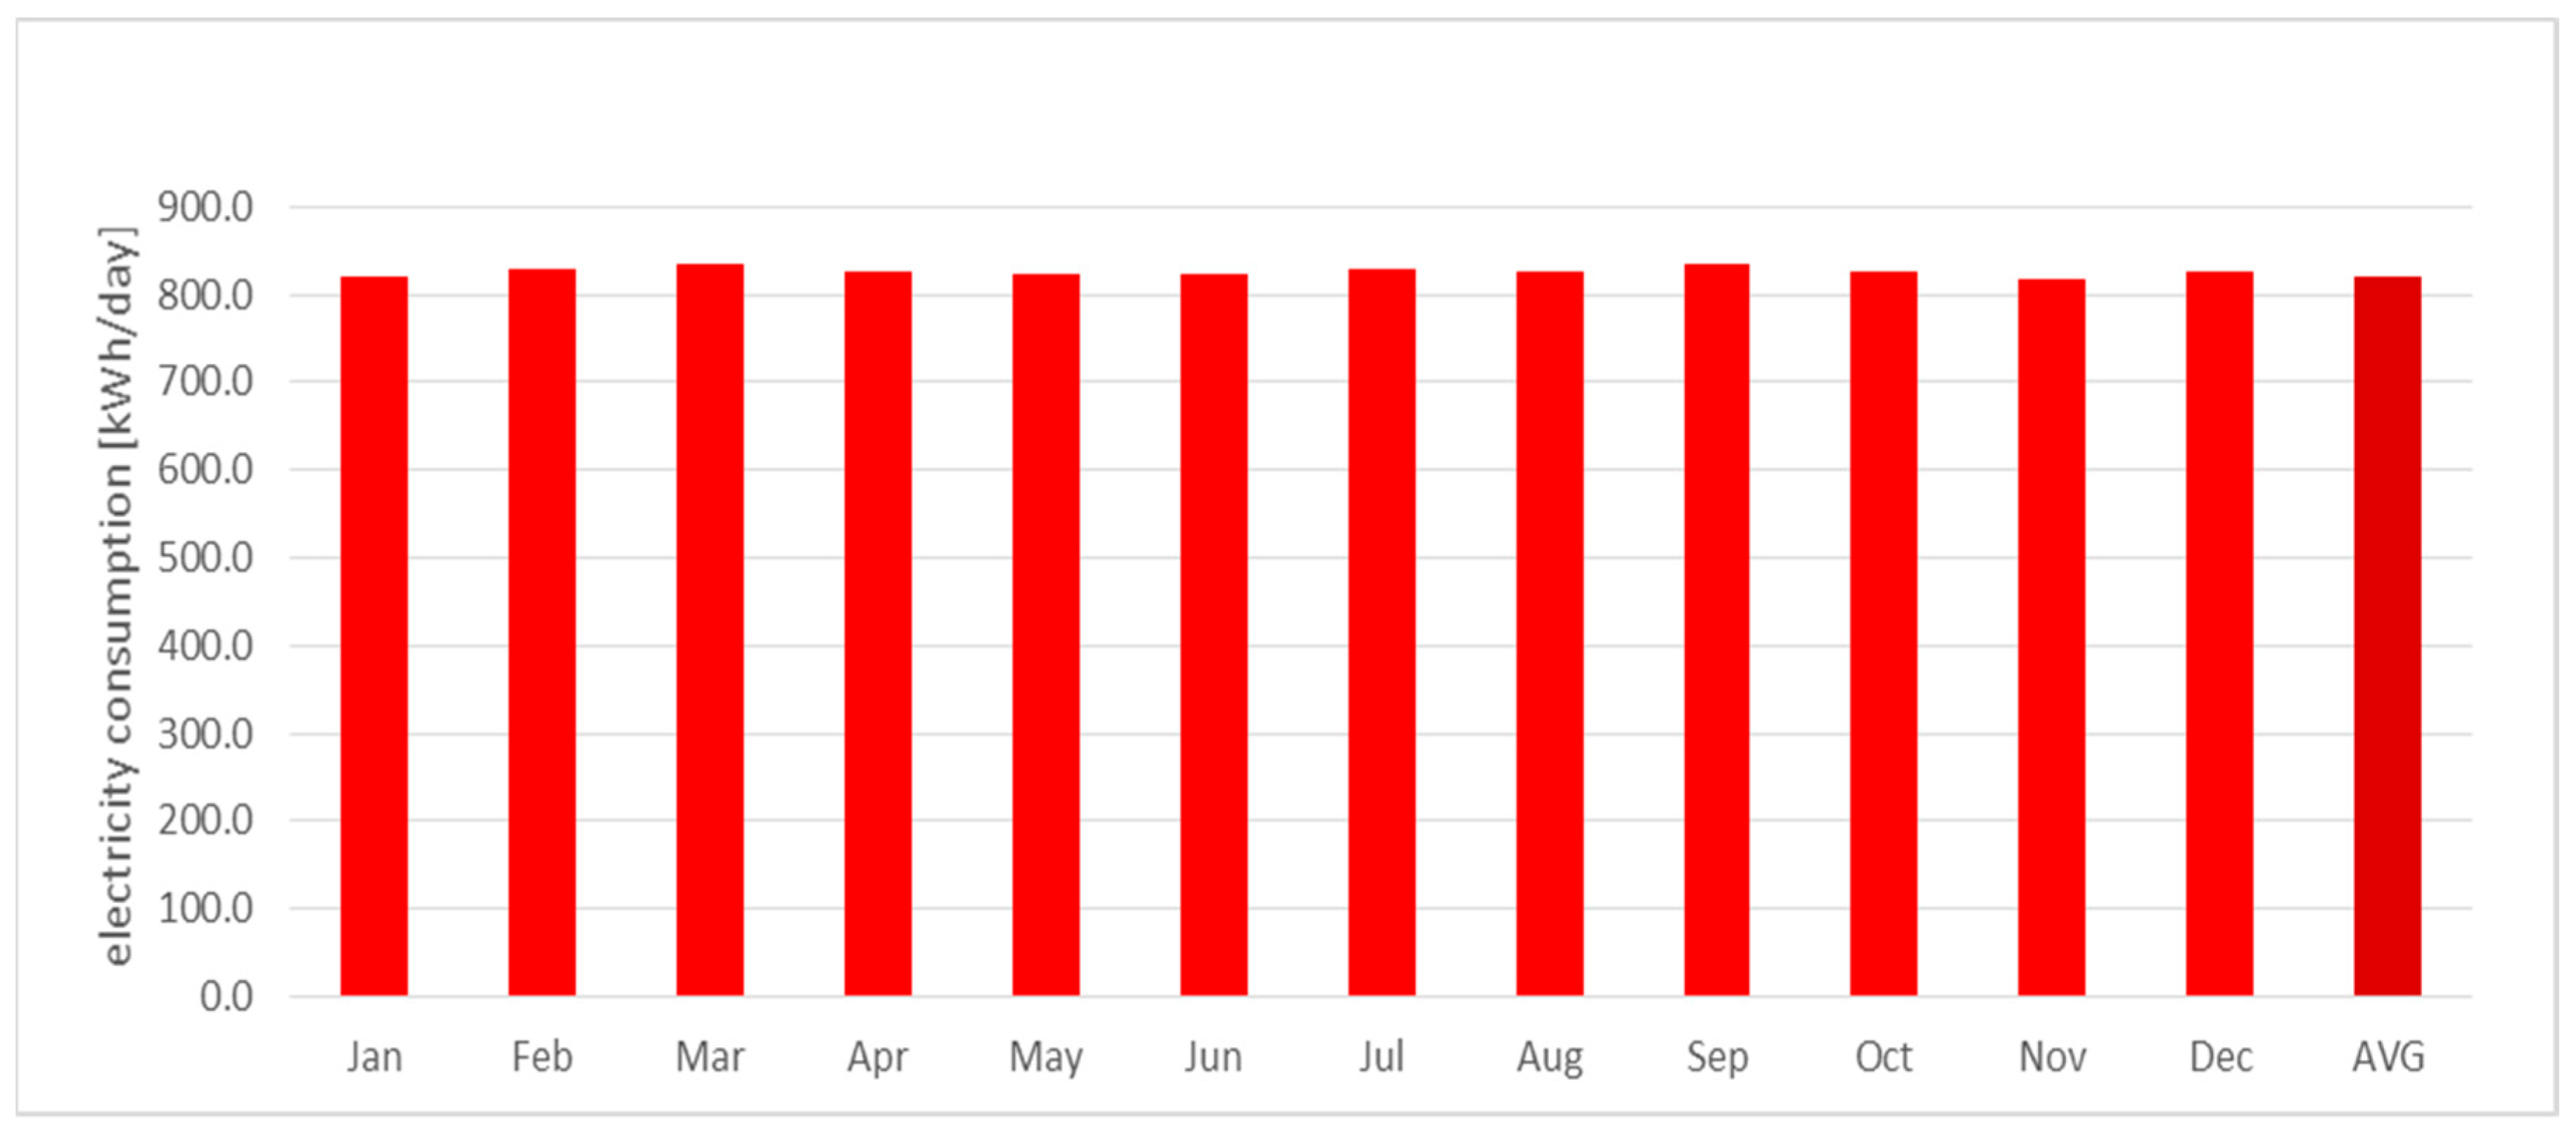
For the current work, the software was furtherly calibrated using experimental results from the integrated system that was the subject of the analysis. The tool was used to simulate the integrated system’s behaviour during the year. Thus, daily produced water was determined for the whole year and results (
Figure 14) show that, in local climate conditions, the amount of collected condensate during each day was higher than 1500 dm
3, with a corresponding electric consumption slightly higher than 800 kWh (
Figure 15).
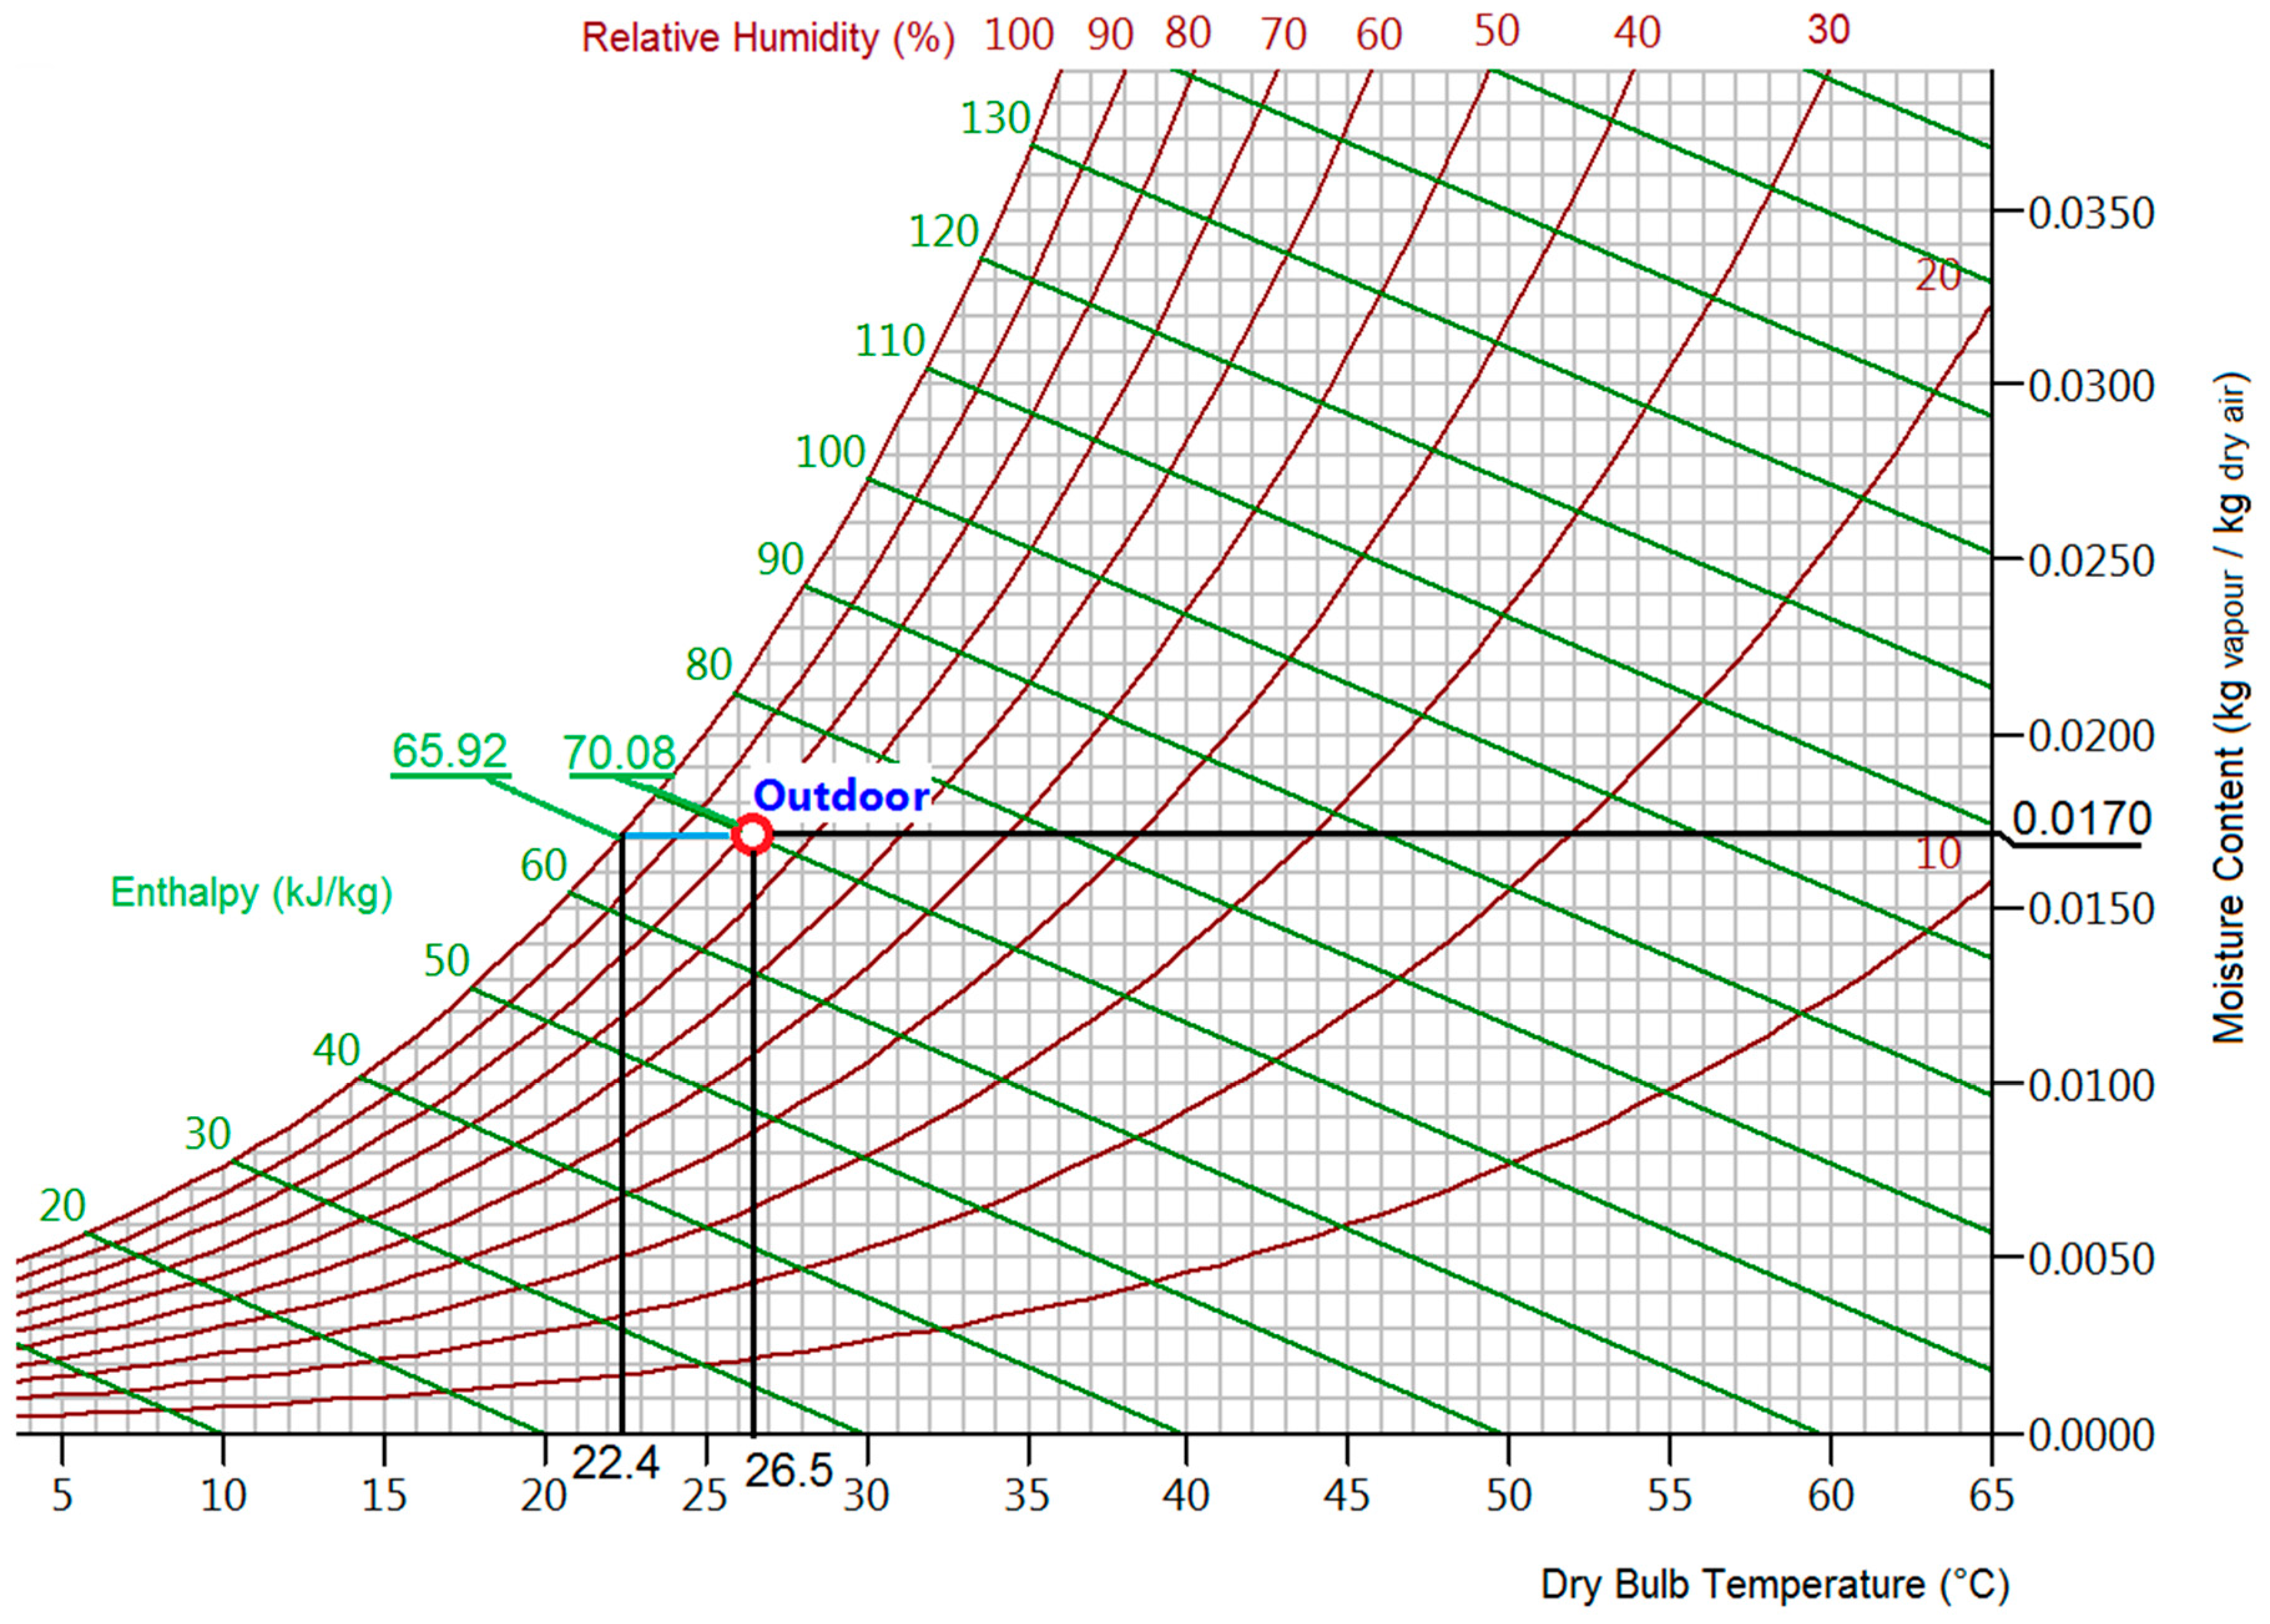
Based on average annual conditions, the mean daily water production and its costs can be calculated. The mean temperature and relative humidity values, estimated on the basis of the last five years, are respectively equal to T = 26.5 °C and RH = 78.1%. Under those conditions, it is possible to calculate the wet air main parameters (
Table 8,
Figure 16).
In these environmental conditions, the integrated system treats 9244 m3/h of air, which is emitted from the machine at Tout = 19.14 °C and RHout = 77%, producing 1642 dm3/day of water and providing 90 kW of heating power, sufficient to heat domestic water to 50 °C.
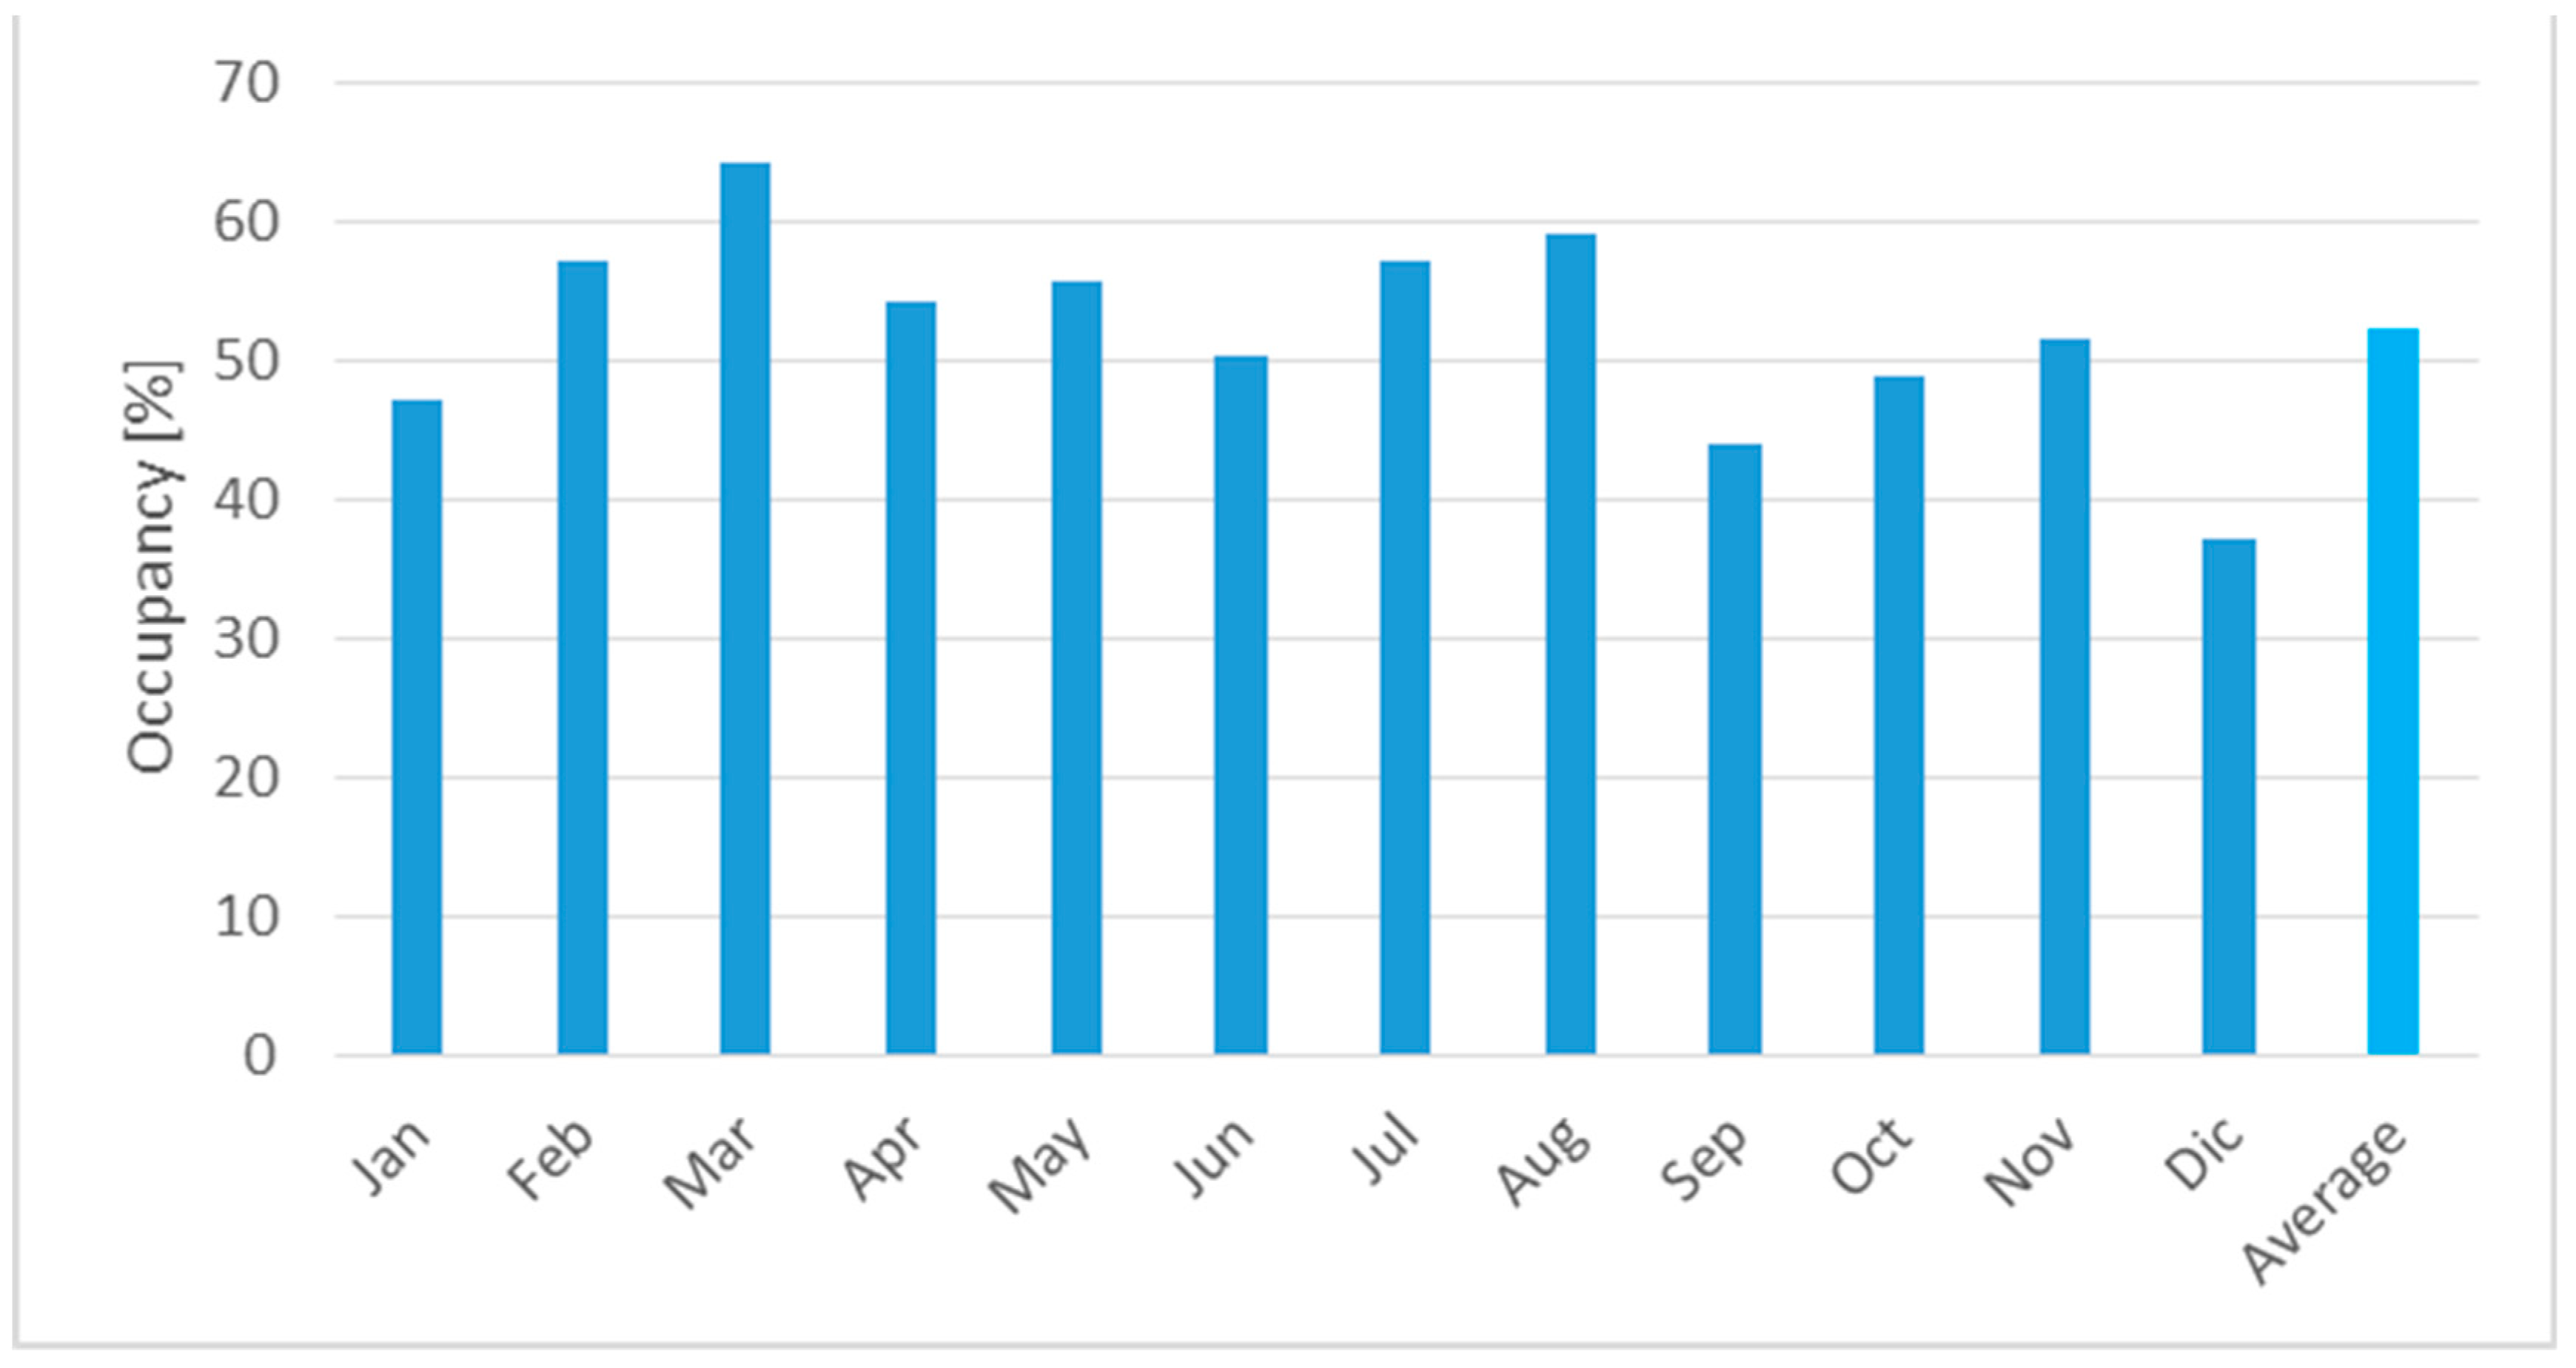
From the monthly occupancy data provided by hotel owners, as a percentage of the maximum occupancy of 308 guests average occupancy throughout the year can be calculated to be equal to 52.16% (
Figure 17).
Taking into account the averages of occupancy, temperature and relative humidity, annual savings can be calculated with the same procedure applied previously to the testing month.
Calculations, about to the annual balance, provide the total energy and economic savings obtained with the integrated system (
Table 9).
A cost of about USD 7600 can be attributed to consumables and maintenance; thus, the net saving is about USD 80,000 a year. A rough estimation of the payback time, considering costs of the integrated system’s major items purchased in Europe, associated manpower, taxes and duties, and a reasonable profit margin, provides a value of about 2–2.5 years.
5. A Methodological Approach
In order to extend results, for example to other climatic conditions or to other kinds of buildings, a method to assess the effectiveness of the integrated system is synthetized by the following steps.
Step 1—Data collection:
Type of building and its geographical site
Drinking water requirements, in terms of quantity and quality
Thermal energy requirements, in terms of domestic water heating, quantity and average heating temperature
Existing heating plant type and efficiency
Primary air needs
Existing air conditioning type and efficiency
Energy consumptions and costs related to vectors and uses
Water costs, related to water quality
Step 2—Weather environmental conditions: temperature and relative humidity of the site, preferably at hourly level.
Step 3—Integrated system behaviour analysis.
On the basis of thermo-hygrometric environmental conditions, by means of the tailored simulation software, the daily amount of condensed water produced by the machine can be estimated. Moreover, information about its energy consumption and primary air production, in terms of airflow, achieved temperature and relative humidity can be simulated. Furthermore, the heating energy and thermal power which can be employed for domestic water heating can also be determined.
Step 4—Definition of the covered needs. On the basis of the simulation results and previous data collection, a match between building needs and integrated system potentialities can be performed, in order to understand if the system is capable of fulfilling the requirements (or the percentage of demand that it can meet).
Step 5—Economic evaluation. The last step of the procedure consists of an effectiveness evaluation of the application. Monetizing all the relevant outputs, the payback time and net present value of the application can be estimated, taking into account some simple economic indexes.
6. Conclusions
In the current work, an experimental application of an integrated system has been presented. Such a system, which was housed on a hotel roof, was able to extract water from air by means of a reverse compression cycle, and, at the same time, to treat such water to a quality suitable for human consumption, to provide domestic water heating and to deliver a dry and fresh airflow. The system was connected to the existing hotel heating plant, and to the hotel’s kitchen and laundry. The test period was approximately one month. During that period, water and energy savings and other machine parameters, including chemical parameters, were monitored. At the end of the experiment, total savings for the month of November were estimated to be USD 7733. Water quality was confirmed to be in compliance with local and other international laws.
A tailored simulation software tool, calibrated on the basis of the experimental results, was also employed to determine the expected saving for a whole year of the system’s operation. On the basis of experimental and simulation results, the payback time of the complete system was estimated. Results were highly satisfactory, not only because they demonstrated that an effective employment of all effects of a reverse cycle was possible, but also from an economic point of view, with a calculated payback time of 2–2.5 years. Furthermore, a procedure aimed at determining the effectiveness of such an integrated system was also developed.


