Abstract
Cement-stabilized macadam is commonly used in pavement base courses. The disadvantage of this material is that it easily cracks because construction vehicles cause irreversible fatigue damage to the pavement. Fatigue damage is caused by an insufficient number of maintenance days and overloading by construction vehicles. In order to analyze the influence of the number of maintenance days and overloading by construction vehicles, Miner theory and ABAQUS software were used, and an unconfined compressive strength test, an indirect tensile strength test, a bending tensile strength test, and a fatigue test were carried out simultaneously. The relationship between compressive strength and the splitting strength of water-stabilized macadam as well as compactness, water content, and temperature at different ages were determined. Fitting shows that the bottom tensile stress of the most disadvantageous layer increased with increasing subbase modulus, and its reduction rate increased slowly with the increasing of cement-stabilized macadam subbase thickness. The fatigue prediction equation for cement-stabilized macadam was obtained using bending tensile strength and fatigue tests. Subbase fatigue damage caused by different construction loads under different working conditions was calculated using Miner theory according to actual engineering data. Therefore, the number of pavement maintenance days should be increased. For harsh natural environments and strict time constraints, the design should increase the strength and thickness of the subbase material. When laying the base, overloaded vehicles should be limited, and the construction period of the loaded vehicles should be reduced to minimize road damage.
1. Introduction
The vehicle load-bearing system on road surfaces is the complete pavement structure. During construction, vehicle loads can only be borne by completed sections of pavement. In practical engineering, a cement-stabilized base is constructed after 7–14 days of curing. At this time, the strength of the base has not reached the designed value, and there may be a serious overload phenomenon from transport vehicles during road construction, which can easily produce microcracks in the base and affect the life of the road [1]. Loading the cement-stabilized base during road construction plays an important role in determining the durability of the cement-stabilized base.
At present, the composite pavement structure of asphalt pavement and semirigid base is used in many countries around the world [2,3,4]. Numerous previous works focused on how to reduce and control semirigid cracks [5]. Some scholars have reduced cracks by improving the performance of base materials. For example, a British scholar suggested that the main aggregate of the mixture was 40–80 mm coarse gravel, and the caulking material was continuously graded [6]. Lim Seungwook [7] proposed a prediction equation for compressive strength and a resilient modulus with an increasing number of curing days. Fan [8] thought temperature had a significant influence on the strength of the cement-stabilized base. Wang Yan [9] determined the splitting fatigue of cement-stabilized macadam mixtures with different cement amounts according to the force state of cement-stabilized macadam base under the vehicle load. Other scholars have reduced cracks by strictly standardizing construction technology [10]. For example, K.P. George [11] recommended strict control of water content and increased compaction to reduce base cracking. Zhou Huiyong [12] pointed out that when the cement-stabilized base course was constructed, the water content should be well-controlled. Wang Mingxia [13] also proposed fine management to reduce cracks.
Most scholars have primarily focused on the selection of mixtures, mix design, and antireflective cracks [14]. Only a few scholars have considered the fatigue life of roads from the aspect of structural damage delivered in the construction stage. For example, Professor Finn Thegersen [15] used a semilogarithmic prediction curve to regress and predict the resilient modulus of a base course. Professor Judycki [16] estimated the fatigue performance of cement-stabilized materials by using cylinder time. Cao Qiang [17], a Chinese scholar, determined the service life of a pavement structure would be lost if the overload was serious during the construction period. Professor Zhang Lihong [18] analyzed the cracking mechanism in cement-stabilized macadam base courses and determined that damage to the initial structural layer during construction was far greater than the damage inflicted after reaching the design strength.
At present, early fatigue damage to pavement structures caused by construction vehicles is not considered in fatigue damage analysis [19,20,21], and the fatigue damage of pavement structures caused by water-stabilized base at different curing ages and construction loads is seldom analyzed [22,23,24]. The major contributions of this article are summarized as follows: (1) Factors affecting the strength of cement-stabilized base courses were examined, and the growth rule of initial strength under different factors was obtained; (2) vehicle loads in common use during construction were investigated, and the maximum bottom tensile stress under different loads, modulus, and thickness of cement-stabilized base courses was analyzed; (3) the cement-stabilized base course was calculated by ABAQUS software, and construction stress distribution and fatigue tests were used to determine the fatigue prediction equation for cement-stabilized macadam; and (4) the pavement working condition model for different construction periods was established, and the fatigue life damage calculation method for cement-stabilized base under construction loading was proposed.
2. Strength Variation of Cement-Stabilized Base Courses
The base strength of pavement has a direct impact on the life of the road. Due to the interference of external factors, the actual strength of the base is commonly lower than the design strength. This phenomenon is called the base strength variability. The strength of cement-stabilized macadam base mainly comes from the mechanical strength and hydration strength. Mechanical strength is related to the gradation and compactness of the granular materials, and the mechanical strength is higher if the granular materials are more abundant and compacted. Hydration strength is related to moisture content, and the hydration reaction needs sufficient moisture to proceed smoothly. In addition, temperature directly affects the cement hydration reaction. At the same age, the higher the temperature, the higher the cement-stabilized mixture strength. When temperature is very low, the hydration of cement will stop. Therefore, through unconfined compressive testing and indirect tensile strength testing, this paper examines the variation law for base strength difference under varying degrees of compaction, water content, and temperature, and also examines the correlation between influencing factors and strength difference by using grey relational degree theory.
2.1. Testing Procedure
2.1.1. Compactness Test Procedure
In order to study the effect of compaction degree on the base course strength, four specimens were created using the static pressing method. The compaction degree of the four specimens was 96%, 98%, 100%, and 102%. Specimens were cured for 7 days and 28 days under standard curing conditions. Next, specimens were divided into eight groups for testing. In order to reduce test error, each trial was repeated 6 times. Specimens were immersed in water for 24 h the day before testing, then unconfined compressive strength and indirect tensile strength tests were carried out according to “Quality Inspection and Evaluation Standards for Highway Engineering” [25].
2.1.2. Water Content Test Procedure
The optimum moisture content of cement-stabilized macadam was 6.9% from laboratory tests. Therefore, four kinds of samples with different moisture content were created and tested. The moisture content of the four samples was 4.9%, 5.9%, 6.9%, and 7.9%. We added 0.5% water to counteract the moisture loss from mixing, manufacturing, and molding. Specimens were cured for 7 days and 28 days under standard curing conditions. Then specimens were divided into eight groups for testing. In order to reduce test error, each trial was repeated 6 times. Specimens were immersed in water for 24 h the day before testing, then unconfined compressive strength tests were carried out according to “Quality Inspection and Evaluation Standards for Highway Engineering”.
2.1.3. Temperature Test Procedure
In order to study the effect of temperature on base course strength, five kinds of water-stable mixtures were designed. Curing temperatures of 10 °C, 15 °C, 20 °C, 25 °C, and 30 °C, as well as a humidity of 95%, were used. Mixtures were cured for 7 days and 28 days under standard curing conditions, then were divided into ten groups for testing. In order to reduce test error, each trial was repeated 6 times. Specimens were immersed in water for 24 h the day before testing, and then unconfined compressive strength and indirect tensile strength tests were carried out according to “Quality Inspection and Evaluation Standards for Highway Engineering”.
2.2. Results
2.2.1. Compactness
Figure 1 shows the compressive strength of cement-stabilized macadam specimens with different compaction for different curing durations. The compressive strength of the base increased linearly with increasing compactness (Figure 1). When the curing time was 7 days, the compactness increased by 2% and the compressive strength increased by 0.4662 MPa on average. When the curing time was 28 days, the compactness increased by 2% and the compressive strength increased by 0.3324 MPa on average. The influence on strength was gradually reduced, and the relationship between compressive strength and compactness at different ages was linear, such as in Equations (1) and (2):
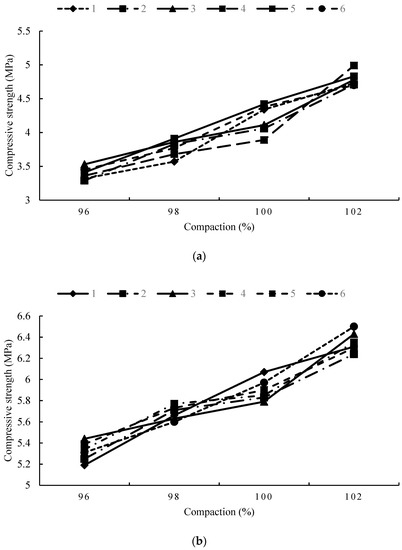
Figure 1.
Compressive strength under different test procedures: (a) The relationship between compaction and compressive strength after 7 days of curing; (b) the relationship between compaction and compressive strength after 28 days of curing.
In the equation, is compressive strength in MPa and K is the degree of compaction %.
Figure 2 shows the splitting strength of cement-stabilized macadam specimens with different compaction after different curing times. Splitting strength linearly decreased with decreasing compactness for specimens cured for 7 days (Figure 2). Average splitting strength decreased by 0.0266 MPa for every 2% reduction in compactness, and the variation of splitting strength with compactness for 28 days was slightly different. Splitting strength decreased by 0.02 MPa, 0.04 MPa, and 0.07 MPa when compactness decreased from 102% to 100%, 98%, and 96%, respectively, as the decreasing rate accelerated. This phenomenon occurred because the gap in the material increased with decreasing compaction degree. The interior of the material increased in weak points, thereby reducing the cohesive force and friction between particles. This kind of defect is more and more obvious with increasing age, so the base compaction must meet the requirements of the technical specification for highway road base construction.
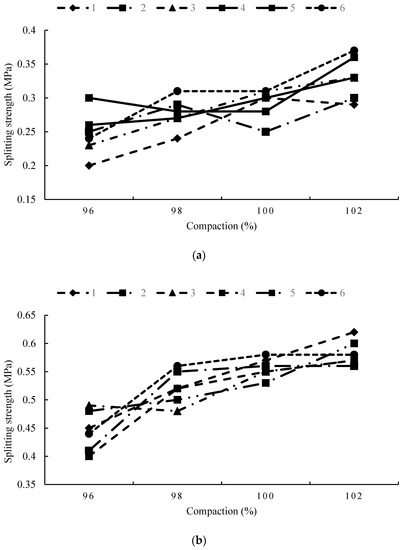
Figure 2.
Splitting strength under different test procedures: (a) Relationship between compaction and splitting strength after 7 days of curing; (b) relationship between compaction and splitting strength after 28 days of curing.
2.2.2. Water Content
Figure 3 shows the compressive strength of cement-stabilized macadam specimens with different moisture contents after different curing times. When water content was lower than the optimum water content, compressive strength increased with increasing water content (Figure 3). When water content exceeded the optimum water content, compressive strength did not increase or decrease.
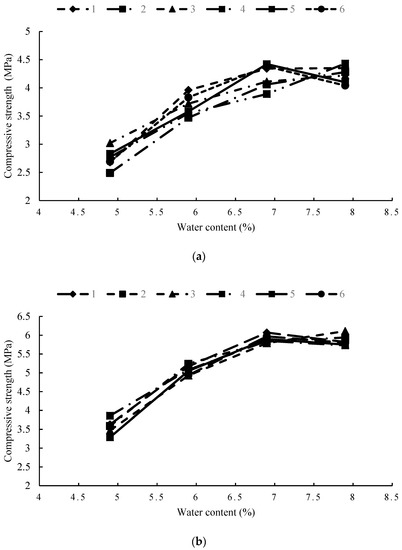
Figure 3.
Compressive strength under different test procedures: (a) Relationship between water content and compressive strength after 7 days of curing; (b) relationship between water content and compressive strength after 28 days of curing.
When water content was lower than the optimum water content, compressive strength decreased at an increasing rate. When water content decreased by 1%, the compressive strength decreased by 0.51 MPa and 0.83 MPa for 7 days and 28 days, respectively. When water content decreased by 2%, the compressive strength decreased by 1.45 MPa and 2.33 MPa for 7 days and 28 days, respectively. The appearance of the specimens did not differ from normal conditions. However, the inner portion of the specimens was dry and loose after testing. This is because the water content of the specimens was insufficient, and the cement could not be completely saturated. The cement could not play a role in the stability of the mixture, affecting the formation strength.
2.2.3. Temperature
Figure 4 shows the compressive strength of cement-stabilized macadam specimens at different temperatures and after different curing times. The compressive strength of the base increased linearly with increasing temperature (Figure 4). When the curing time was 7 days, the compressive strength of the base increased by 0.4 MPa on average, with an increase in temperature of 5 °C. When the curing time was 28 days, the compressive strength of the base increased by 0.5 MPa on average, with an increase in temperature of 5 °C. This relationship followed a linear pattern, such as in Equations (3) and (4):
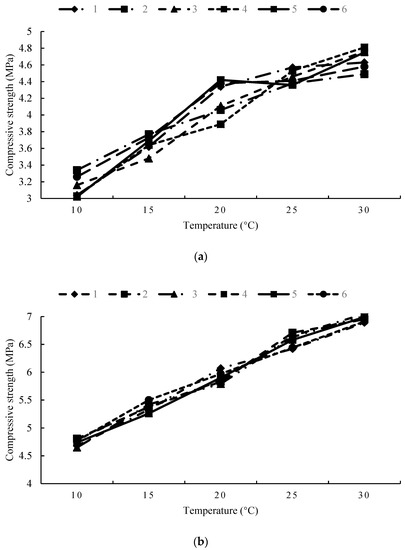
Figure 4.
Compressive strength under different test procedures: (a) Relationship between temperature and compressive strength after 7 days of curing; (b) relationship between temperature and compressive strength after 28 days of curing.
In the equation, is compressive strength in MPa and T is temperature in °C.
Figure 5 shows the splitting strength of cement-stabilized macadam specimens at different temperatures after different curing times. The splitting strength of the base increased linearly with increasing temperature. The compressive strength of the base increased by 0.03 MPa on average, with an increase in temperature of 5 °C at different curing times. The relationship between splitting strength and temperature at different ages was linear, such as in Equations (5) and (6):
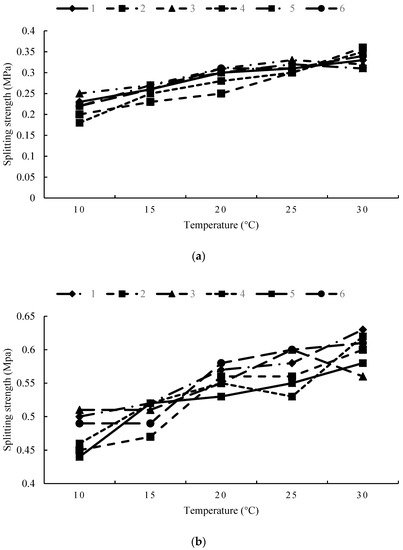
Figure 5.
Splitting strength under different test procedures: (a) Relationship between temperature and splitting strength after 7 days of curing; (b) relationship between temperature and splitting strength after 28 days of curing.
In the equation, is splitting strength in MPa and T is temperature in °C.
2.3. Correlation and Sensitivity Analysis of Influencing Factors on Strength Variability of Cement-Stabilized Macadam
During the actual construction process, because of differences in construction conditions and equipment, the strength of the base changes easily with depth [26]. Grey relational degree theory, as a multifactor relational degree analysis method, has a unique advantage in analyzing primary and secondary relationships between factors [27]. In order to determine the degree of influence of compaction, water content, and temperature on the base strength, grey relational degree theory was used to analyze the primary and secondary relationships of the three factors.
2.3.1. Selection of Reference Sequence and Contrast Sequence Indexes
The unconfined compressive strength of the 7 days cured specimens under different variation factors was taken as the reference sequence index for the grey relational analysis model, which was recorded as
. Compactness, water content, and temperature were selected as the comparison sequence index and recorded as , , and , respectively.
2.3.2. Model Establishment
In the process of grey relational analysis, the relation between the reference sequence and contrast sequence should be established. That is, the grey relational analysis model should be established. Assuming , the variable is associated with according to the mapping f, where is the corresponding reference sequence index and is the contrast sequence index. The grey model was established and the grey relational analysis test (Table 1) was obtained when the influencing factors of base strength difference were analyzed.

Table 1.
Raw data for reference and contrast sequences.
2.3.3. Correlation Analysis of Influencing Factors
The data in Table 1 were processed following the steps of initialization, proximity calculation, correlation coefficient calculation, and correlation degree calculation. Correlation degree calculation results were γ1 = 0.703, γ2 = 0.677, and γ3 = 0.640. The correlation degree of each influencing factor was above 0.6, which indicated that the correlation between the variability of each factor and the strength variability was better. The degree of influence of each factor was compactness > water content > temperature.
2.3.4. Sensitivity Analysis
According to the test results, although the correlation between compactness, water content, temperature, and 7d compressive strength was better, their sensitivity was different. Therefore, the sensitivity of these three factors compared to 7d compressive strength was analyzed.
According to the mathematical definition, the function can be derived, and the first-order sensitivity is expressed as follows:
In the equation, is the ith 7d compressive strength of the jth factor, and is the jth factor.
The sensitivity factor of each factor is calculated according to Equation (7) (Table 2).
Table 2.
Sensitivity factors for various factors.
According to the above calculation results, the sensitivity of the three factors was ranked water content > compactness > temperature. Water content was more distinguishable from the 7d compressive strength, and the temperature distinguishable was the smallest. Because the water content and the compressive strength curve had an inflection point, there was an optimum water content of 6.9%. Water content sensitivity was significantly reduced when the water content was greater than 6.9%.
In short, during the construction process, compaction, moisture content, and temperature directly affected the actual strength of the road base and reduced the overall performance of the base. When studying pavement fatigue damage during construction, these factors should be strictly controlled. Then the pavement structure fatigue damage caused by construction loading should be examined.
3. Stress Analysis of the Most Unfavorable Layer of Cement-Stabilized Base during Construction
The China Pavement Structural Design Code stipulates that the starting time of a road’s service life is from the normal opening of the road, which does account for the impact of vehicle loads during road construction. The design axial load is 100 kN for the single-axle double-wheel group, but during construction, the load on the base is much higher than the design value due to the presence of construction equipment [28]. In this paper, the maximum bottom tensile stress for a combination of different structural parameters under different construction loads is analyzed, and the variation law of the mechanical index of a cement-stabilized macadam structure layer is obtained.
3.1. Vehicle Load Analysis during Raod Construction
The pavement structure of the 203 Highway in the Inner Mongolia Autonomous Region of China is 4 cm AC-13 fine-grained asphalt concrete (upper pavement layer) + 6 cm AC-20 medium-grained asphalt concrete (lower pavement layer) + 18 cm 5% cement-stabilized macadam (base) + 32 cm 4.5% cement-stabilized macadam (subbase). The design speed is 80 km/h, and the width of integral subgrade is 26.5 m. The width of the subgrade is divided into (0.75 m on the left shoulder + 2.5 m on the left shoulder + 2.75 m on the left shoulder + 2 × 3.75 m on the lane + 0.5 m on the left edge) × 2 + 4.0 m on the central dividing bandwidth, and the length of the road is 30 km.
An investigation of vehicle loading during the construction period showed that the minimum axle load is 100 kN, the maximum axle load is 235 kN, and the axle load mainly concentrates between 120 kN and 180 kN, far exceeding the standard axle load in the design code [29]. In order to analyze the influence of heavy haul trucks on early road construction, the following empirical relationship between Belgian grounding area and axle load is adopted:
In the equation, is the area of a single wheel tire in cm2, is the load of a single wheel tire N, and means the margin of guarantee reaches 90%.
The calculated ground area of vehicles under different axle loads is shown in Table 3.
Table 3.
Vehicle axle load calculations.
In order to analyze the damage caused by different axle loads to the road surface, this paper assumes that the same axle load has the same load. According to the length and structure of the road section, the total mass of the mixture needed for paving the road section was calculated. The load of different axle loads was different, and the total mass divided by the load could get the number of vehicles for different axle loads. The calculation results are shown in Table 4, the frequency of loading trucks. The closer to the mixing station, the more times the mixing station was subjected to the full load (Figure 6).
Table 4.
Frequency of loading trucks.
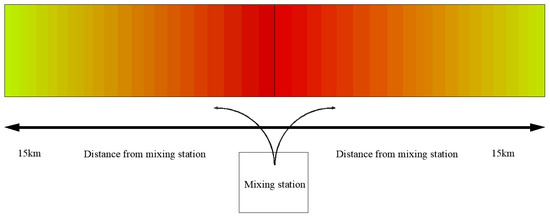
Figure 6.
Distribution of load times. Red indicates that the number of vehicles under full load is high, whereas the yellow indicates the number of vehicles under full load is low.
It is necessary to convert the number of vehicle loads during construction into standard axle loads. Following regulations and research from relevant scholars [30], this paper adopts the principle of equivalence of tensile stress for the semirigid material layer. Results are shown in Table 5.
Table 5.
Standard axle load times of carrier trucks.
Table 5 shows action times for 100 kN, 130 kN, 160 kN, 190 kN, 220 kN, and 250 kN axle loads on the pavement structure based on the standard axle load times. With increasing axle loads, the action times of each structure layer of pavement increased rapidly, which could easily cause damage to the pavement structure. Therefore, overload should be strictly controlled to reduce the damage to the subbase during construction.
3.2. Structure Layer Model and Parameters during the Construction Period
During construction, the stress state of the pavement varies at different stages, but the subbase always bears the construction load when laying each structural layer. Hence the subbase is the most disadvantaged layer, and the tensile stress on the subbase is greatest [31].
Six vehicle load sizes were selected and calculated. Their values were 100 kN, 130 kN, 160 kN, 190 kN, 220 kN, and 250 kN. The corresponding pressure on the road surface was 0.71 MPa, 0.79 MPa, 0.85 MPa, 0.89 MPa, 0.93 MPa, and 0.96 MPa. The ABAQUS model was established. The calculation element type was C3D8R, and the structural dimensions were 5 m × 5 m × 5 m. The boundary conditions were as follows: Transverse horizontal displacement and vertical horizontal displacement were restricted. The bottom of the subgrade limited all displacements. In order to analyze the tensile stress change caused by different subbase moduli, the subbase modulus was taken as 400 MPa, 800 MPa, 1200 MPa, 1600 MPa, and 2000 MPa. In order to analyze the change in tensile stress caused by different subbase thicknesses, the subbase thickness was taken as 16 cm, 20 cm, 24 cm, 28 cm, and 32 cm. According to regulations, the subbase Poisson’s ratio was 0.25, the modulus of resilience was 45 MPa, and Poisson’s ratio was 0.4.
3.3. Results
3.3.1. Influence of Compactness on Subbase Thickness
When analyzing the maximum bottom tensile stress under different subbase thicknesses, the subbase modulus was 1600 MPa (Figure 7). The maximum bottom tensile stress decreased with increasing base thickness, and the reduction rate was generally low. With increasing thickness, the reduction rate of tensile stress at the bottom of the layer increased slowly, and the maximum reduction rate was approximately 8.8%, showing that the change in the subbase had little effect on the tensile stress at the bottom of the layer. A suitable thickness for the subbase could be selected according to the actual construction specifications.
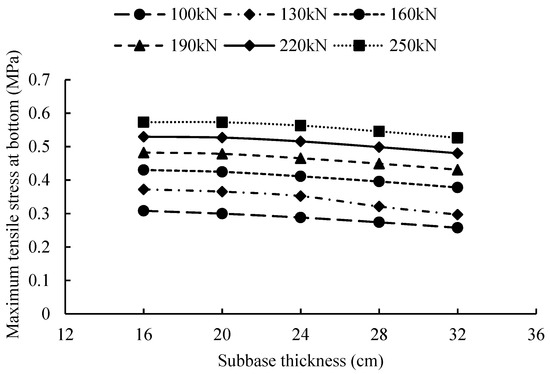
Figure 7.
Relationship between bottom base thickness and maximum tensile stress at the bottom layer.
3.3.2. Influence of Base Modulus
When analyzing the maximum bottom tensile stress under different subbase modulus, the thickness of the base was 24 cm. The maximum bottom tensile stress increased with increasing base modulus, and the growth rate of tensile stress under different loads was roughly the same (Figure 8). When the subbase modulus increased from 400 MPa to 800 MPa, the tensile stress growth rate was as high as 100%. When the subbase modulus increased from 1600 MPa to 2000 MPa, the tensile stress growth rate was 16%, showing that the lower the modulus, the greater the influence on the bottom tensile stress. With increasing modulus, the modulus influence gradually decreased.
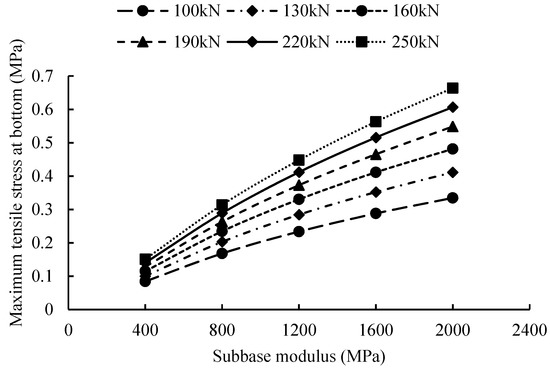
Figure 8.
Relationship between bottom base modulus and maximum tensile stress at the bottom layer.
With increasing base modulus, subbase deflection decreased. However, the maximum tensile stress on the bottom layer increased with increasing modulus [32]. Considering that the base should have a certain degree of flexibility, a large modulus is not always preferable, and the modulus should be contained within a certain range. Considering that the thickness of the subbase had a relatively small effect on tensile stress, the modulus of the subbase increased with increasing curing time. Therefore, this paper used engineering data to analyze the fatigue damage of cement-stabilized macadam base with variable curing times and loads.
4. Fatigue Damage of Cement-Stabilized Macadam Base
During the complete construction period, the construction load causes fatigue damage to the subbase. Fatigue damage caused by the construction load cannot be ignored because of the reduced strength of the base course in the early stages of road construction [33]. Based on layer stress analysis, this paper considers the subbase fatigue damage caused by construction loading under different working conditions and introduces Miner linear cumulative damage theory. The material damage cumulative can be expressed as follows:
In the equation, is the cumulative fatigue damage rate, Ni is the number of times corresponding to loads at various loads during material failure, and ni is the number of loads at various levels in practice.
4.1. Test Procedure
Common fatigue tests are the splitting fatigue test and bending fatigue test. Bending test results for beam specimens are accurate, and the test operation is simple and economical. Therefore, the three-point loading bending fatigue test was used to examine the fatigue properties of cement-stabilized macadam. The middle beam specimens were 10 cm × 10 cm × 40 cm. The cement dosage was 5.0%, and the gradation was compact. Specimens were formed using the vibrating method and were cured for 7 days, 14 days, 21 days, 28 days, and 90 days at 20 °C, the standard temperature. Specimens were immersed in water for 24 h the day before the test. After the bending tensile strength test, the following parameters were selected for fatigue testing:
- (1)
- Loading mode: stress control (the peak value of the load remains stable until the specimen is destroyed);
- (2)
- loading waveform and frequency: 10 Hz sine wave loaded wave;
- (3)
- R-ratio: 0.6, 0.7, 0.8 (the cyclic stress ratio is 0.1);
- (4)
- curing time: 90 d.
4.2. Results
With increasing curing time, the bending tensile strength increased gradually, but the growth rate decreased gradually (Figure 9). With increasing curing time, cement hydration was gradually completed, and the crystals in the mixture increased greatly, resulting in more network structure. With the gradual completion of chemical reactions, the strength of the material was determined, and its growth rate gradually decreased. In the fatigue test, the specimens cured for 90 days were used, the flexural tensile strength was 1.27 MPa, and the corresponding ultimate stress was 5.6 kN.
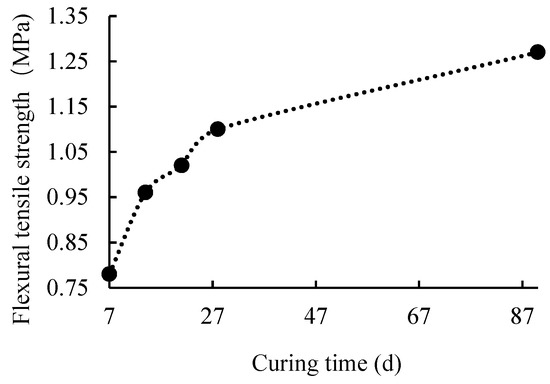
Figure 9.
Flexural tensile strength of different curing times.
The fatigue life of cement-stabilized macadam was dispersive, and hence experimental data obtained using the Weibull distribution theory were used to fit the p-N equation for different stress levels, and the logarithmic fatigue prediction equation was under a 50% guarantee rate (Figure 10).
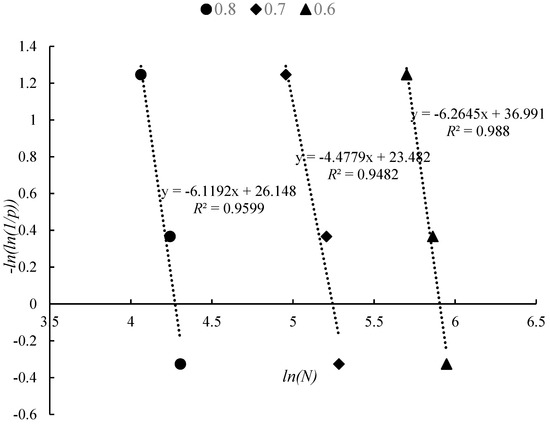
Figure 10.
Fitting results of the p-N equation for different stress levels.
According to the prediction equation, the logarithmic fatigue life of 50% under 0.8, 0.7, and 0.6 stress levels was 4.21, 5.16, and 5.85, respectively. The cement fatigue equation for stabilized macadam is:
In the equation, N is the number of repeated actions reached during failure, is the repeated bending stress of materials in MPa, and are the standard values of flexural tensile strength in MPa.
4.3. Fatigue Damage of Cement-Stabilized Base under Actual Engineering Conditions
4.3.1. Analysis of Actual Stress in Practical Engineering
The pavement structure parameters for the actual project are shown in Table 6.
Table 6.
Calculation parameters of structural layers.
For the same curing time, the maximum bottom tensile stress increased with increasing construction load, and its growth rate decreased gradually from 0.2 to 0.08 (the growth rate decreased differently for different curing times all according to the law) (Figure 11). Under the same load, the maximum bottom tensile stress for different curing times gradually decreased. With the increase of load from 130 kN to 250 kN, the maximum bottom tensile stress increased from 1.2 times to 1.8 times. With the increase of curing time from 7 days to 28 days, the maximum bottom tensile stress increased from 1.18 times to 1.33 times.
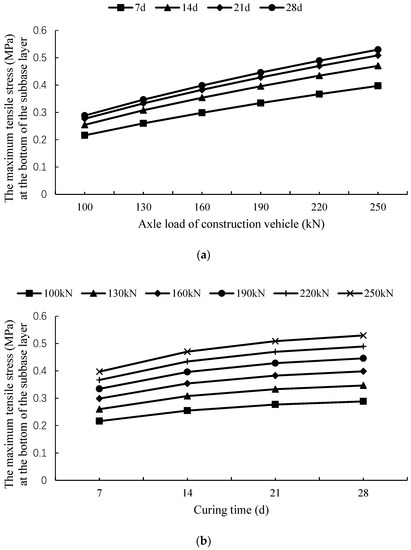
Figure 11.
The maximum bottom tensile stress calculated under different conditions: (a) Relationship between different loads and the maximum bottom tensile stress; (b) relationship between different curing times and the maximum bottom tensile stress.
4.3.2. Analysis of Actual Stress in Practical Engineering
During the actual construction process, the working conditions of cement-stabilized macadam subbase are different when different structural layers are paved during the construction period. The following working conditions model is put forward (Figure 12), where δ represents the equivalent circle radius.
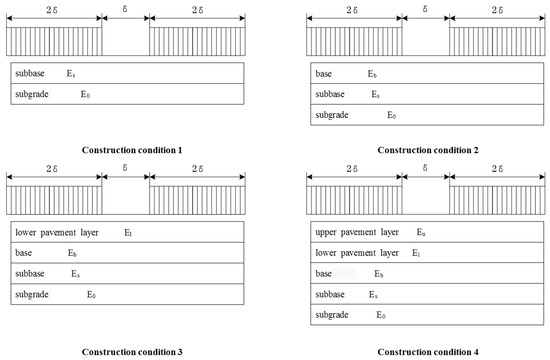
Figure 12.
Pavement conditions model for different construction periods.
The maximum bottom tensile stress of each pavement layer under different axle loads was calculated after 7 days of curing under different working conditions (Figure 13). Working condition 1 indicates that when the subbase was maintained for 7 days, the condition of the base course construction was carried out. Working condition 2 indicates that after 7 days of subbase maintenance, 7 days of base maintenance was completed, and the condition of the construction of the lower pavement layer was carried out. Working condition 3 indicates construction of the upper layer after construction of the lower layer was finished in 7 days. Working condition 4 indicates that the road surface was formally opened to traffic after the construction of the upper layer within 7 days.
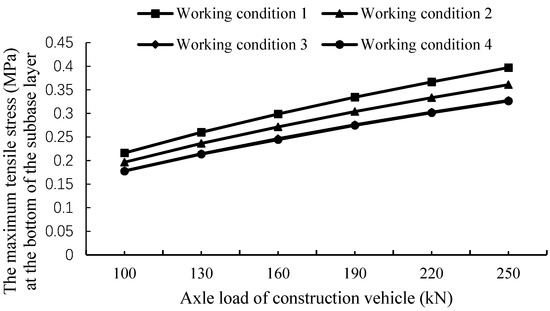
Figure 13.
Maximum tensile stress under different working conditions.
When the axle load was 100 kN, the stress ratio was less than 0.3, and when the axle load was 220 kN, the stress ratio was close to 0.5, which could easily cause irreversible fatigue damage (Figure 13). In case 2, when the axle load was less than 160 kN, the stress ratio was less than 0.3, and when the maximum axle load was 250 kN, the stress ratio was 0.38. In case 3, when the axle load was less than 220 kN, the stress ratio was less than 0.3, and when the maximum axle load was 250 kN, the stress ratio was 0.32. In case 4, when the load was less than 250 kN, the stress ratio was less than 0.3, showing that stress ratio decreased gradually with increasing curing time, and damage to the pavement decreased. Condition 1 produced the worst pavement conditions. The number of repeated actions under different working conditions and loads was calculated and compared to that of the construction vehicles. Working condition 4 represents the operational period of the pavement, and hence there was no construction load.
Fatigue damage easily occurred under working condition 1, and the fatigue damage caused by axle loads less than 160 kN was negligible (Figure 14). When the axle load was 190 kN, fatigue damage was 0.11. When axle load increased to 220 kN, fatigue damage was as high as 0.74. When axle load was 250 kN, the fatigue damage in the water-stabilized macadam appeared. Using Miner linear damage theory N could be obtained by combining Figure 13 with Equation (10): The look-up Table 5 gives n, and i indicates different working conditions. The fatigue damage values of pavement under different loads were calculated as follows in Table 7.
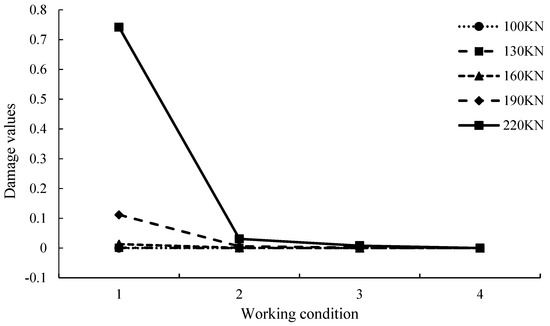
Figure 14.
Damage values of subbase under different working conditions.
Table 7.
Life loss of pavement under different construction loads.
With the gradual completion of pavement structure, damage to the subbase decreased rapidly. Therefore, in the design of pavement structure, the damage to the subbase caused by construction loads should be fully considered. The subbase thickness should be properly increased, and the overloaded construction vehicles should be tightly restricted. Vehicle axle load had a significant influence on subbase damage. When the load increased from 160 kN to 190 kN, the damage increased by 10.5%. When the load increased from 190 kN to 220 kN, the damage increased by 66.1%. On the other hand, the ability of subbase to bear loads would be enhanced if the number of base curing days was increased, and the damage under the same axle load would drop dramatically. Therefore, the number of basement maintenance days should be increased. Mi Liyuan [33] studied the impact of construction loads on cement-stabilized macadam bases, but mainly aimed at the fatigue damage of the cement-stabilized macadam under different curing temperatures. This paper analyzed the fatigue damage of cement-stabilized macadam under different working conditions, and is consistent with Mi Liyuan’s partial research conclusion. Therefore, the research of this paper has practical significance. Due to the harsh natural environment and tense construction period, the strength and thickness of the basement materials should be increased. During basement maintenance and laying, strictly restricting overloaded vehicles and reducing the period loading vehicles are used will significantly reduce road damage.
5. Conclusions
- (1)
- This paper investigated the effect of compactness, moisture content, and temperature on the strength growth law variability for cement-stabilized macadam bases. Unconfined compressive and indirect tensile strength tests were used to examine the effects of compactness, moisture content, and temperature on compressive strength and the splitting strength of specimens at different curing times. The grey relational degree method was used to analyze the variability of each factor on strength variability, and the degree of influence was compactness > water content > temperature.
- (2)
- The number of loading vehicles and the number of standard axle loads were calculated during the construction period, which could provide reference for stress analysis of semirigid base courses. The maximum bottom tensile stress under different loads, moduli, and thickness of base courses were calculated using simulation software. The influence law for tensile stress was given, and the determination standard for thickness and elastic modulus was given.
- (3)
- Based on the actual project, the influence of different loads and curing time on the maximum tensile stress at the bottom of the stratum was obtained, and the fatigue prediction equation for cement-stabilized macadam with a 50% guarantee rate was obtained via the bending tensile strength and fatigue tests.
- (4)
- The fatigue life of the subbase under different construction conditions was calculated by establishing pavement working condition models for different construction periods. Finally, the accumulated life loss of the pavement under different construction loads was obtained using Miner linear cumulative damage theory.
Author Contributions
Conceptualization, X.W. and N.F.; methodology, N.F. and H.Y.; formal analysis, H.Y. and J.Z.; investigation, N.F. and H.Y.; resources, X.W.; data curation, N.F. and H.Y.; writing—original draft preparation, N.F.; writing—review and editing, X.W., N.F., H.Y., and J.Z.; visualization, X.W., N.F., H.Y., and J.Z; supervision, X.W.; funding acquisition, X.W.
Funding
This research was funded by the Construction of Science and Technology Projects by the Ministry of Communications of China (2013 318 J08 220) and the Inner Mongolia Autonomous Region transportation science and technology project of China (NJ-2018-23).
Conflicts of Interest
The authors declare no conflict of interest.
References
- Zhang, X.; Wang, H.; Wang, D.; Li, C. Prediction of concrete strength based on self-organizing fuzzy neural network. In Proceedings of the 11th World Congress on Intelligent Control and Automation, Shenyang, China, 29 June–4 July 2014; IEEE: Piscataway, NJ, USA, 2015; pp. 5631–5634. [Google Scholar]
- Marandi, S.M.; Safapour, P. Base course modification through stabilization using cement and bitumen. Am. J. Appl. Sci. 2009, 6, 30–42. [Google Scholar] [CrossRef]
- Li, Q.; Wang, Z.; Li, Y.; Shang, J. Cold recycling of lime-fly ash stabilized macadam mixtures as pavement bases and subbases. Constr. Build. Mater. 2018, 169, 306–314. [Google Scholar] [CrossRef]
- Liu, S.Y.; Wang, Q.Z.; Chen, L.; Wei, L. Design of Mix Ratio of the Lime-Fly Ash Stabilized Macadam Based on the Anti-crack Performance. J. Chongqing Jiaotong Univ. Nat. Sci. 2008, 27, 1081–1085. [Google Scholar]
- Farsangi, E.N.; Erfani, M. Fuzzy Neural Network Utilization in Prediction of Compressive Strength of Slag-Cement Based Mortars. Aust. J. Basic Appl. Sci. 2010, 4, 4962–4970. [Google Scholar]
- Mazaheripour, H.; Rui, F.; Ye, G.; Schlangen, E.; Granja, J.; Azenha, M. Microstructure-Based Prediction of the Elastic Behaviour of Hydrating Cement Pastes. Appl. Sci. 2018, 8, 442. [Google Scholar] [CrossRef]
- Ma, Y.; Gu, J.; Li, Y.; Li, Y. The bending fatigue performance of cement-stabilized aggregate reinforced with polypropylene filament fiber. Constr. Build. Mater. 2015, 83, 230–236. [Google Scholar] [CrossRef]
- Cheng, J.; Xu, Z.H.; Li, S.M.; Sheng, X.J. Comparison of compressive resilient modulus and dynamic modulus of cement-stabilized macadam. J. Build. Mater. 2009, 12, 63–75. [Google Scholar]
- Lim, S.; Zollinger, D. Estimation of the compressive strength and modulus of elasticity of cement treated aggregate base materials. Transp. Res. Rec. 2003, 1837, 30–38. [Google Scholar] [CrossRef]
- Fan, W.; Sun, Z.; Du, E.; Hu, S.; Deng, Y. Research on rational construction temperature of cement-stabilized macadam base. Sichuan Build. Sci. 2010, 3, 029. [Google Scholar]
- Wang, Y.; Ni, F.J.; Li, Z.X. Fatigue performance of cement-stabilized macadam mixture. J. Traffic Transp. Eng. 2009, 9, 10–15. [Google Scholar]
- Sharpe, G.W.; Deen, R.C.; Southgate, H.F.; Anderson, M. Pavement Thickness Design Using Low Strength Base and Subbase Materials; Transportation Research Board: Washington, DC, USA, 1985; pp. 213–216. [Google Scholar]
- Zhou, H.Y. Road Performance and Construction Technology of Cement Stabilized Macadam Base. Constr. Des. Eng. 2017, 135, 75–76. [Google Scholar]
- Wang, M. Elementary Discussion on Crack Fault and Prevention of Cement Stabilized Macadam Base. Urban Roads Bridges Flood Control 2016, 10, 126–127. [Google Scholar]
- Ruth, B.E.; Bloy, L.A.K.; Avital, A.A. Prediction of Pavement Cracking at Low Temoerature. Proc. Assoc. Asph. Paving Technol. 1982, 51, 53–103. [Google Scholar]
- Stock, A.F.; Arand, W. Low Temperature Cracking in Polymer Modified Binder. J. Assoc. Asph. Paving Technol. 1993, 62, 23–53. [Google Scholar]
- Cao, Q. Analyse Structural Damage and Research on Remedial Measures of the Crushed Stone Cement Base During Construction. Master’s Thesis, Changshaligong Unversity, Changsha, China, 2015. [Google Scholar]
- Zhang, L.H.; Liao, F.X. Cracks Control of Cement Stabilized Macadam Base. Road Mach. Constr. Mech. 2010, 60, 60–63. [Google Scholar]
- Liao, X.F.; Xiao, F.; Chen, Z.D.; Xing, L. The Influence of Different Subbase Materials on the Crack of Cement Stabilized Macadam Base during Construction. Adv. Mater. Res. 2012, 591–593, 955–959. [Google Scholar] [CrossRef]
- Yoon, S.; Abu-Farsakh, M. Laboratory investigation on the strength characteristics of cement-sand as base material. KSCE J. Civ. Eng. 2009, 13, 15. [Google Scholar] [CrossRef]
- Snoeck, D.; Velasco, L.F.; Mignon, A.; Van Vlierberghe, S.; Dubruel, P.; Lodewyckx, P.; De Belie, N. The influence of different drying techniques on the water sorption properties of cement-based materials. Cem. Concr. Res. 2014, 64, 54–62. [Google Scholar] [CrossRef]
- Li, W.; Lang, L.; Lin, Z.; Wang, Z.; Zhang, F. Characteristics of dry shrinkage and temperature shrinkage of cement-stabilized steel slag. Constr. Build. Mater. 2017, 134, 540–548. [Google Scholar] [CrossRef]
- Sun, Z.H.; Xu, Z.H.; Wang, T.B.; Cao, W.D. Research on dry shrinkage deformation properties of cement-stabilized macadam base course materials. J. Build. Mater. 2006, 9, 166–171. [Google Scholar]
- Guo, H.M.; Zhu, H.; Zhou, Y. The Applied Research of Waste Crumb Rubber in Road Base. Appl. Mech. Mater. 2013, 253–255, 317–321. [Google Scholar] [CrossRef]
- Ministry of Communications of the People’s Republic of China. JTG F80 Quality Inspection and Evaluation Standards for Highway Engineering; China Communications Press: Beijing, China, 2017.
- Song, Y.L.; Li, L.S.; Liu, Y.J.; Lin, M. Influence of Early Strength Agent on Frost Resistance Performance of Cement Stabilized Material. J. Highw. Transp. Res. Dev. 2016, 3, 004. [Google Scholar]
- Wei, G. Grey relational analysis model for dynamic hybrid multiple attribute decision making. Knowl. Based Syst. 2011, 24, 672–679. [Google Scholar] [CrossRef]
- Song, T.L.; Chen, J.D.; Zhang, H. Comparative Analysis of Tensile, Compression, Flexural Static Modulus and Dynamic Modulus of Cement-stabilized Macadam. J. Highw. Transp. Res. Dev. 2016, 33, 39–43. [Google Scholar]
- Li, G.W.; Chen, Y.; Xue, J.S.; Jiang, Y.J.; Liu, Y.J. Modulus of Resilience of Cement Cold Recycling Mixtures Under Vertical Vibration Compaction. Road Mach. Constr. Mech. 2017, 34, 58–67. [Google Scholar]
- Yue, H.Y.; Chen, J.F. Study on Early Time Interior Temperature Field of Cement Stabilized Macadam Base and Control of Contractive Cracks. J. Highw. Transp. Res. Dev. 2008, 7, 32–36. [Google Scholar]
- Trindade, T.P.; Carvalho, C.A.; Silva, C.H.; de Lima, D.C.; Barbosa, P.S. Resilient Modulus of Soils and Soil-Cement Mixtures. In Resilient Modulus Testing for Pavement Components; ASTM International: West Conshohocken, PA, USA, 2003. [Google Scholar]
- Li, B.; Liang, N.X. Influence of thickness of cement stabilized graded crushed stone base on fatigue life and deflection. Shandong Transp. Technol. 2017, 6, 45–47. [Google Scholar]
- Mi, L.Y. Study on the Influence of Loads during Construction and Curing Period on the Damage to Cement-Stablized Macadam Base. Master’s Thesis, Harbin Gongye Unversity, Harbin, China, 2015. [Google Scholar]
© 2018 by the authors. Licensee MDPI, Basel, Switzerland. This article is an open access article distributed under the terms and conditions of the Creative Commons Attribution (CC BY) license (http://creativecommons.org/licenses/by/4.0/).