Article

Partition Behavior in Aqueous Two-Phase System and Antioxidant Activity of Flavonoids from Ginkgo biloba

1
Key Laboratory of Urban Agriculture (North China), Ministry of Agriculture, College of Biological Science and Engineering, Beijing University of Agriculture, Beijing 102206, China
2
Beijing Collaborative Innovation Center for Eco-Environmental Improvement with Forestry and Fruit Trees, Beijing 102206, China
*
Author to whom correspondence should be addressed.
Appl. Sci. 2018, 8(11), 2058; https://doi.org/10.3390/app8112058
Submission received: 24 September 2018 / Revised: 16 October 2018 / Accepted: 22 October 2018 / Published: 25 October 2018

Abstract

:
In this work, the aqueous two-phase extraction parameters and in vitro antioxidant activity of total flavonoids from Ginkgo biloba were investigated. The partition behavior of the flavonoids in an aqueous two-phase system (ATPS) was analyzed, the extraction parameters were optimized using response surface methodology, and the antioxidant activity of the flavonoids was determined by free-radical scavenging tests (1,1-diphenyl-2-picrylhydrazyl (DPPH) assay) and the ferric reducing/antioxidant power (FRAP) assay. The results showed that the concentration of ammonium sulfate was negatively correlated with the phase-volume ratio, whereas the concentration of polyethylene glycol was positively correlated. The maximum yield of flavonoids (4.11 mg g−1) was obtained under the following optimal extraction conditions: Concentration of polyethylene glycol (PEG)1500 30% and (NH4)2SO4 22% (mass fraction), and liquid/solid ratio 40:1 (mL g−1). The antioxidant activity tests showed that the flavonoids from the G. biloba leaf exhibited free-radical scavenging activity, with an IC50 of 2.66 mg L−1, which was superior to that of vitamin C. The free-radical scavenging ability of the flavonoids was proportional to the flavonoid concentration. The total reducing power of the Ginkgo flavonoids was slightly lower than that of vitamin C. In this study, the distribution of flavonoids in an ATPS was analyzed and a mathematical model for the ATPS extraction of Ginkgo flavonoids was established, which provides a reference for further development and utilization of G. biloba.

1. Introduction

Ginkgo biloba is a “living fossil” plant, and is a long-living tree, the oldest individuals being approximately 1000 to 3000 years old [1,2]. In recent years, G. biloba extract has entered the market and cosmetic industry as a health care product and drug, because of its various pharmaceutical properties. In particular, the G. biloba extract has become widely recognized as a therapeutic agent, and has been employed because of its effects on memory and dementia [3,4,5]. The commonly prescribed drug EGb 761, which contains bioactive Ginkgo flavonoids (24%) [6], is used to treat dementia and enhance memory, in many countries. Flavonoids are the main active components in Ginkgo extracts, due to their neuroprotective and neuromodulatory properties, which have been actively investigated. In addition, Ginkgo flavonoids exhibit multifaceted therapeutic effects in applications such as the treatment of Alzheimer’s disease, in vivo antioxidant action [7,8,9], protection of the mitochondrial membrane [10], and treatment of cerebral insufficiency [11].
Ginkgo flavonoids belong to a family of polyphenolic compounds that are soluble in non-polar solvents and are commonly extracted by organic solvents such as acetone, ethanol, methanol, ether, or ethyl acetate. The extraction of flavonoids conventionally uses heat-reflux extraction by organic solvents; large amounts of organic solvents and long time periods are needed. Furthermore, these organic solvents are flammable [12], which makes the process of flavonoid production dangerous. Many of the active ingredients in natural products are easily oxidized and degraded at the high temperatures used in the heat-reflux extraction process. In recent years, safe and environmentally friendly separation techniques have become more important. The aqueous two-phase system (ATPS) is effective for separating and purifying proteins and active small molecules, and offers several advantages over traditional methods [13]. ATPS extraction has been applied to the extraction of natural compounds because of its mild process conditions, fast phase separation, lower costs, and high capacity [14,15]. Furthermore, ATPS extraction eschews volatile organic solvents, explosions, and other safety problems. There are few reports on the ATPS extraction of flavonoids from Ginkgo leaf. Hence, we investigated the feasibility of using Ginkgo leaf as the raw material for flavonoid extraction by ATPS, and response surface methodology was used to optimize the process and analyze the factors affecting the extraction process.

2. Materials and Methods

2.1. Chemicals

The Ginkgo leaf used in this study was collected at the Beijing University of Agriculture, Beijing, China, in July 2017. Rutin was purchased from Sinopharm Chemical Reagent Co., Ltd. (Shanghai, China). Polyethylene glycol (PEG, with an average molecular weight: 400, 600, 4000, and 6000) was purchased from Beijing Solarbio Science and Technology Co., Ltd. (Beijing, China). PEG1500 was purchased from Tianjin Guangfu Fine Chemical Research Institute (Tianjin, China). All the chemicals used were of analytical grade and all the aqueous solutions were prepared with deionized water.

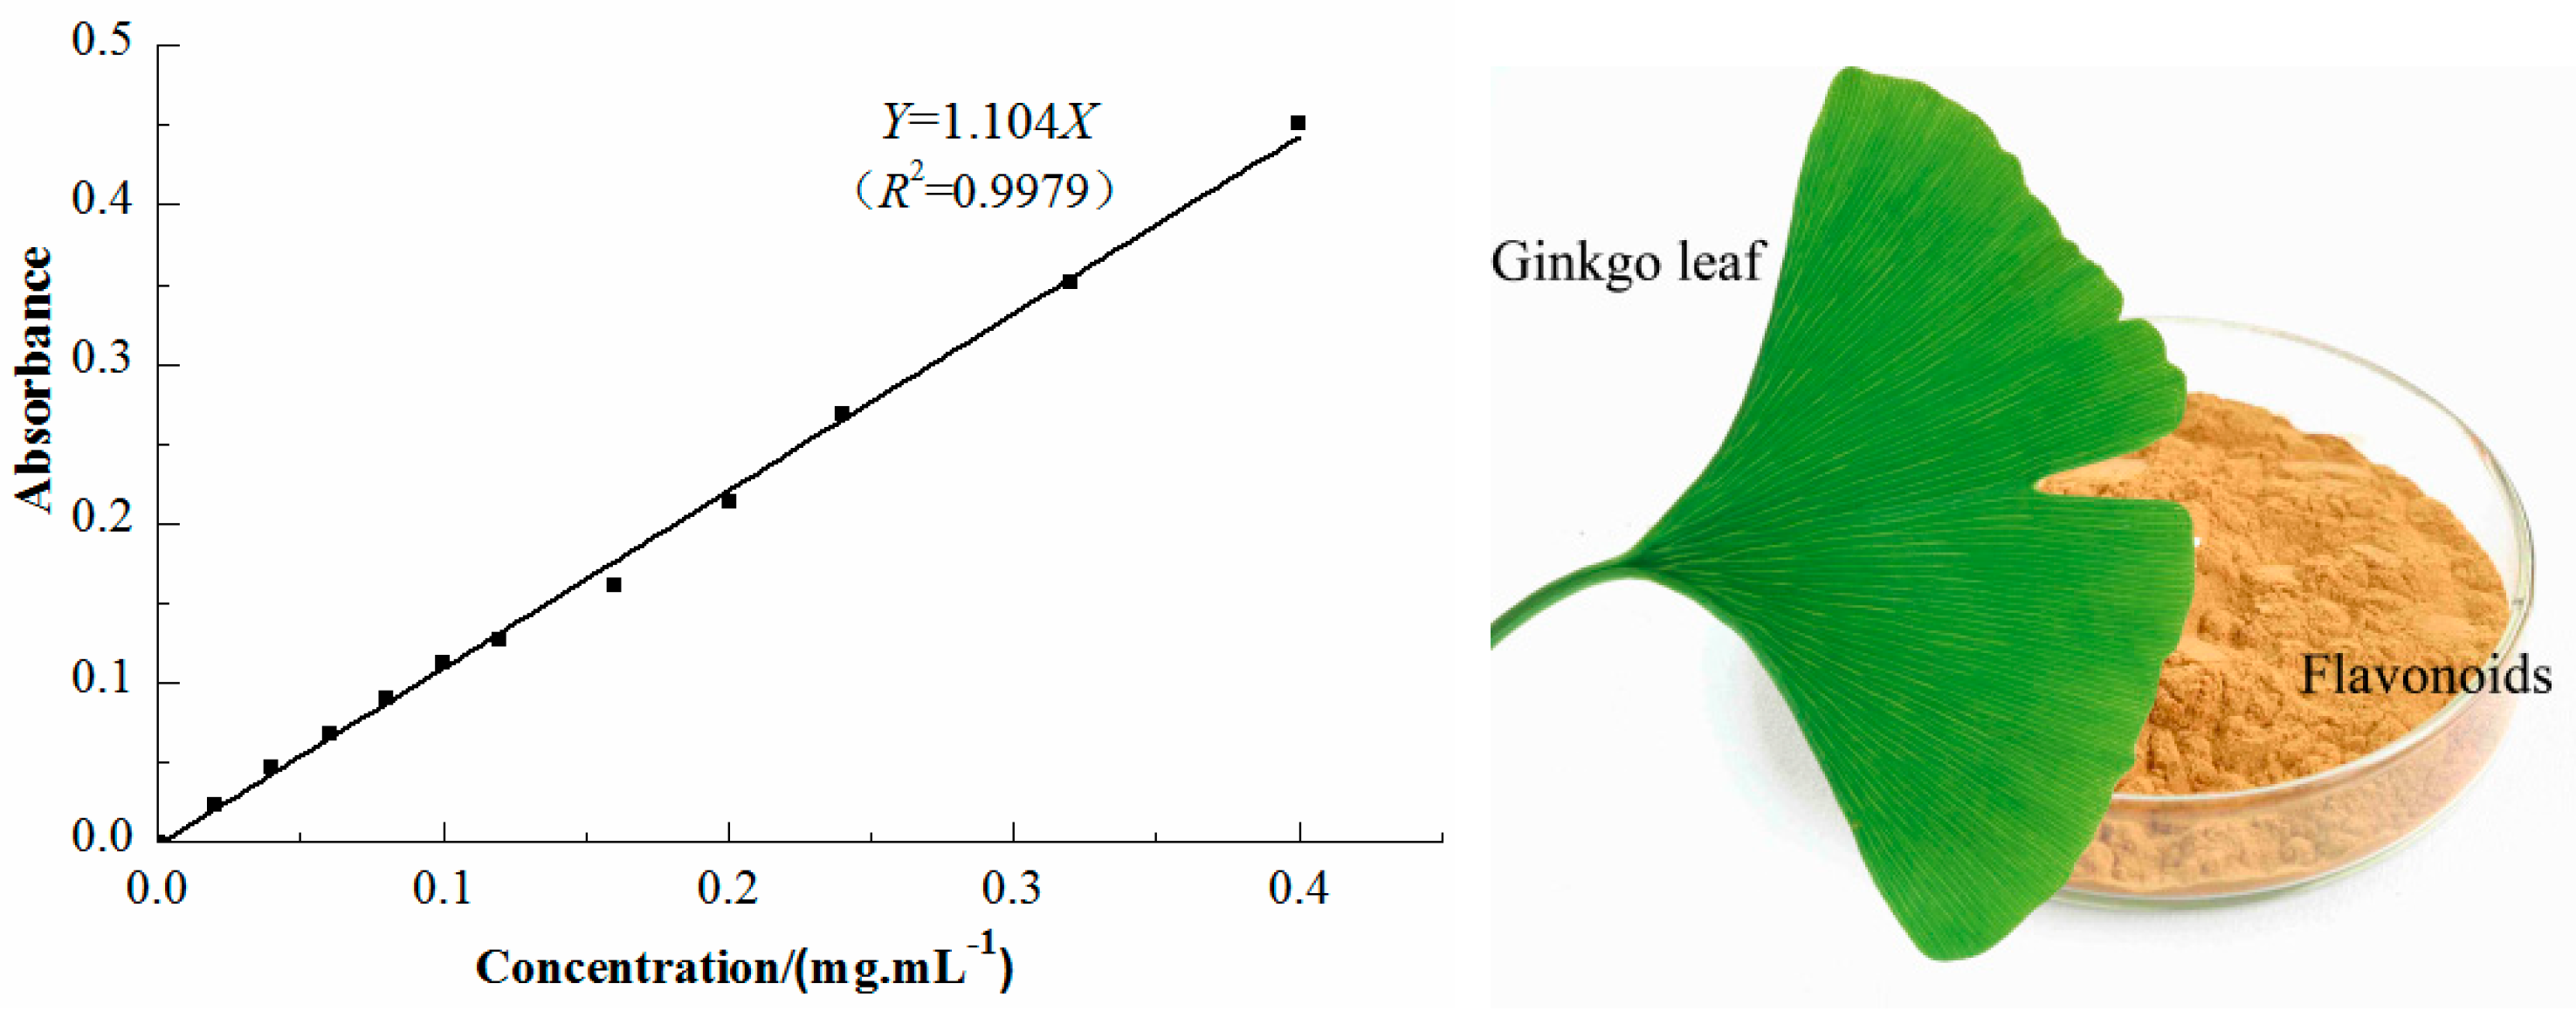
2.2. Determination of Total Flavonoid Content

The total flavonoid content in the extract was determined by ultraviolet–visible (UV-Vis) spectrometry (Unico Shanghai Instrument Co., Ltd., Shanghai, China) [16]. The extract solution (1 mL) was taken in a colorimeter tube (10 mL) and sodium nitrite solution (0.3 mL, 5%) was added. The mixture was shaken for 6 min before adding aluminum nitrate solution (0.3 mL, 10%), and the mixture was shaken again for 6 min. Then, sodium hydroxide (4.0 mL, 5%) was added. Finally, the solution volume was adjusted to 10.0 mL by adding deionized water. After 15 min of reaction at ambient temperature, the absorbance was evaluated at 510 nm [17]. Rutin was used as the standard for the calibration curve. The flavonoid content was calculated using the following linear equation based on the calibration curve [Figure 1]:
Y = 1.104 X ,   R 2 = 0.997
where Y is the absorbance and X is the concentration of flavonoids in the range 0.02–0.40 mg mL−1.

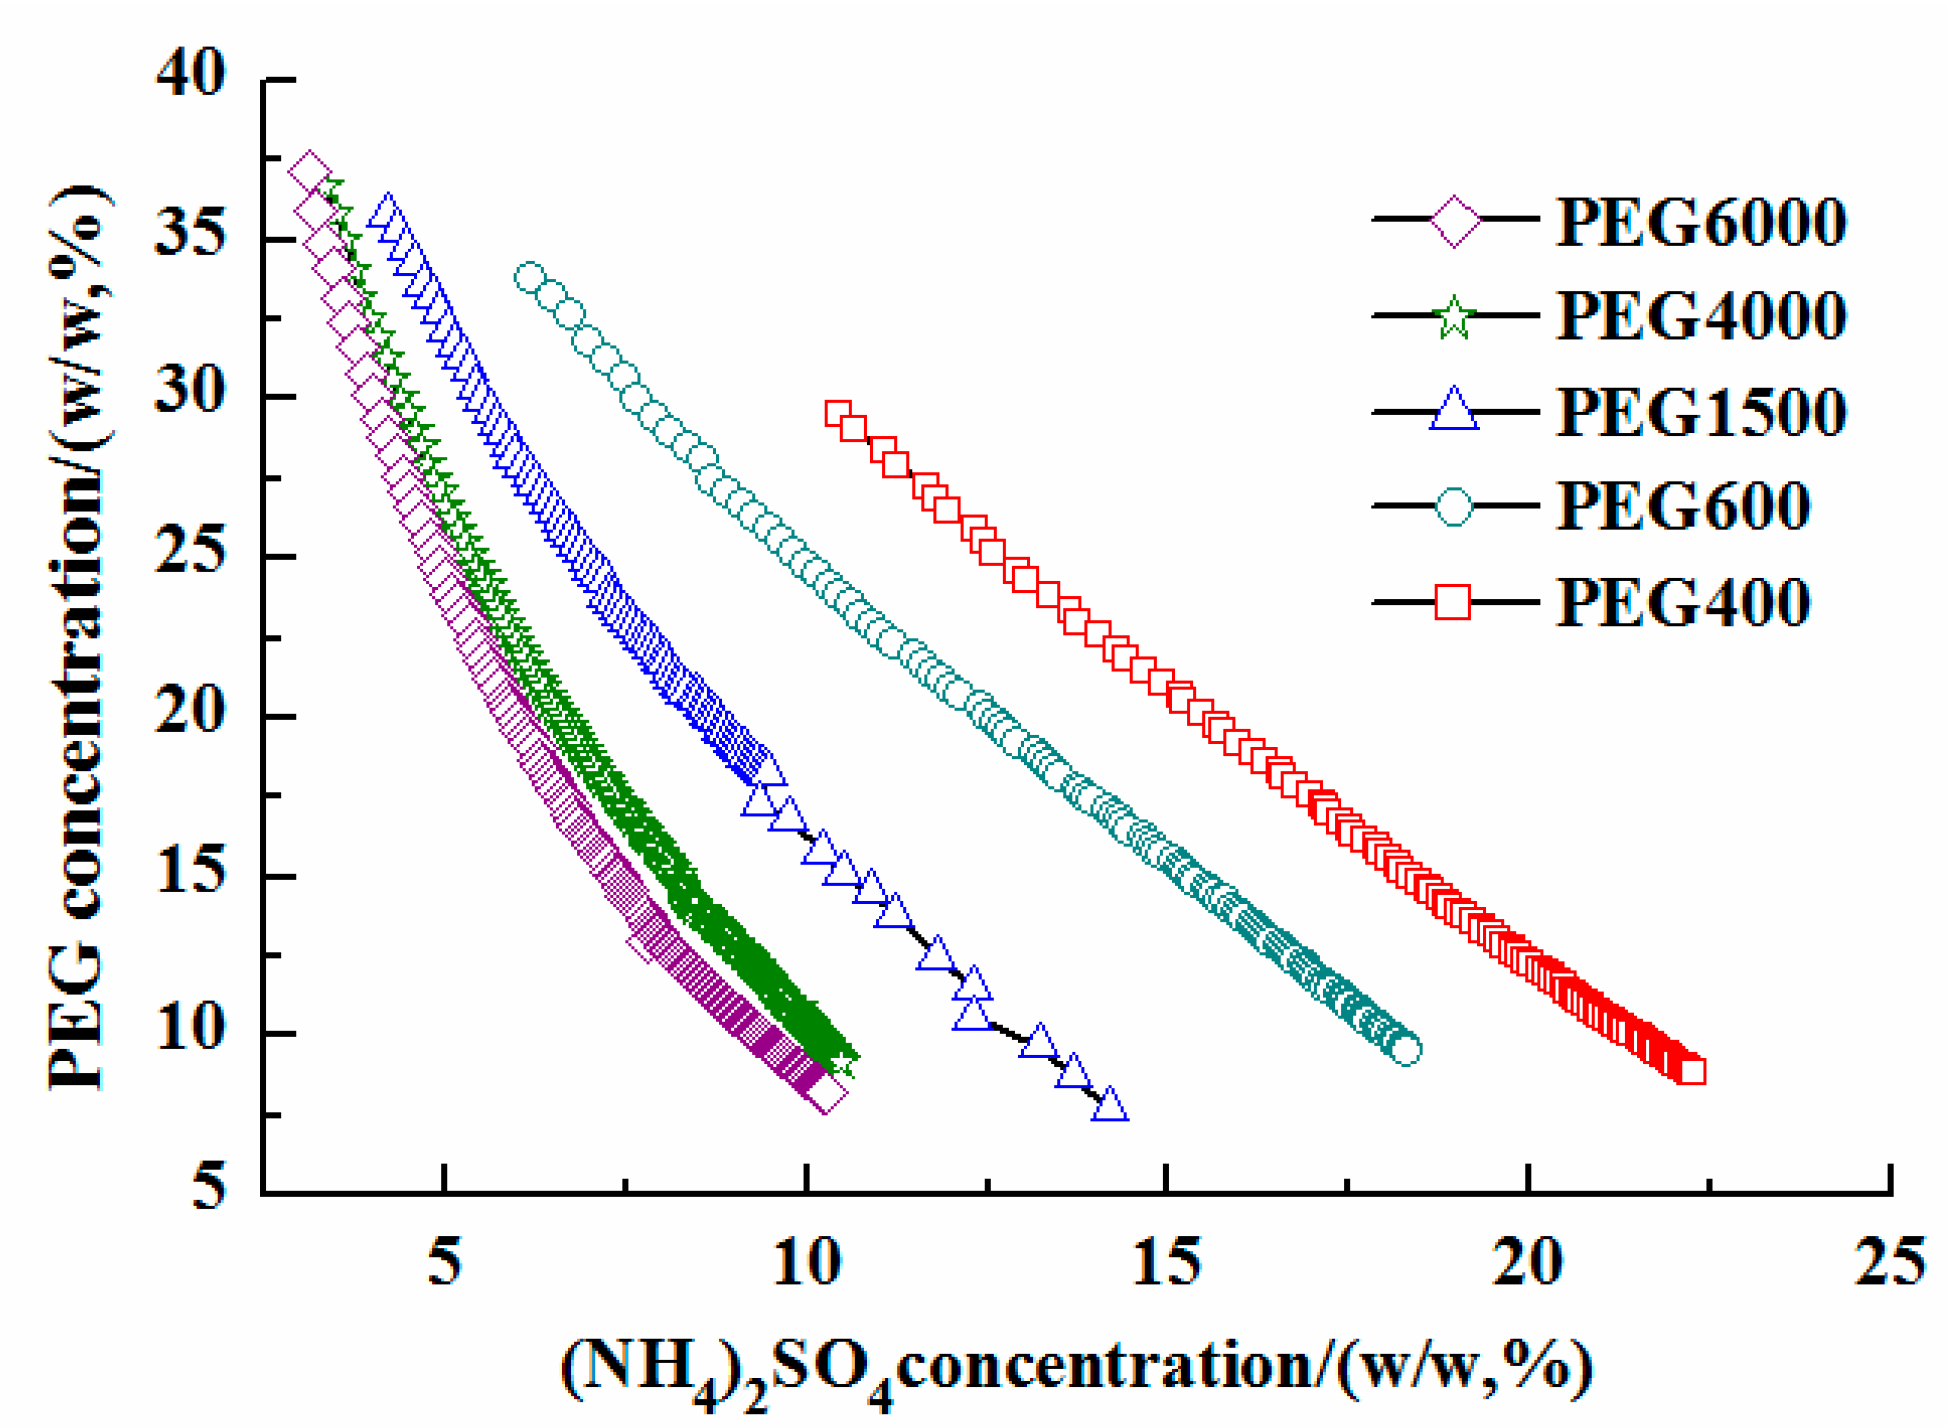
2.3. Phase Diagram of PEG/(NH4)2SO4-Containing Aqueous Two-Phase Systems

The phase diagram of ATPSs comprising PEG of different molecular weights (MW) and (NH4)2SO4 was investigated at T = 298 K. The turbidity titration method was used to obtain the phase diagrams of the PEG/(NH4)2SO4 systems. Deionized water and PEG (MW 400, 600, 1500, 4000, and 6000) were added to a tube before the (NH4)2SO4 solution was added dropwise. The mixture was shaken using a vortex mixer for 3 min after the addition of each droplet. The mixture became turbid after mixing, and deionized water was added until the turbidity disappeared (Figure S1). Once the mixture became transparent, another drop of (NH4)2SO4 solution was added and the mixture turned turbid again. The point at which the mixture initially became turbid was taken as the turbidity point. The amounts of (NH4)2SO4 and deionized water added were measured, and the concentrations of (NH4)2SO4 and PEG were calculated at different turbidity points. A phase diagram curve was plotted according to the above data. The influences of various process parameters such as (NH4)2SO4 and PEG concentrations on the volume ratio and flavonoid yield of the ATPS were calculated. Rutin was used as the standard for flavonoid content determination. The partitions of the flavonoids between the various phases were characterized by various parameters, including the partition coefficient (K), volume ratio (P), recovery (R), and extraction yield (Y).
Partition coefficient (K) is defined as:
  K = C t C b  
where Ct and Cb denote the concentrations of the partitioned substance in the polymer and salt phases, respectively.
The volumes of the phases (Vt and Vb) can be described by the phase-volume ratio (P):
  P = V t V b  
where R is the phase volume ratio, Vt is the volume of the top phase, and Vb is the volume of the bottom phase.
The recovery in the top phase (R) is defined as:
  R = C t   × V t W × 100 %
where R is the flavonoid recovery in the top phase, Ct is the flavonoid concentration in the top phase, and W is the mass of total flavonoids.
The total flavonoid extraction yield (mg g−1) is defined as:
  Y = C t   × V t M leaf × 100 %
where Y is the total flavonoid yield, Ct is the flavonoid concentration in the top phase, and Mleaf is the mass of Ginkgo leaf.

2.4. Aqueous Two-Phase Extraction and Experimental Design

A total of 30 g of Ginkgo leaf was homogenized in cold water in a 1:3 ratio (w/w) before being filtered. The filtrate was centrifuged at 10,000 g for 20 min, at 4 °C. The supernatant obtained was mixed with PEG1500, water, and (NH4)2SO4 for flavonoid extraction. After standing for 30 min, the upper and lower phases were separated, and the phase volume and total flavonoid yield were determined. The optimum extraction conditions were found using a Box–Behnken design, to optimize three variables (PEG concentration, (NH4)2SO4 concentration, and liquid/solid ratio), and designated as X1, X2, and X3 (Table 1). The coded levels of the independent variables were −1, 0, and 1. Framing of the experimental design and analysis of the data obtained were performed using the Design–Expert software (version 7.0, Stat-Ease Inc., Minneapolis, MN, USA) [18]. The mean values were considered to be significantly different when p < 0.05.

2.5. Determination of Free Radical Scavenging Ability

Taking vitamin C and vitamin E as the reference substances, the antioxidant activity of Ginkgo flavonoids was evaluated by determining the clearance ability of 2,2-dipheny-l-(2,4,6-trinitrophenyl) hydrazine (DPPH). DPPH (10 mg) was dissolved in anhydrous ethanol, fixed at 100 mL, mixed, and 0.1 mg mL−1 DPPH solution was obtained. Before the antioxidant experiment, the PEG in the upper layer of the aqueous two-phase extraction solution was removed using XAD resin. After two-phase separation, flavonoids were enriched in the upper phase; then, the upper phase was separated, diluted into homogeneous a phase with distilled water, the flavonoids were absorbed with XAD16 macroporous resin to remove polyethylene glycol, eluted with 65% ethanol, concentrated, and dried to obtain Ginkgo total flavonoids. Thereafter, the flavonoids were dissolved in anhydrous ethanol to determine the oxidation resistance. The concentrations of the Ginkgo flavonoids were 3.75, 7.5, 15, 30, and 60 mg L−1, respectively, and 2 mL of the Ginkgo flavonoid sample solution was mixed with 2 mL absolute ethanol. After mixing, it was incubated under dark static conditions for 30 min; anhydrous ethanol was used for the calibration. The absorbance of each test tube solution was measured at 517 nm [19]. The DPPH scavenging rate was calculated according to the following formula.
Free radical scavenging ability of DPPH:
  S = ( 1 A i A j A 0 ) × 100 %
where the absorbance of the DPPH solution without flavonoid sample is Ao, the absorbance of DPPH and sample mixture is Ai, and the absorbance of the sample solution and anhydrous ethanol mixture is Aj.

2.6. Determination of Total Reduction Capacity

The total reduction capacity was measured using the ferric reducing/antioxidant power (FRAP) assay [20], with vitamin C and vitamin E as controls; 2.5 mL of different concentrations of Ginkgo flavonoid solutions were prepared in test tubes, 2.5 mL of 0.2 mol L−1 PBS (pH = 6.6) buffer solution was added, and 2.5 mL of 1% potassium ferricyanide solution was added. The solution was fully mixed in a water bath at 50 °C, and held for 20 min. After cooling with water and adding 10% trichloroacetic acid (2 mL), fully mixing, and centrifuging at a rotation speed of 4000 r/min for 10 min, the supernatant (1 mL) was taken and 0.5 mL of 0.1% ferric chloride solution and 3.5 mL distilled water were added. A spectrophotometer was used to determine the absorption value of the solution at a wavelength of 700 nm, to evaluate the reducing strength of the sample.

3. Results and Discussion

3.1. Phase Diagram of PEG/(NH4)2SO4

The PEG characteristics, including weight and concentration, are important factors in the properties of the phase-forming system [21]. Binodal curves were determined using the cloud point technique. A phase diagram of the PEG/(NH4)2SO4 system was constructed (Figure 2) to select the appropriate ratio of phase composition. The different PEG molecular weights showed obvious changes in the phase diagram. In this system, the top phase was the denser PEG phase and the bottom phase was the (NH4)2SO4-rich aqueous phase. A curve delineated the two zones; the two-phase system could be obtained above the curve. However, there was no phase separation below the curve. Hence, the concentrations of PEG and (NH4)2SO4 should be chosen appropriately to fall within the zone above the curve. It was found that the PEG6000−(NH4)2SO4 ATPS provided the largest heterogeneous region, whereas PEG1500−(NH4)2SO4 provided the smallest. According to Figure 2, a higher molecular weight of PEG yielded a higher two-phase region [22]. The formation of the ATPS was favored in the following order: 400 < 600 < 1500 < 4000 < 6000, and the capability of PEG for ATPS formation was directly proportional to the increase in the molecular weight. PEG with a higher molecular weight was more hydrophobic and its solubility in water decreased, leading to the polymer salting-out [23]. High-molecular-weight PEG favored the formation of the ATPS. However, the ATPS density also increased with the molecular weight of PEG, which made it difficult to separate the subsequent extraction [24]. In this work, a PEG molecular weight of 1500 was selected to carry out the ATPS extraction of Ginkgo flavonoids.

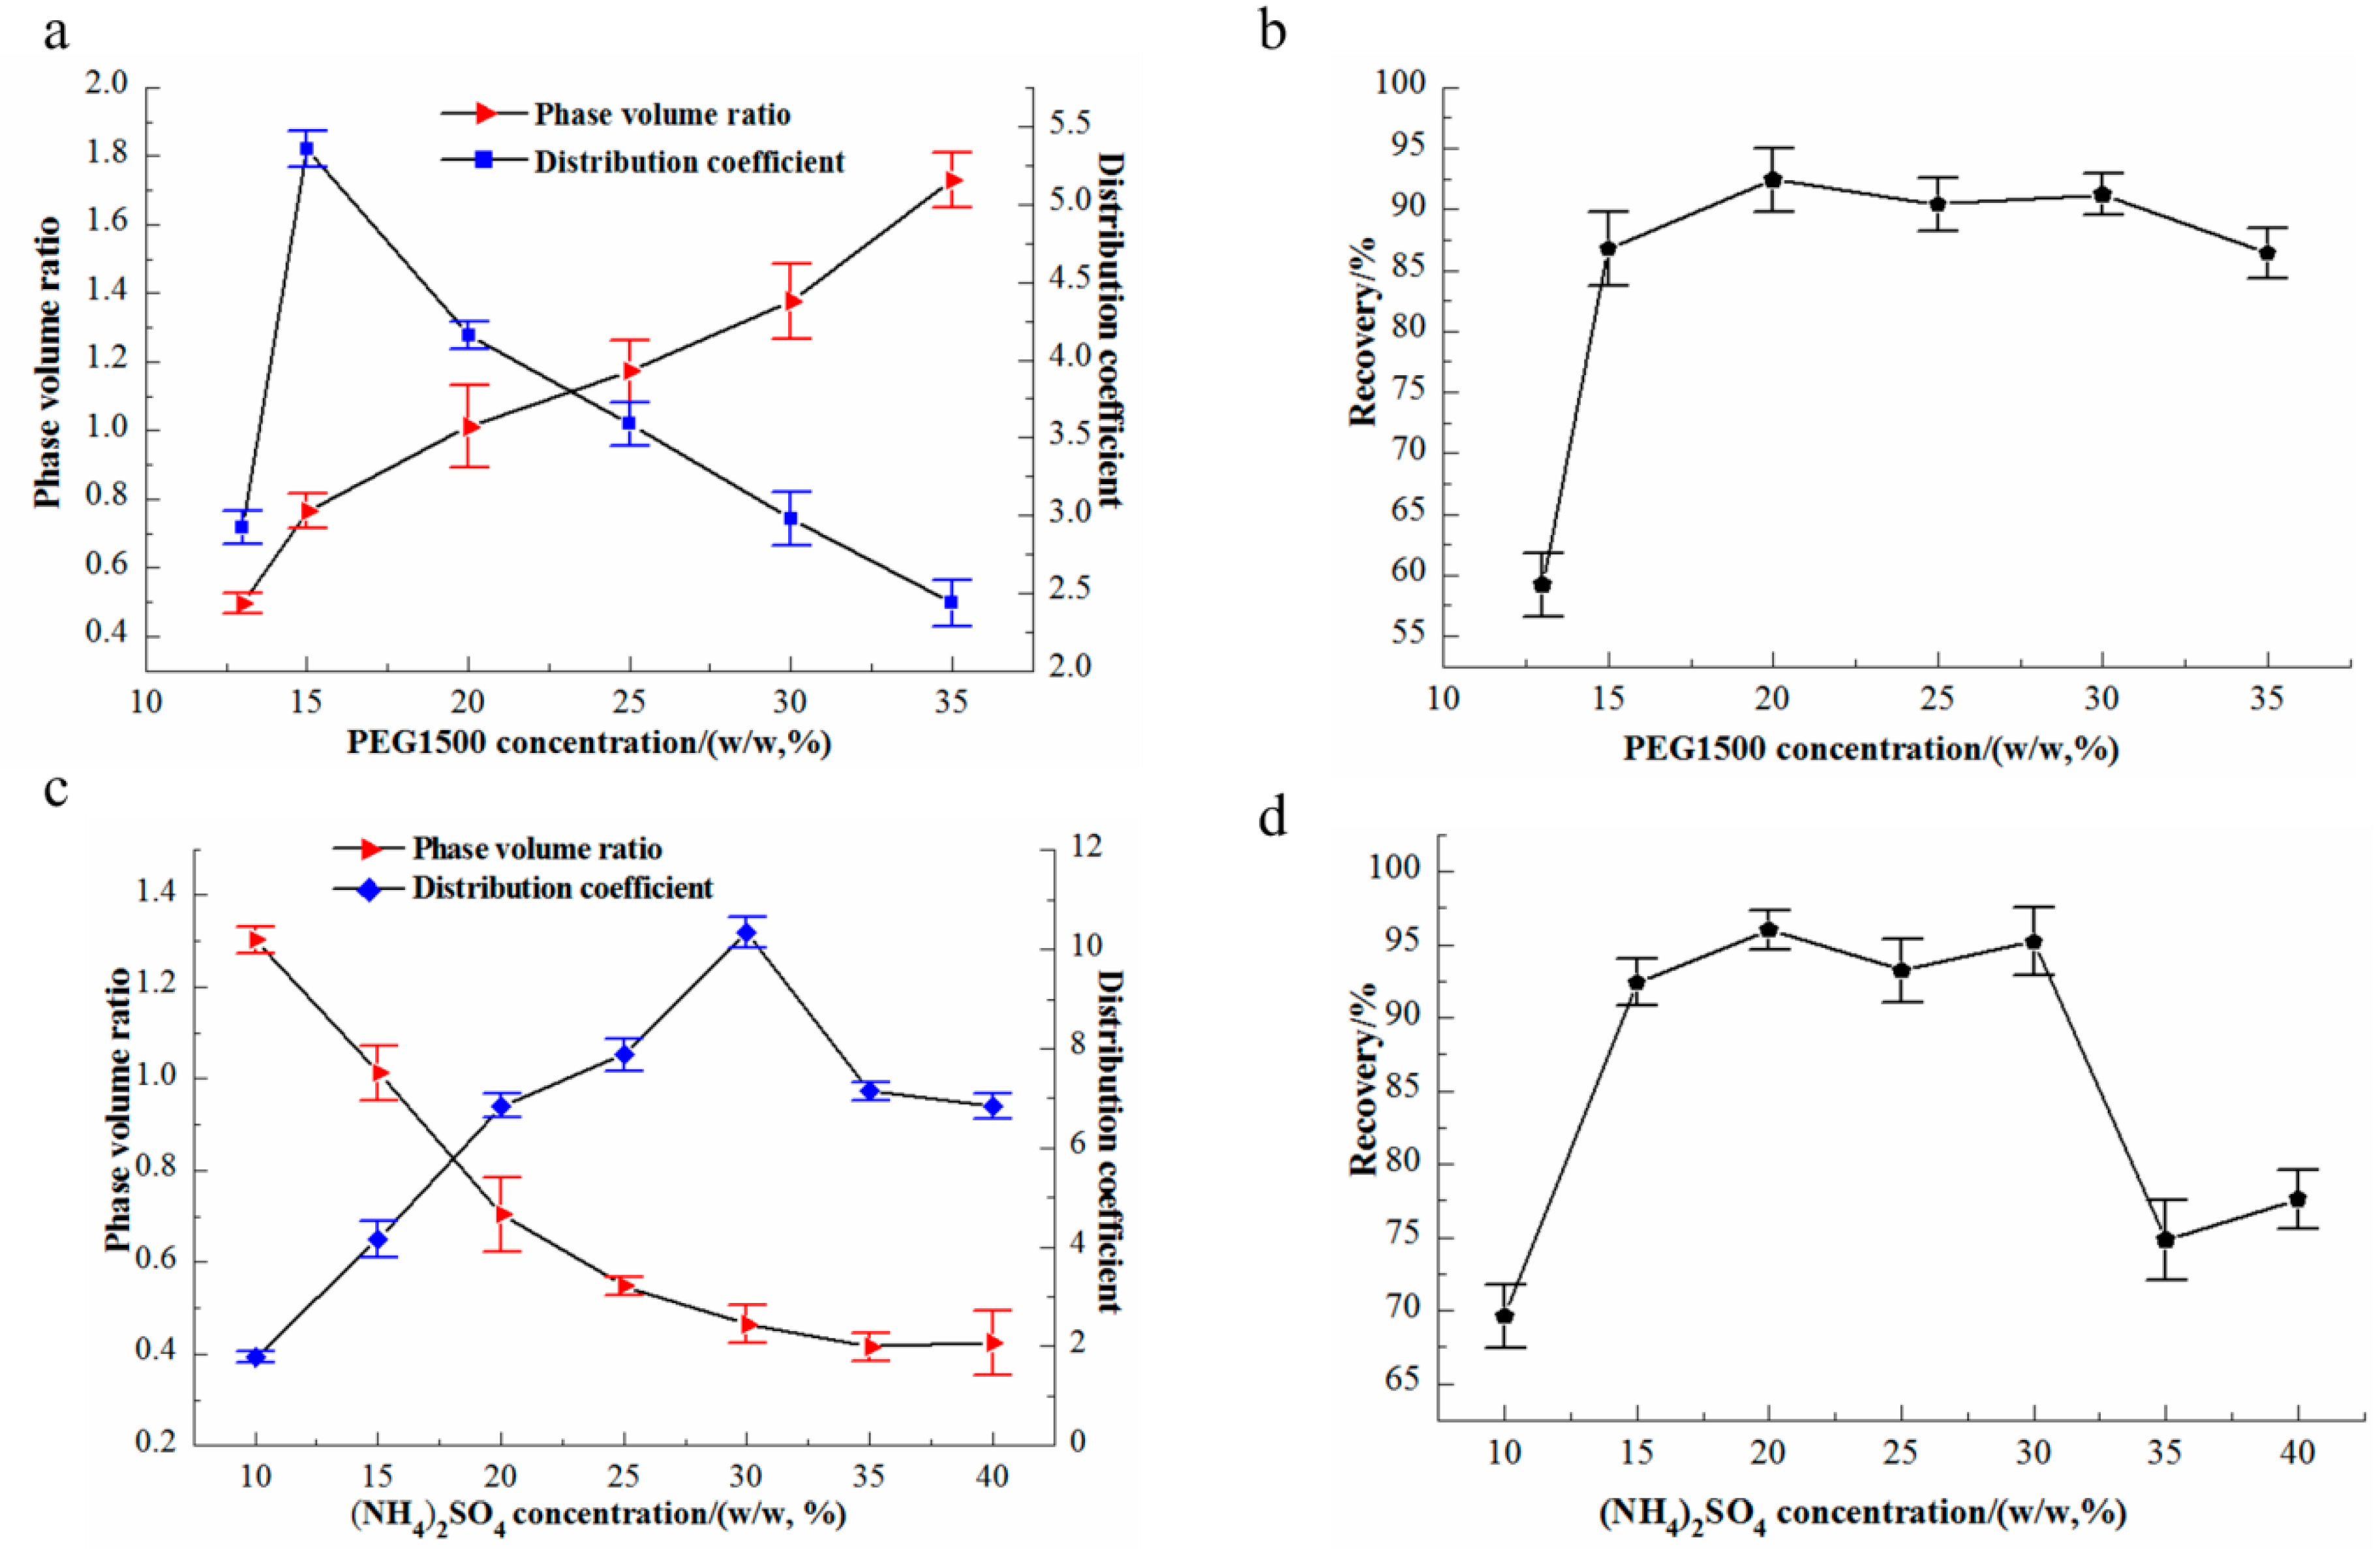
3.2. Effects of PEG1500 and (NH4)2SO4 on Partition Coefficient and Recovery in ATPS

The effects of PEG1500 and (NH4)2SO4 on the phase-volume ratio and recovery of flavonoids in the ATPS were investigated. As shown in Figure 3a,b, the (NH4)2SO4 concentration was constant at 15%; increasing the PEG1500 concentration resulted in a higher phase-volume ratio, and the flavonoids partitioned more to the PEG-rich top phase. A maximum yield of 92.4% was found at a PEG1500 concentration of 20%. Above this concentration, the extraction showed a slight change when the PEG concentration decreased from 20% to 35%. Figure 3c,d shows the effects of the (NH4)2SO4 concentration on the phase-volume ratio and recovery of flavonoids in the ATPS (PEG1500 concentration was constant at 20%). An increase in the (NH4)2SO4 concentration resulted in a decrease in the phase-volume ratio (Figure 3c), because the salt in the bottom phase could bind water molecules; thus, water would enter the bottom phase. A maximum recovery of 96% was found at an (NH4)2SO4 concentration of 20%. With further increase in (NH4)2SO4, the flavonoids partitioned more to the salt-rich bottom phase, resulting in a decrease in the recovery in the top phase. These results demonstrated the feasibility of achieving a high recovery using the ATPS and that the concentrations of (NH4)2SO4 and PEG were directly related to the extraction yield of flavonoids in the two-phase system. The high recovery of flavonoids indicated that the PEG1500/(NH4)2SO4 ATPS system was highly promising.

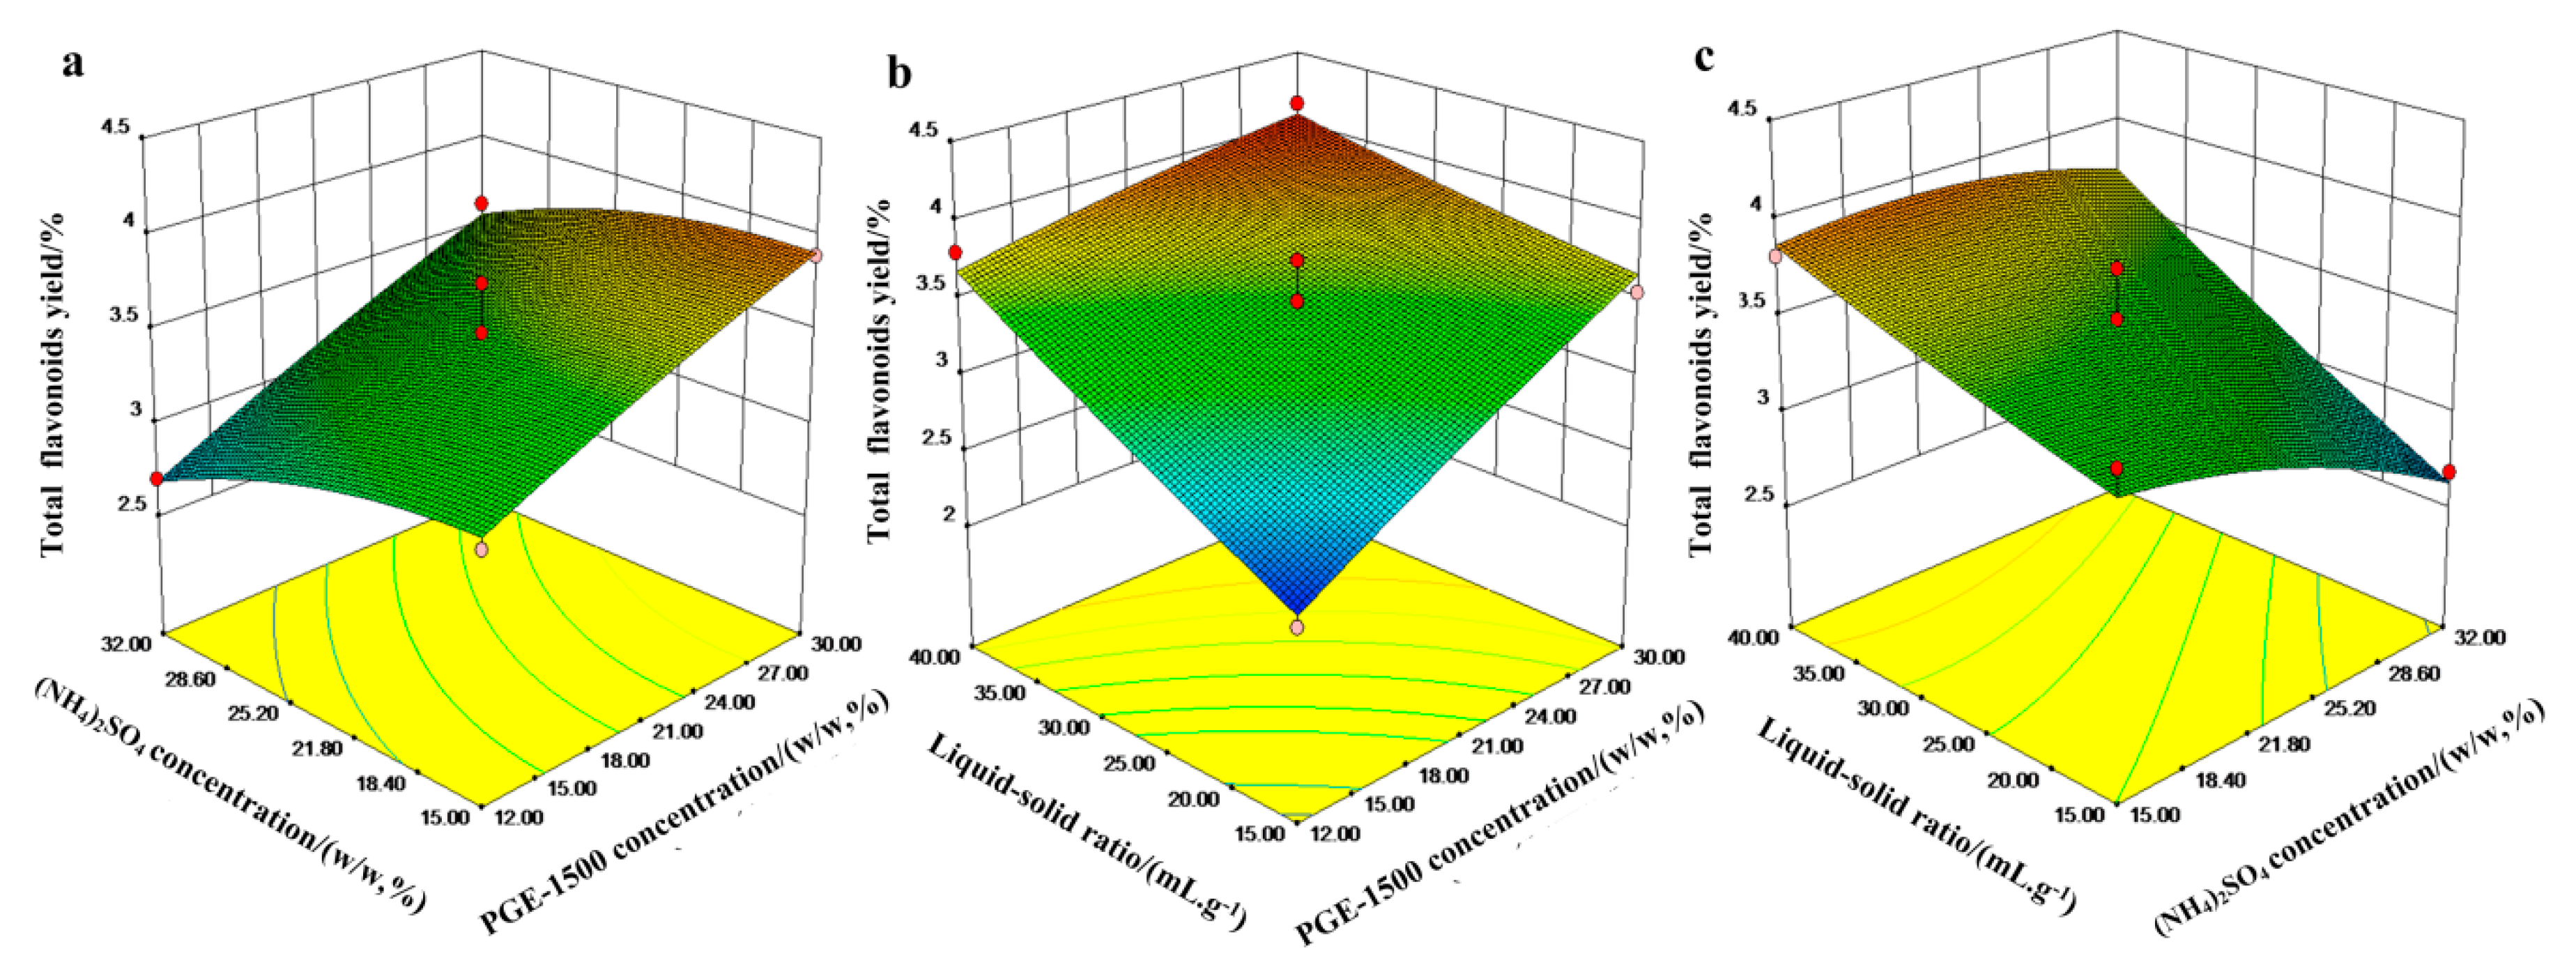
3.3. Response Surface Methodology Optimization for Flavonoid Extraction

The ATPS extraction yield was influenced by the concentrations of PEG and (NH4)2SO4. Furthermore, the ATPS solvent volume/leaf mass ratio also affected the extraction yield. To determine the maximum extraction yield, the effects of the PEG and (NH4)2SO4 concentrations and the ATPS solvent volume/leaf mass ratio were further optimized using response surface methodology.
A matrix of the Box–Behnken experimental design parameters, and the experimental results, are shown in Table 2. Multiple regression analysis was used to study the experimental data and the following regression equation details the empirical relationship between the three variables and the extraction yield, in terms of coded units:
Y = 3.47 + 0.40X1 − 0.21X2 + 0.41X3 − 0.031X12 − 0.11X22 + 0.022X32 + 0.34X1X2 − 0.21X1X3 + 0.14X2X3
where Y is the total flavonoid yield, X1 is the PEG1500 concentration, X2 is the (NH4)2SO4 concentration, and X3 is the ATPS solvent volume/leaf mass ratio.

3.4. Regression Analysis

The results were analyzed using the analysis of variance (ANOVA), and the statistical significance was checked using an F-test, as shown in Table 3. The F-value (13.3) of the regression model (p < 0.01) showed a high significance, confirming the adequacy of the quadratic model. The high value of the determination coefficient R2 (0.9447) demonstrated that the model adequately represented a real relationship between the independent variables, which showed that 94% of the variation in the response could be explained by the model [25]. The p-value for the lack of fit (0.442) implied that the lack of fit was not significant compared to the pure error. Furthermore, the coefficient of variation (C.V. = 4.86%) indicated a high degree of precision and high reliability of the experimental results. The values of Prob > F were less than 0.05, indicating that the model terms were significant [26]. A regression analysis of the experimental design shown in Table 3 demonstrates that the linear model terms (X1, X2, and X3) and interacting model terms (X1X3) were significant for the flavonoid yield.

3.5. Response Surface Plot

Response surface plots were generated for pairs of factors, keeping the third factor constant at its zero level. Thus, the effects of the factors influencing the flavonoid extraction yield in the ATPS are indicated by the response surface plots (Figure 4). These plots provide a method of visualizing the relationship between a response and test variable. Figure 4a shows a contour plot of the flavonoid extraction yield at different PEG (X1) and (NH4)2SO4 concentrations (X2) while the ATPS solvent/solid ratio (X3) is held at zero. The extraction yield increased with an increase in the concentration of PEG1500 (X1), and the same trend is observed in Figure 4b. An increase in (NH4)2SO4 resulted in a decrease in the flavonoid yield (Figure 4a,c), and the mutual relationship between the ATPS solvent/solid ratio (X3) and the concentration of PEG1500 (X1) can be seen in Figure 4b. In the studied concentration range, the extraction yield was influenced by the ATPS solvent/solid ratio and PEG1500, with increases in both these factors leading to an increase in the flavonoid yield. The maximum flavonoid extraction yield was obtained with a high concentration of PEG1500, and ATPS solvent/solid ratio factors corresponding to an intermediate (NH4)2SO4 concentration. According to the gradients of the response surface plots (Figure 4) and the value of Prob > F in Table 3, the significances of the independent variables on the extraction yield decreased in the following order: ATPS solvent volume/leaf mass ratio (X3) > PEG concentration (X1) > (NH4)2SO4 concentration (X2) [27].

3.6. Validation of Model

The second-order polynomial model obtained by regression analysis was used to calculate the optimal parameters for the maximum yield of flavonoids, predicting that the optimal values of the test variables, PEG1500 concentration, salt concentration, and ATPS solvent volume/leaf mass ratio, were 30% (w/w), 22%, and 40:1, respectively, giving a theoretical maximum yield of 4.07 mg g−1. The model was validated by performing experiments under the predicted conditions. A yield of 4.11 mg g−1 was obtained, which implied that the mathematical model was suitable for the simulation of flavonoid yields by the ATPS extraction presented in this work.

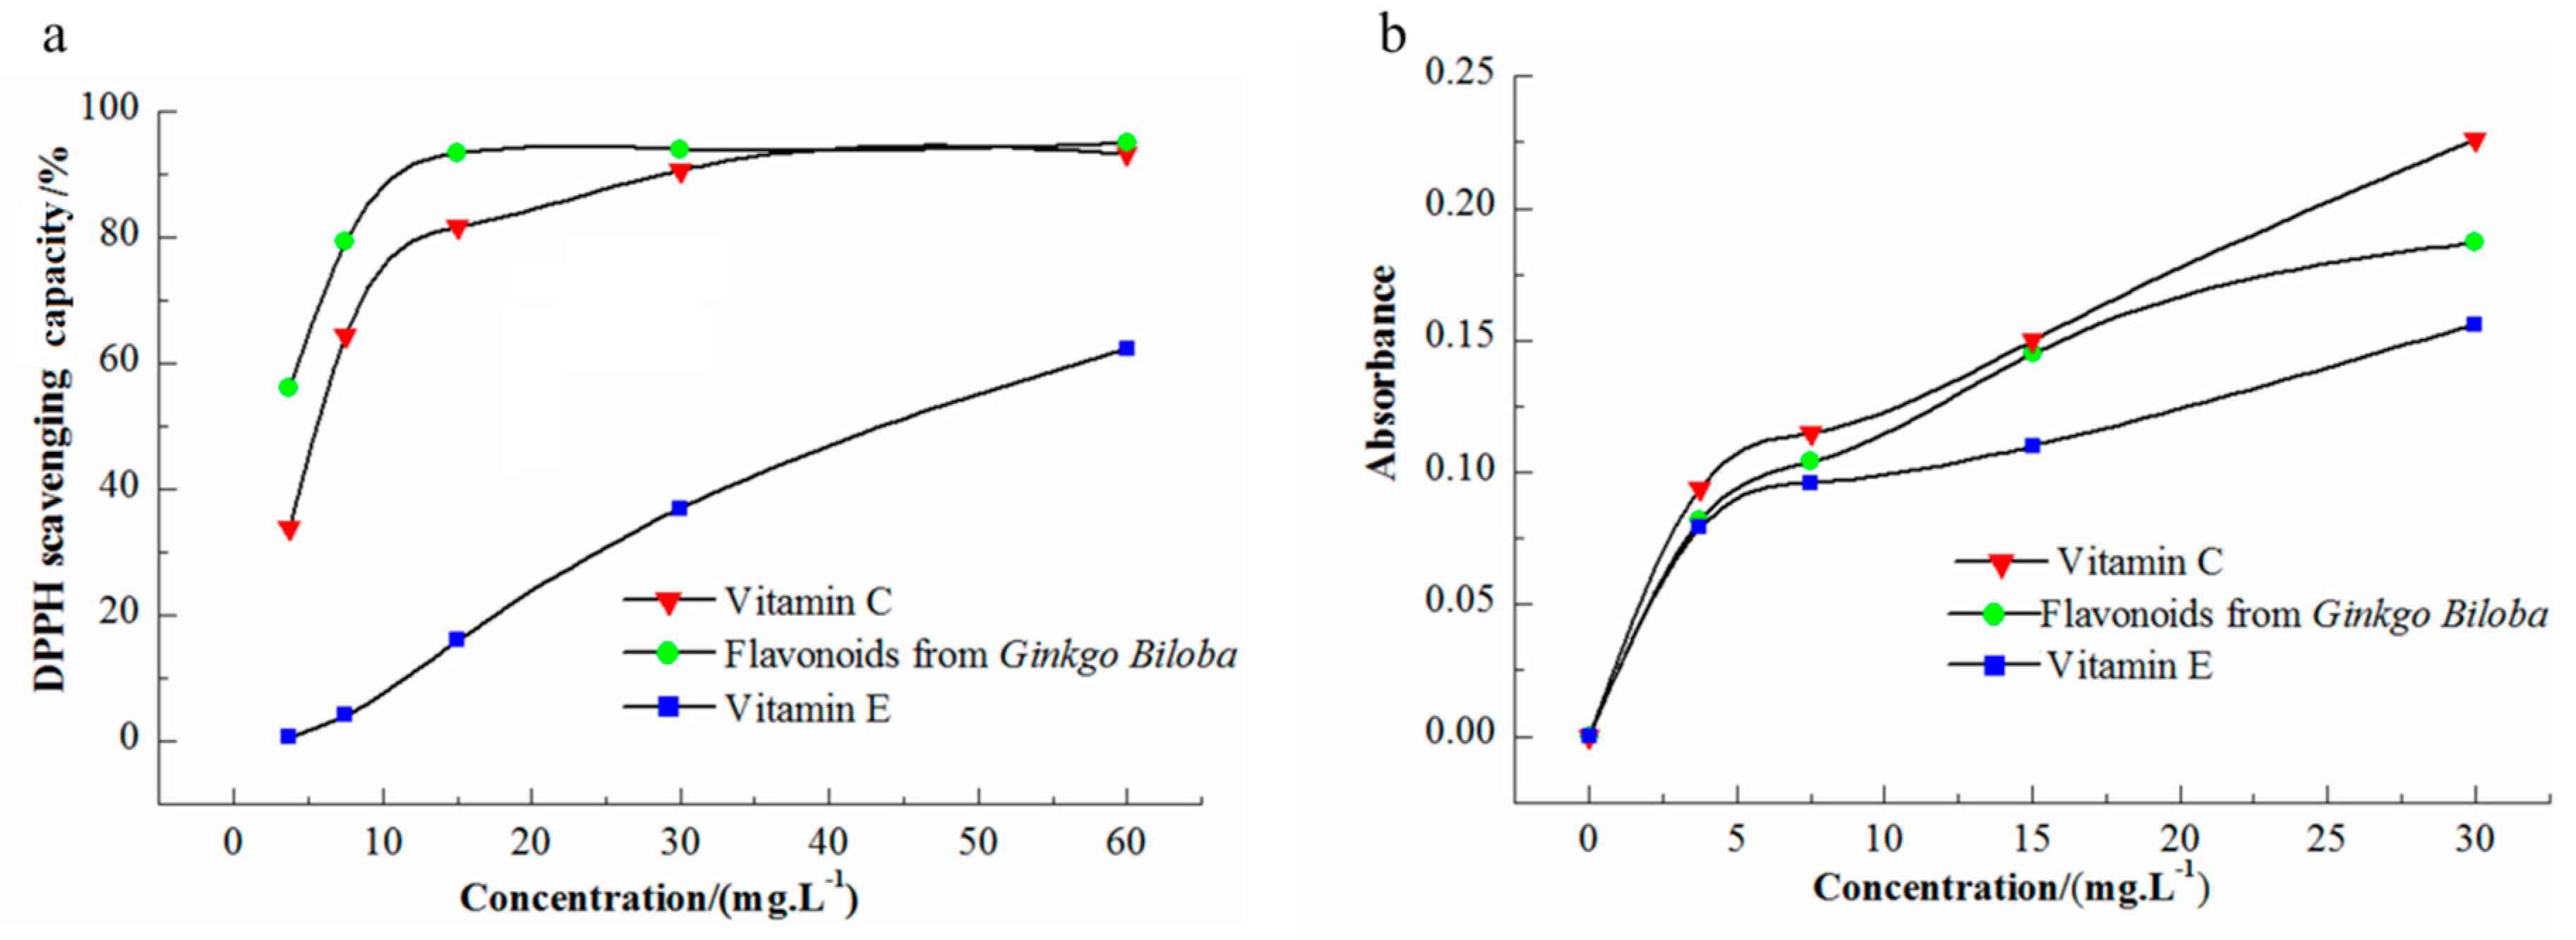
3.7. Antioxidant Activity

The in vitro antioxidant activity of Ginkgo flavonoids was evaluated using their DPPH scavenging ability and total reducing power. DPPH is a nitrogen-free radical and its solution in ethanol is purple. When the reductant pairs with the single electron in DPPH, the absorption of the characteristic peak at 517 nm is weakened and the purple color lightens; the free radical scavenging ability of the substance can be determined according to the change in the DPPH color. The DPPH scavenging experiment was compared with that of vitamin C, as shown in Figure 5a. As the concentration of flavonoids increased, the free radical scavenging rate of DPPH increased, indicating that Ginkgo flavonoids had antioxidant activity. The free radical scavenging rates of vitamin C and the flavonoids were fitted and analyzed using four-parameter logistic regression. The Ginkgo flavonoid IC50 was obtained (fitting degree R2 = 0.9987) as 2.66 mg L1, and the vitamin C IC50 was 5.39 mg L1 (fitting degree R2 = 0.9991). The results showed that Ginkgo flavonoids had strong scavenging ability toward the DPPH free radical. The base activity was stronger than that of vitamin C. The ability of different solvents to scavenge DPPH was also determined (Figure S2).
Potassium ferricyanide exhibits strong oxidization and is converted to potassium ferrocyanide after the reaction with a reducing agent. In acidic environments, the reaction of potassium ferrocyanide and iron trichloride produces ferric ferrocyanide (Fe4[Fe(CN)6]3), that is, Prussian blue [28]; its characteristic absorption peak is 700 nm. A greater absorbance at this wavelength represents a stronger reducibility of the reducing agent. The total reducing power of the samples and control products is shown in Figure 5b. In the concentration range 0–30 mg L1, the absorbance of Ginkgo flavonoids was between those of vitamin C and vitamin E, indicating that the total reducing power of Ginkgo flavonoids was higher than that of vitamin E, but lower than that of vitamin C, in the concentration range.

4. Conclusions

In this study, an aqueous two-phase extraction system for G. biloba flavonoids was initially established, and high-activity Ginkgo flavonoids were isolated. By response surface analysis, a regression model of PEG1500, concentration of (NH4)2SO4, liquid material ratio, and yield of Ginkgo flavonoids was established. The antioxidant capacity of the flavonoids was analyzed by DPPH free-radical scavenging. The results showed that when the concentration range of the flavonoids was between 3.75 and 60 mg L1, the IC50 value of DPPH scavenging was 2.66 mg L1; the activity was better than those of vitamin C and vitamin E, and the total reducing power experiment showed that the reducing power of Ginkgo flavonoids was lower than that of vitamin C, but higher than that of vitamin E. The flavonoids of G. biloba thus have antioxidant capacity.

Supplementary Materials

The following are available online at https://www.mdpi.com/2076-3417/8/11/2058/s1, Figure S1. PEG/(NH4)2SO4 systems became turbid (a) or became transparent (b), when (NH4)2SO4 solution or deionized water, respectively, was added. Figure S2. Effects of different solvents on the stability of Ginkgo flavonoids.

Author Contributions

Conceptualization, S.L. and L.Z.; data curation, X.W.; investigation, C.L.; writing—original draft preparation, C.L.; writing—review and editing, L.M.

Funding

This study was supported by the Scientific Research Project of the Beijing Educational Committee (No. SQKM201710020002), Beijing Natural Science Foundation (No.7174283).

Conflicts of Interest

The authors declare no conflict of interest.

References

  1. Chen, L.Q.; Li, C.S.; Chaloner, W.G.; Beerling, D.J.; Sun, Q.G.; Collinson, M.E.; Mitchell, P.L. Assessing the potential for the stomatal characters of extant and fossil ginkgo leaves to signal atmospheric CO2 change. Am. J. Bot. 2001, 88, 1309–1315. [Google Scholar] [CrossRef] [PubMed]
  2. Kleijnen, J.; Knipschild, P. Ginkgo biloba. Lancet 1992, 340, 1136–1139. [Google Scholar] [CrossRef]
  3. Dongen, M.V.; Rossum, E.V.; Kessels, A.; Sielhorst, H.; Knipschild, P. Ginkgo for elderly people with dementia and age-associated memory impairment: A randomized clinical trial. J. Clin. Epidemiol. 2003, 56, 367–376. [Google Scholar] [CrossRef]
  4. Le Bars, P.L.; Katz, M.M.; Berman, N.; Itil, T.M.; Freedman, A.M.; Schatzberg, A.F. A placebo-controlled, double-blind, randomized trial of an extract of ginkgo biloba for dementia. JAMA 1997, 278, 1327–1332. [Google Scholar] [CrossRef] [PubMed]
  5. Dekosky, S.T.; Williamson, J.D.; Fitzpatrick, A.L.; Kronmal, R.A.; Ives, D.G.; Saxton, J.A.; Lopez, O.L.; Burke, G.; Carlson, M.C.; Fried, L.P.; et al. Ginkgo biloba for prevention of dementia: A randomized controlled trial. JAMA 2008, 300, 2253–2262. [Google Scholar] [CrossRef] [PubMed]
  6. Beek, T.A.V. Chemical analysis of ginkgo biloba leaves and extracts. J. Chromatogr. A 2002, 967, 21–25. [Google Scholar] [CrossRef]
  7. Marcocci, L.; Maguire, J.J.; Droylefaix, M.T.; Packer, L. The nitric oxide-scavenging properties of ginkgo biloba extract egb 761. Biochem. Biophs. Res. Commun. 1994, 201, 748–755. [Google Scholar] [CrossRef]
  8. Marcocci, L.; Packer, L.; Droy-Lefaix, M.T.; Sekaki, A.; Gardès-Albert, M. Antioxidant action of ginkgo biloba extract egb 761. Methods Enzymol. 1994, 234, 462–475. [Google Scholar] [PubMed]
  9. Oyama, Y.; Fuchs, P.A.; Katayama, N.; Noda, K. Myricetin and quercetin, the flavonoid constituents of ginkgo biloba extract, greatly reduce oxidative metabolism in both resting and ca(2+)-loaded brain neurons. Brain Res. 1994, 635, 125–129. [Google Scholar] [CrossRef]
  10. Abdel-Kader, R.; Hauptmann, S.; Keil, U.; Scherping, I.; Leuner, K.; Eckert, A.; Müller, W.E. Stabilization of mitochondrial function by ginkgo biloba extract (egb 761). Pharmacol. Res. 2007, 56, 493–502. [Google Scholar] [CrossRef] [PubMed]
  11. Kleijnen, J.; Knipschild, P. Ginkgo biloba for cerebral insufficiency. Br. J. Clin. Pharmacol. 2012, 34, 352–358. [Google Scholar] [CrossRef]
  12. Cull, S.G.; Holbrey, J.D.; Vargasmora, V.; Seddon, K.R.; Lye, G.J. Room-temperature ionic liquids as replacements for organic solvents in multiphase bioprocess operations. Biotechnol. Bioeng. 2015, 69, 227–233. [Google Scholar] [CrossRef]
  13. Li, N.; Wang, Y.; Xu, K.; Huang, Y.; Wen, Q.; Ding, X. Development of green betaine-based deep eutectic solvent aqueous two-phase system for the extraction of protein. Talanta 2016, 152, 23–32. [Google Scholar] [CrossRef] [PubMed]
  14. Ma, F.Y.; Gu, C.B.; Li, C.Y.; Luo, M.; Wang, W.; Zu, Y.G.; Li, J.; Fu, Y.J. Microwave-assisted aqueous two-phase extraction of isoflavonoids from dalbergia odorifera t. Chen leaves. Sep. Purif. Technol. 2013, 115, 136–144. [Google Scholar] [CrossRef]
  15. Đorđević, T.; Antov, M. Ultrasound assisted extraction in aqueous two-phase system for the integrated extraction and separation of antioxidants from wheat chaff. Sep. Purif. Technol. 2017, 182, 52–58. [Google Scholar] [CrossRef]
  16. Zhang, Y.; Sui, D.Y.; Zhou, J.S.; Zhou, H.L. Microwave-assisted extraction and antihyperlipidemic effect of total flavonoids from corn silk. Afr. J. Biotechnol. 2011, 10, 14583–14586. [Google Scholar] [CrossRef]
  17. Chen, Y.J.; Wang, J.; Wan, D.R. Determination of total flavonoids in three sedum crude drugs by uv-vis spectrophotometry. Pharmacogn. Mag. 2010, 6, 259–263. [Google Scholar] [PubMed]
  18. Bauer, K.W.; Parnell, G.S.; Meyers, D.A. Response surface methodology as a sensitivity analysis tool in decision analysis. J. Multi-Crit. Decis. Anal. 2015, 8, 162–180. [Google Scholar] [CrossRef]
  19. Liu, X.; Ardo, S.; Bunning, M.; Parry, J.; Zhou, K.; Stushnoff, C.; Stoniker, F.; Yu, L.; Kendall, P. Total phenolic content and dpph radical scavenging activity of lettuce (lactuca sativa L.) grown in colorado. LWT Food Sci. Technol. 2007, 40, 552–557. [Google Scholar] [CrossRef]
  20. Mraihi, F.; Journi, M.; Chérif, J.K.; Sokmen, M.; Sokmen, A.; Trabelsiayadi, M. Phenolic contents and antioxidant potential of crataegus fruits grown in tunisia as determined by dpph, frap, and β-carotene/linoleic acid assay. J. Chem. 2013, 2013, 1–6. [Google Scholar] [CrossRef]
  21. Silvério, S.C.; Wegrzyn, A.; Lladosa, E.; Rodríguez, O.; Macedo, E.A. Effect of aqueous two-phase system constituents in different poly(ethylene glycol)–salt phase diagrams. J. Chem. Eng. Data 2012, 57, 1203–1208. [Google Scholar] [CrossRef]
  22. Glyk, A.; Scheper, T.; Beutel, S. Determination of aqueous two-phase system phase-forming components in the presence of bovine serum albumin. Anal. Biochem. 2014, 455, 10–12. [Google Scholar] [CrossRef] [PubMed] [Green Version]
  23. Wysoczanska, K.; Macedo, E.A. Influence of the molecular weight of peg on the polymer/salt phase diagrams of aqueous two-phase systems. J. Chem. Eng. Data 2016, 61, 4229–4235. [Google Scholar] [CrossRef]
  24. Glyk, A.; Scheper, T.; Beutel, S. Influence of different phase-forming parameters on the phase diagram of several peg–salt aqueous two-phase systems. J. Chem. Eng. Data 2014, 59, 850–859. [Google Scholar] [CrossRef]
  25. Liu, J.; Liu, C.; Rong, Y.; Huang, G.; Rong, L. Extraction of limonin from orange (citrus reticulata blanco) seeds by the flash extraction method. Solvent Extr. Res. Dev. 2012, 19, 137–145. [Google Scholar] [CrossRef]
  26. Zhong, K.; Wang, Q. Optimization of ultrasonic extraction of polysaccharides from dried longan pulp using response surface methodology. Carbohyd. Polym. 2010, 80, 19–25. [Google Scholar] [CrossRef]
  27. Ghaedi, M.; Khafri, H.Z.; Asfaram, A.; Goudarzi, A. Response surface methodology approach for optimization of adsorption of janus green b from aqueous solution onto zno/zn(oh) 2 -np-ac: Kinetic and isotherm study. Spectrochim. Acta A 2016, 152, 233–240. [Google Scholar] [CrossRef] [PubMed]
  28. Benzie, I.F.F.; Szeto, Y.T. Total antioxidant capacity of teas by the ferric reducing/antioxidant power assay. J. Agric. Food Chem. 1999, 47, 633–636. [Google Scholar] [CrossRef] [PubMed]
Figure 1. Calibration curve for total flavonoid content test.
Applsci 08 02058 g001
Figure 2. Phase diagrams of different molecular weight PEG/(NH4)2SO4 aqueous two-phase systems.
Applsci 08 02058 g002
Figure 3. Effects of polyethylene glycol (PEG) and (NH4)2SO4 concentrations on partition coefficient and recovery of flavonoids in an aqueous two-phase system. (a) The effects of PEG1500 on the phase-volume ratio and partition coefficient, (b) the effects of PEG1500 on recovery of flavonoids, (c) the effects of (NH4)2SO4 on the phase-volume ratio, (d) the effects of (NH4)2SO4 on recovery of flavonoids.
Applsci 08 02058 g003
Figure 4. Interactive effects of any two factors on the yield of total flavonoids. (a) PEG1500 concentration (X1) and (NH4)2SO4 concentration (X2), (b) PEG1500 concentration (X1) and aqueous two-phase system (ATPS) solvent volume/leaf mass ratio (X3), and (c) (NH4)2SO4 (X2) and ATPS solvent volume/leaf mass ratio (X3).
Applsci 08 02058 g004
Figure 5. (a) 1,1-diphenyl-2-picrylhydrazyl (DPPH) scavenging ability and (b) total reducing power of flavonoids from Ginkgo biloba leaf.
Applsci 08 02058 g005
Table 1. Parameters and levels for Box–Behnken design. PEG: polyethylene glycol.
SymbolVariableRange and Level
−101
X1PEG1500 concentration (w/w %)122130
X2(NH4)2SO4 concentration (w/w %)1523.532
X3ATPS solvent volume/leaf mass ratio (v/w mL/g)1527.540
Table 2. Experimental design and results for response surface analysis.
RUNX1
(w/w %)
X2
(w/w %)
X3
(mL g1)
Y
(mg g1)
1−10−12.37
20−1−13.46
3−1013.80
40−113.81
5−1102.70
60113.59
71014.14
810−13.54
91103.62
1001−12.68
110003.75
120003.48
130003.37
141−103.89
150003.38
16−1−103.11
170003.38
Table 3. Analysis of variance (ANOVA) for the quadratic model.
SourceSum of SquaresdfMean SquareF Valuep-Value Prob > FSignificance
Model3.3190.3713.30.0013**
X11.2911.2946.650.0002**
X20.3510.3512.810.009**
X31.3511.3549.010.0002**
X1X24.70 × 10−314.70 × 10−30.170.6925
X1X30.1710.176.210.0414*
X2X30.07610.0762.740.1419
X124.01 × 10−314.01 × 10−30.150.7144
X220.05110.0511.850.2161
X322.06 × 10−312.06 × 10−30.0750.7925
Residual0.1970.028
Lack of Fit0.08830.0291.110.442Not significant
Pure Error0.1140.026
Cor Total3.516
R20.9447
C.V.4.86
Note: * p-value less than 0.05 indicates statistical significance; ** p-value less than 0.01 indicates statistically extreme significance.

