Research on the Transportation of Low-Strength Composites Sheets


Abstract
:
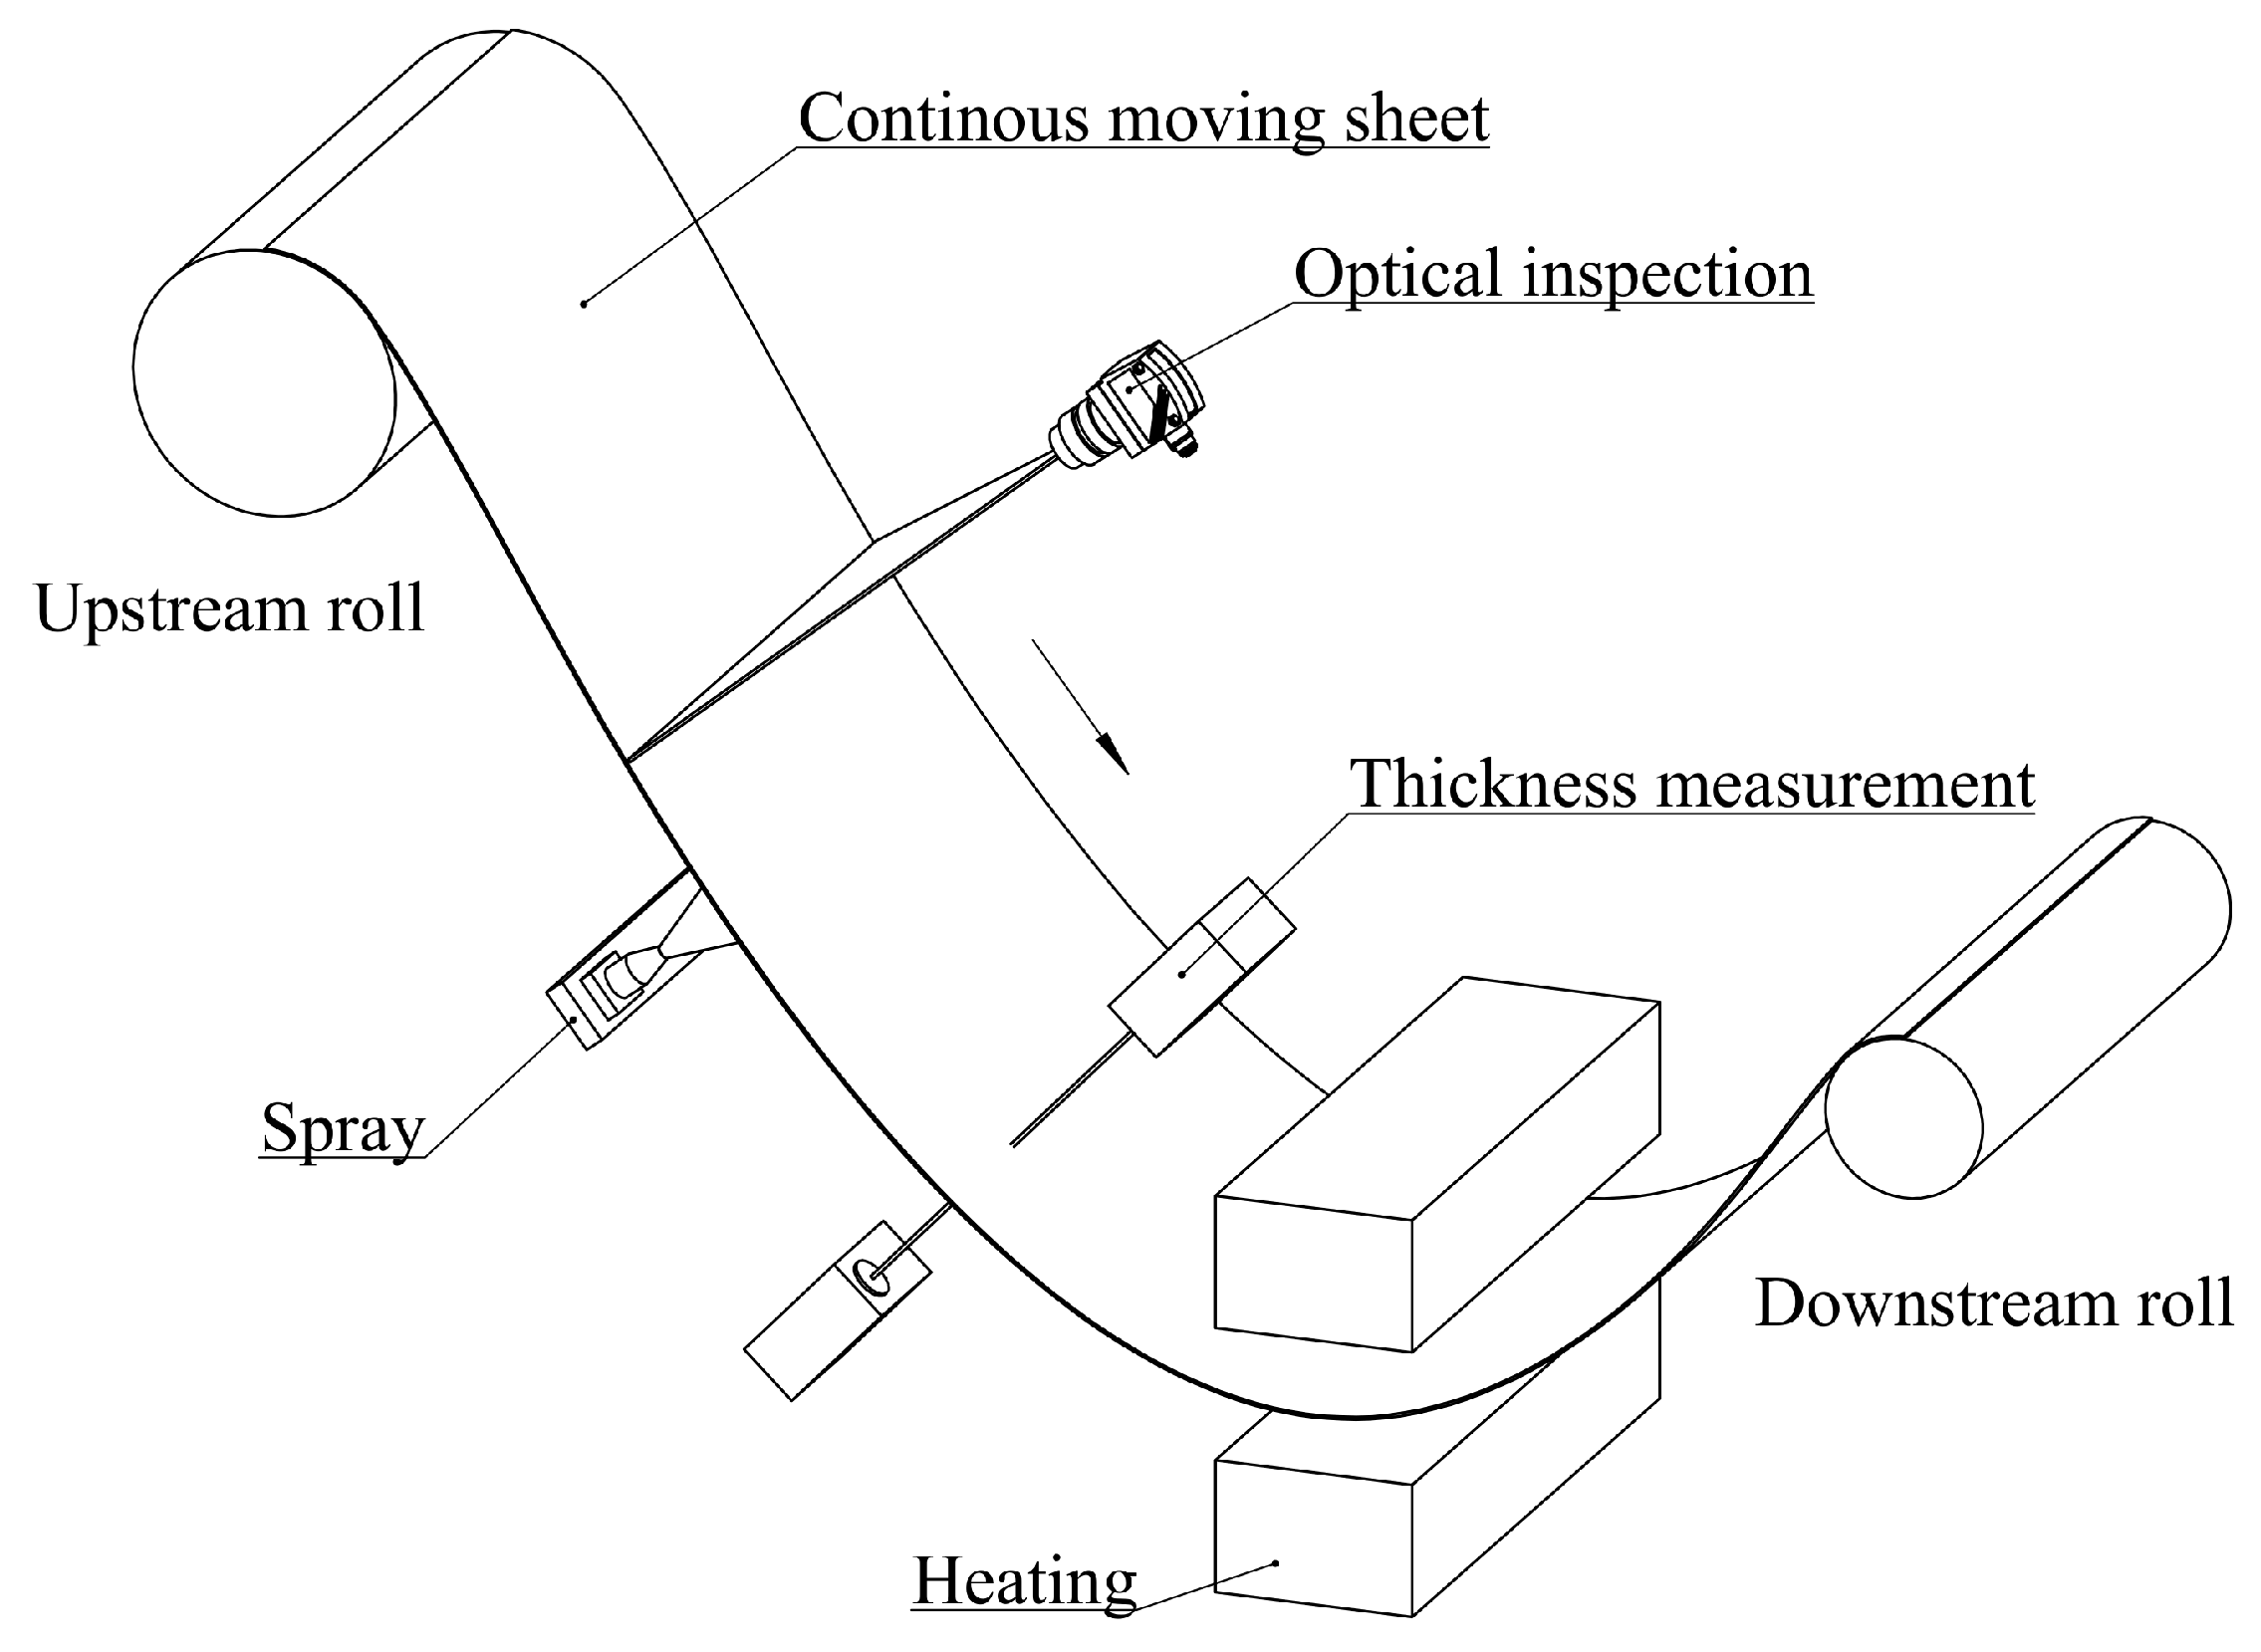
1. Introduction
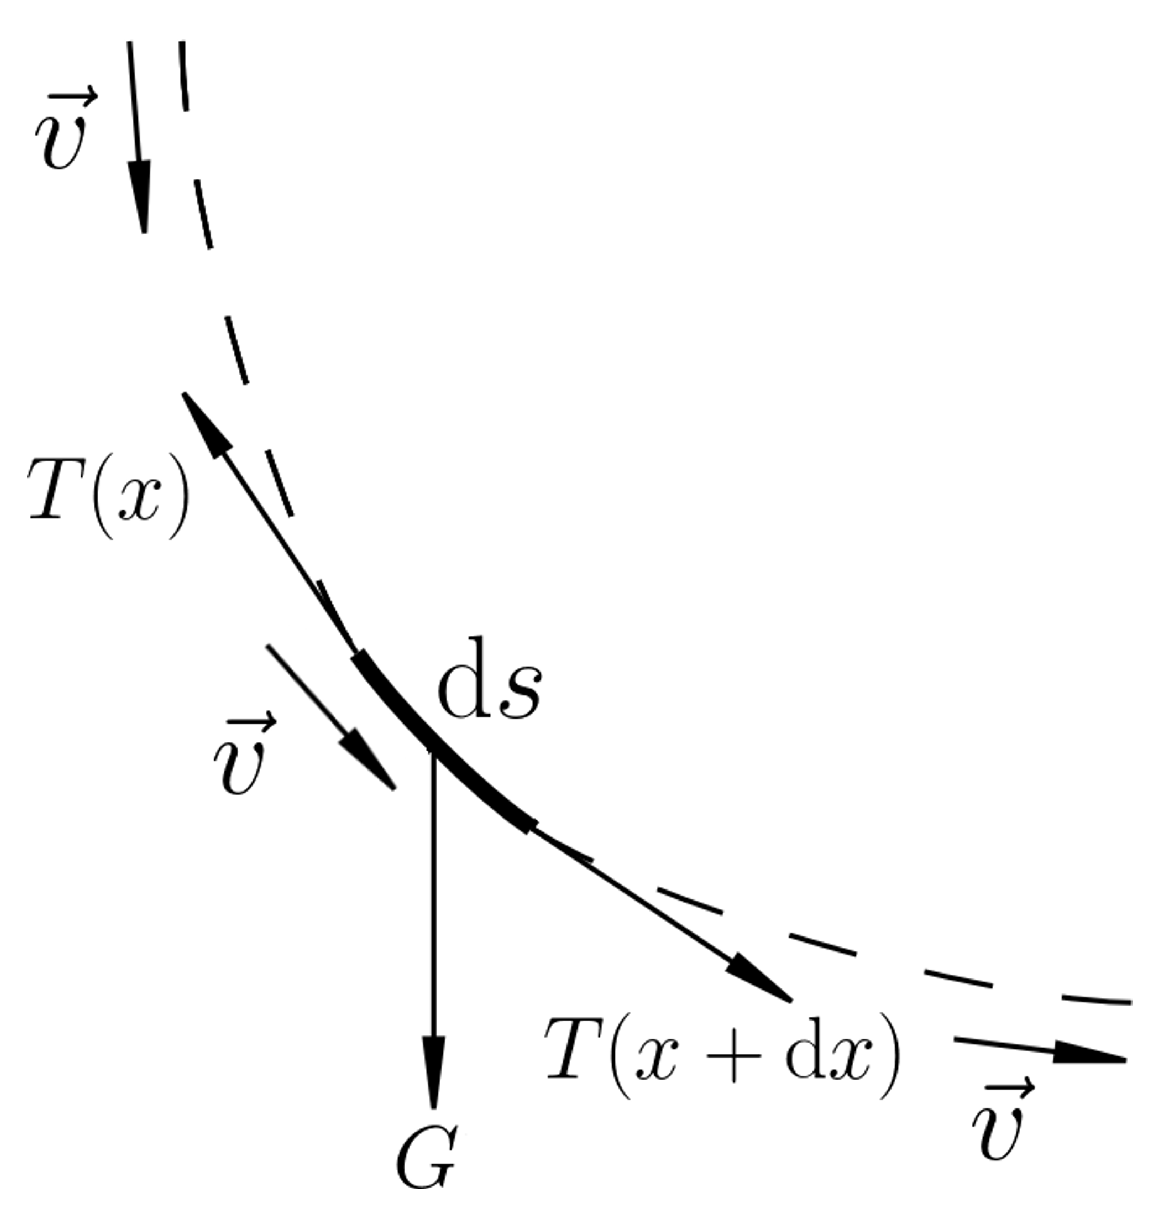
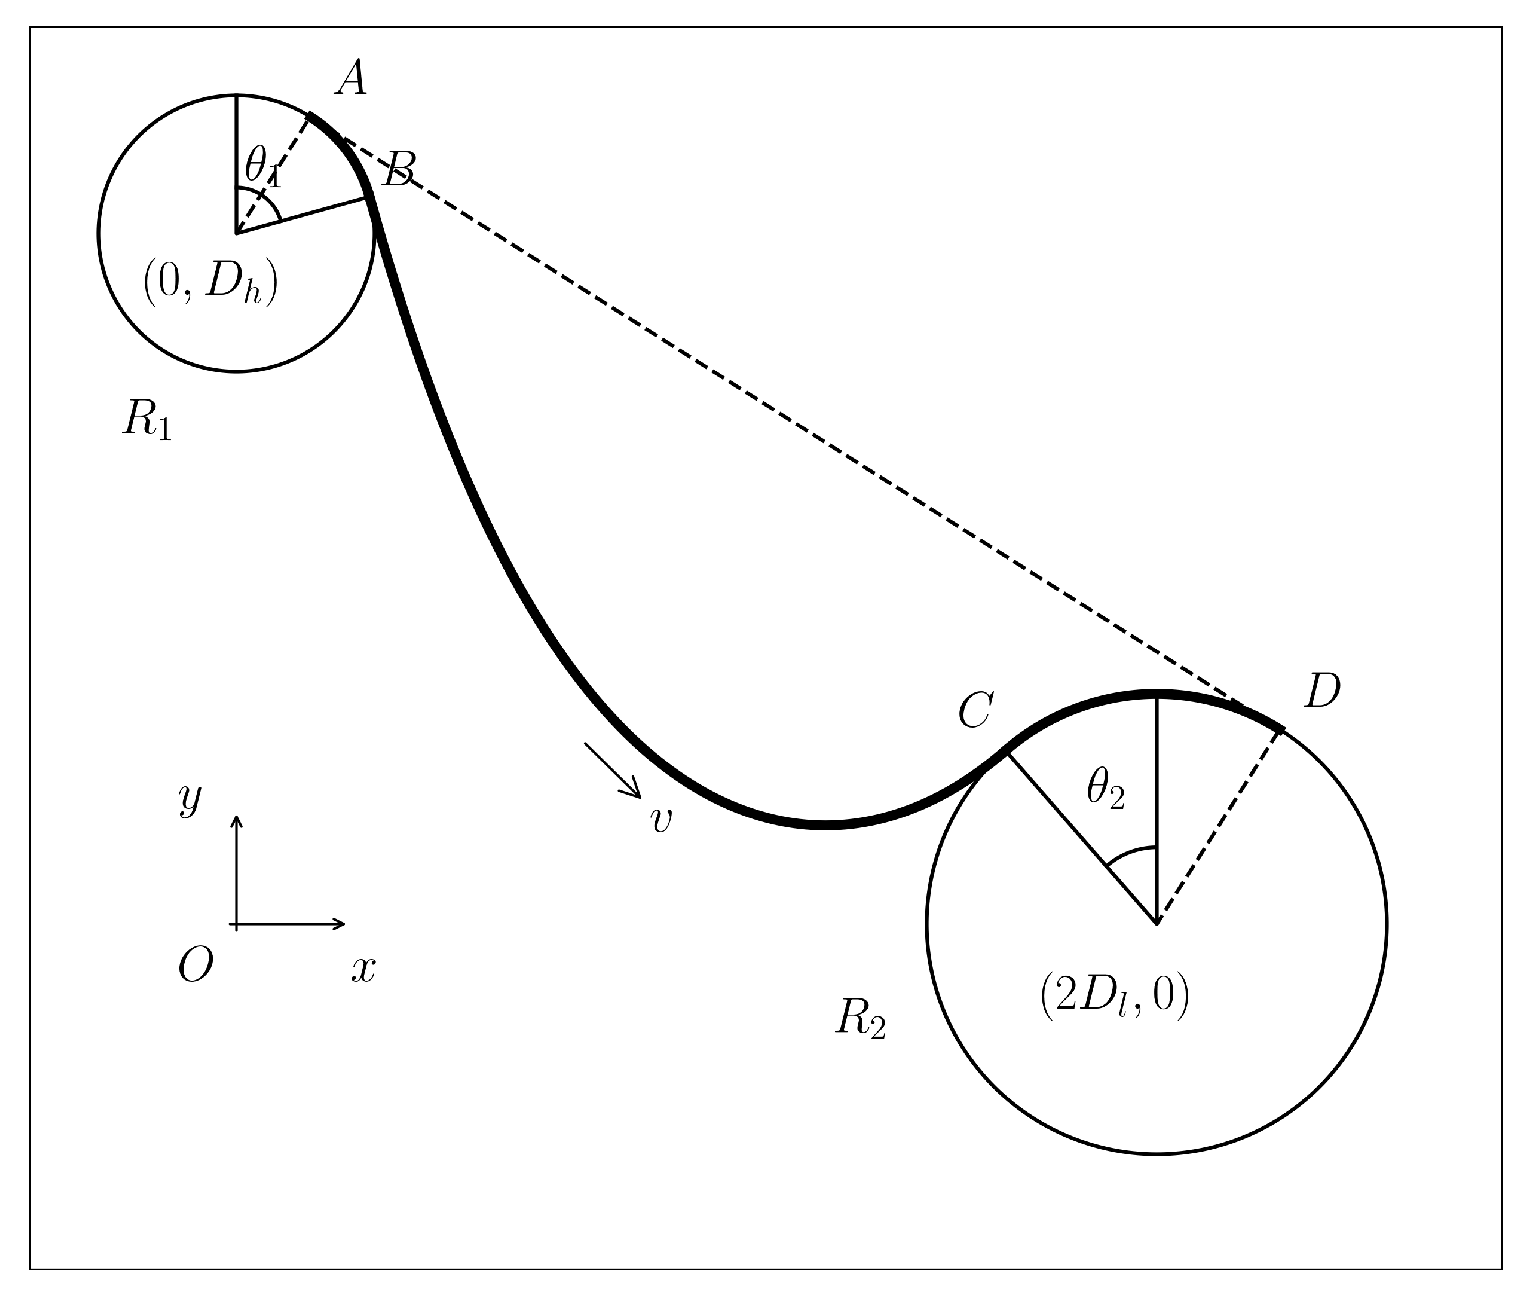
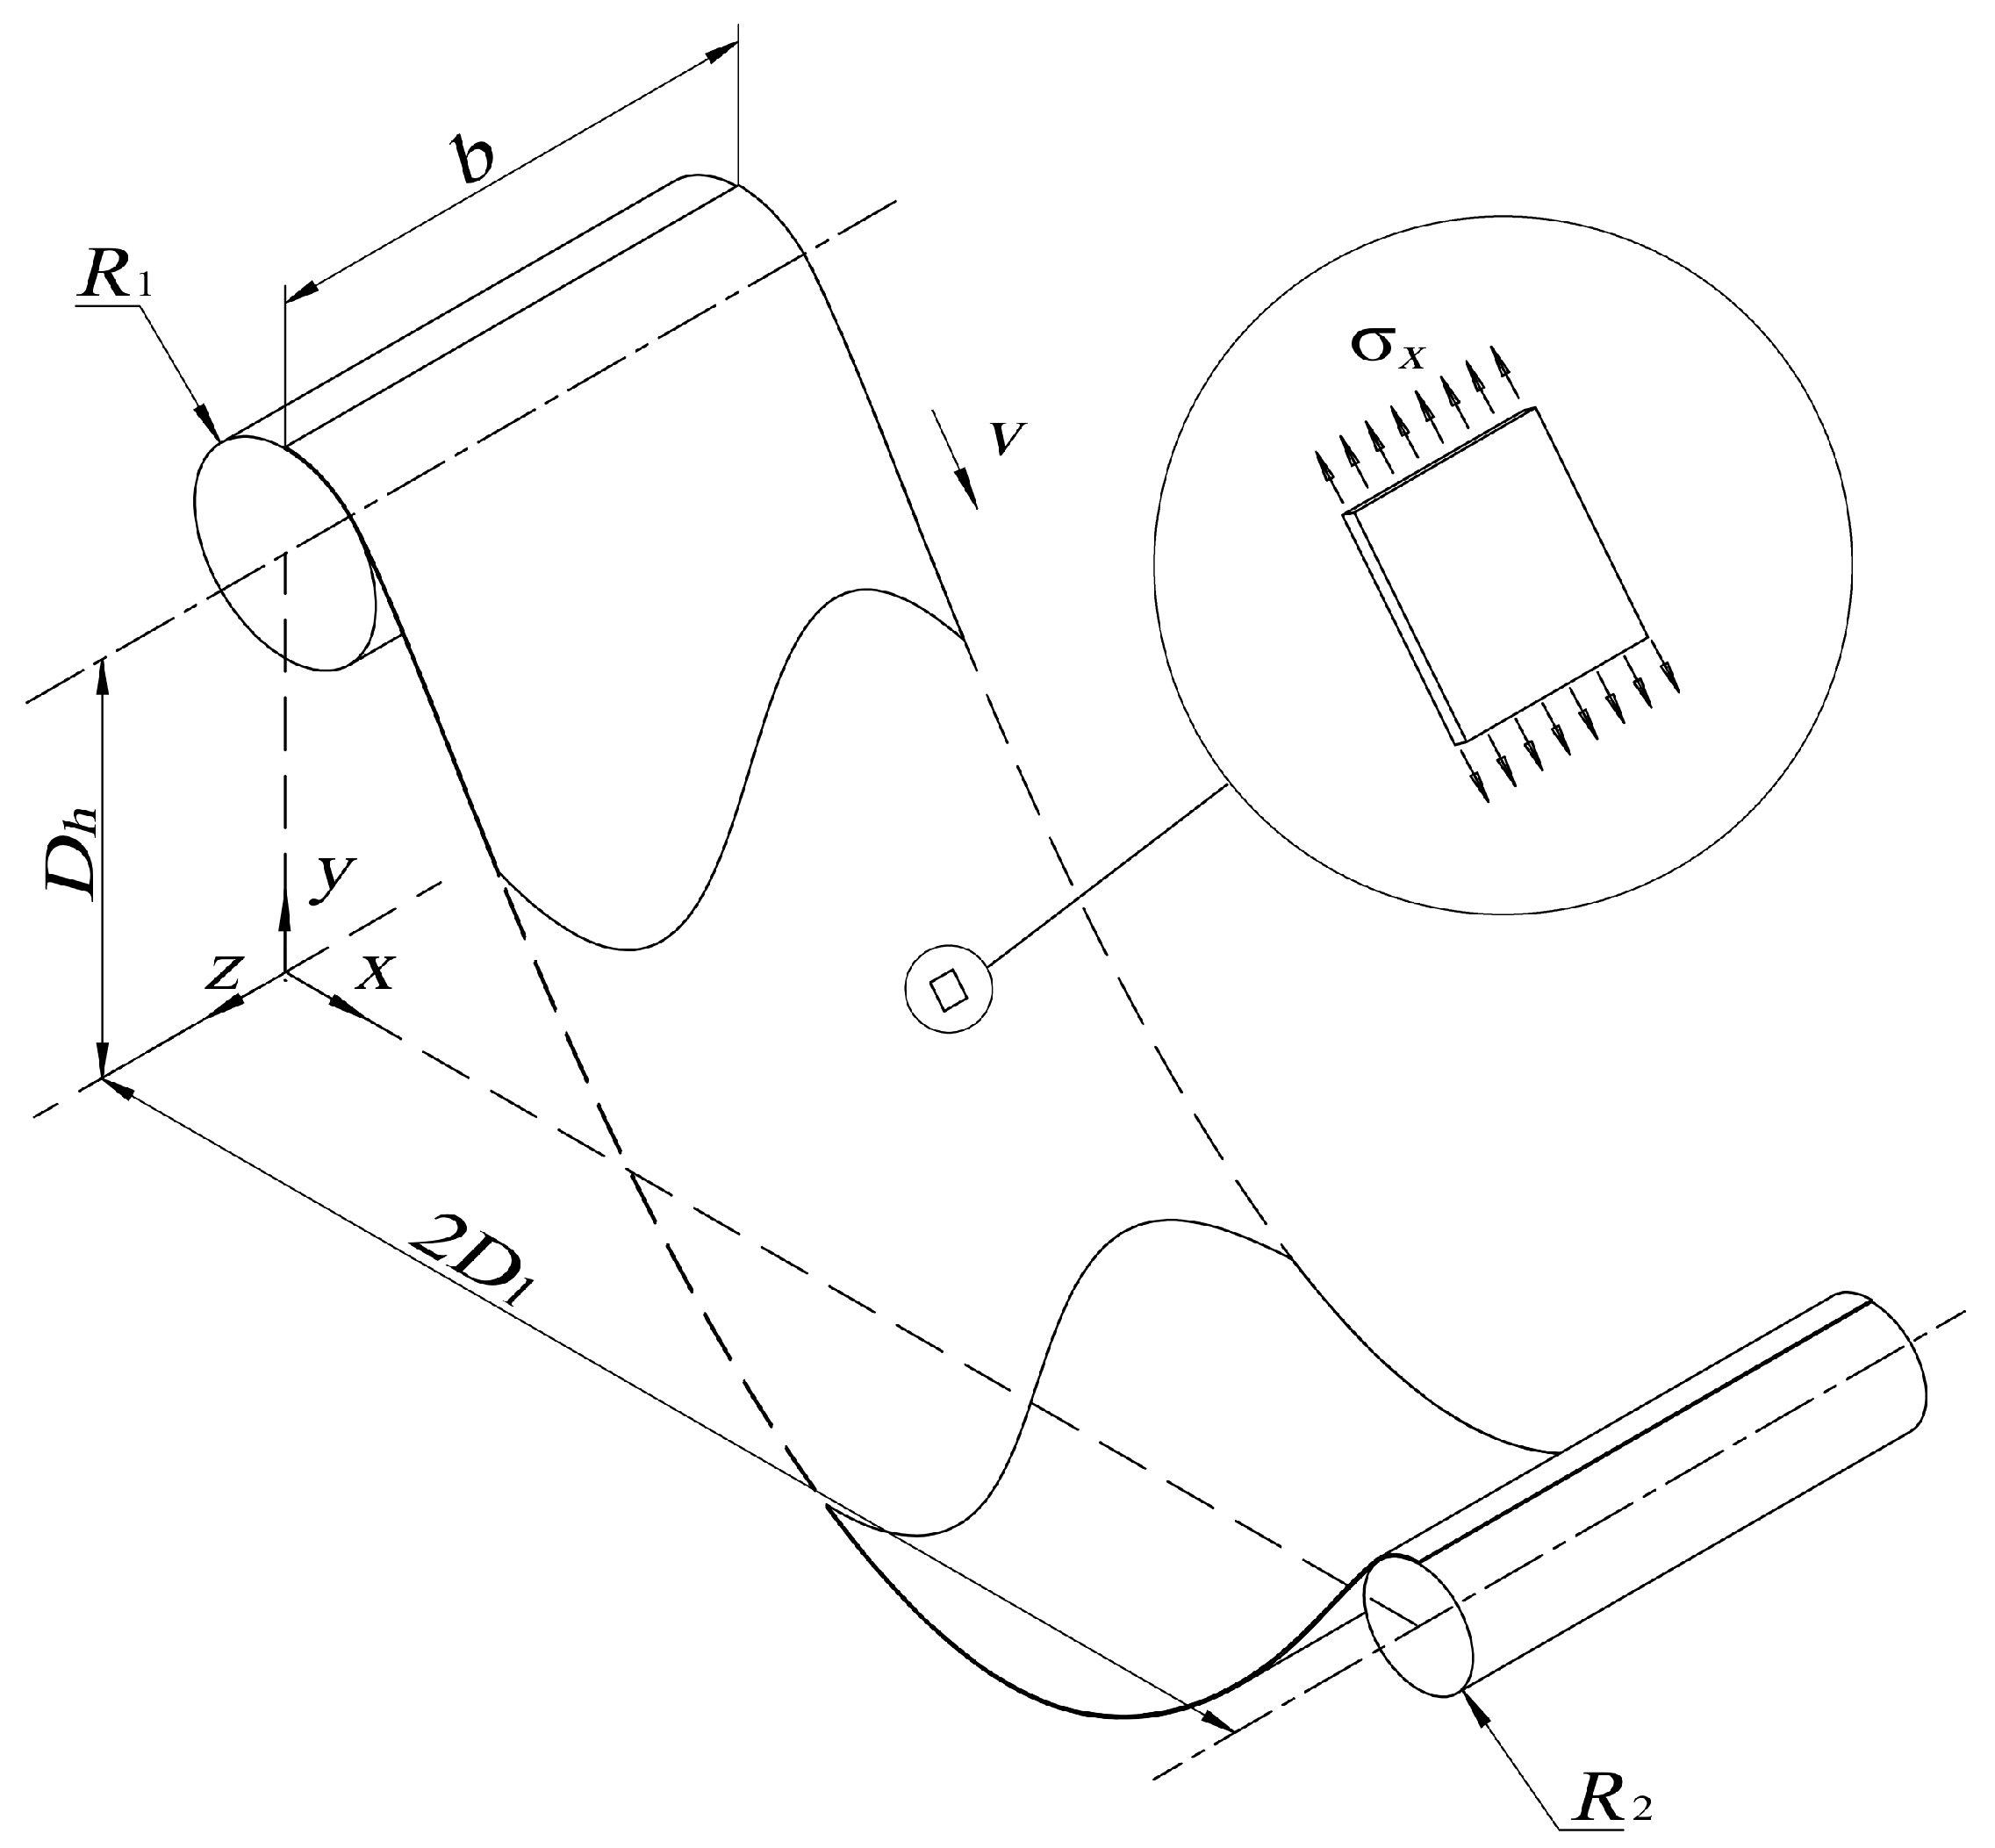
2. Problem Formulation
3. Problem Solution
| Algorithm 1 Calculate when given . |
| Require: |
| Calculate |
| Calculate with Equation (17) |
| Find minimize Equation (15) with as the initial value and factor as the initial step |
| return |
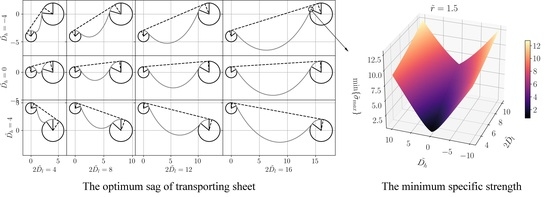
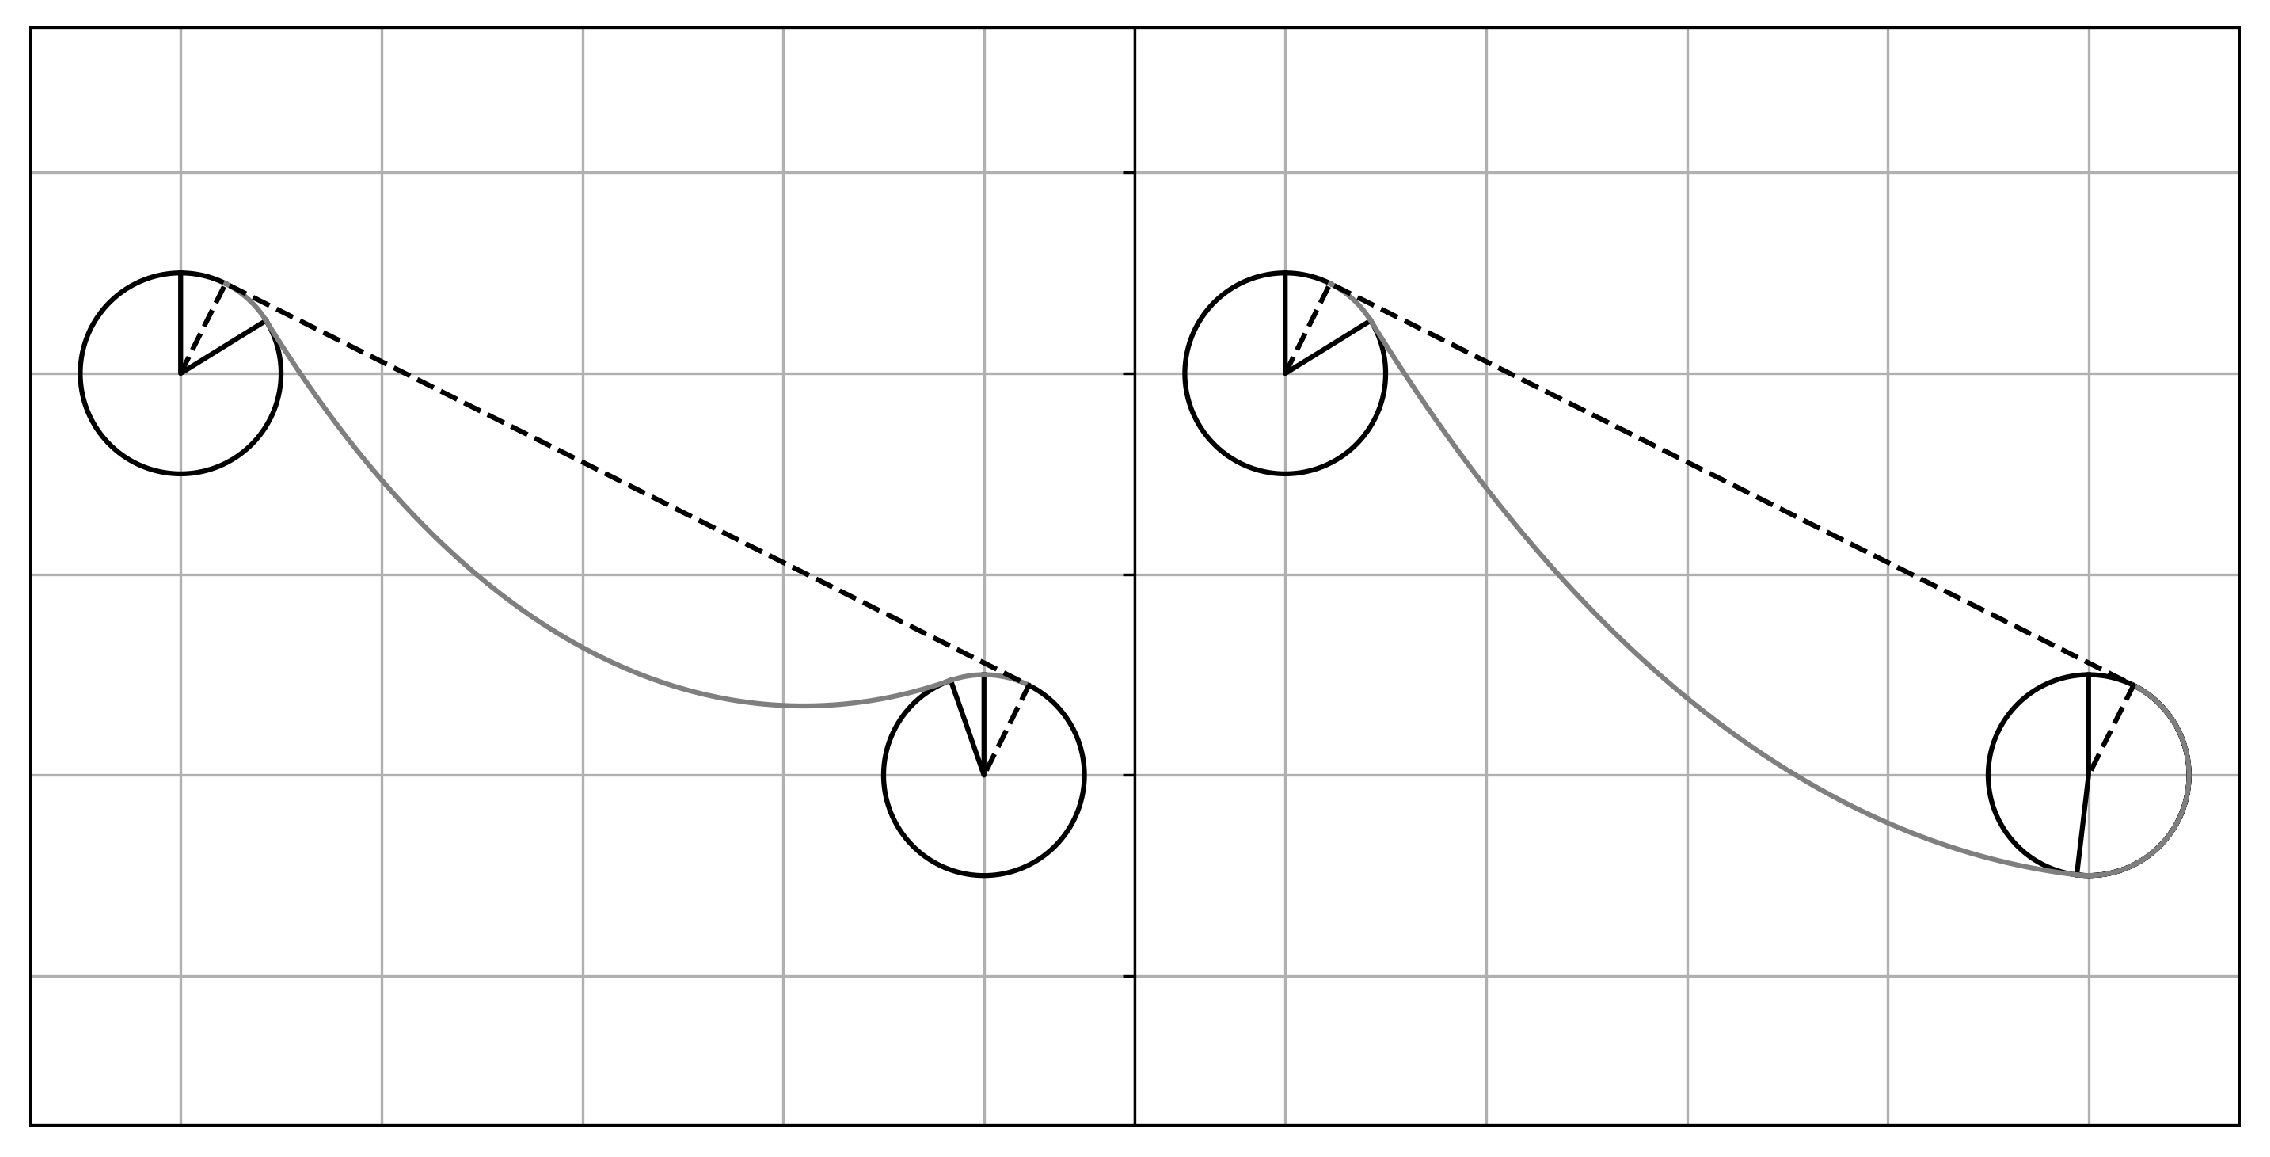
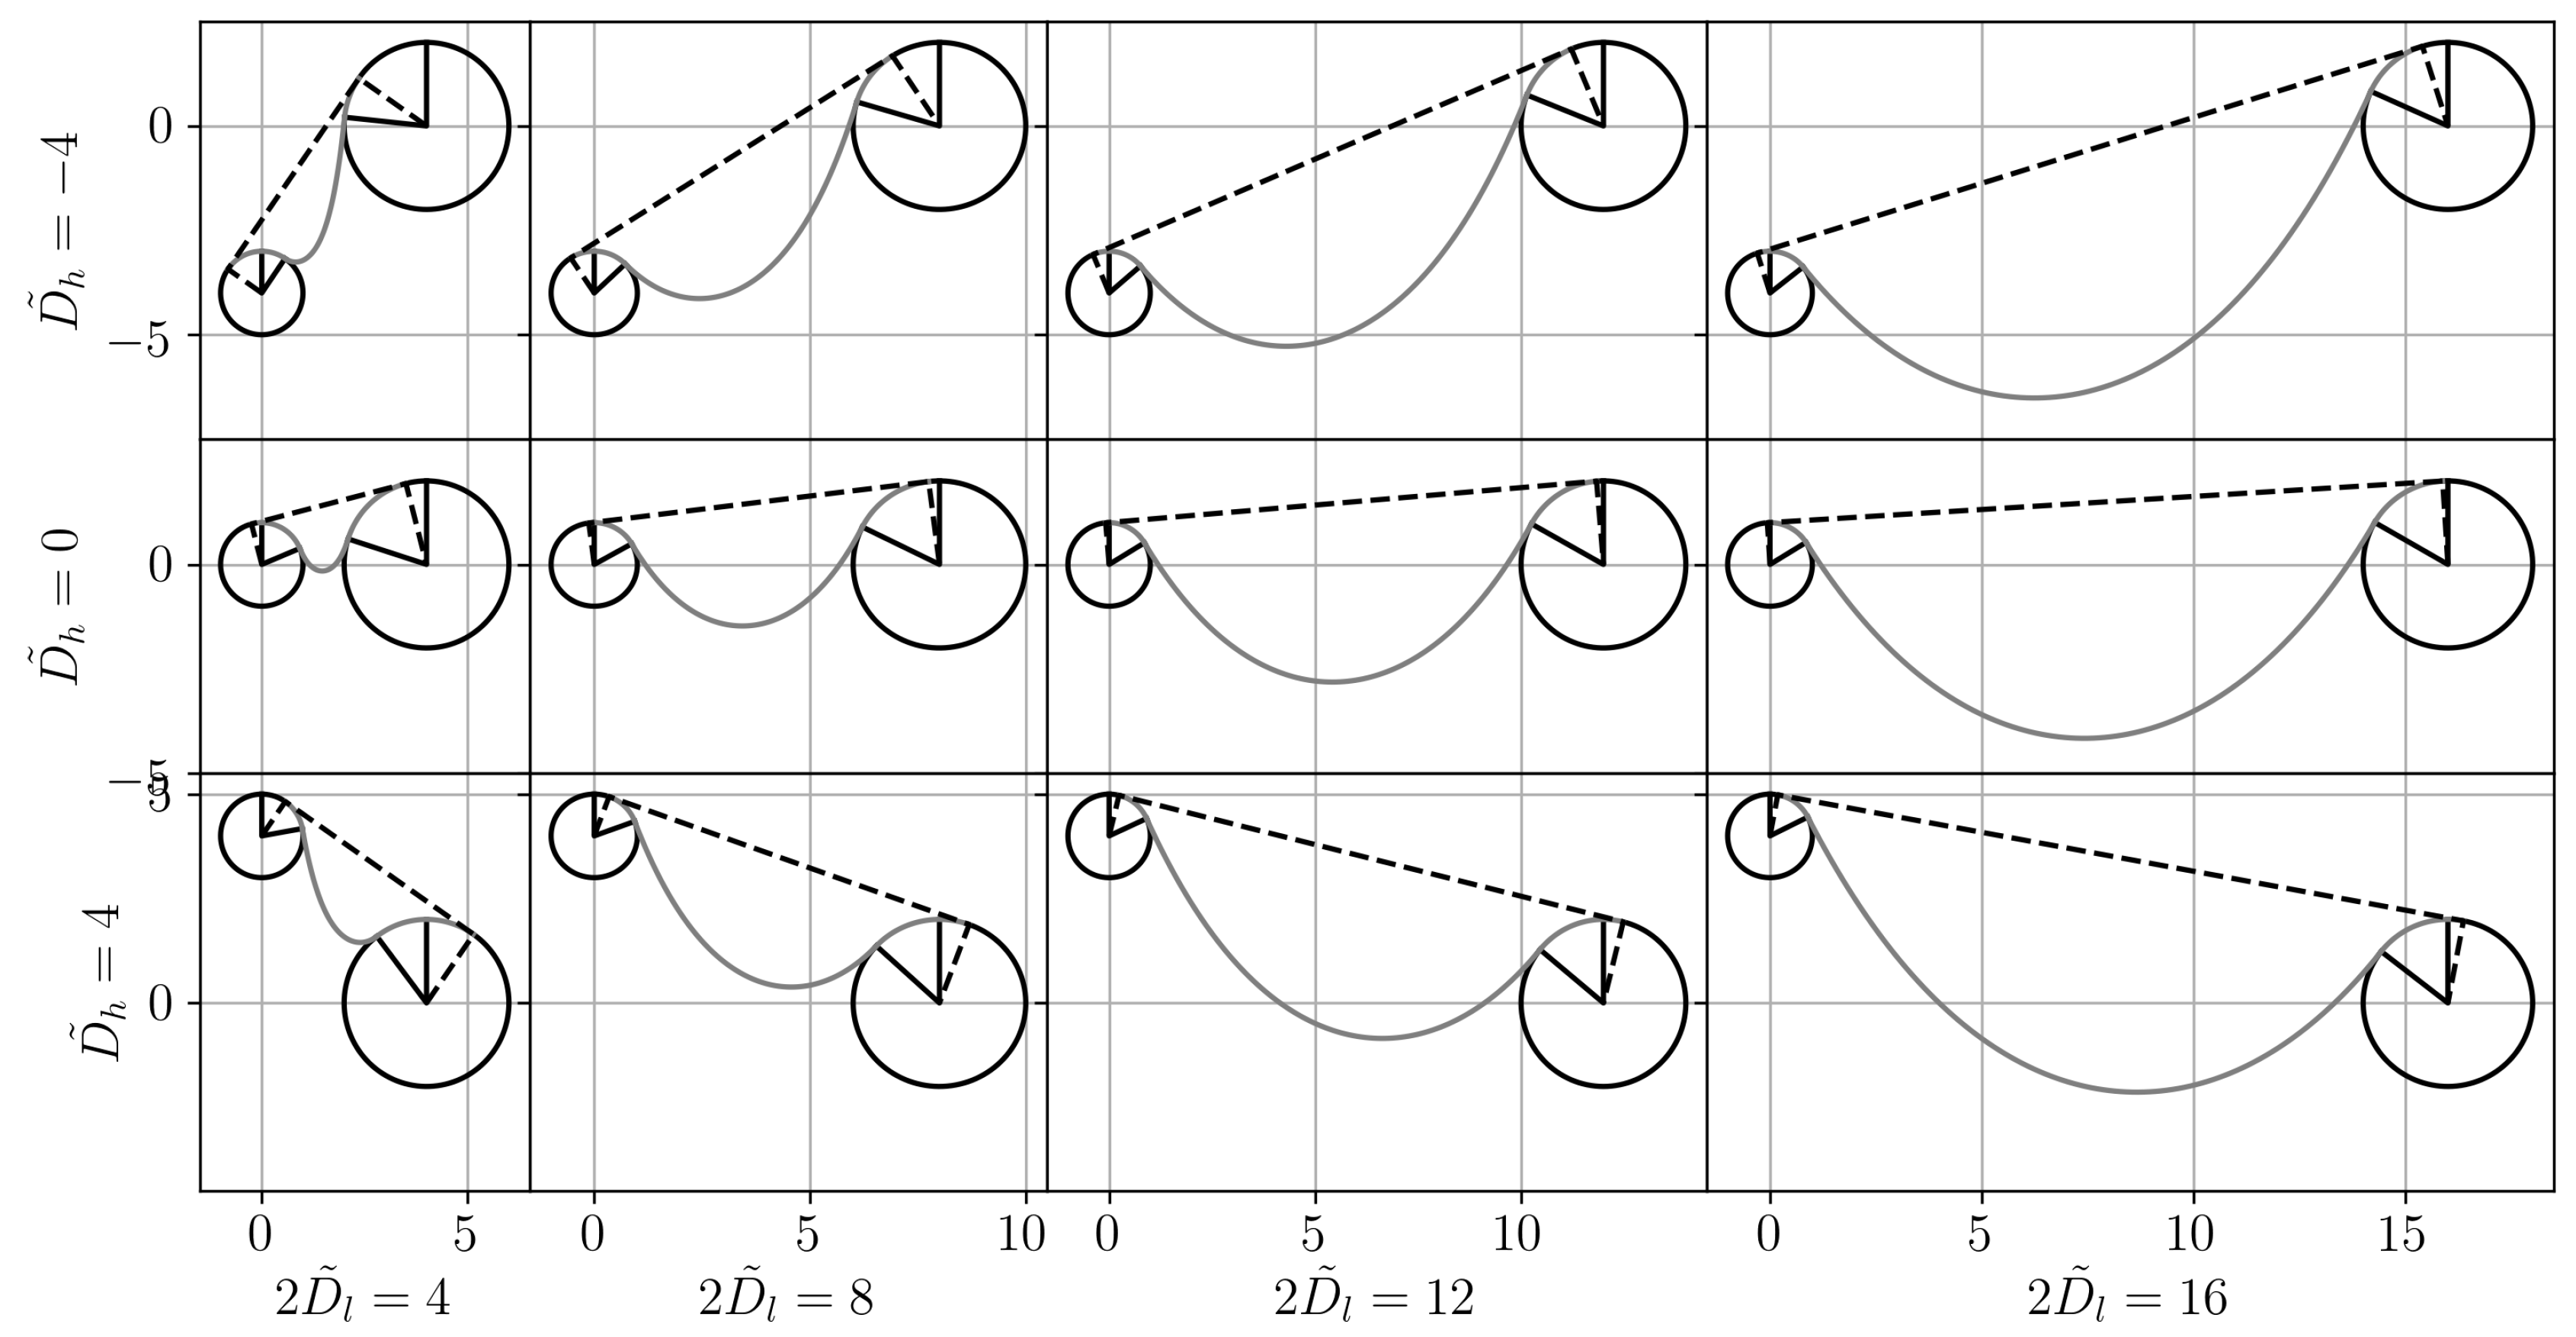
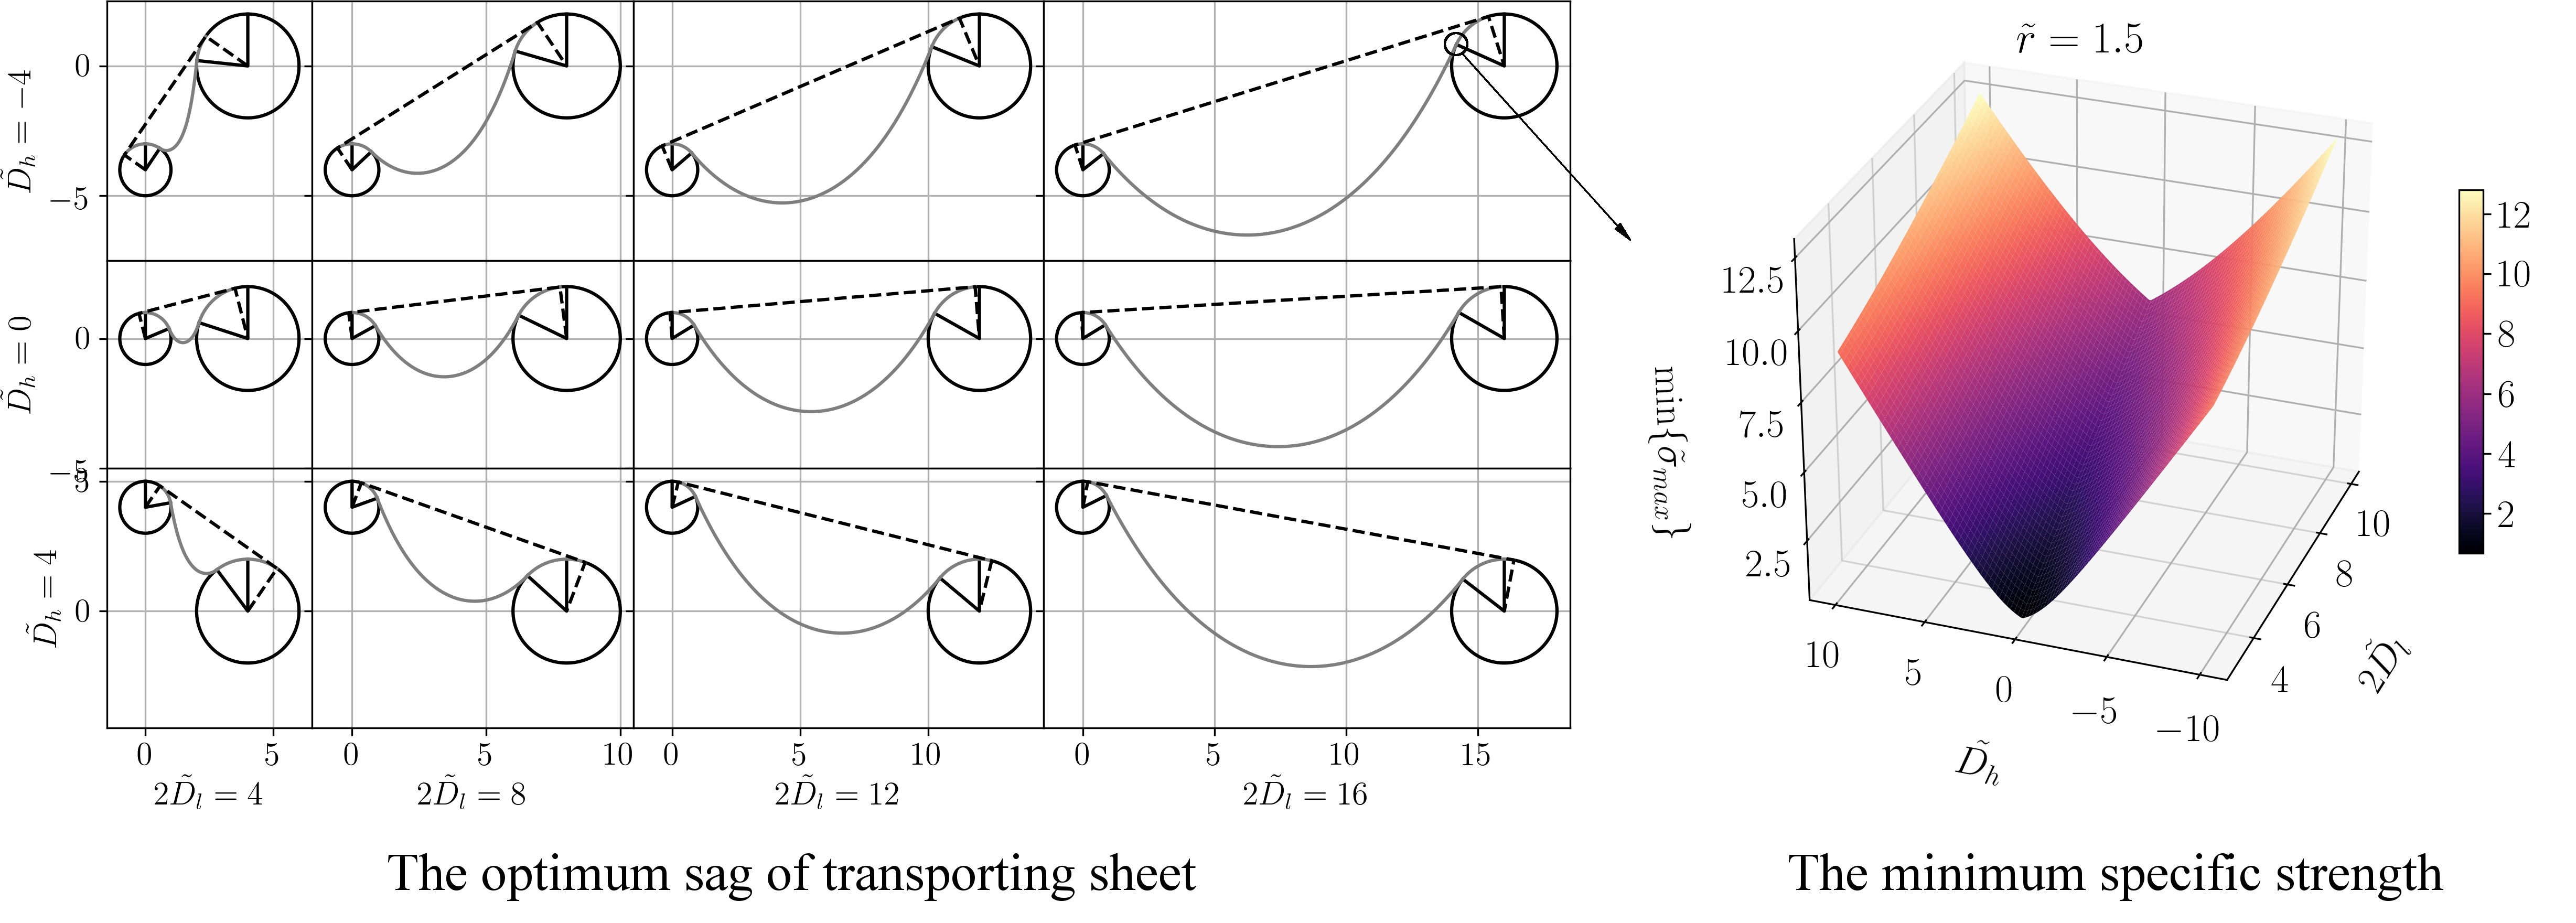
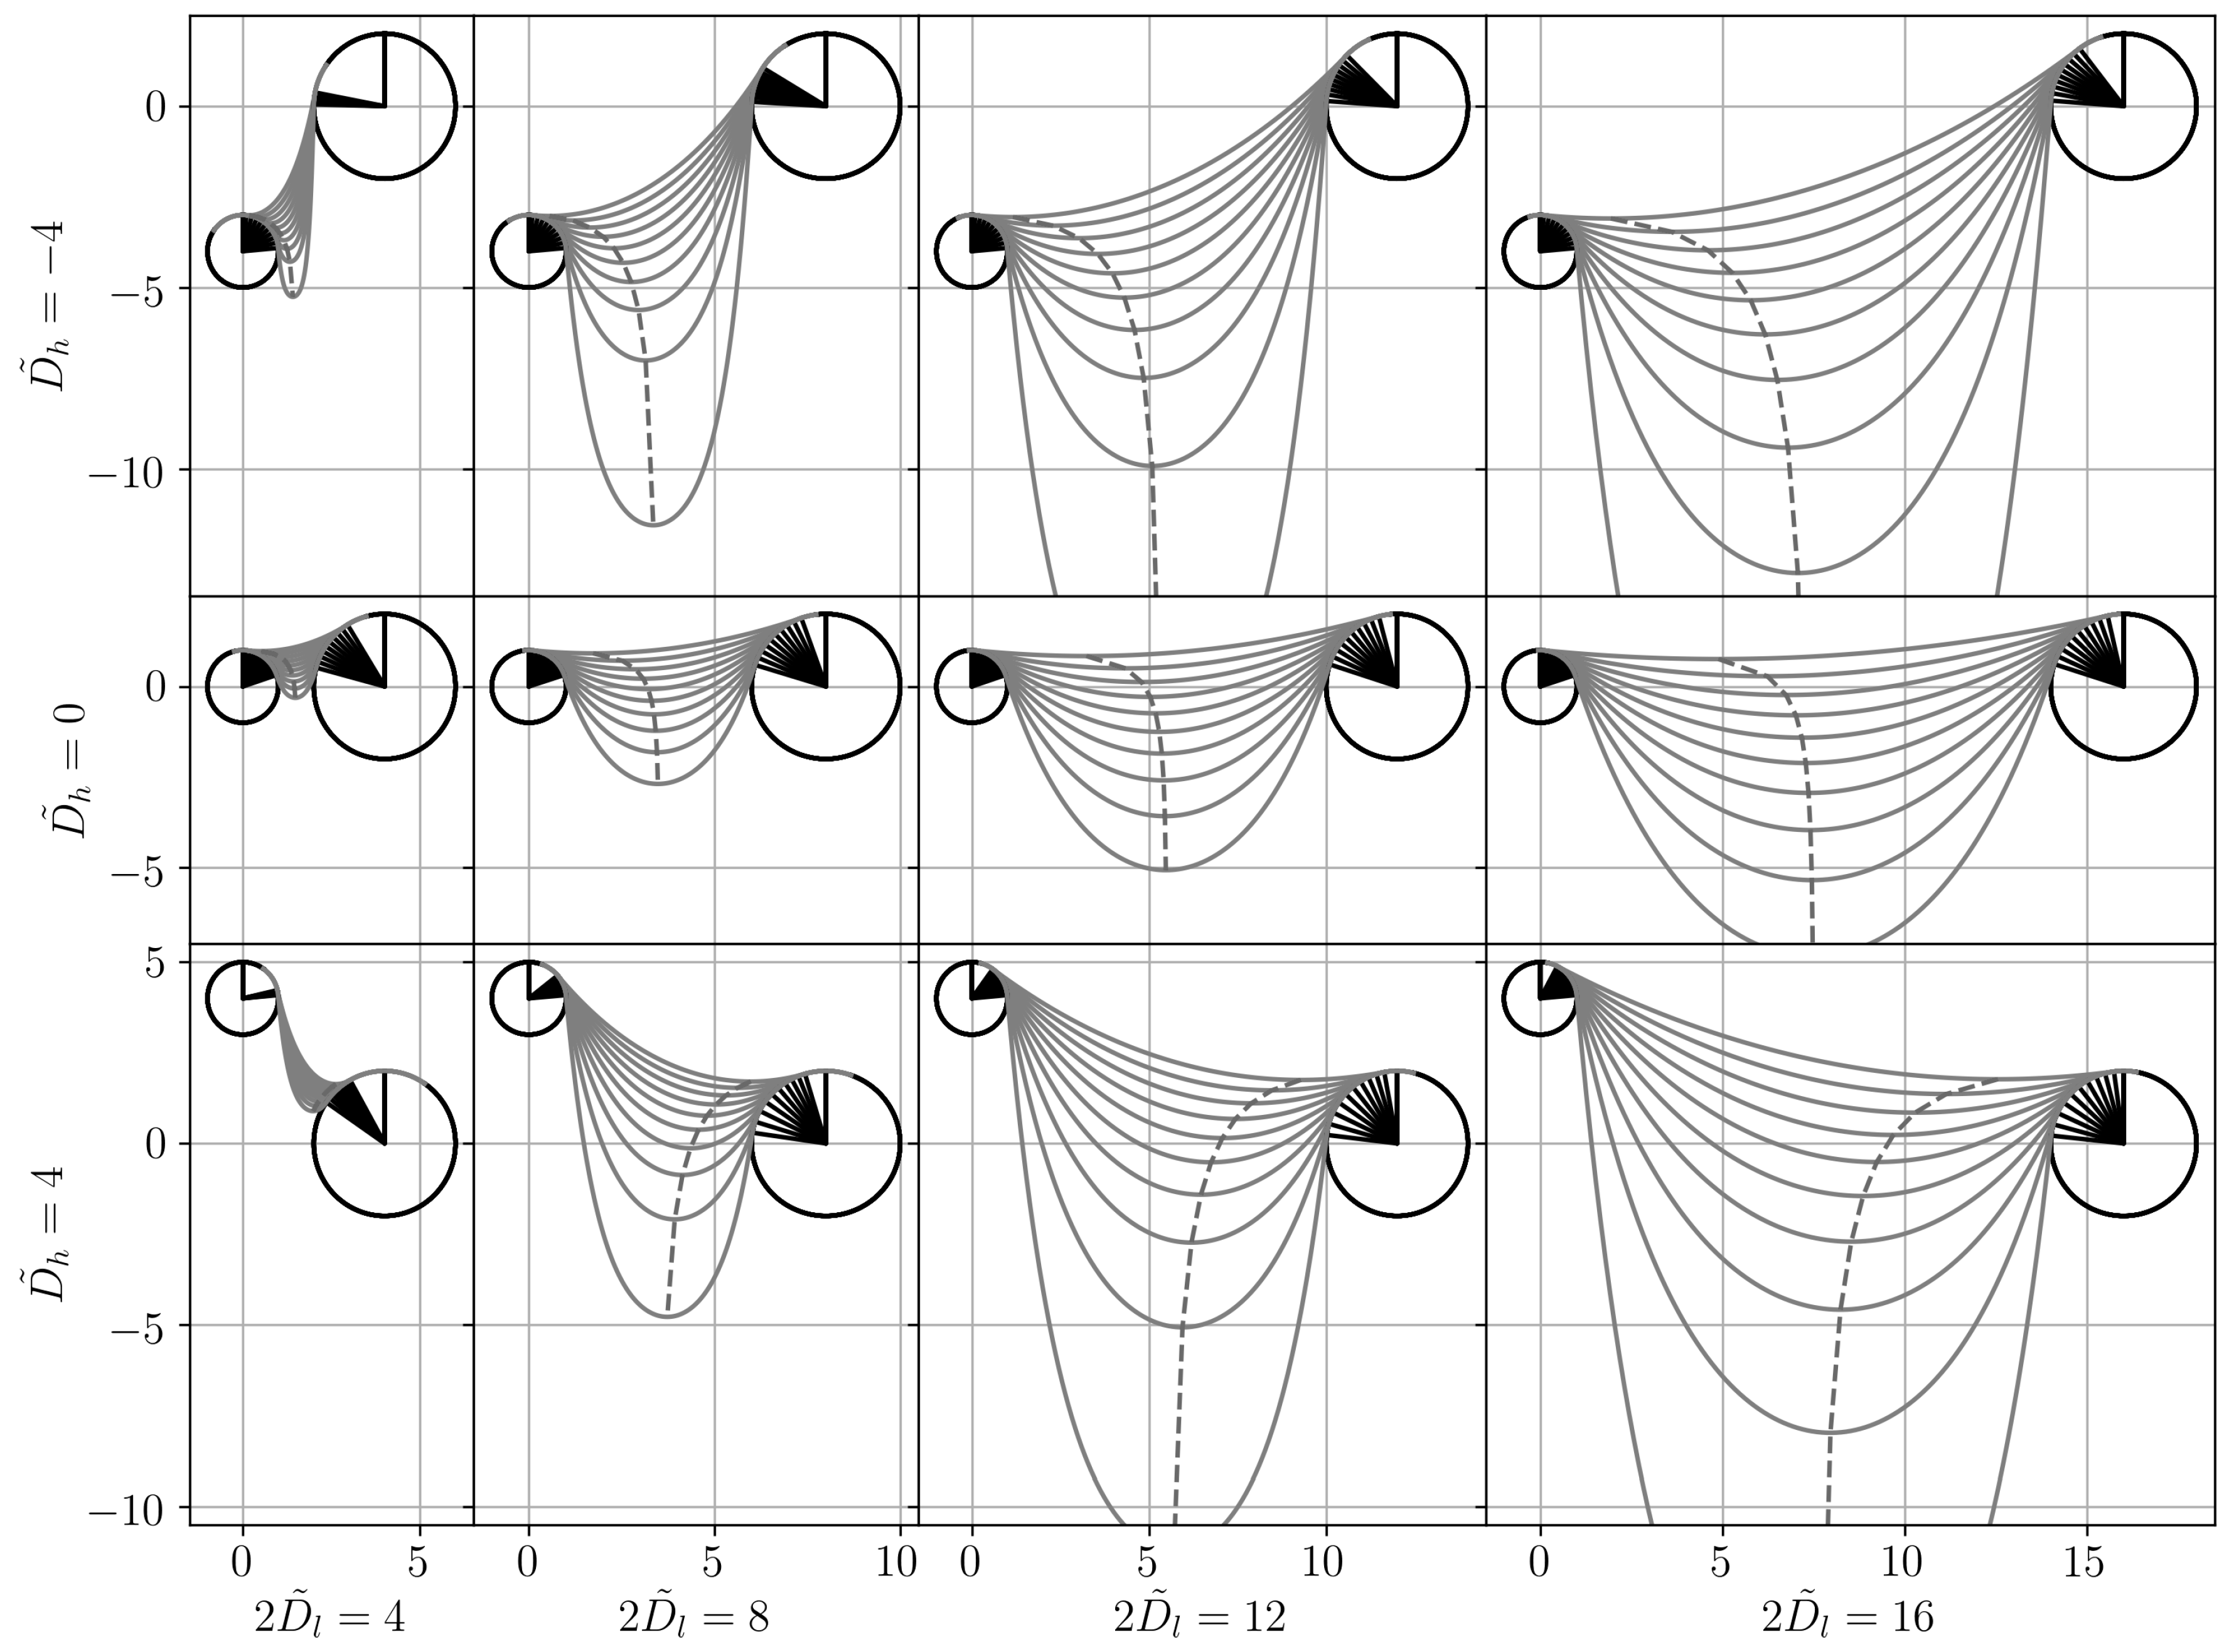
4. The Optimal Sag
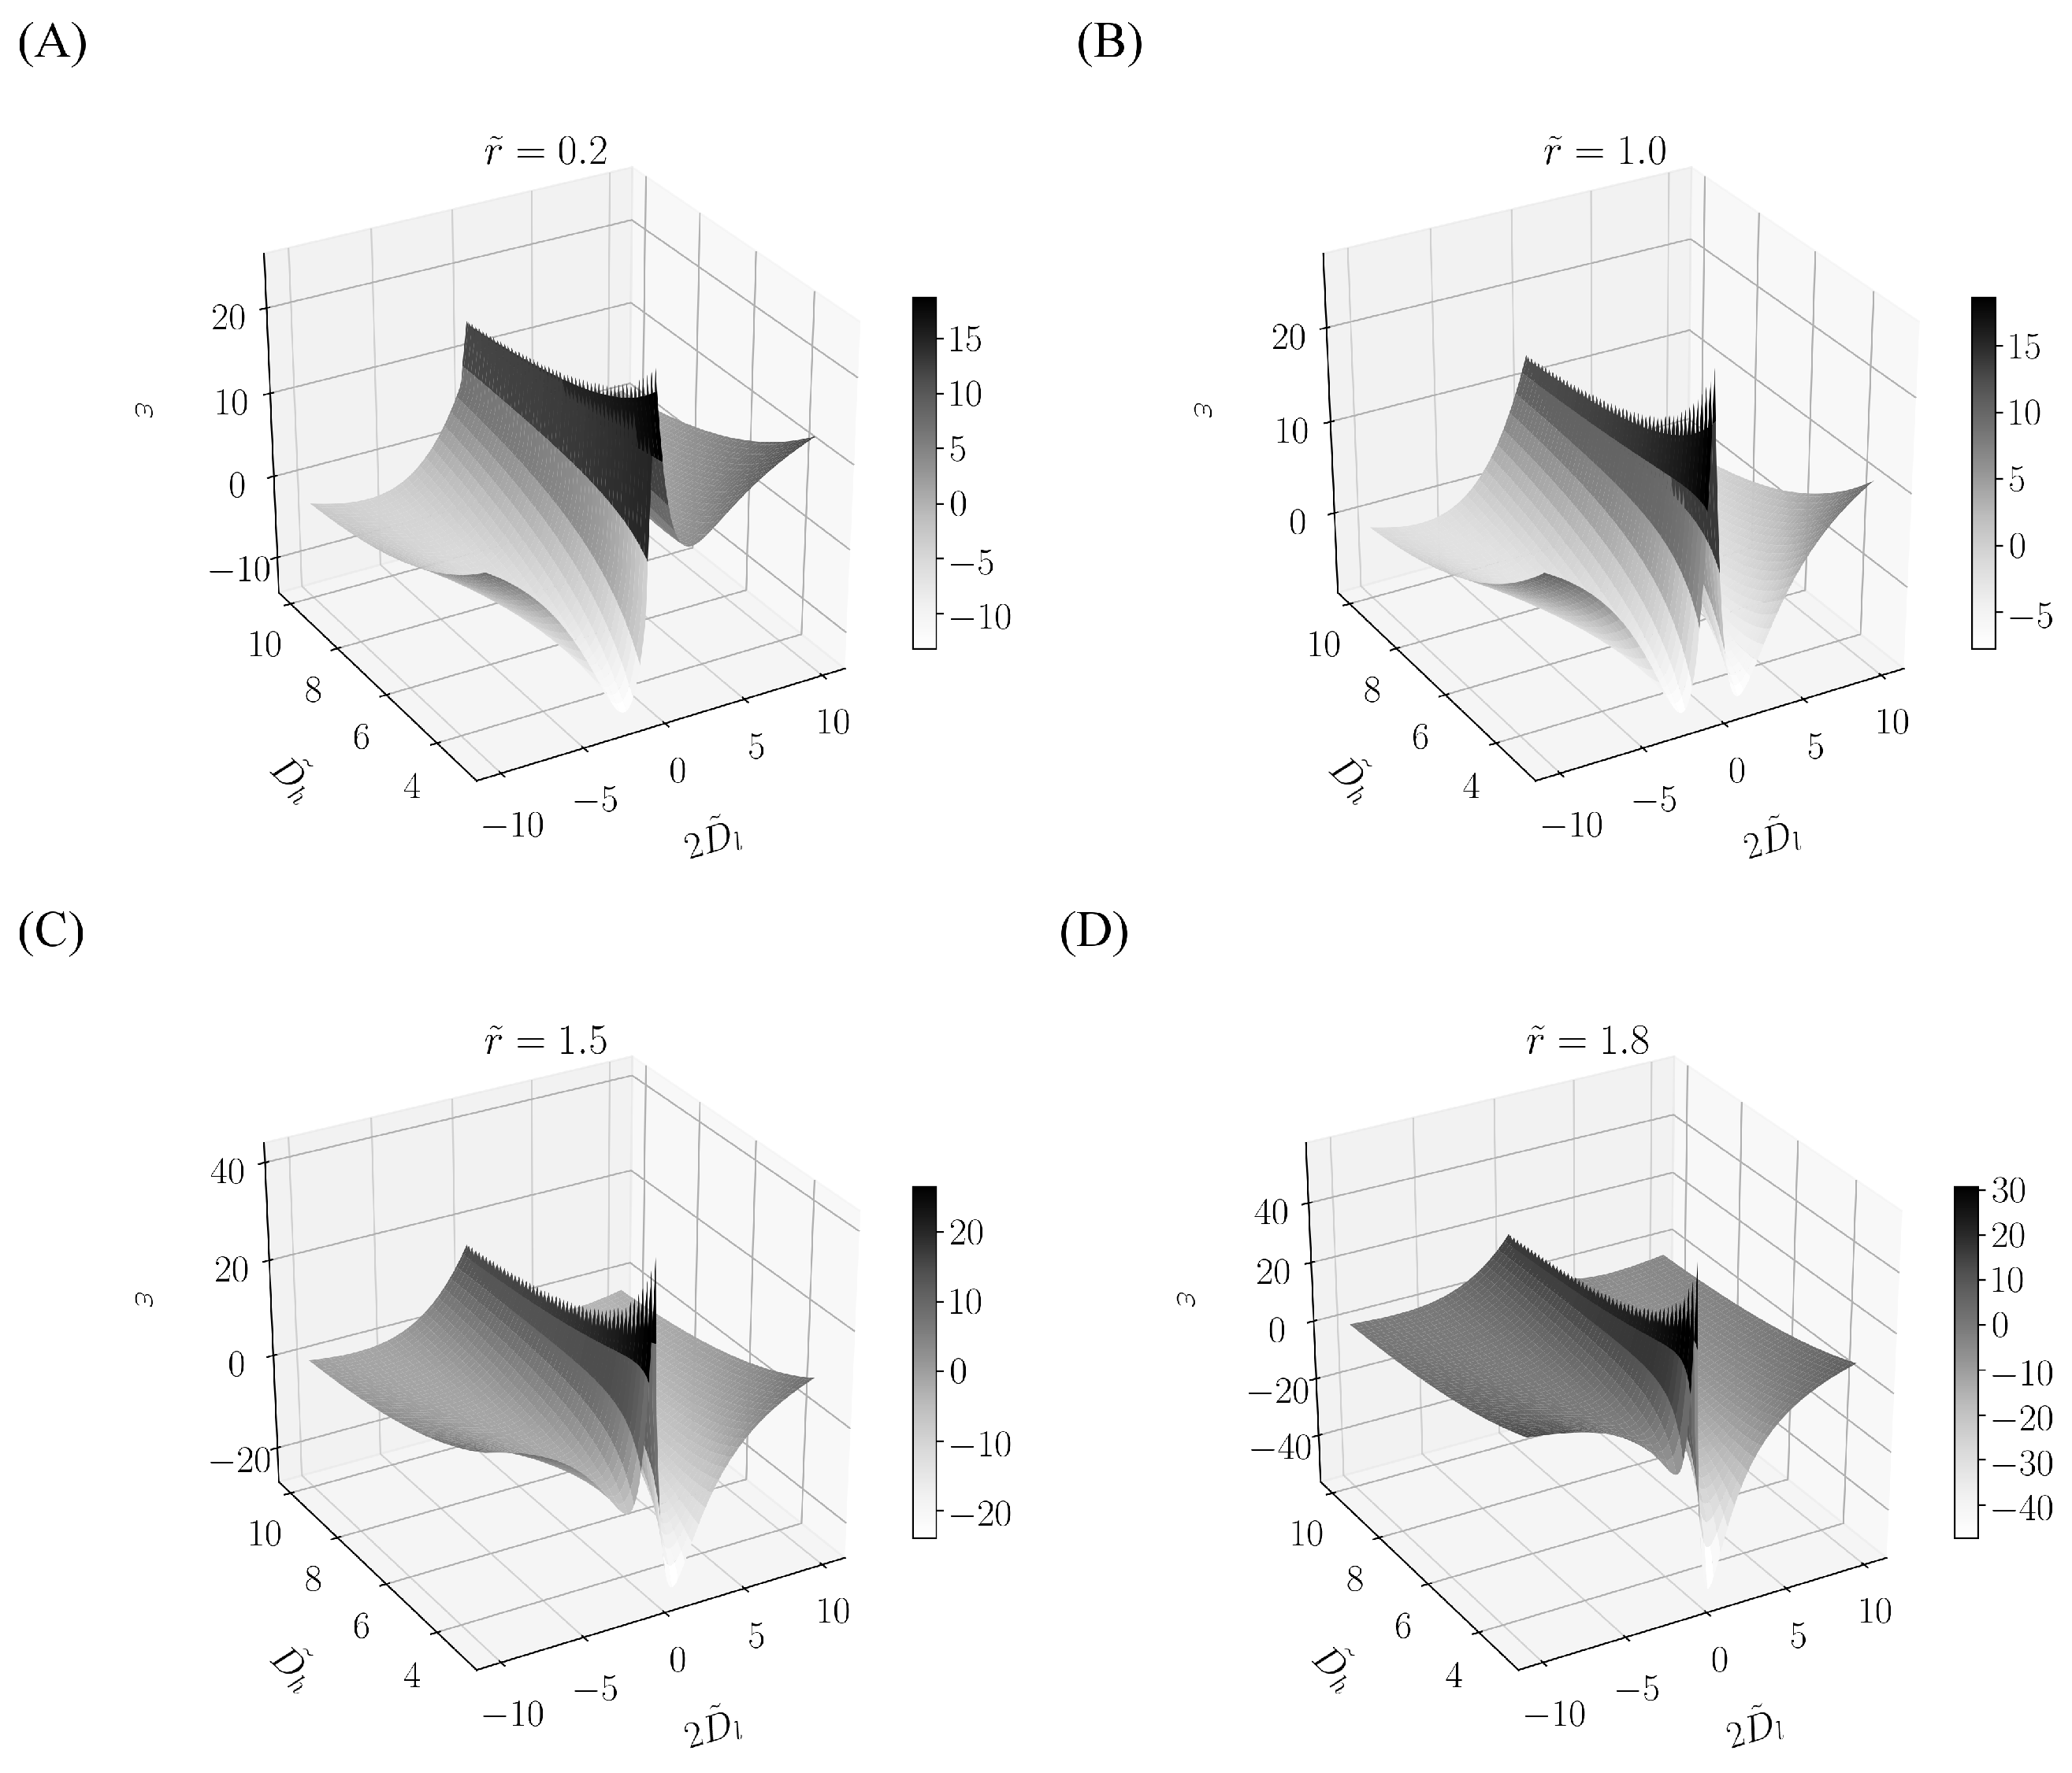
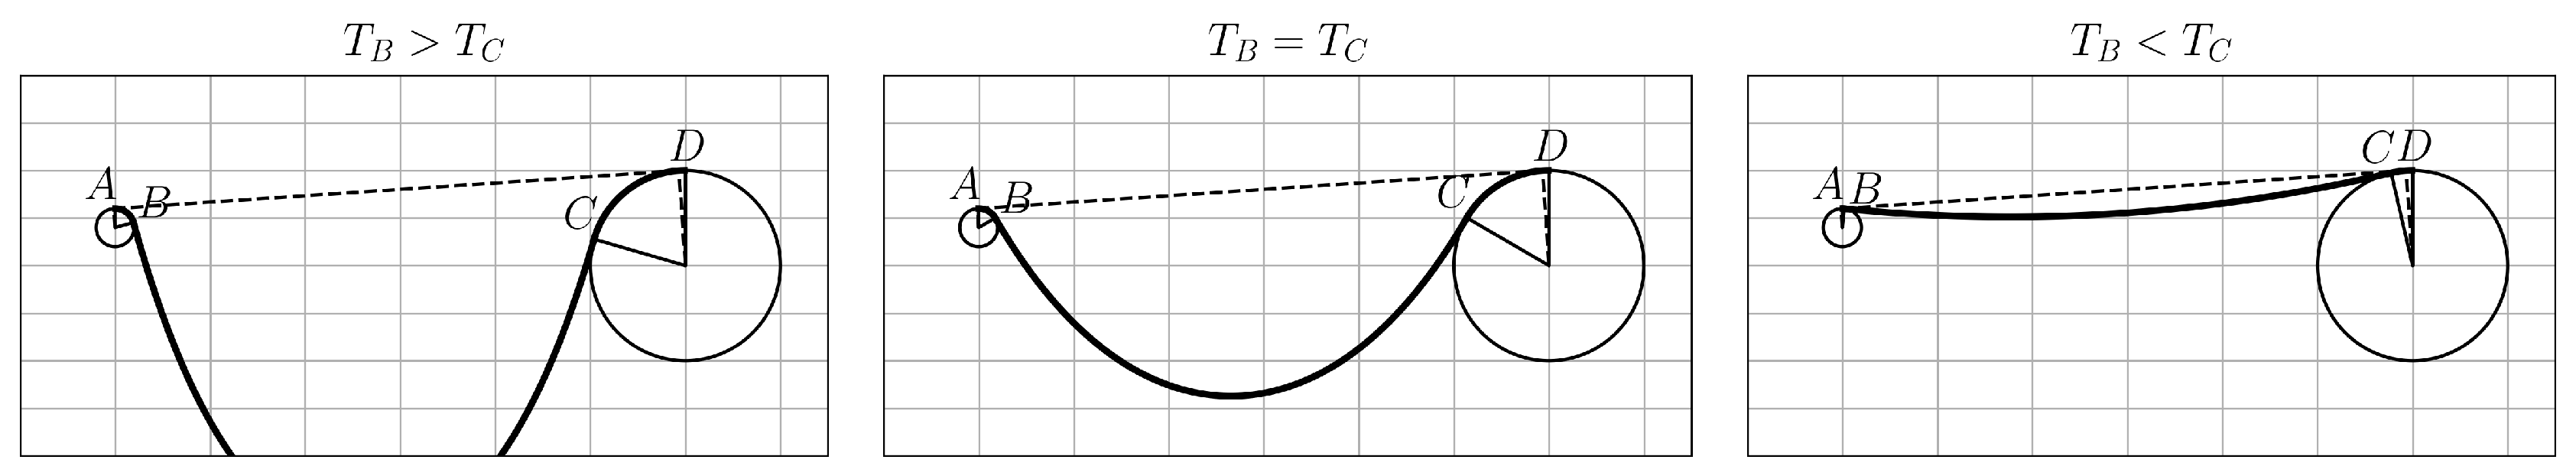
5. The Minimum Specific Strength
| Algorithm 2 Calculate when given . |
| Require: |
| repeat |
| until |
| return |
6. Discussion
7. Conclusions
Author Contributions
Conflicts of Interest
References
- Chen, J. A Method to Manufacture A2 Class Non-Conbustible Aluminum Composite Panels. CN 201010242369.5, 9 February 2011. [Google Scholar]
- Wickert, J.A.; Mote, C.D. Classical vibration analysis of axially moving continua. J. Appl. Mech. 1990, 57, 738–744. [Google Scholar] [CrossRef]
- Wickert, J.A.; Mote, C.D. Response and discretization methods for axially moving materials. Appl. Mech. Rev. 1991, 44, S279–S284. [Google Scholar] [CrossRef]
- Laukkanen, J. FEM analysis of a travelling web. Comput. Struct. 2002, 80, 1827–1842. [Google Scholar] [CrossRef]
- Chang, Y.; Moretti, P. Flow-induced vibration of free edges of thin films. J. Fluids Struct. 2002, 16, 989–1008. [Google Scholar] [CrossRef]
- Chen, L.Q. Analysis and control of transverse vibrations of axially moving strings. Appl. Mech. Rev. 2005, 58, 91–116. [Google Scholar] [CrossRef]
- Chen, L.Q.; Zhao, W.J.; Zu, J.W. Simulations of transverse vibrations of an axially moving string: A modified difference approach. Appl. Math. Comput. 2005, 166, 596–607. [Google Scholar] [CrossRef]
- Chen, L.Q.; Zhao, W.J. A conserved quantity and the stability of axially moving nonlinear beams. J. Sound Vib. 2005, 286, 663–668. [Google Scholar] [CrossRef]
- Chen, L.Q. The energetics and the stability of axially moving strings undergoing planar motion. Int. J. Eng. Sci. 2006, 44, 1346–1352. [Google Scholar] [CrossRef]
- Frondelius, T.; Koivurova, H.; Pramila, A. Interaction of an axially moving band and surrounding fluid by boundary layer theory. J. Fluids Struct. 2006, 22, 1047–1056. [Google Scholar] [CrossRef]
- Chen, L.; Zhao, W.; Ding, H. On galerkin discretization of axially moving nonlinear strings. Acta Mech. Solida Sin. 2009, 22, 369–376. [Google Scholar] [CrossRef]
- Banichuk, N.; Jeronen, J.; Neittaanmäki, P.; Tuovinen, T. On the instability of an axially moving elastic plate. Int. J. Solids Struct. 2010, 47, 91–99. [Google Scholar] [CrossRef]
- Banichuk, N.; Jeronen, J.; Neittaanmäki, P.; Tuovinen, T. Static instability analysis for travelling membranes and plates interacting with axially moving ideal fluid. J. Fluids Struct. 2010, 26, 274–291. [Google Scholar] [CrossRef]
- Malookani, R.A.; van Horssen, W.T. On the vibrations of an axially moving string with a time-dependent velocity. In Proceedings of the ASME 2015 International Mechanical Engineering Congress and Exposition, Houston, TX, USA, 13–19 November 2015; Volume 4B. Dynamics, Vibration, and Control. [Google Scholar]
- Fung, R.F.; Wu, J.W.; Wu, S.L. Exponential stabilization of an axially moving string by linear boundary feedback. Automatica 1999, 35, 177–181. [Google Scholar] [CrossRef]
- Fung, R.F.; Chou, J.H.; Kuo, Y.L. Optimal boundary control of an axially moving material system. J. Dyn. Syst. Meas. Control 2001, 124, 55–61. [Google Scholar] [CrossRef]
- Qu, Z. An iterative learning algorithm for boundary control of a stretched moving string. Automatica 2002, 38, 821–827. [Google Scholar] [CrossRef]
- Nguyen, Q.C.; Hong, K.S. Stabilization of an axially moving web via regulation of axial velocity. J. Sound Vib. 2011, 330, 4676–4688. [Google Scholar] [CrossRef]
- Nguyen, Q.C.; Hong, K.S. Transverse vibration control of axially moving membranes by regulation of axial velocity. IEEE Trans. Control Syst. Technol. 2012, 20, 1124–1131. [Google Scholar] [CrossRef]
- Nguyen, Q.C.; Hong, K.S. Simultaneous control of longitudinal and transverse vibrations of an axially moving string with velocity tracking. J. Sound Vib. 2012, 331, 3006–3019. [Google Scholar] [CrossRef]
- Seshadri, A.; Pagilla, P.R.; Lynch, J.E. Modeling print registration in Roll-to-Roll Printing Presses. J. Dyn. Syst. Meas. Control 2013, 135, 31016. [Google Scholar] [CrossRef]
- Nagarkatti, S.P.; Zhang, F.; Rahn, C.D.; Dawson, D.M. Tension and speed regulation for axially moving materials. J. Dyn. Syst. Meas. Control 1999, 122, 445–453. [Google Scholar] [CrossRef]
- Huang, C.C.; Peng, C.C.; Tang, T.T. On-line tension control for polyester film processing. Polym. Plast. Technol. Eng. 2008, 47, 157–163. [Google Scholar] [CrossRef]
- Zhao, H.; Rahn, C.D. Iterative learning velocity and tension control for single span axially moving materials. J. Dyn. Syst. Meas. Control Trans. ASME 2008, 130, 51003. [Google Scholar] [CrossRef]
- Branca, C.; Pagilla, P.R.; Reid, K.N. Governing equations for web tension and web velocity in the presence of nonideal rollers. J. Dyn. Syst. Meas. Control Trans. ASME 2013, 135, 11018. [Google Scholar] [CrossRef]
- Yun, S.; Han, C.; Chung, J. A study on the robust control algorithm for an axially moving film. KSME Int. J. 2001, 15, 1207–1216. [Google Scholar] [CrossRef]
- Stump, D.; Fraser, W. Bending boundary layers in a moving strip. Nonlinear Dyn. 2000, 21, 55–70. [Google Scholar] [CrossRef]
- Banichuk, N.; Jeronen, J.; Saksa, T.; Tuovinen, T. Static instability analysis of an elastic band travelling in the gravitational field. Raken. Mek. J. Struct. Mech. 2011, 44, 172–185. [Google Scholar]
- Su, Z.; Jiang, P.; Li, Q.; Wei, P.; Zhang, Y. Toughening of polypropylene highly filled with aluminum hydroxide. Polym. Polym. Compos. 2005, 13, 139–150. [Google Scholar]
- Dubnikova, I.; Oshmyan, V.; Gorenberg, A.Y. Mechanisms of particulate filled polypropylene finite plastic deformation and fracture. J. Mater. Sci. 1997, 32, 1613–1622. [Google Scholar] [CrossRef]
- Hippi, U.; Mattila, J.; Korhonen, M.; Seppälä, J. Compatibilization of polyethylene/aluminum hydroxide (PE/ATH) and polyethylene/magnesium hydroxide (PE/MH) composites with functionalized polyethylenes. Polymer 2003, 44, 1193–1201. [Google Scholar] [CrossRef]
- Wang, C.Y. The optimum spanning catenary cable. Eur. J. Phys. 2015, 36, 28001. [Google Scholar] [CrossRef]
- Wolfe, P. The effect of bending stiffness on inextensible cables. Int. J. Eng. Sci. 1992, 30, 1187–1192. [Google Scholar] [CrossRef]
- Dreyer, T.; Vuuren, J.H.V. A comparison between continuous and discrete modelling of cables with bending stiffness. Appl. Math. Model. 1999, 23, 527–541. [Google Scholar] [CrossRef]
- Denzler, J.; Hinz, A.M. Catenaria vera—The true catenary. Expos. Math. 1999, 17, 117–142. [Google Scholar]
- Stephenson, M.; Dargush, G.; Ryan, M. Application of one-dimensional mechanical formulations to model the sagging behavior of a polymer sheet. Polym. Eng. Sci. 1999, 39, 2199–2221. [Google Scholar] [CrossRef]
- Giacomin, A.; Mix, A.; Mahmood, O. Sag in Thermoforming. Polym. Eng. Sci. 2010, 50, 2060–2068. [Google Scholar] [CrossRef]
- Moré, J.J.; Garbow, B.S.; Hillstrom, K.E. User Guide for MINPACK-1; Technical Report ANL-80-74; Argonne National Laboratory: Argonne, IL, USA, 1980.


| 1.0 | 0.2 | 0.704 | 0.809 | 1.0 | 0.2 | 0.662 | 0.766 | |||
| 1.0 | 0.3 | 0.701 | 0.806 | 1.0 | 0.3 | 0.664 | 0.769 | |||
| 1.0 | 0.4 | 0.698 | 0.804 | 1.0 | 0.4 | 0.666 | 0.771 | |||
| 1.0 | 0.5 | 0.695 | 0.801 | 1.0 | 0.5 | 0.669 | 0.774 | |||
| 1.0 | 0.6 | 0.692 | 0.798 | 1.0 | 0.6 | 0.671 | 0.776 | |||
| 1.0 | 0.7 | 0.689 | 0.795 | 1.0 | 0.7 | 0.673 | 0.779 | |||
| 1.0 | 0.8 | 0.686 | 0.792 | 1.0 | 0.8 | 0.675 | 0.781 | |||
| 1.0 | 0.9 | 0.683 | 0.789 | 1.0 | 0.9 | 0.677 | 0.784 | |||
| 1.0 | 1.0 | 0.679 | 0.786 | 1.0 | 1.0 | 0.679 | 0.786 | |||
| 1.0 | 1.1 | 0.677 | 0.783 | 1.0 | 1.1 | 0.682 | 0.789 | |||
| 1.0 | 1.2 | 0.674 | 0.779 | 1.0 | 1.2 | 0.684 | 0.791 | |||
| 1.0 | 1.3 | 0.671 | 0.776 | 1.0 | 1.3 | 0.686 | 0.794 | |||
| 1.0 | 1.4 | 0.668 | 0.772 | 1.0 | 1.4 | 0.688 | 0.797 | |||
| 1.0 | 1.5 | 0.666 | 0.768 | 1.0 | 1.5 | 0.69 | 0.799 | |||
| 1.0 | 1.6 | 0.663 | 0.764 | 1.0 | 1.6 | 0.691 | 0.802 | |||
| 1.0 | 1.7 | 0.661 | 0.76 | 1.0 | 1.7 | 0.693 | 0.805 | |||
| 1.0 | 1.8 | 0.659 | 0.755 | 1.0 | 1.8 | 0.694 | 0.808 |
© 2017 by the authors. Licensee MDPI, Basel, Switzerland. This article is an open access article distributed under the terms and conditions of the Creative Commons Attribution (CC BY) license (http://creativecommons.org/licenses/by/4.0/).
Share and Cite
Ji, R.; Chang, B.; Wang, L.; Wang, W.; Du, D. Research on the Transportation of Low-Strength Composites Sheets. Appl. Sci. 2018, 8, 41. https://doi.org/10.3390/app8010041
Ji R, Chang B, Wang L, Wang W, Du D. Research on the Transportation of Low-Strength Composites Sheets. Applied Sciences. 2018; 8(1):41. https://doi.org/10.3390/app8010041
Chicago/Turabian StyleJi, Renhe, Baohua Chang, Li Wang, Wenzhu Wang, and Dong Du. 2018. "Research on the Transportation of Low-Strength Composites Sheets" Applied Sciences 8, no. 1: 41. https://doi.org/10.3390/app8010041
APA StyleJi, R., Chang, B., Wang, L., Wang, W., & Du, D. (2018). Research on the Transportation of Low-Strength Composites Sheets. Applied Sciences, 8(1), 41. https://doi.org/10.3390/app8010041