You are currently viewing a new version of our website. To view the old version click .
Applied Sciences
  • Article
  • Open Access

12 October 2017

From Point Clouds to Building Information Models: 3D Semi-Automatic Reconstruction of Indoors of Existing Buildings

,
and
ICube Laboratory, Photogrammetry and Geomatics Group, National Institute of Applied Sciences (INSA),24 Boulevard de la Victoire, 67084 Strasbourg CEDEX, France
*
Author to whom correspondence should be addressed.
This article belongs to the Special Issue Laser Scanning

Abstract

The creation of as-built Building Information Models requires the acquisition of the as-is state of existing buildings. Laser scanners are widely used to achieve this goal since they permit to collect information about object geometry in form of point clouds and provide a large amount of accurate data in a very fast way and with a high level of details. Unfortunately, the scan-to-BIM (Building Information Model) process remains currently largely a manual process which is time consuming and error-prone. In this paper, a semi-automatic approach is presented for the 3D reconstruction of indoors of existing buildings from point clouds. Several segmentations are performed so that point clouds corresponding to grounds, ceilings and walls are extracted. Based on these point clouds, walls and slabs of buildings are reconstructed and described in the IFC format in order to be integrated into BIM software. The assessment of the approach is proposed thanks to two datasets. The evaluation items are the degree of automation, the transferability of the approach and the geometric quality of results of the 3D reconstruction. Additionally, quality indexes are introduced to inspect the results in order to be able to detect potential errors of reconstruction.

1. Introduction

The modelling of indoor areas of existing buildings is a huge issue since the emergence of Building Information Modelling (BIM) in Architecture, Engineering and Construction (AEC) industry. Volk et al. [1] highlight the fact that despite well established BIM processes for new buildings, the majority of existing buildings is not maintained, refurbished or deconstructed with BIM yet. According to Giudice and Osello [2], the need to refurbish the cultural heritage is becoming more important than the construction of new buildings. The potential benefits of BIM implementation in existing buildings seem to be significant, for among them, restoration, documentation, maintenance, quality control or energy and space management [1,3]. The creation of a Building Information Model of an existing building commonly named as-built BIM requires the acquisition of the as-is state of the building. Terrestrial Laser Scanning (TLS) is widely used to achieve this goal. Indeed, laser scanners permit to collect information about object geometry in form of point clouds. They provide a large amount of accurate data in a very fast way and with a high level of details [4,5,6]. Some governments such as the British and the American governments recommend the use of this capture technology in the BIM process [7,8].
Unfortunately, the scan-to-BIM process remains largely a manual process because of the huge amount of data, the challenge that constitutes the reconstruction of occluded parts of buildings and the absence of semantic information in point clouds. This is time consuming and requires skills. A key challenge today is thus to automate the process leading to as-built BIM from point clouds. The aim of our project is to develop a processing chain allowing to extract automatically the maximum of information from point clouds in order to integrate easily the result in BIM software. Three items were considered for the development of the approach. The first item is the automation. A 3D semi-automatic reconstruction is proposed and tasks which can be automated have to be identified. Secondly, in order to guaranty the generalisation of the approach, a transferability item is considered. It involves the definition of characteristics of studied buildings. The last but not least item is the geometric quality of the results. Quality criteria are intended to be integrated in the approach and quality indexes have to be proposed for the inspection of reconstruction results.
In this article, a state of the art of the process which consists in the creation of as-built BIM from point clouds is first proposed (Section 2). The Section 3 is dedicated to the full description of the developed approach which considers indoor point clouds as input. The project framework is presented and the two parts of the approach, namely the segmentation of building elements point clouds and the 3D reconstruction of walls and slabs of buildings, are detailed. The assessment of the developed approach is then considered in Section 4. Datasets and thresholds used for the assessment are presented and results of both parts of the approach are shown. Moreover, quality indexes are introduced for the inspection of results. Finally, some future works are proposed and new trends for as-built BIM creation are discussed (Section 5).

3. Full Description of the Approach

3.1. Project Framework

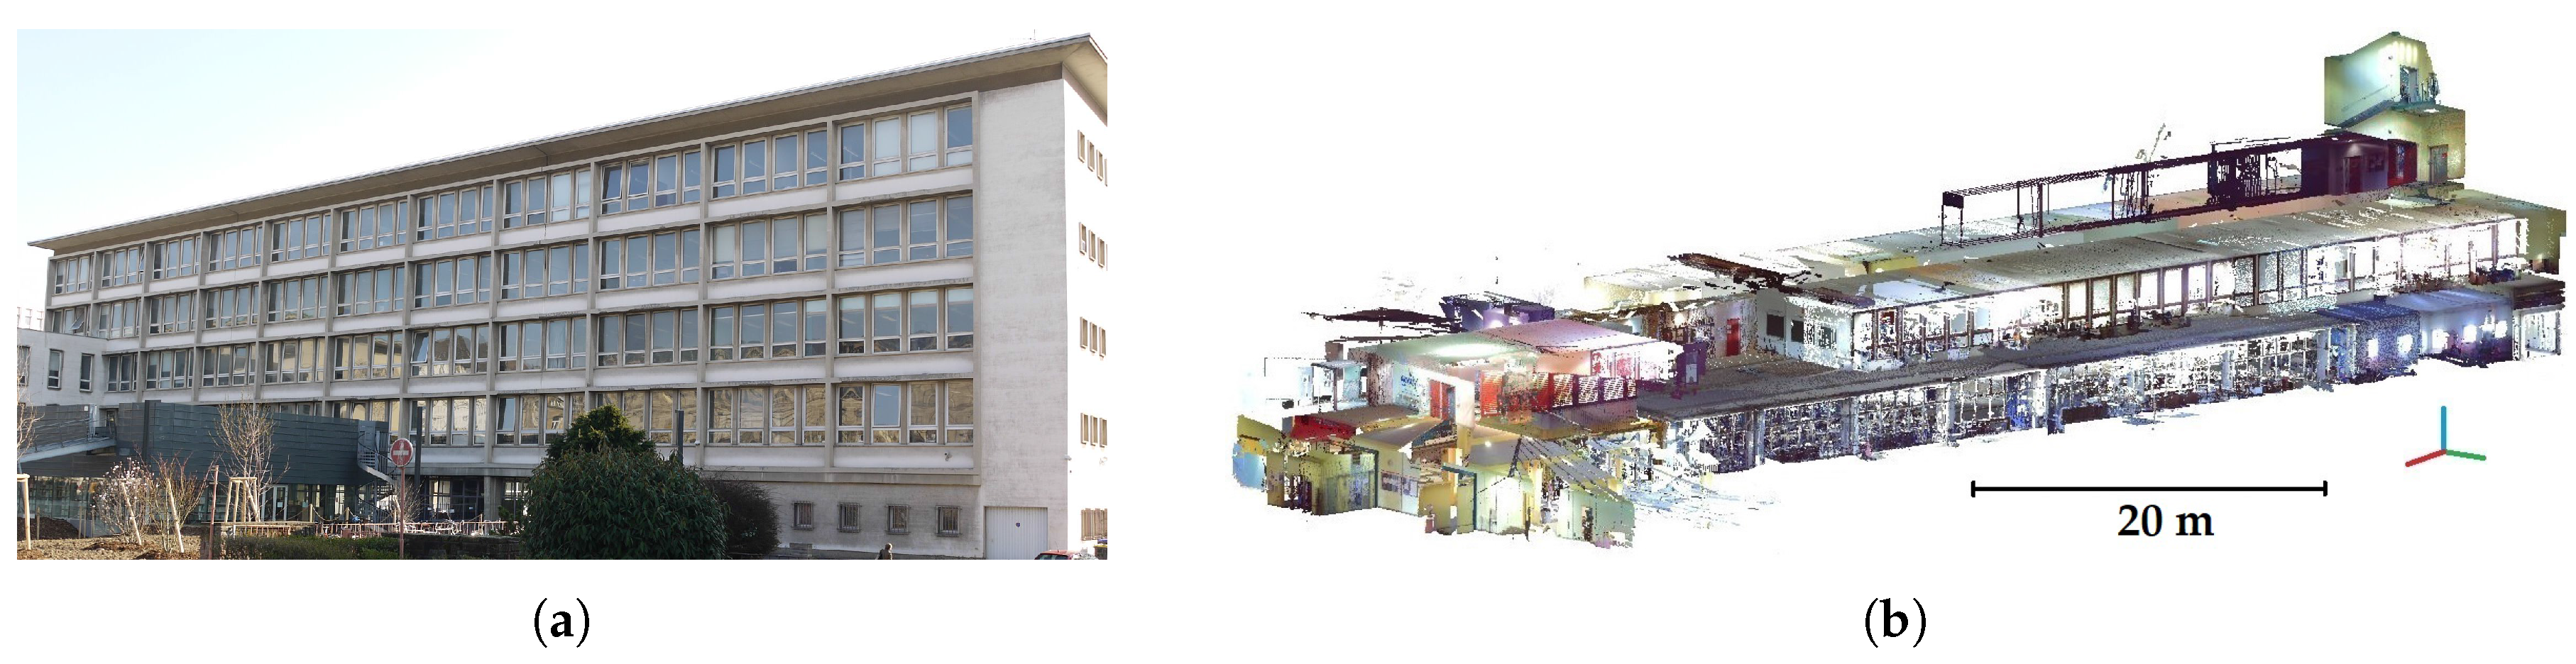
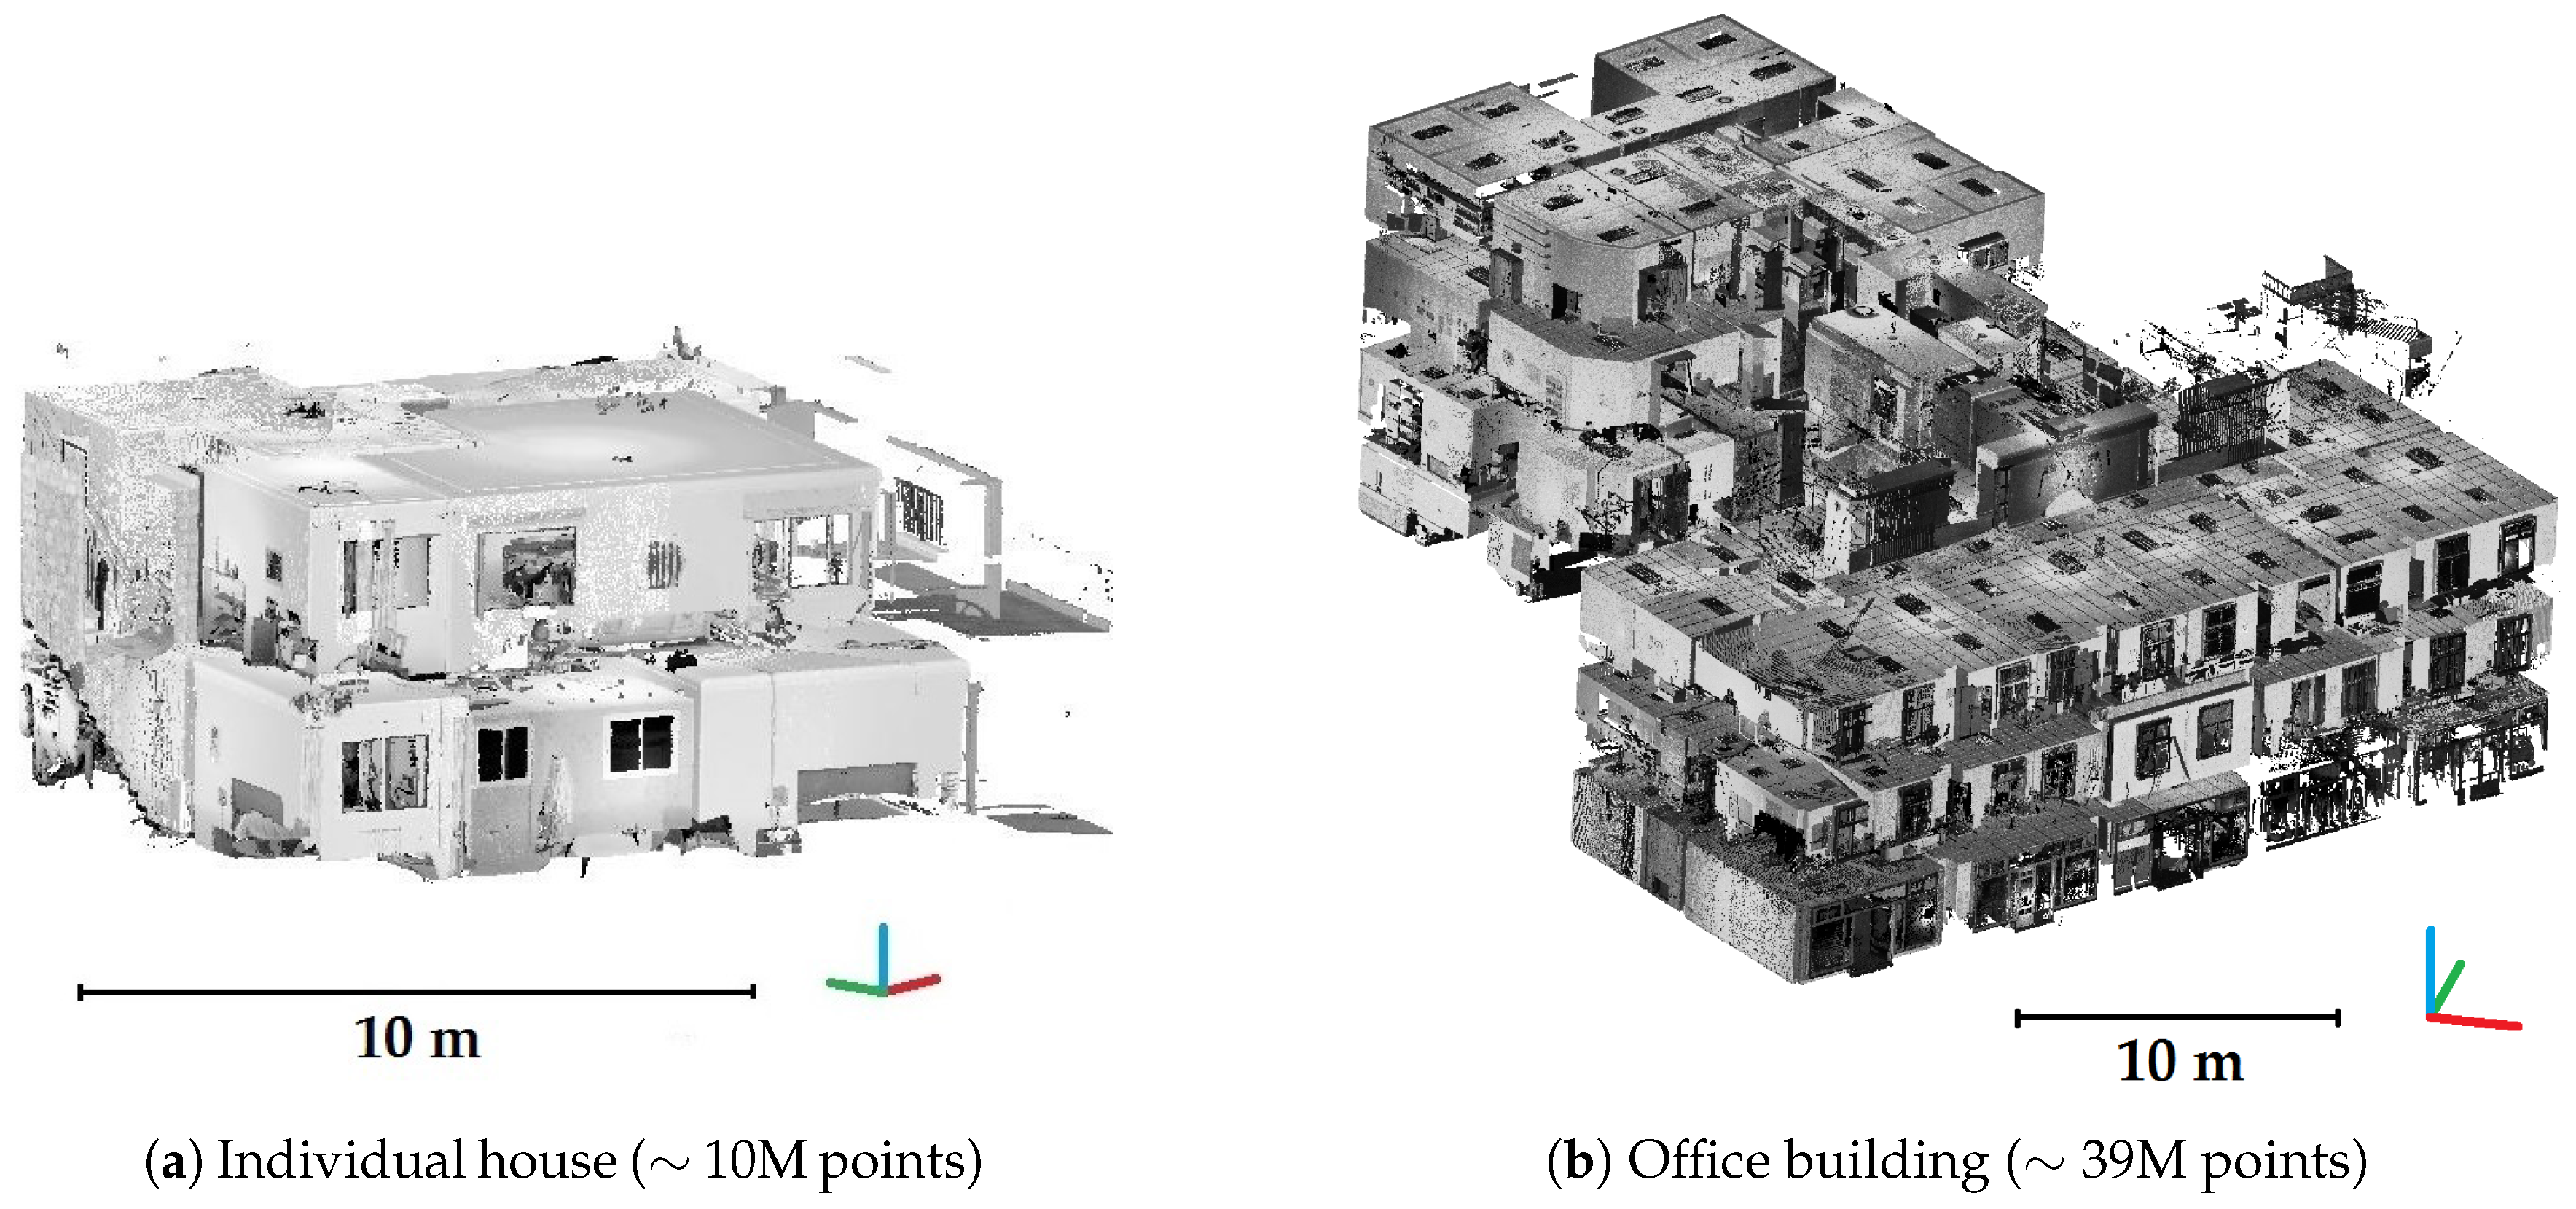
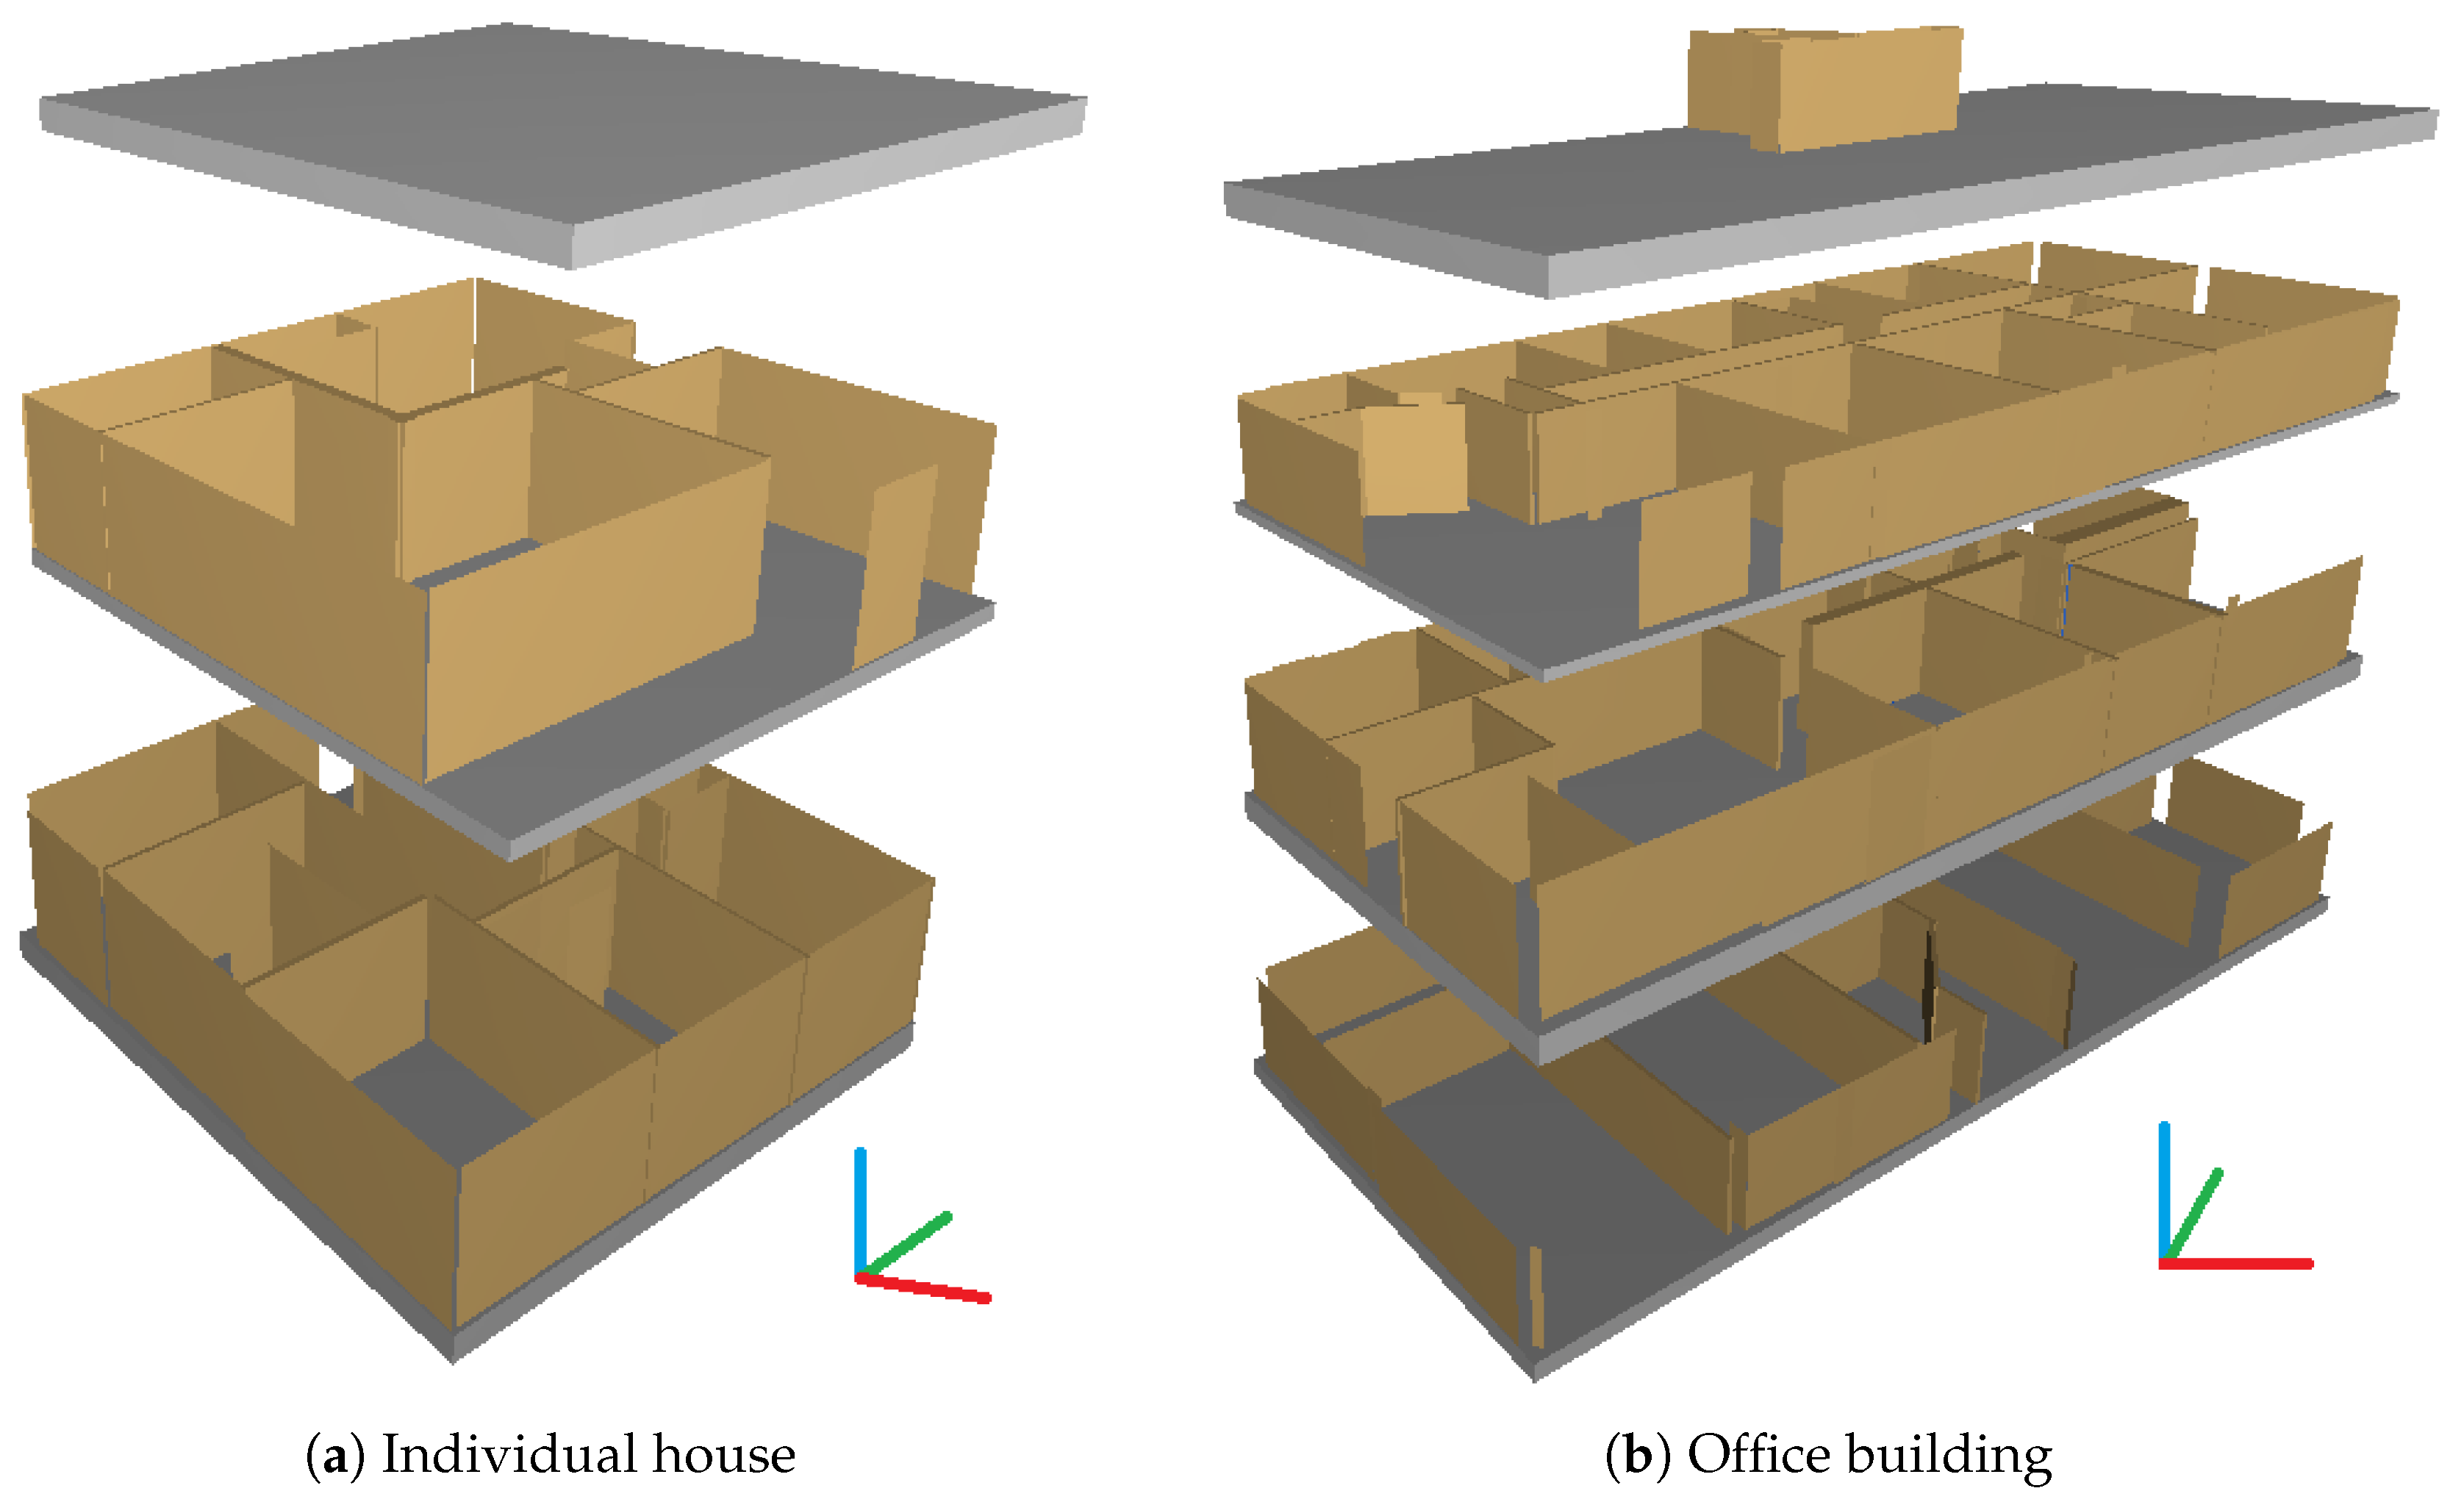
3.1.1. Buildings under Study

The French real-estate patrimony is rich and all types of buildings can not be taken into account during this project. Hence, it is important to define what type of buildings can be considered. A building is described thanks to several characteristics such as its size, its function, its topology, its date of construction, materials composing it and its aesthetic.
Buildings taken into account in the developed approach are ordinary buildings both by their function and their aesthetic. The modelling of industrial buildings or historical buildings is not envisaged since these types of buildings require specific processes. Moreover, in the developed approach, a building is described by planar shapes. Complex architectures composed of non-planar shapes are thus set aside. Also, some buildings composed of materials which are difficult to acquire by laser scanning could obviously not be considered. It is notably the case for buildings with façades made entirely of glass. The developed approach deals with buildings of variable sizes and dates of construction. These buildings are composed of one or several floors divided into several rooms. This organisation is followed by the majority of buildings as for example individual houses, public buildings or office buildings. Finally, developed algorithms handle only horizontal ceilings that is why rooms with sloped ceilings are not processed.

3.1.2. Input Data

The developed approach considers as input data acquired by laser scanners namely registered point clouds. Our project focuses on how to process these data even if it must be noticed that the acquisition and the post-processing steps have obviously an impact on the quality of the data and consequently on the quality of models created from point clouds. It is essential to adopt the best possible acquisition protocol to avoid troubles during the modelling step. In order to ensure the quality of input data, the following recommendations have to be followed by the operator:
  • Scan stations:
    optimize the placement of scan stations in order to acquire the whole environment without causing redundant data by multiplying scan stations
    plan a consequent overlapping between point clouds in case of indirect georeferencing
    if possible perform loops to improve the quality of the registration of point clouds (global adjustment) and to limit the risks of deviation
  • Targets:
    use at least 4 targets in common between two scans: 3 targets are sufficient to register point clouds issued from 2 successive scans but it is recommended to take more than 3 and to compensate the whole network of targets at once
    prioritize targets placed in more than 2 scans. It should be ensured that targets are well-distributed in the space, that is to say placed at various ranges from the scanner, not in the same plane or along one line and locared at different heights
    the use of natural targets such as edges, planes and cylinders can reduce and simplify data collection process; indeed, it can be difficult and time consuming to place targets throughout all the building
  • Point spacing:
    consider upstream the desired point density according to project specifications
    adapt point spacing depending on space configuration and the positioning of targets in relation to the laser scanner
  • Georeferencing after registration:
    georeferencing can be either direct when positions and orientations of the successive scanner stations are known within a geodetic network, or indirect when the georeferencing is performed after the registration
    in case of indirect georeferencing, the coordinates of targets or characteristic points well distributed in the scene are measured and are used to compute the transformation from the local system to the global system
    georeferencing can improve the quality of the registration notably for a linear project
Considering the developed approach, several requirements have to be taken into account for the acquisition with the laser scanner. A minimum of one point per centimetre is required by the approach. Moreover, a scan has to be performed whenever the ceiling height changes. It shall also be ensured that the ceilings are not occluded at the scanner point of views since the approach largely exploits slices of point clouds at their levels.
The data considered as input of the algorithms are supposed to be correctly registered indoor point clouds. In order to save time during the process and to gain more insight into the number of points of extracted elements, point clouds are spatially resampled at 1 cm. Point clouds are also rotated to follow the orientation of one of the major façade plane obtained using a Principal Component Analysis (PCA) to accelerate processing time. Finally, a global shift to a local coordinate system is temporarily performed so that the original precision is kept.

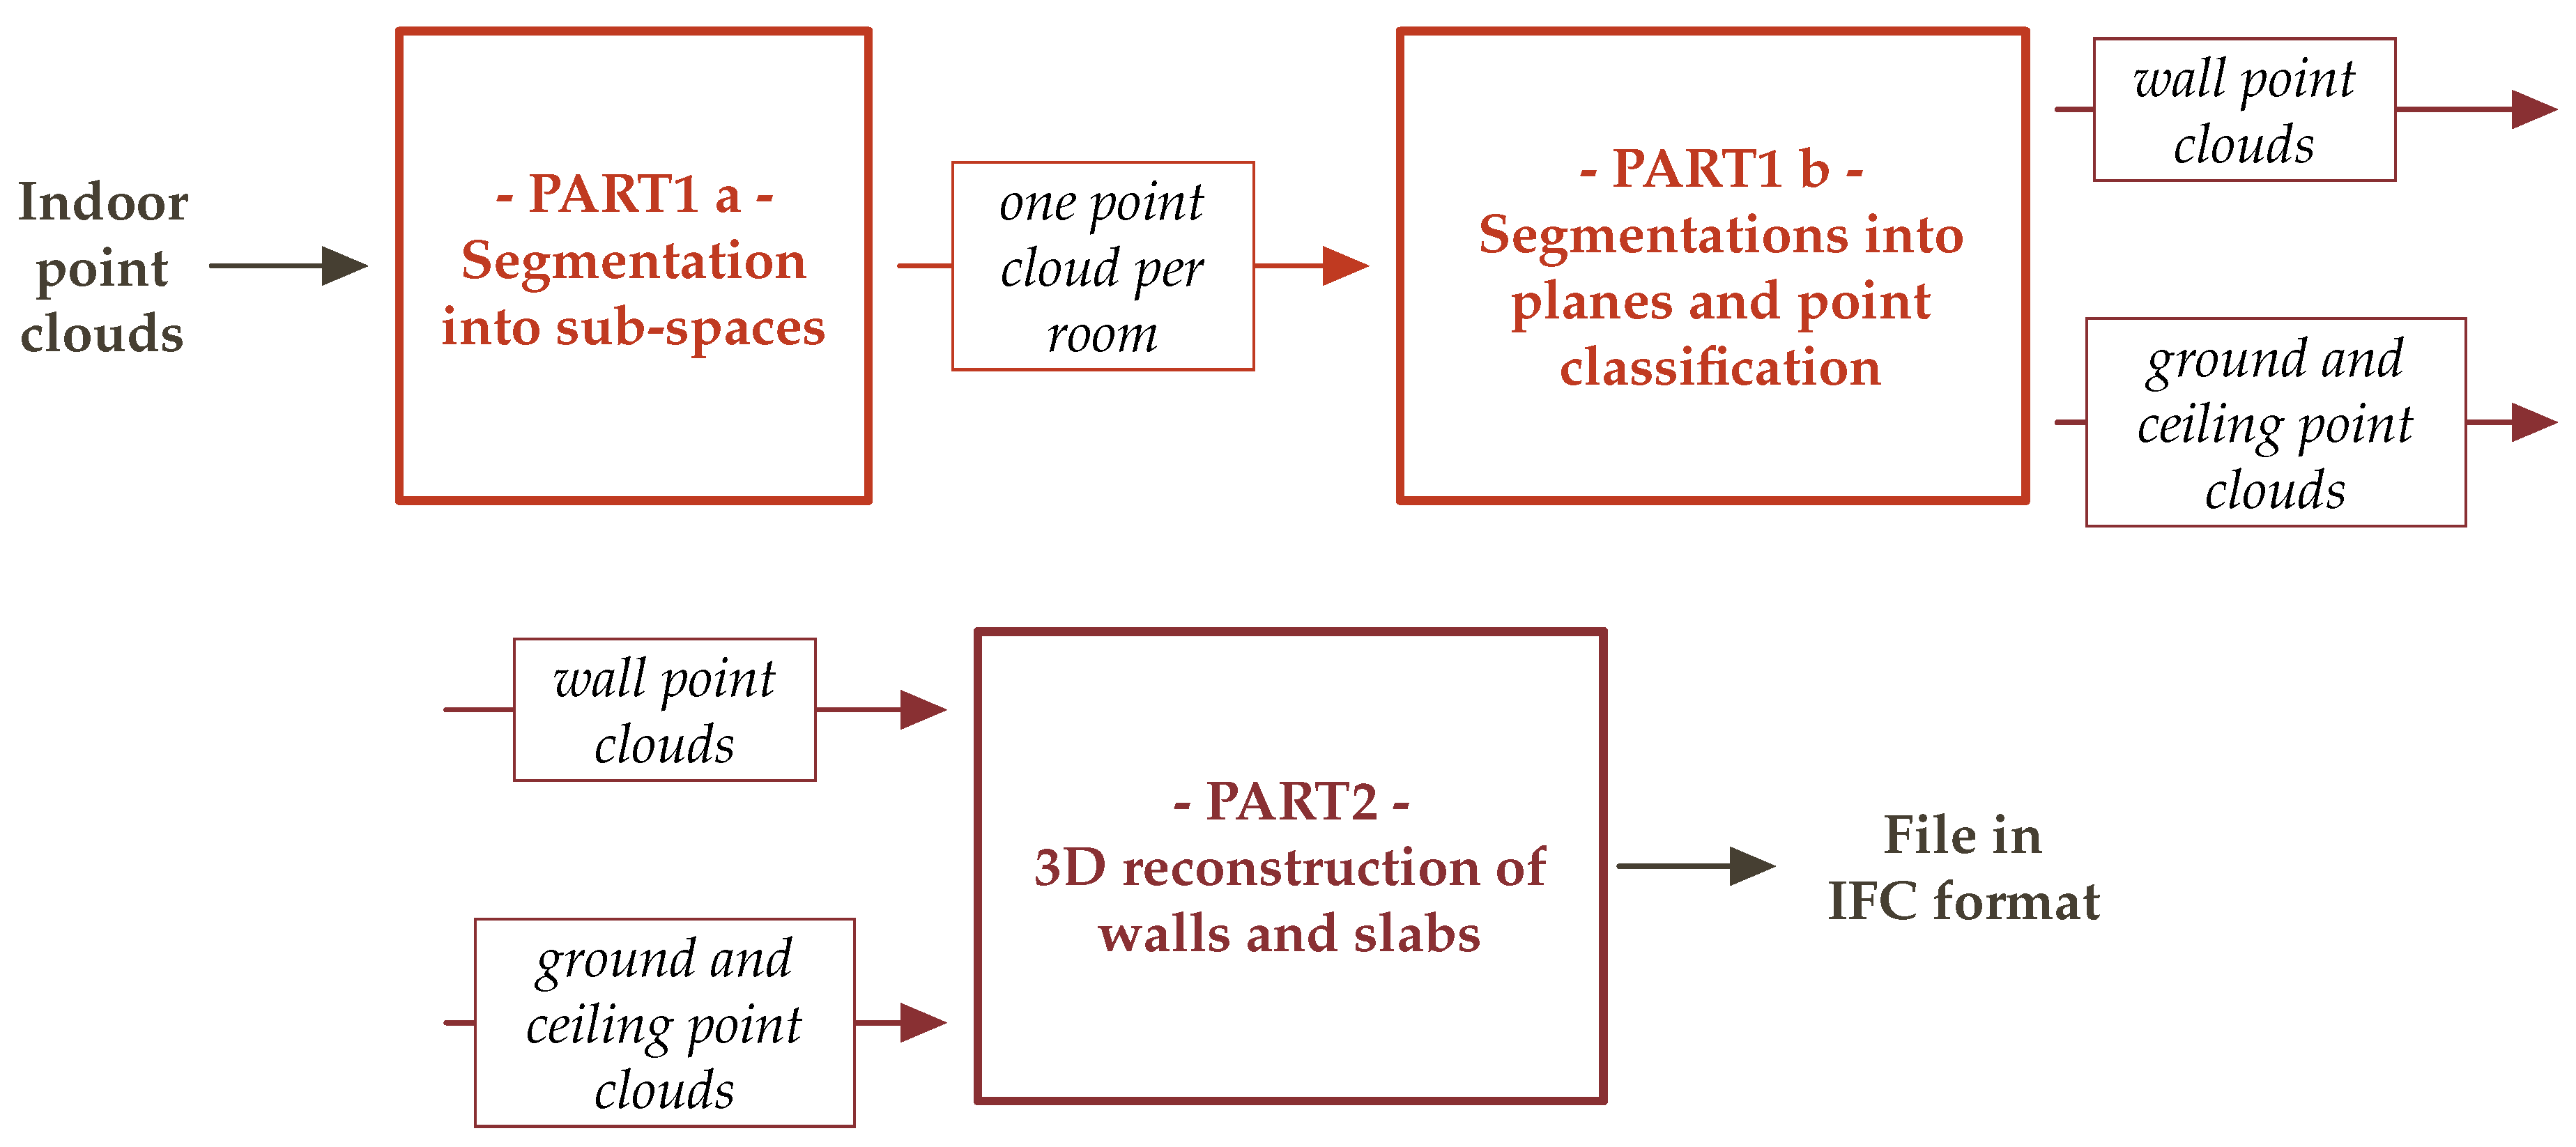
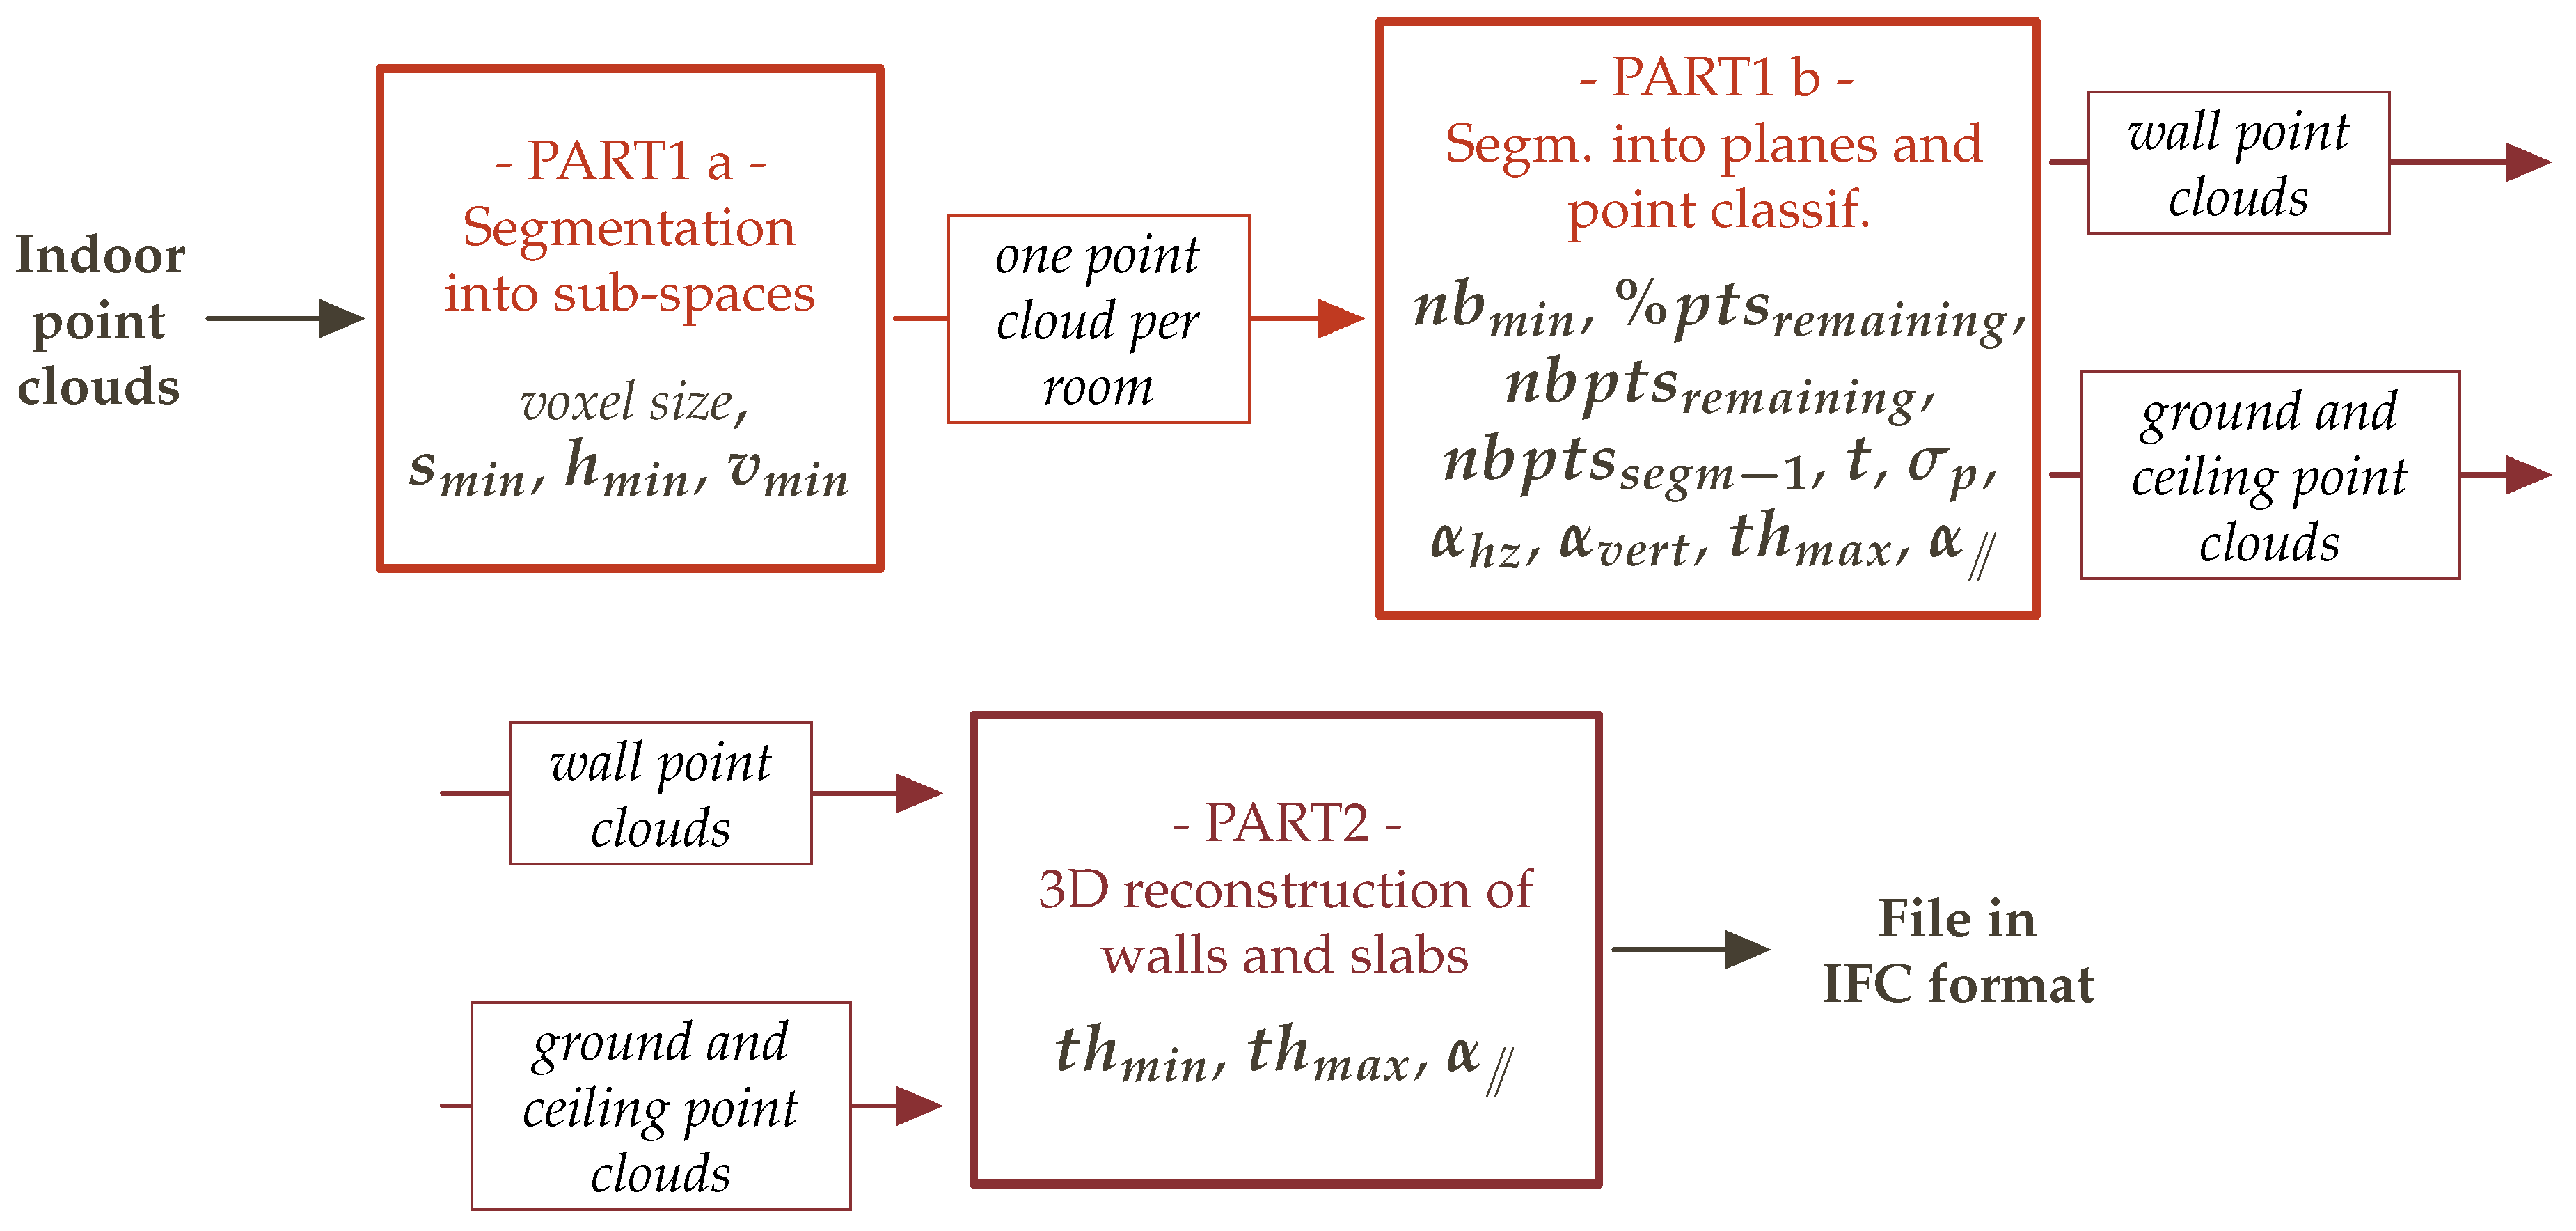
3.1.3. Overview of the Approach

Figure 1 proposes an overview of the developed approach. The approach is composed of two main parts. In the first part, aim is to segment point clouds so that structural elements of the building are identified. Indoor point clouds are first segmented into sub-spaces namely floors and rooms. Then, for each room point cloud, several segmentations into planes are performed. These segmentations are combined with the classification of points into several categories (grounds, ceilings and walls). Finally, wall point clouds are obtained by assembling planes classified as walls.
Figure 1. Overview of the developed approach.
In the second part of the approach, walls and slabs of the building are reconstructed in 3D based on wall point clouds and ground and ceiling point clouds. In order to do that, point clouds describing these structural elements are adjusted either by volumes or surfaces. The output of the approach is a file in the IFC format (BIM format) where walls and slabs are described.
The entire approach was carried out thanks to MATLAB (MathWorks) software. In the remainder of this section the different steps of the developed approach are detailed and illustrated based on indoor point clouds acquired in a public building namely a building of the National Institute of Applied Sciences (INSA) in Strasbourg (Figure 2). The ground floor, the first floor and a part of the second floor of the building which represent approximately 2500 m2 were scanned. The acquisition and the post-processing of this dataset have already been presented in [58].
Figure 2. Dataset used to illustrate the approach: (a) Photograph of the acquired building. (b) Indoor colourized point clouds (∼1.7 billion points before resampling).

3.2. Segmentation into Structural Elements

The aim of the first part of the approach, structural element point clouds are segmented. It begins with the segmentation of the building point clouds into sub-spaces to move from scan point clouds to room point clouds. Then, based on each room point cloud, several plane segmentations are performed and points are classified as walls, ceilings or grounds. Finally, wall point clouds are obtained by assembling planes. This part of the approach was already described in [58,59].

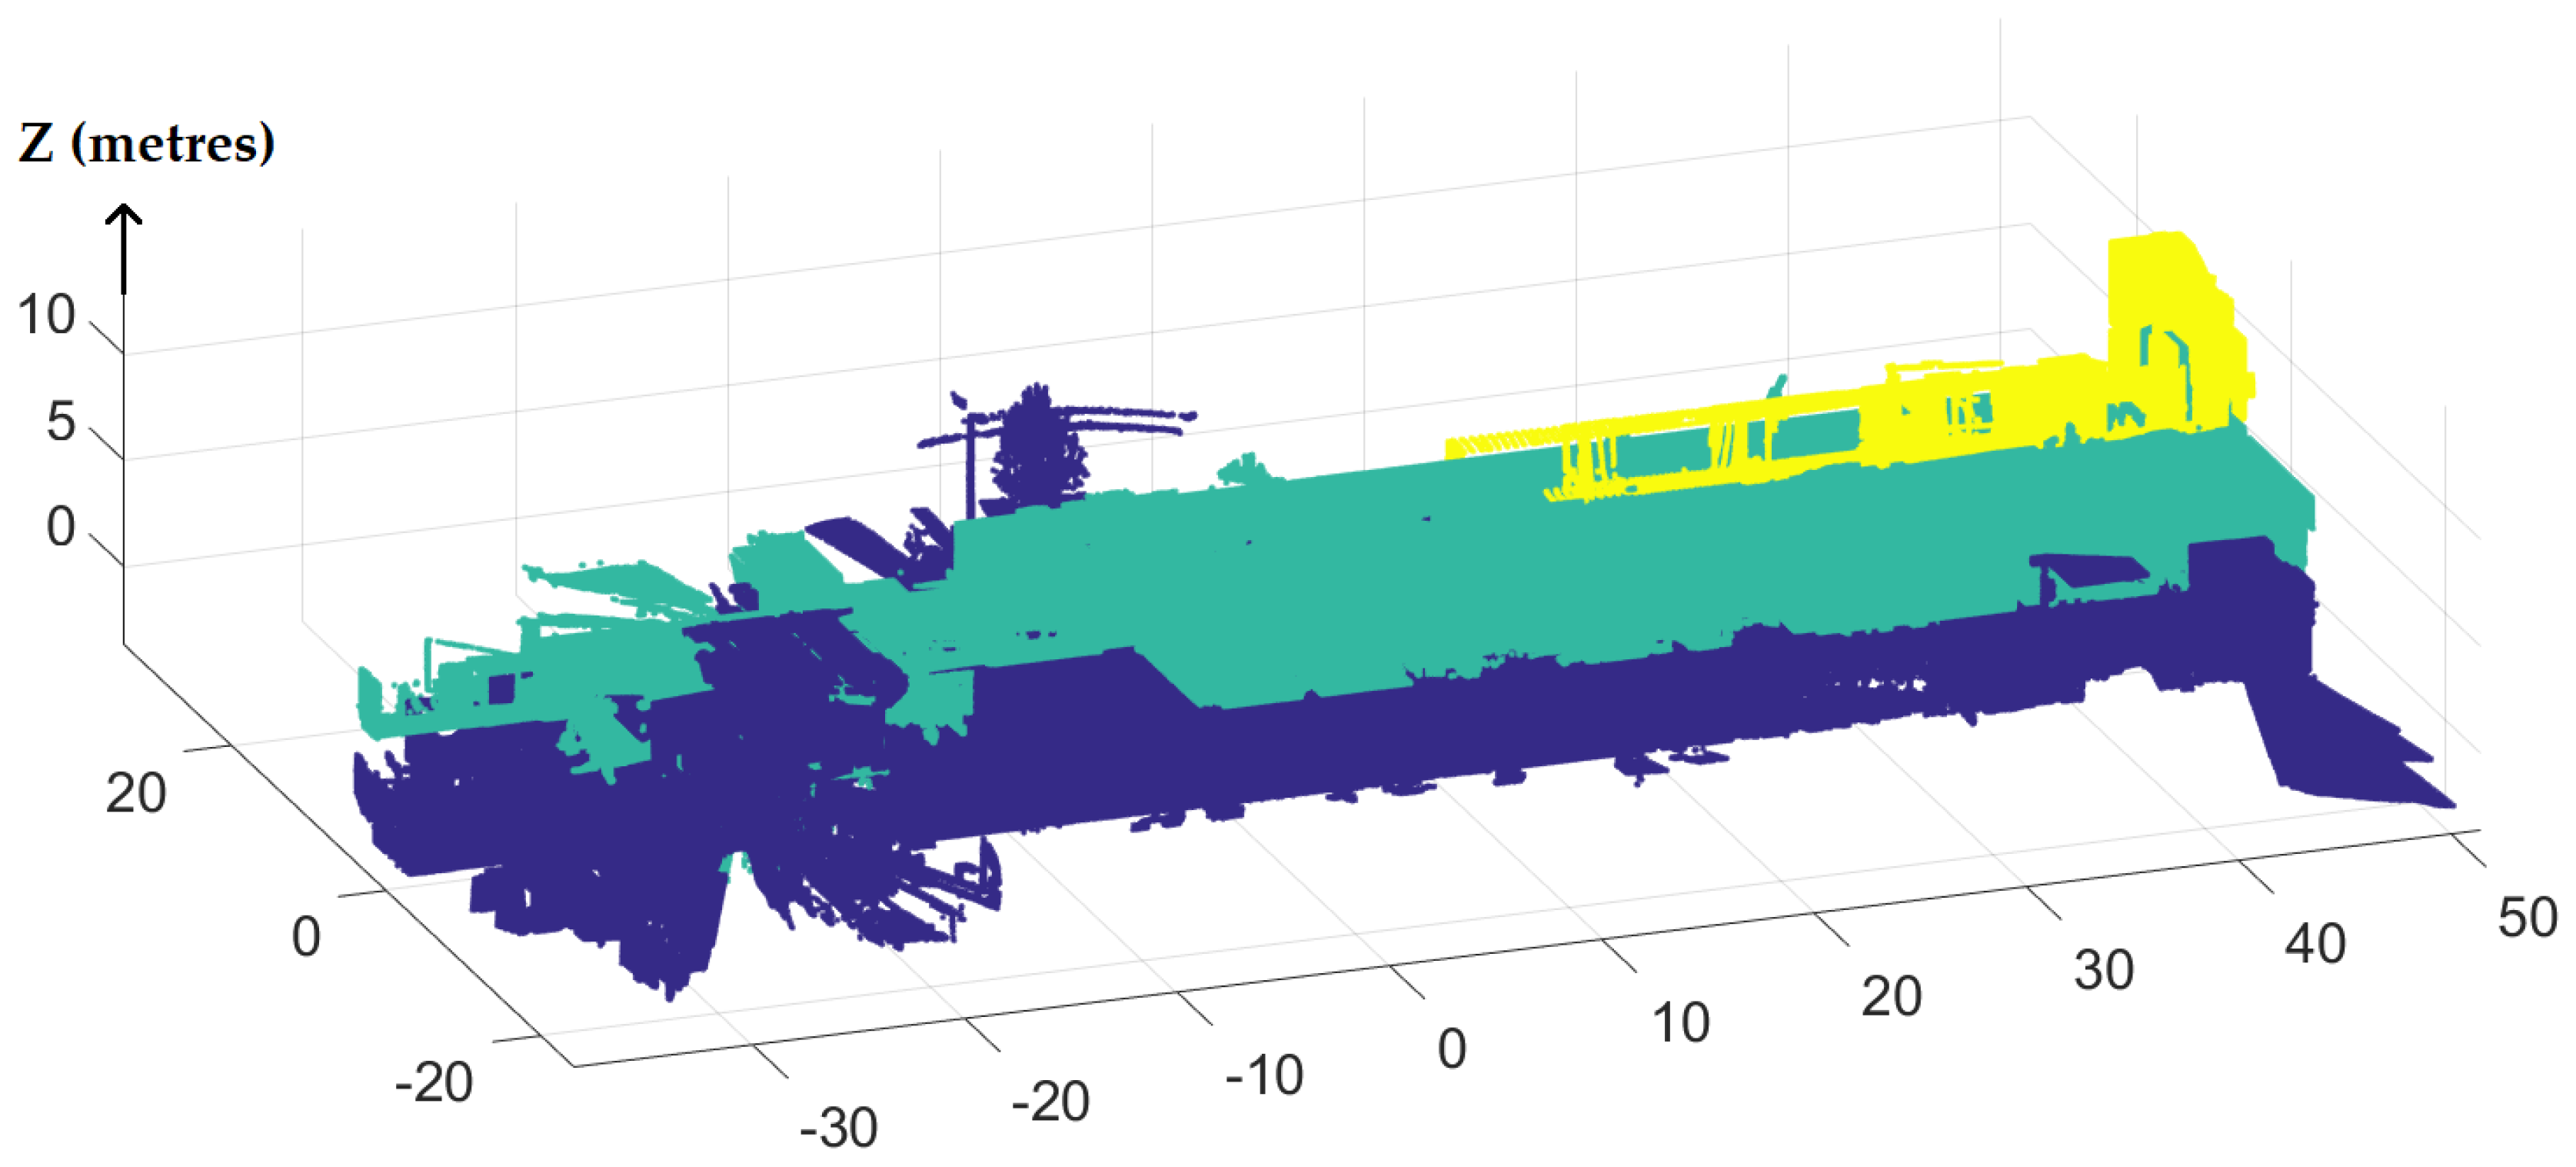
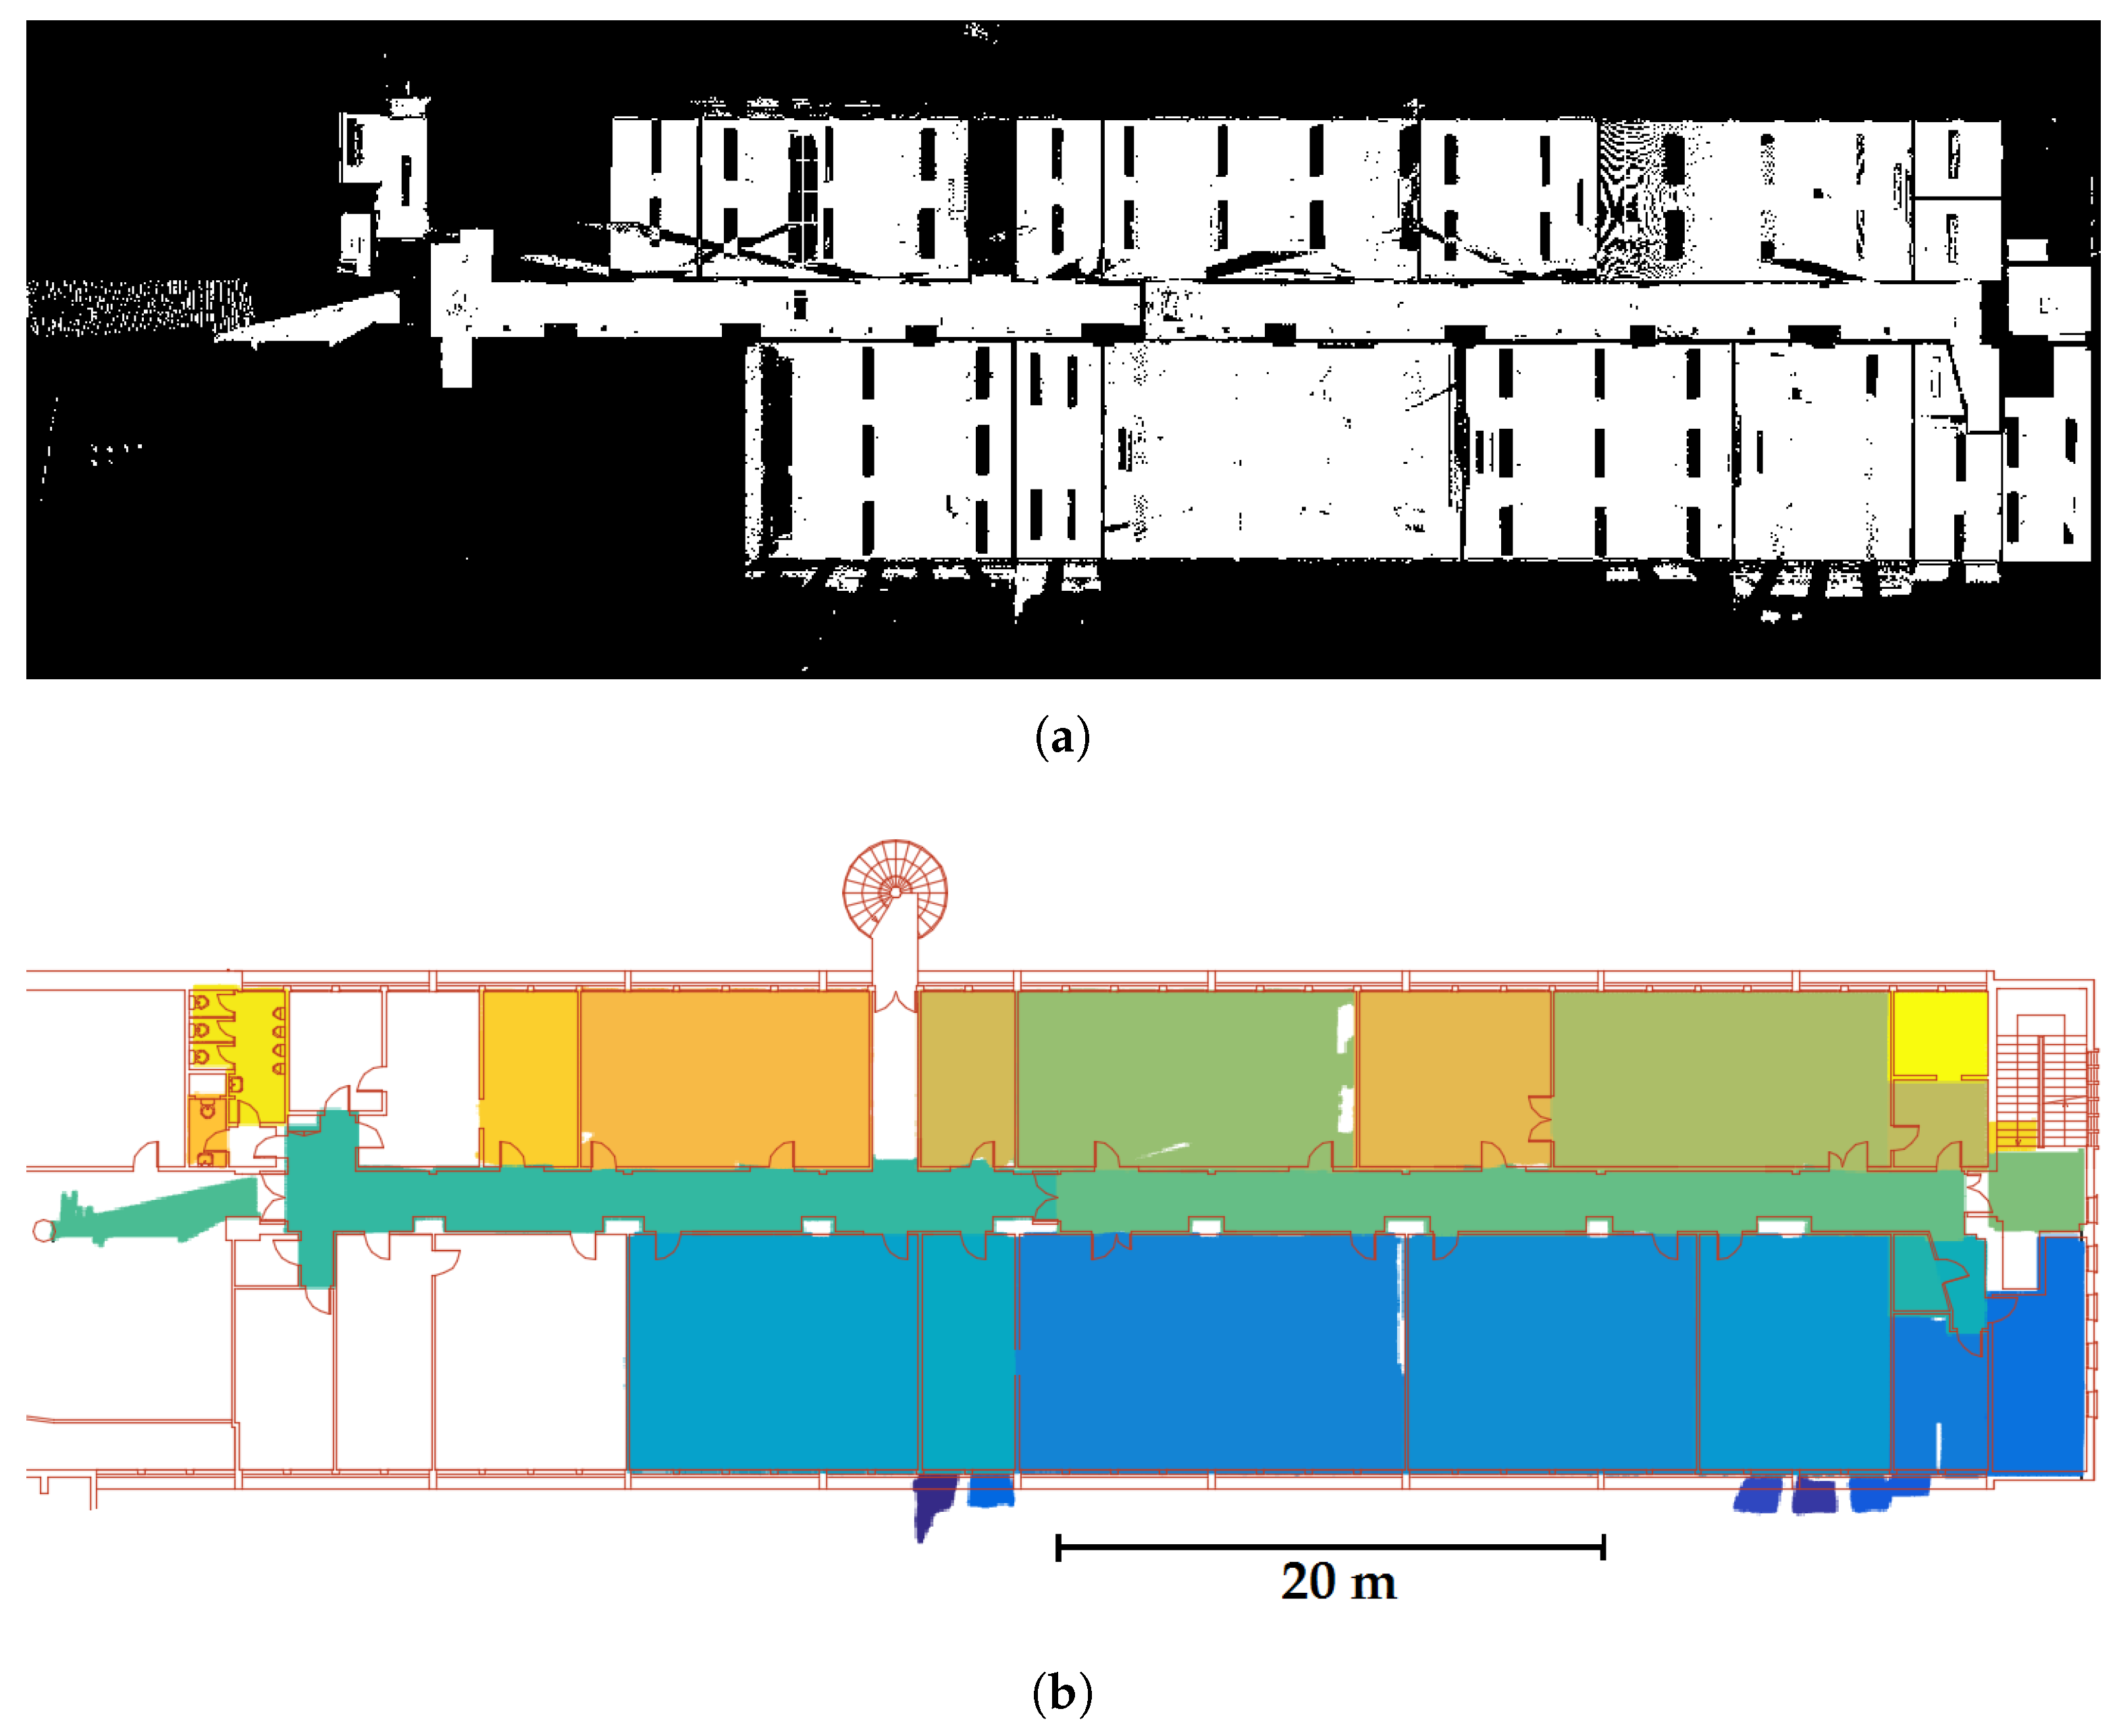
3.2.1. Segmentation into Sub-Spaces

First, a floor segmentation is performed for scans resampled at 1 cm. For each scan, an histogram describing the distribution of points along z axis is created and analysed in order to determine the ground and ceiling altitudes. Thanks to ground altitudes, scans are grouped into several clusters representing the different floors. The floor segmentation result obtained for indoor point clouds presented in Figure 2b is shown in Figure 3.
Figure 3. Floor segmentation result—3 floors of the INSA building (one colour per floor).
Then for each floor, a room segmentation is performed. At this stage, a binary image is generated based on the projection onto an horizontal plane of a slice of point clouds at ceiling levels. The advantage of considering the ceilings is that at this location the point clouds of different rooms are not linked together. A slice of 30 cm was chosen. The distances between the ceilings and interior contours of doors are generally higher than this value. One should note that if the distances are smaller than the defined value, the link between rooms can be removed by considering the standard deviation of points along z axis (explanation below).
The generated binary image for the first floor of INSA building is presented Figure 4a. A pixel is coloured in white if it contains at least one point and in black otherwise. A pixel size of three times the spatial resampling namely 3 cm is chosen. The choice of the image pixel size is induced on one hand by the thinnest wall that can be encountered. A higher pixel size can cause the disappearance of thin walls and can consequently create links between rooms. On the other hand, by considering a spatial resampling of 1 cm the binary image does not contain “holes”. During the creation of the binary image, the standard deviation of points along z axis is also calculated for each pixel. The pixels corresponding to walls have a higher standard deviation and are temporarily coloured in black in the room segmentation process to ensure that there are no links between rooms.
Figure 4. Room segmentation: (a) Generated binary image for the 1st floor of the INSA building. (b) Region growing result superimposed with an existing floor map in red.
A region growing is then applied in the image to identify 2D regions representing rooms. During this process, 2D regions are removed if their surfaces are lesser than a threshold ( s m i n = 1 square metre). The result of the region growing applied to the image Figure 4a is presented in Figure 4b. It is superimposed with an existing floor map. The result is satisfying since the rooms are correctly detected.
Finally, to move from 2D to 3D regions representing the rooms, 2D regions are considered from ground height to ceiling height of the floor. A filter is also considered to eliminate 3D regions which are too small or which do not describe rooms. For this purpose, a minimum height h m i n of 1.8 m was chosen. This choice was induced by the fact that regarding to the French “Carrez” law, parts of an enclosed area with a ceiling height of less than 1.8 m are excluded from the calculation of the effective usable surface area of an accommodation. Moreover, by considering that a room measures at least one square metre of surface, a minimal volume v m i n of 1.8 cubic metres (1 m2× 1.8 m) was fixed. At the end of room segmentation, points which are not assigned to a region are kept aside for a further use.

3.2.2. Segmentations into Planes and Point Classification

Once room point clouds are identified, the altitudes of ceiling and floor of each room are determined. A plane segmentation is performed at these altitudes and points corresponding to ceilings and floors are extracted. A criterion of horizontality ( α h z ) is considered. A robust estimator namely the Maximum Likelihood Estimation SAmple Consensus (MLESAC) is used for plane extraction. This estimator uses the same sampling strategy as RANSAC. However, it presents the benefit that the retained solution maximizes the likelihood rather than just the highest number of inliers as it is done by RANSAC [60]. A tolerance t defining the maximum distance between points and the corresponding plane has to be defined. In our case, it has been fixed to 2 cm for ceiling and floor extraction.
After removing ceilings and floors, room point clouds still contain points belonging to walls but also points belonging to occluding objects such as furniture for example desks, computer equipment, chairs and cabinets (see Figure 5a). At this stage, two assumptions are done: on one hand, points located in the borders of rooms are presumably points belonging to walls, and on the other hand, occluding objects generally do not reach the ceilings. Thus based on both room boundaries determined during the room segmentation, and the higher part of the remaining room point cloud, top of walls are identified and then points belonging to walls can be isolated. Figure 5b shows the classification result obtained for a computer room. Points classified as walls are kept in real colours whereas points belonging to occluding objects are presented in red. Points belonging to occluding objects are removed and stored in a remaining point cloud. A reference point cloud containing points belonging to walls of the first floor of INSA building was segmented manually and compared to the result obtained automatically in order to determine the percentage of points correctly assigned to the wall class (true positives). The result is satisfying since about 93 percent of the points are correctly assigned to the wall class.
Figure 5. Point classification: (a) Perspective and top view of point cloud of a computer room without ceiling and floor. (b) Result of point classification.
A plane segmentation is then performed for points classified as wall points. For that purpose, lines are first extracted in a slice of room point cloud at ceiling level projected in the horizontal plane. A buffer zone is considered around a line and a plane is determined based on points located in this zone. The extracted plane has to be composed of a minimum number of 1800 points ( n b m i n ). This value was established by considering a plane of 1.8 m height ( h m i n ) and 10 cm width as well as the spatial sampling of 1 cm applied to input point clouds. Once again MLESAC is used for plane extraction. The tolerance t defining the maximum distance between points and plane is fixed to 5 cm for wall plane extraction. Considering that portions of walls have to be extracted, a criterion of verticality is imposed. A maximum angular value related to the vertical α v e r t of one degree is defined. Moreover, a filter based on the Root Mean Square Error (RMSE) associated to the extracted planes is considered. Indeed, the extraction of planes can be disturbed by some objects fixed on the walls as for example black boards. A threshold σ p of 2 cm was fixed so that extracted planes which have a RMSE higher than this threshold are not considered.
Given our processing chain, the probability that the first segmentation extracts small planes is low, which is why several segmentations are performed sequentially. For each room point cloud, the number of segmentations to perform is determined automatically by thresholding both the percentage and the number of remaining points in the slice of points ( % p t s r e m a i n i n g > 5% and n b p t s r e m a i n i n g > 400). Moreover, the last segmentation must have extracted at least one plane of 1800 points minimum. At the end of the successive wall planes segmentations, unsegmented points are stored in a remaining point cloud.
Figure 6 presents the results of plane segmentations for several rooms of the 1st floor of the INSA building and the associated numbers of segmentations and extracted planes. The number of segmentations depends on the size of the room and the complexity of the space. One segmentation is required for the segmentation of a small storeroom (Figure 6c) whereas 9 successive segmentations are required for a corridor of about 20 m composed by a plenty of planes.
Figure 6. Plane segmentations of rooms (one colour per plane)—Number of segmentations determined automatically and number of extracted planes.
Finally, all extracted planes of a floor are grouped into walls by using two criteria that are the parallelism and distances between wall planes. Planes which are parallel considering a maximal angular value α of 5 degrees between them are selected. Then, they are grouped if they are close enough from each others. A maximal thickness t h m a x of 50 cm is defined for a wall. Figure 7 shows the result obtained for the first floor of INSA building. Each colour corresponds to one wall. Planes belonging to indoor parts of façade walls are identified by considering the borders of the floor. They are presented in grey in the figure.
Figure 7. Wall identification result (one colour per wall)—1st floor of the INSA building.
Thus, the first part of the developed approach allows identifying wall point clouds. Each wall is composed of 1 to p planes. At this stage, a floor map can be automatically generated by considering the intersection of the extracted planes with an horizontal plane. Moreover, ceiling heights can be deduced from the altitudes of planes corresponding to ceilings and floors.

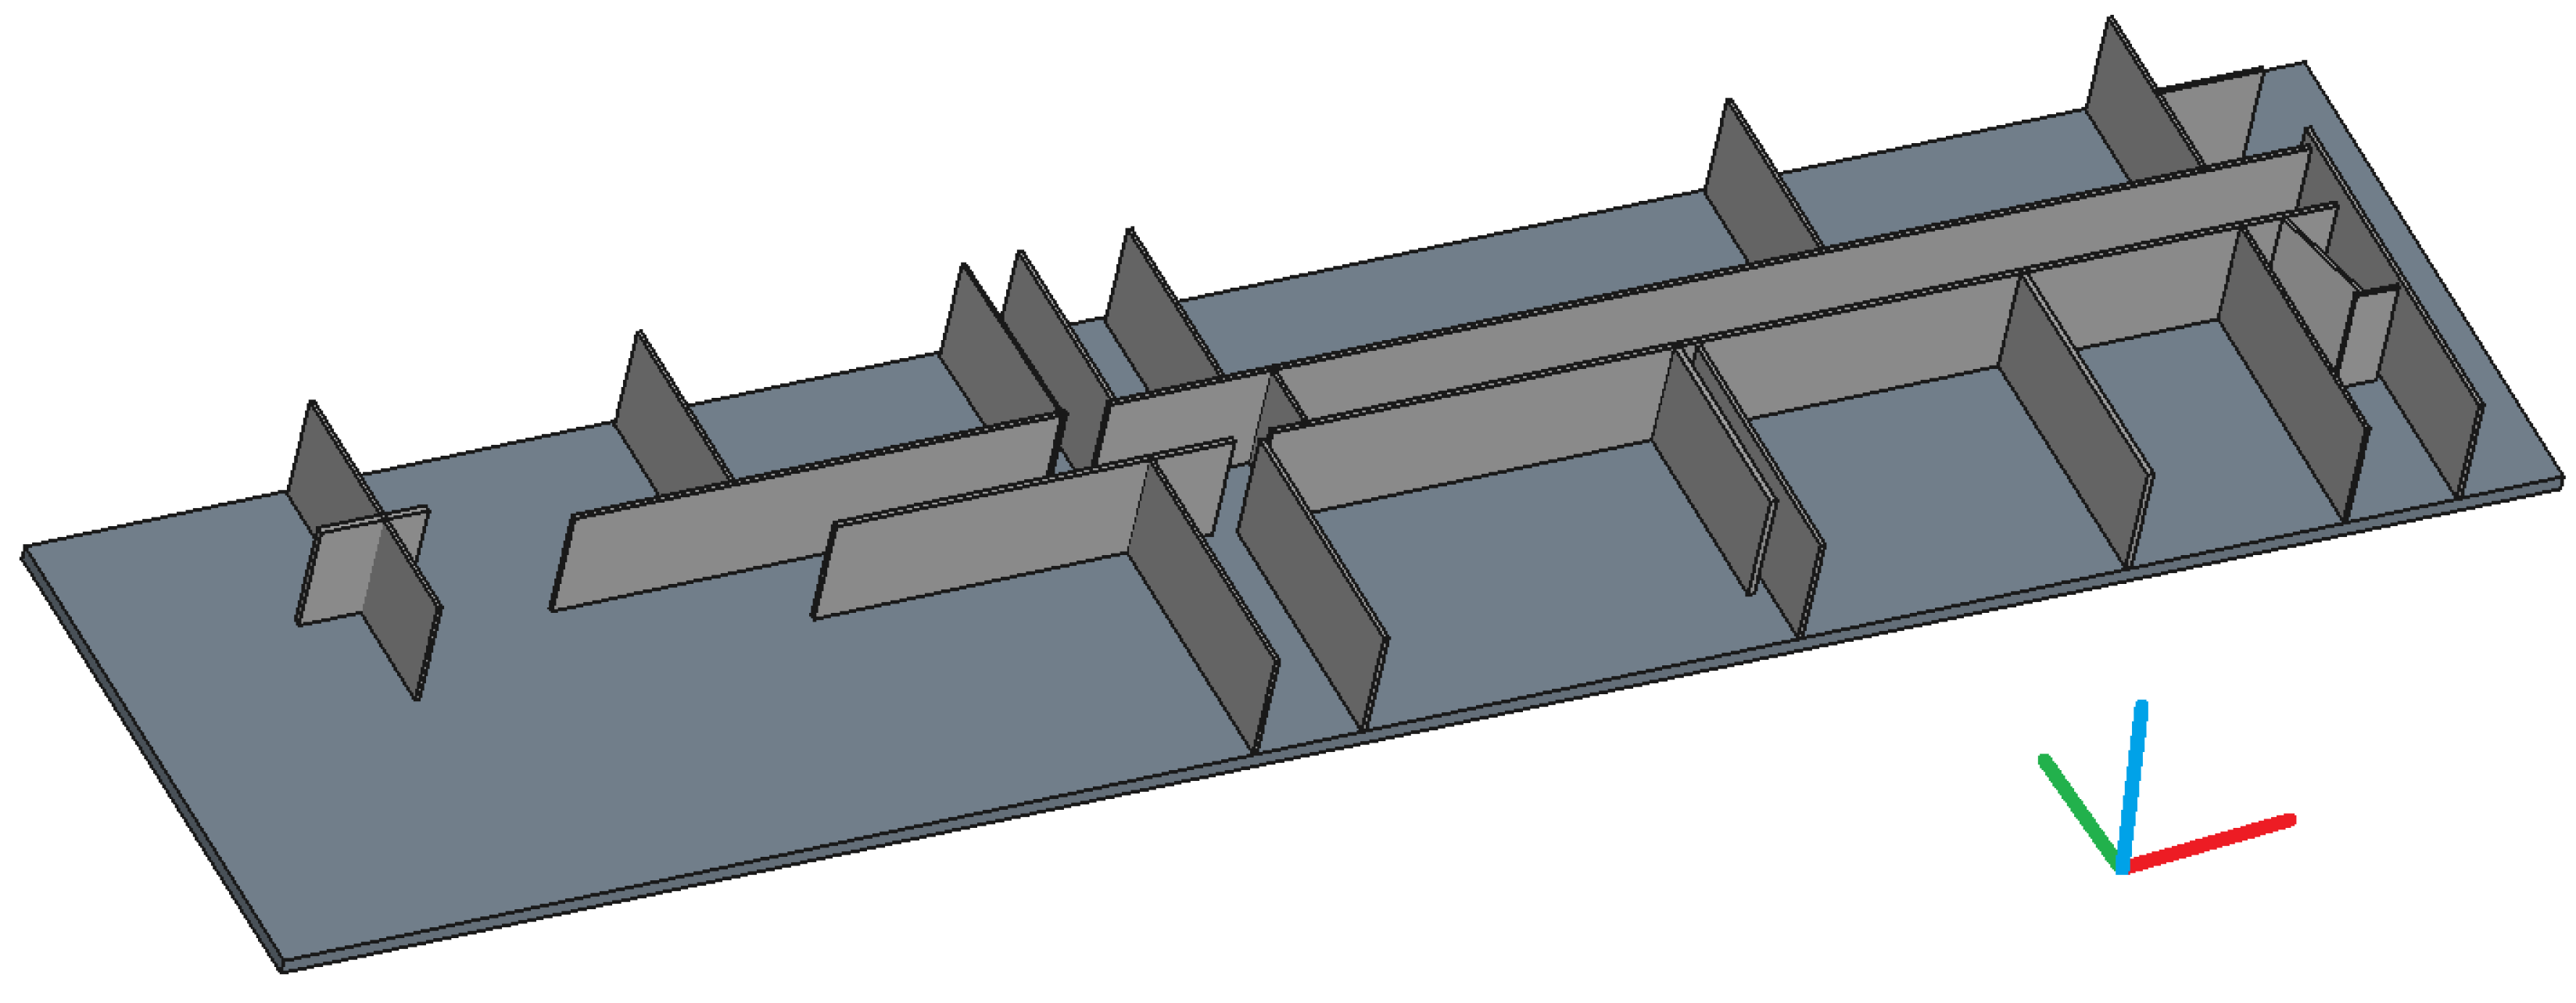
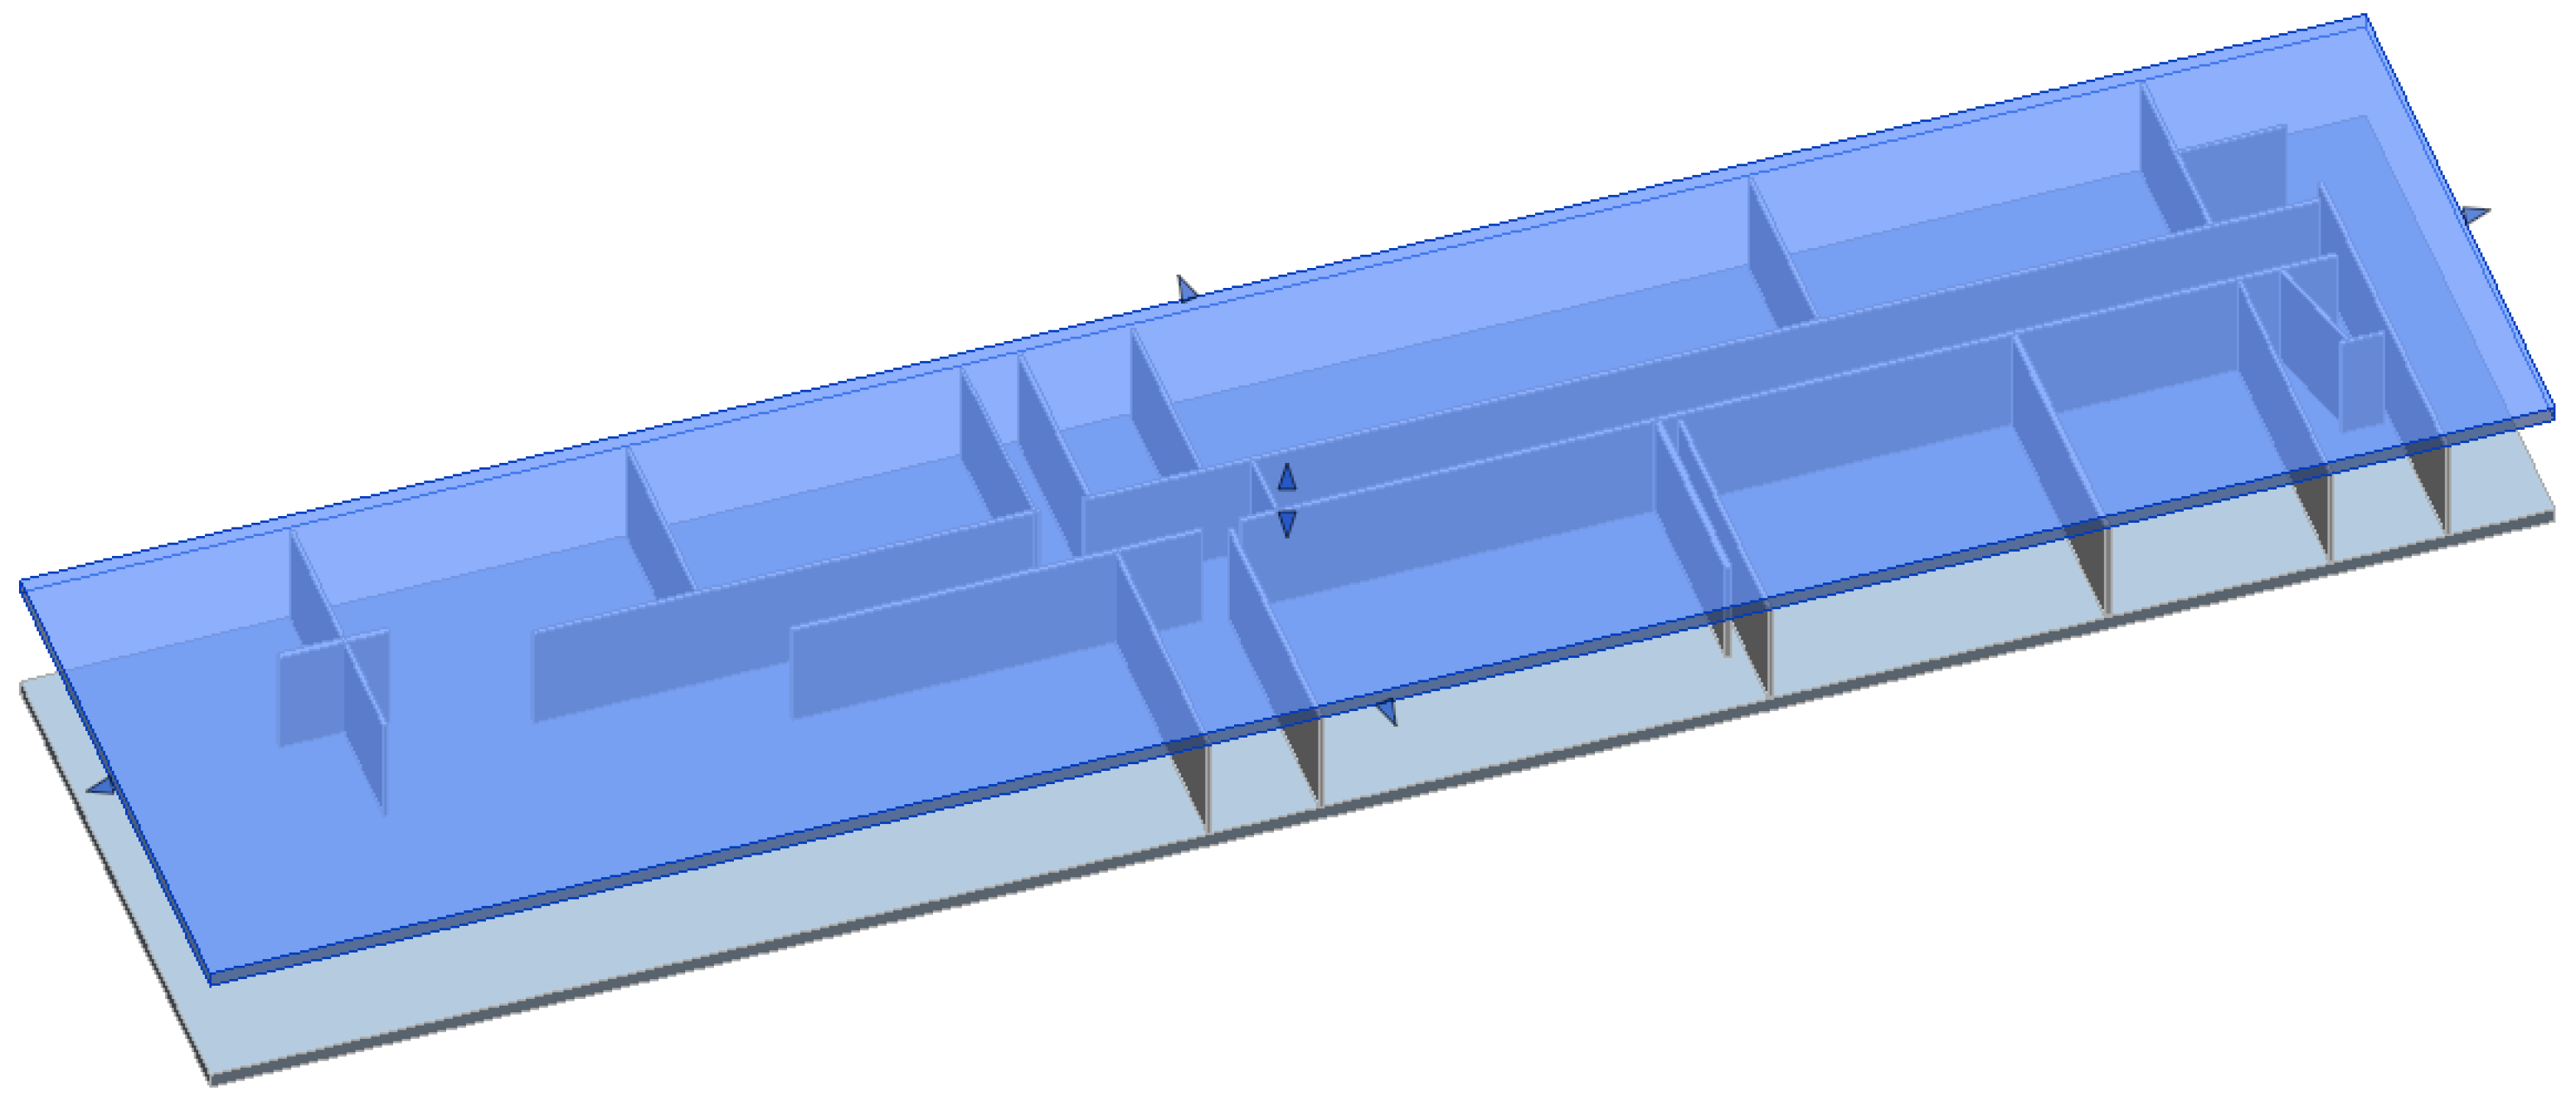
3.3. Reconstruction of Structural Elements

Planes composing walls, ceilings and floors were identified thanks to successive segmentations. These elements are still in form of point clouds. At this stage, a 3D reconstruction of the structural elements of the building (walls and slabs) must be performed. To reconstruct slabs and walls and to export the result into a BIM format, two steps are necessary. The 3D geometry of the elements is first described into the obj format [61] developed by Wavefront Technologies. This format is a simple data-format which is open and which is used by a plenty of 3D graphics applications. It has been chosen as a transition format towards IFC format [62]. The second step consists in translating the 3D geometry of elements into an IFC file in order to be able to open results of the developed approach in BIM software. For this purpose, the FreeCAD software is used. This software has the ability of importing obj file and of creating, from imported objects, building entities in IFC format.

3.3.1. Element Description into Obj Format

Based on point clouds extracted in the first part of the approach, slabs and walls are reconstructed with either volumes or surfaces. Several assumptions are taken into account for the reconstruction: slabs are horizontal, walls follow the vertical and the two sides of a wall are parallel.
For the description of slabs of the building, the altitudes of ceilings and grounds are used. The ground level of a floor describes the upper part of a slab whereas the ceiling level of the floor below describes the lower part of the slab. One should note that if several ceiling levels are encountered for a floor, the highest ceiling level is taken into account for the definition of the slab. A slab is described by a rectangular solid. In the vertical plane the level of the upper and the lower part of the slab is used and in the horizontal plane slab limits are determined considering the contours of the floor. For the two slabs located at the ends, a default value of thickness is used.
The walls identified in the previous part of the approach are composed of 1 to p planes. Their reconstruction consists of adjusting either volumes or surfaces to the wall point clouds. A maximal thickness t h m a x and a minimal thickness t h m i n are defined for this purpose. Depending on the number of planes which compose a wall, different cases appear:
  • Wall composed of one plane: It can be encountered when only one side of a wall is determined or for elements such as pillars. In this case a line is adjusted to the plane point cloud projected in an horizontal plane. The wall portion is described by two points in the X-Y plane.
  • Wall composed of two planes: If the two planes do not describe the two sides of a wall, the method of the case 1 is used. Otherwise, two lines are adjusted to the two plane point clouds projected in the horizontal plane. The wall axis is determined by the average of the two lines and the half-thickness is calculated by the average of distances between the points of both planes and the axis of the wall. Based on the axis and the thickness of the wall, four points are constructed to describe the wall in the X-Y plane.
  • Wall composed of more than two planes: In this case, planes located in each side of the wall are grouped. If only one side is identified, the method of case 1 is used. If two sides are identified, the method proposed in case 2 is considered.
A slab is described by a volume composed of eight points and six facets. A wall is described either by a volume composed of eight points and six facets or by a surface composed of four points and one facet. Based on these information, a file in obj format is created. Figure 8 shows the result of the reconstruction for the 1st floor of the INSA building. In this figure the slab is in grey, the walls reconstructed by volumes are in orange-red and portions of walls reconstructed by surfaces are in yellow.
Figure 8. Reconstruction of slabs and walls—1st floor of the INSA building.

3.3.2. File Generation into IFC Format

The obj format is not a BIM format. Indeed, only the geometry of structural elements is described in a such a file. Neither object class is assigned to elements contrarily to what it is expected in a building information model. A conversion phase is thus necessary to be able to integrate results in BIM software. The Industry Foundation Classes (IFC) format was chosen as format for the output of the approach. The IFC format is a standardized object-based file format used by the AEC industry to facilitate the interoperability between the building actors. Both elements and relationships between elements are described in this type of file. It has the advantage not to be a proprietary format.
In order to generate a file in IFC format from a file created in obj format, the open-source parametric 3D CAD modeller FreeCAD was used. The Architecture module is particularly interesting since it provides BIM workflow to FreeCAD, with support for features like IFC support (thanks to IfcOpenShell, an open source library), fully parametric architectural entities such as walls, structural elements or windows.
The FreeCAD software allows importing the created obj file. Once the file is imported, each object can be selected separately. The objects describing slabs are first selected. A tool provided in the Arch workbench is used to transform these objects into parametric structural entities for which a role property is set (beam, column, slab, roof, foundation, etc.). Similarly, objects describing walls are selected and transformed into parametric wall entities. During the creation of wall entities, walls which are close from each other are joined automatically. Figure 9 shows structural and wall entities created in FreeCAD. One should note that the creation of entities is based on volumes and therefore walls described only by one surface disappear.
Figure 9. Creation of architectural entities in FreeCAD —1st floor of the INSA building.
Finally, structural and wall entities are grouped into a building entity and a file in IFC format is exported. The whole steps carried out in the FreeCAD software (import, creation of structural, wall and building entities and export) can be automated thanks to a script in Python. To check if the export in IFC format works properly, the generated file for the 1st floor of the INSA building was imported into several viewers and several BIM software. The IFC file opened in Revit (Autodesk), a leading BIM software in the market, is presented Figure 10. At this stage, one can imagine to enrich semantically the created model by adding for example information about materials composing walls and slabs.
Figure 10. Rendering of the ifc file into Revit (Autodesk) —1st floor of the INSA building.

4. Assessment of the Developed Approach

As depicted in the introduction of this paper, three items were considered for the development of the approach: the degree of automation, the transferability and the geometric quality. The assessment of the developed approach will consider these items. The developed approach is applied to two datasets with the same thresholds in order to conclude about the degree of automation and the transferability of the approach. The assessment of the approach is divided in two parts. First, results obtained for the segmentations into sub-spaces and planes and the classifications of points into several categories are studied. Then, results of wall and slab reconstructions are presented. The geometric quality of generated models of both buildings under study are analysed. A complete automation of the reconstruction seems utopian. It is essential to be able to locate possible errors in order to proceed to a manual reconstruction in this case. Two quality indexes are proposed to visualise and locate these errors.

4.1. Datasets and Thresholds Used for the Assessment

The approach was developed based on two datasets namely an individual house and the INSA building presented above. Despite two buildings with different characteristics, the developments may have been influenced by particularities of these datasets. Thus, the assessment of the approach has been performed with two other datasets not involved in the development of the approach. In this sub-section, the datasets used for the approach assessment are first presented. Then, a review of thresholds involved in the approach is proposed and default values used for the assessment are listed.

4.1.1. Datasets for the Approach Assessment

During our project, a call for point clouds has been launched. Consecutively to it, four datasets were provided by French Land Surveyors Offices and a French company. It deals with indoor point clouds issued from laser scanning acquisitions. Among these datasets, two datasets were more specifically chosen for the assessment of the approach. They present the advantage of being relatively complete compared to the two others and they concern buildings with different functions and surfaces. Figure 11 presents the two selected datasets. The first dataset deals with an individual house composed of a garden level and a first floor for a total surface of about 200 m2. Indoor point clouds of this house were acquired with a FARO Focus3D S120 laser scanner. The second dataset concerns an office building composed of two blocks and four floors. Indoor point cloud of the biggest block of about 1000 m2 was considered. The laser scanner used for the acquisition was a Leica ScanStation C10. For both datasets, deliverables created manually from point clouds were also provided by the professionals.
Figure 11. Datasets used for the assessment of the approach: indoor point clouds resampled at 1 cm.

4.1.2. Review of Involved Thresholds

The developed approach involves several thresholds which can be classified into the following categories:
  • Thresholds related to spatial resampling of point clouds
  • Thresholds related to space dimensions
  • Thresholds related to constraints and quality criteria
A category of thresholds can be associated to several steps of the approach. Moreover, some thresholds are a combination of categories. Thresholds are often related to both space dimensions and spatial resampling. It is for example the case for the threshold defining the number of points of the smallest 3D region to keep. A synthesis of the main thresholds encountered in the developed approach is proposed hereafter in Table 1. Some of default values of those thresholds are also indicated. In addition, Figure 12 shows where thresholds are used in the approach.
Table 1. Main thresholds involved in the developed approach and default values.
Figure 12. Steps of the developed approach and associated thresholds.
Some thresholds are defined manually. Thresholds related to constraints and quality criteria have to be defined regarding the project specifications and thus they cannot be automated. These thresholds are notably involved in plane segmentations: the maximum distance between a plane and its inliers, the horizontal and vertical constraints and the threshold related to the RMSE of planes. Default values are proposed to the user for such thresholds. Other thresholds are defined manually and are intended to be applied to buildings in general as for example the smallest volume or the smallest plane which have to be taken into account. Default values of those thresholds are also proposed and should be adapted to several datasets of various buildings.
By considering all information given by the user, some thresholds are defined automatically as for example for the minimum number of points of a 3D region. Considering a spatial resampling of 1 cm and a minimum volume of 1.8 cubic metres (1 metre by 1.8 m height), the smallest 3D region would count 92,000 points.
The approach was obviously developed so that it can be applied to all datasets having characteristics described in project framework. The approach was applied to the two presented datasets with the proposed default values of thresholds. The results will allow concluding about the generalisation of the use of thresholds defined manually but also about the adaptation of thresholds established automatically. In this way, the transferability of the approach is investigated.

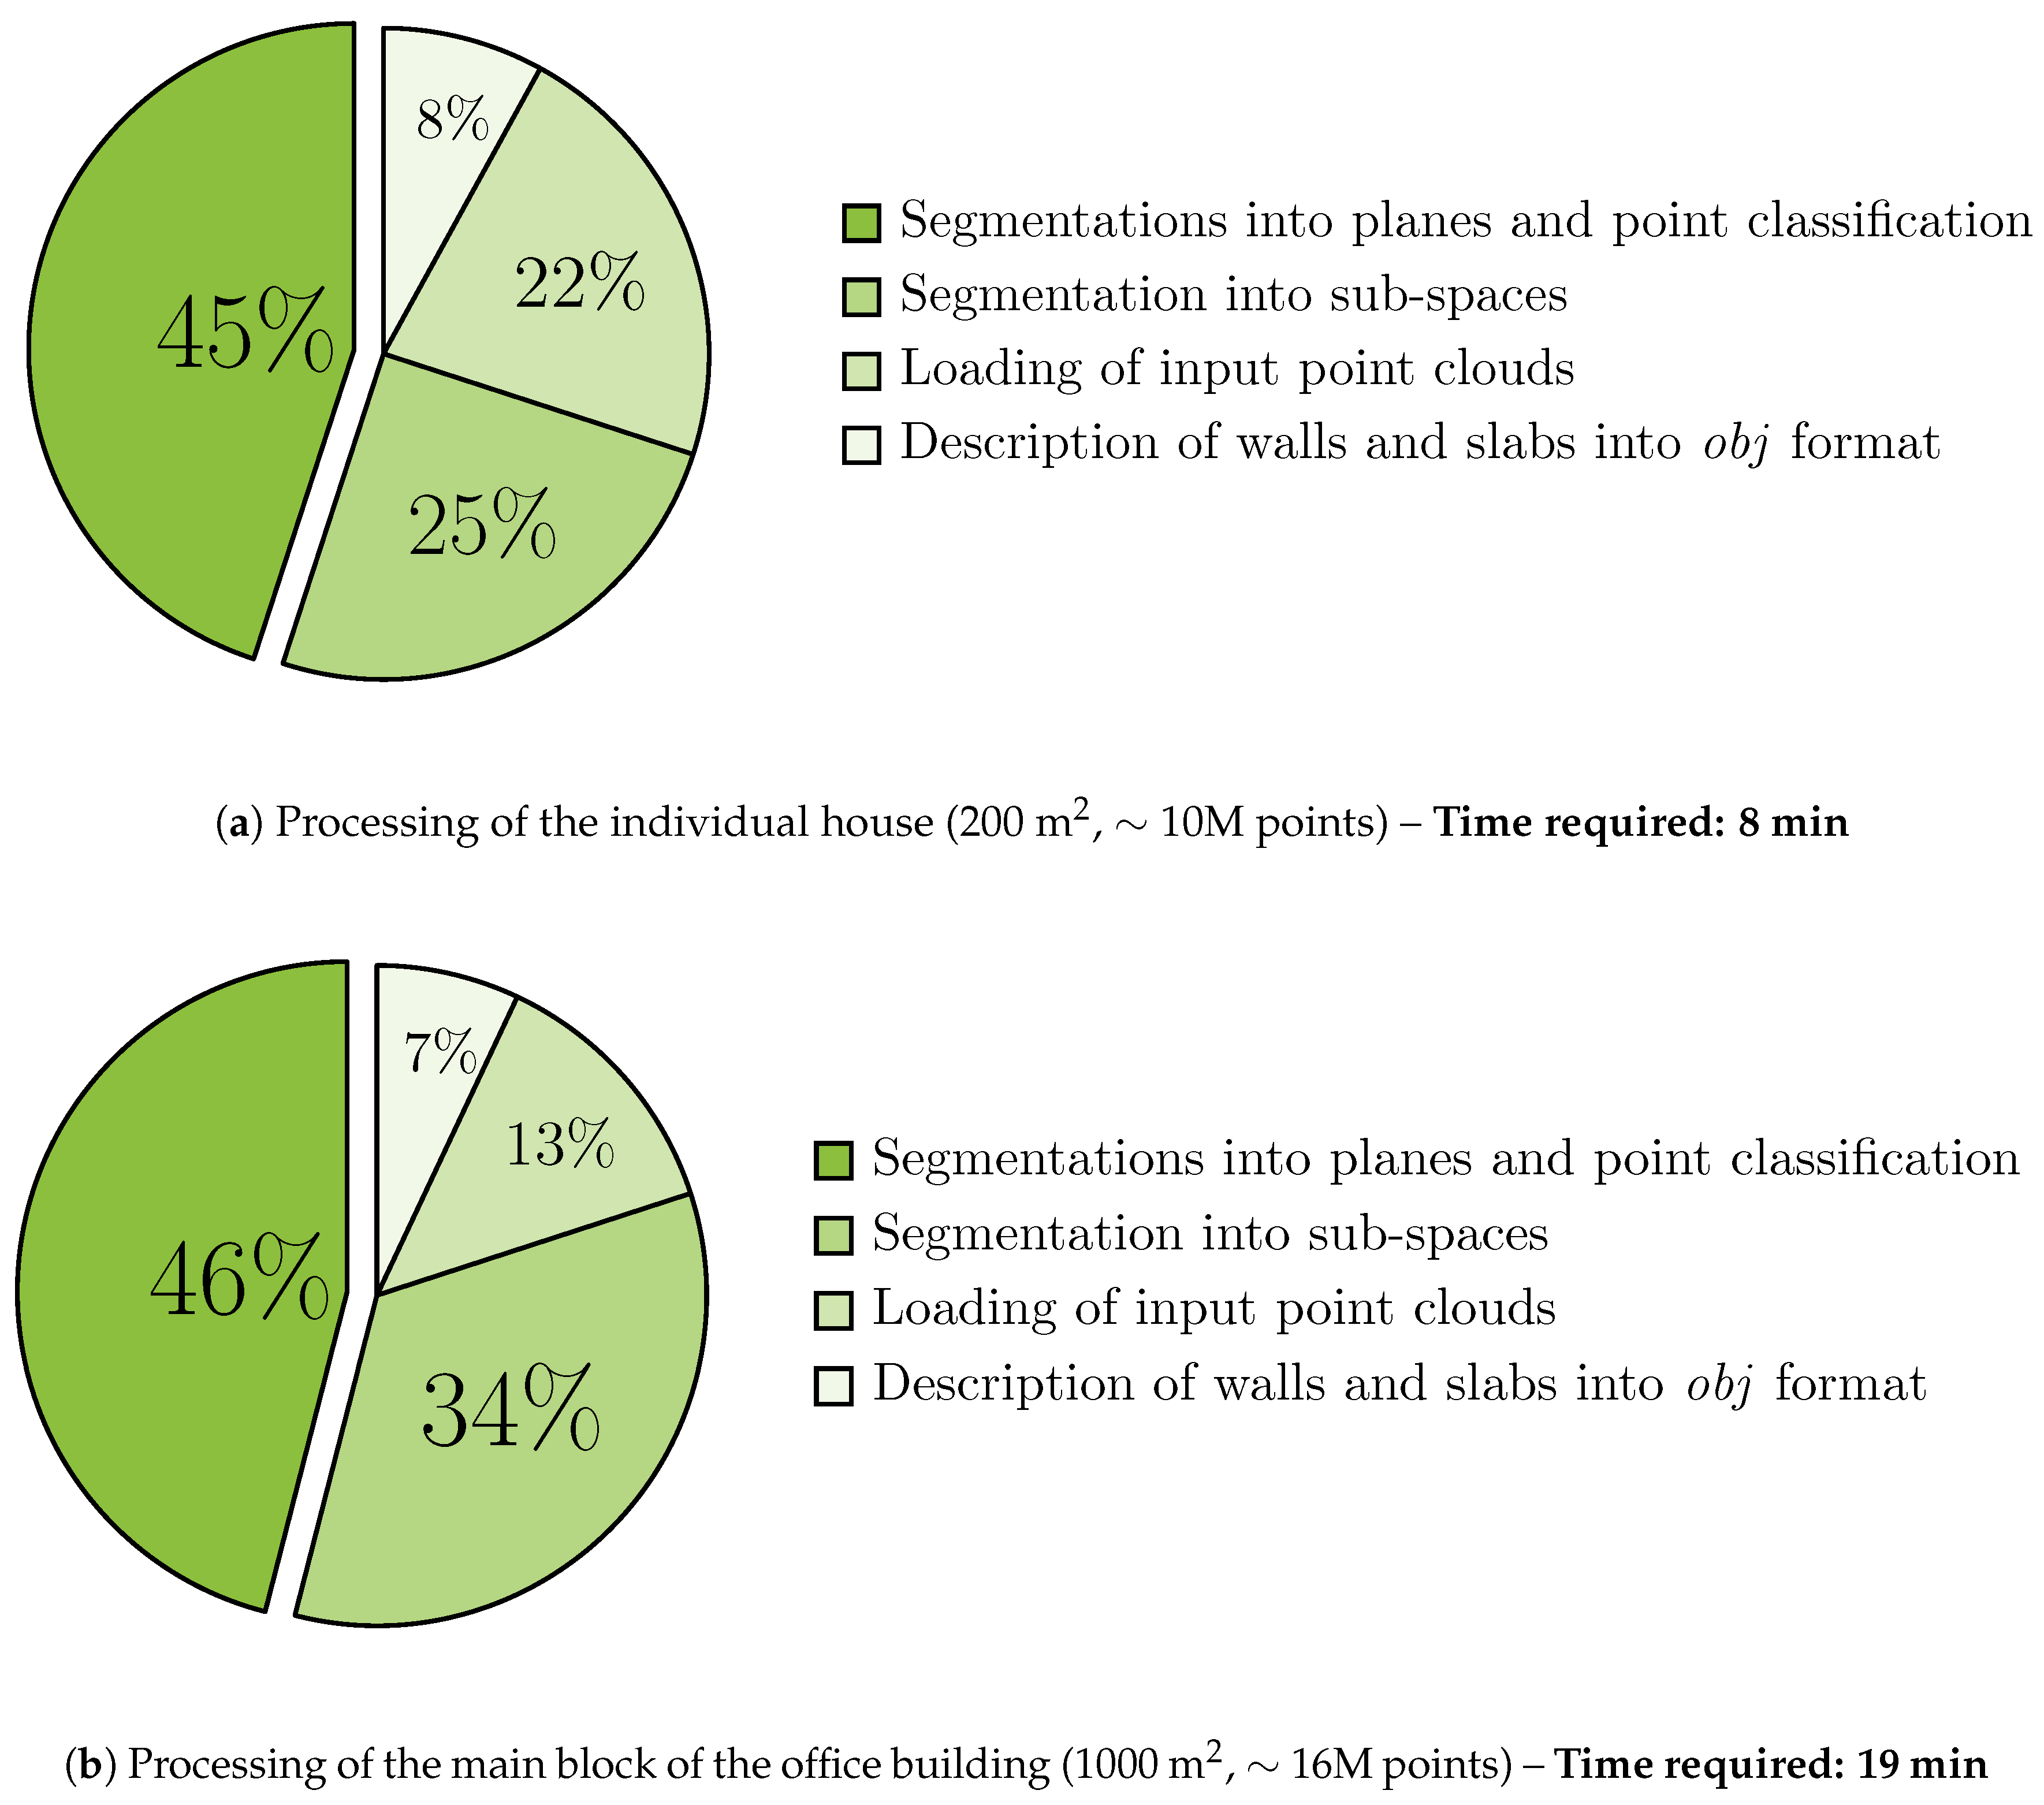
4.1.3. Processing of Datasets

The developed approach was applied to the two presented datasets with the default threshold values proposed Table 1. The automatic 3D reconstruction of walls and slabs required a processing time of 8 min for the individual house and 19 min for the office building. Figure 13 shows for each dataset the repartition of processing time regarding the main steps of the approach namely the loading of point clouds, the segmentation into sub-spaces, the segmentations into planes and the point classification and finally the description of walls and slabs into obj format. One can observe that the repartition is quite similar for the two datasets. The most time consuming step is the segmentations into planes and the point classification which represents almost 50% of the processing time. The percentage of time required for the segmentation into sub-spaces is higher for the office building since the considered surface is five times higher than the surface of the individual house.
Figure 13. Repartition of the processing time regarding the main steps of the developed approach.

4.2. Assessment of Segmentations and Point Classification

In this sub-section, the results of the first part of the approach are investigated. Results of segmentations into sub-spaces and planes are assessed. The semantic aspect is also considered since the classification of points into several categories is analysed.

4.2.1. Segmentation into Sub-Spaces

Table 2 presents the results of floor segmentation for the two datasets and the results of room segmentation for one floor of each building. For both datasets floors are correctly identified. Results of room segmentation are also very satisfying. Indeed, 3D regions describing rooms are distinct from each other. Considering all the rooms of the two buildings, only two of them were falsely fused. This fusion is due to the fact that one of the room was not complete in the initial point cloud and a part of the wall between the rooms was missing.
Table 2. Results of the segmentations into sub-spaces (one colour per sub-space).
The analysis of remaining point clouds of segmentations into sub-spaces is also instructive. For the individual house, all rooms were extracted, whereas for the office building, two rooms out of forty one were not extracted and are in the remaining point cloud. It deals with small rooms partially scanned and for which the minimal density of points required by the approach is not reached. One can also notice that small parts of three rooms are present in the remaining point cloud also because of a too small density of points in the input point clouds.

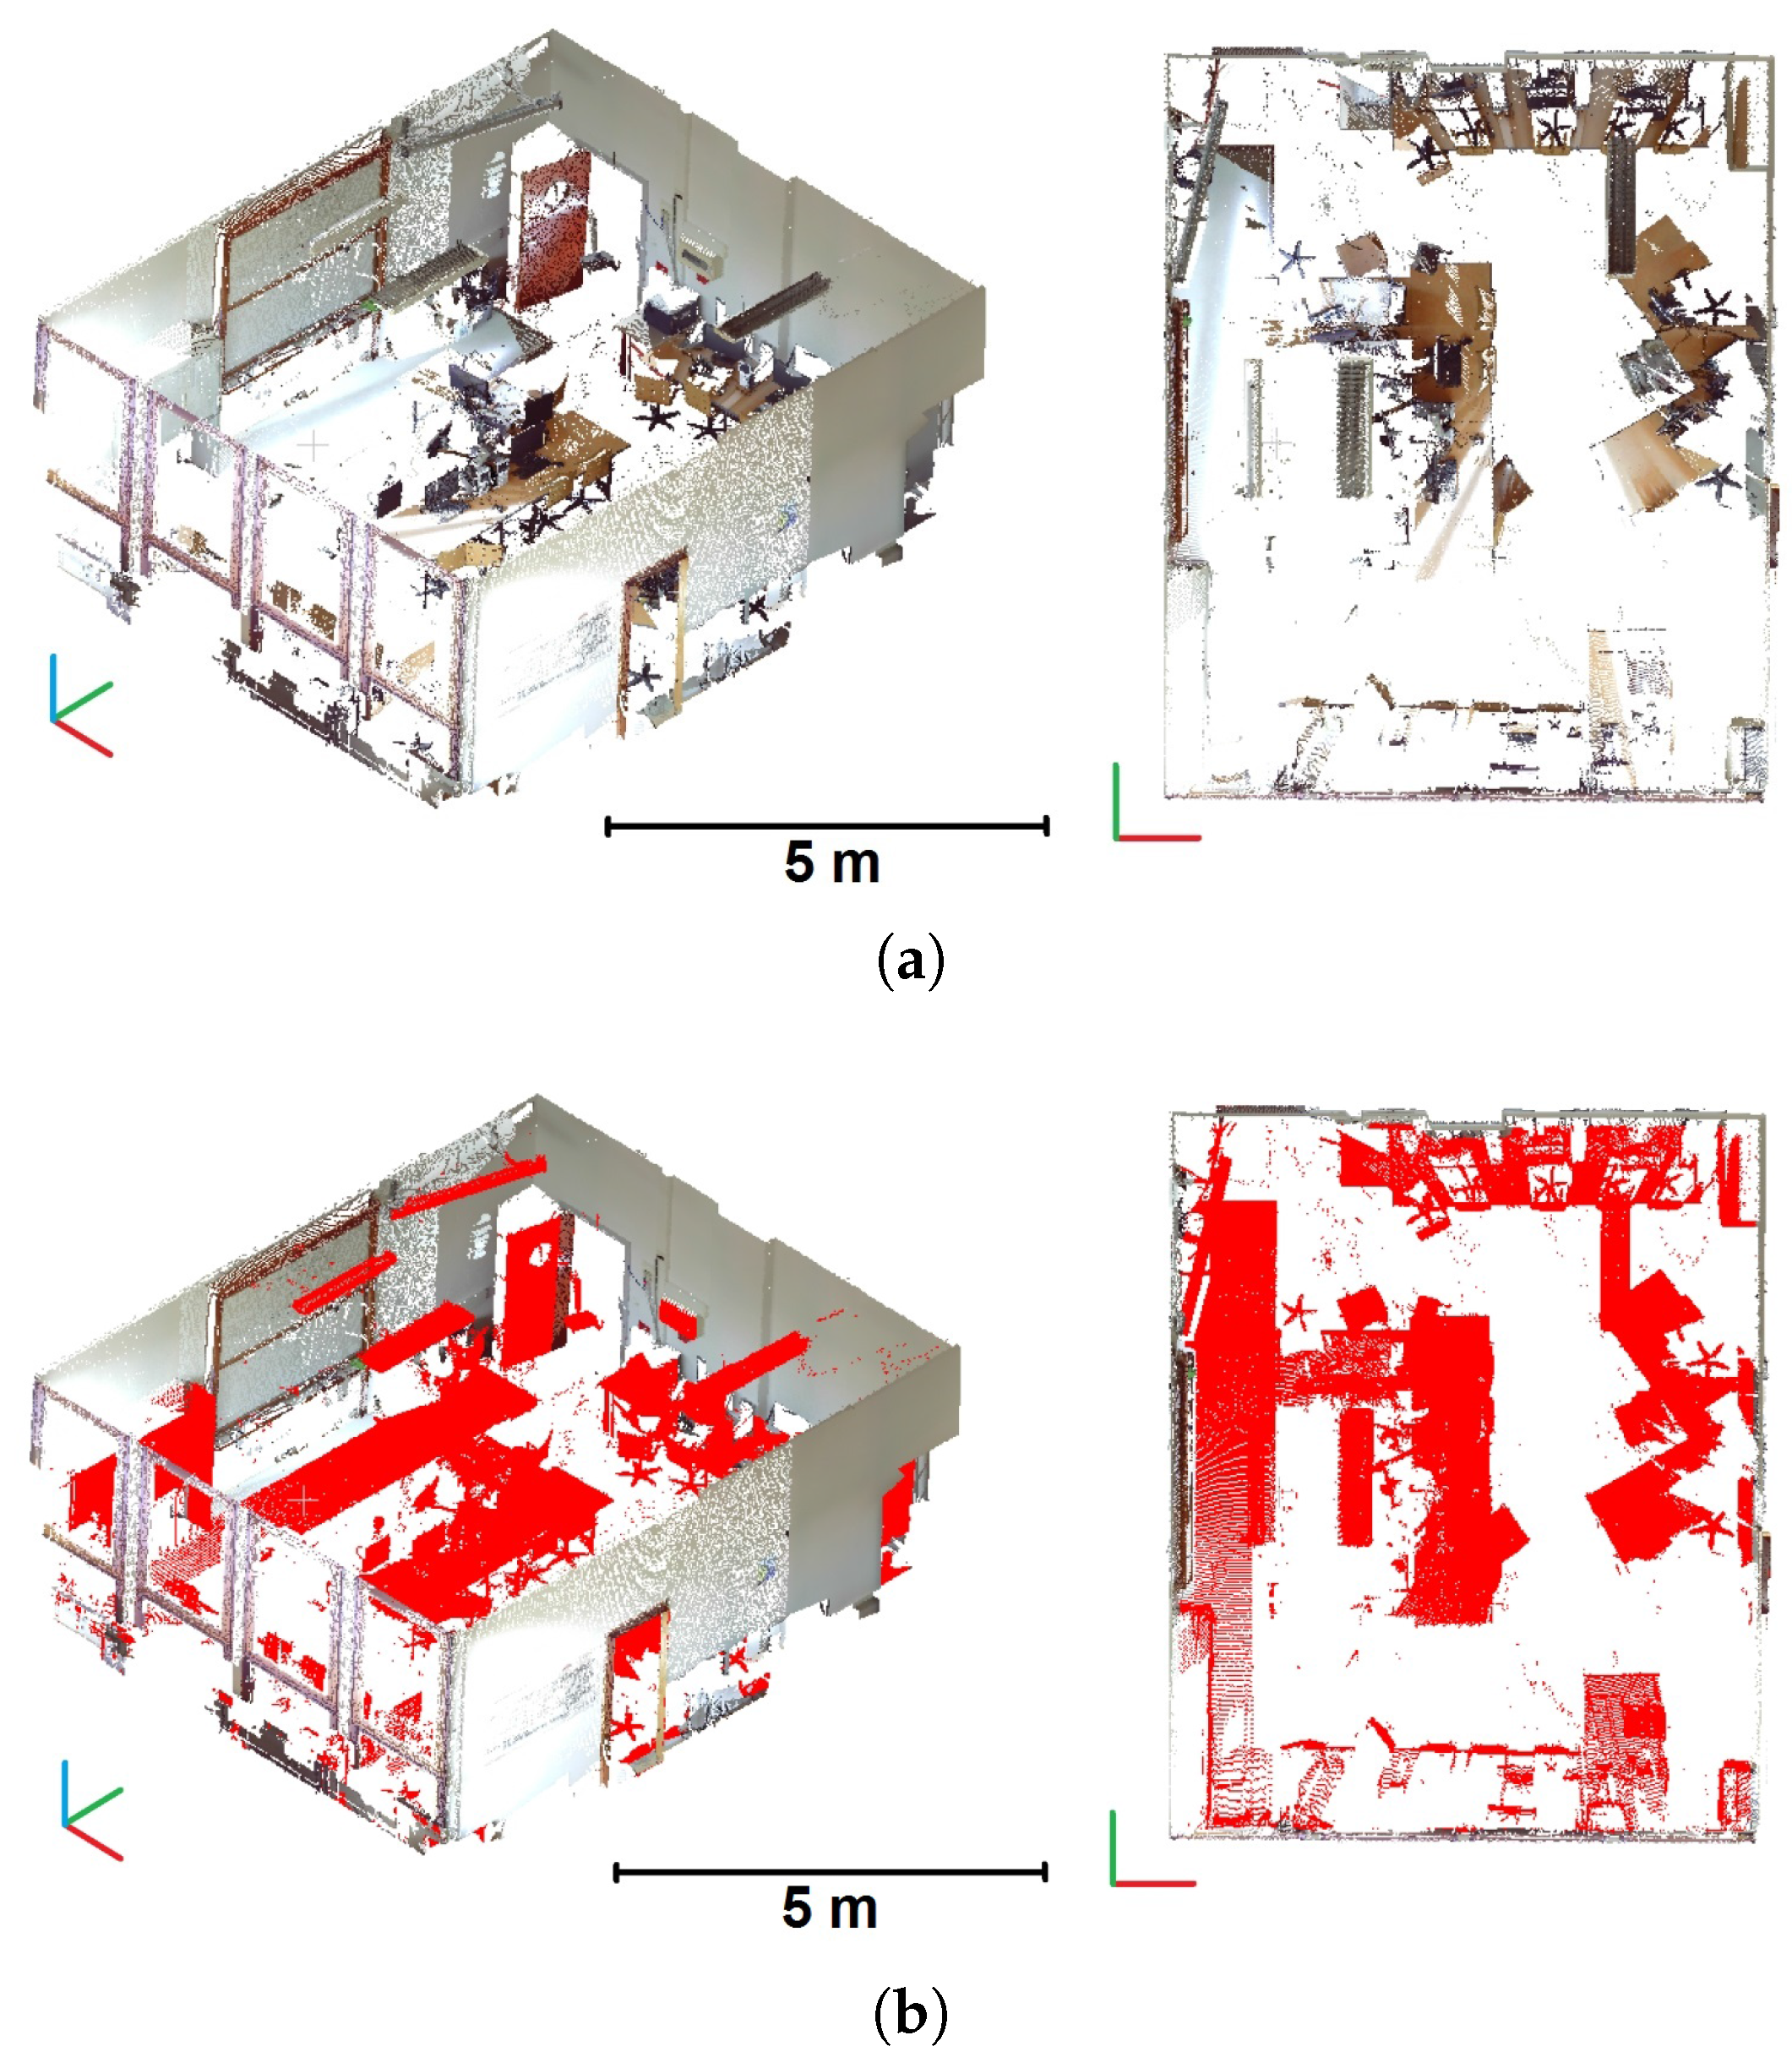
4.2.2. Classification of Points into Several Categories

During the successive segmentations of room point clouds, points composing each room are classified as ceilings and floors, walls or occluding objects. In order to assess this classification, reference point clouds were segmented manually from room point clouds obtained after the segmentation into sub-spaces. Regarding a floor, points corresponding to ceilings and grounds are first segmented. Then, in a top view, points corresponding to walls and occluding objects are separated. In case of doubt on the nature of points, provided deliverables were examined carefully. Comparisons between the point clouds obtained automatically and the reference point clouds segmented manually allows determining the percentages of true positives, false positives and false negatives for each category and for each building. Moreover, for each building the precision and the recall of each category are calculated based on the following formulas [63], p. 138:
p r e c i s i o n = T P T P + F P
r e c a l l = T P T P + F N
Results of the assessment of point classification into several categories are presented Table 3. For both datasets, results obtained for the category “ceilings and grounds” are very satisfying since a high percentage of true positives is combined with a low percentage of false negatives. For ”walls” and “occluding objects” categories, results are satisfying but some exchanges of points between the two categories are observed. These exchanges are mostly due to the fact that a lot of objects are very close or leaned against walls. For the individual house, points belonging to cupboards embedded in walls were falsely classified as walls because they are located in the borders of rooms. This explains that 21% of false negatives are observed for the "occluding objects" category.
Table 3. Assessment of point classification into several categories.

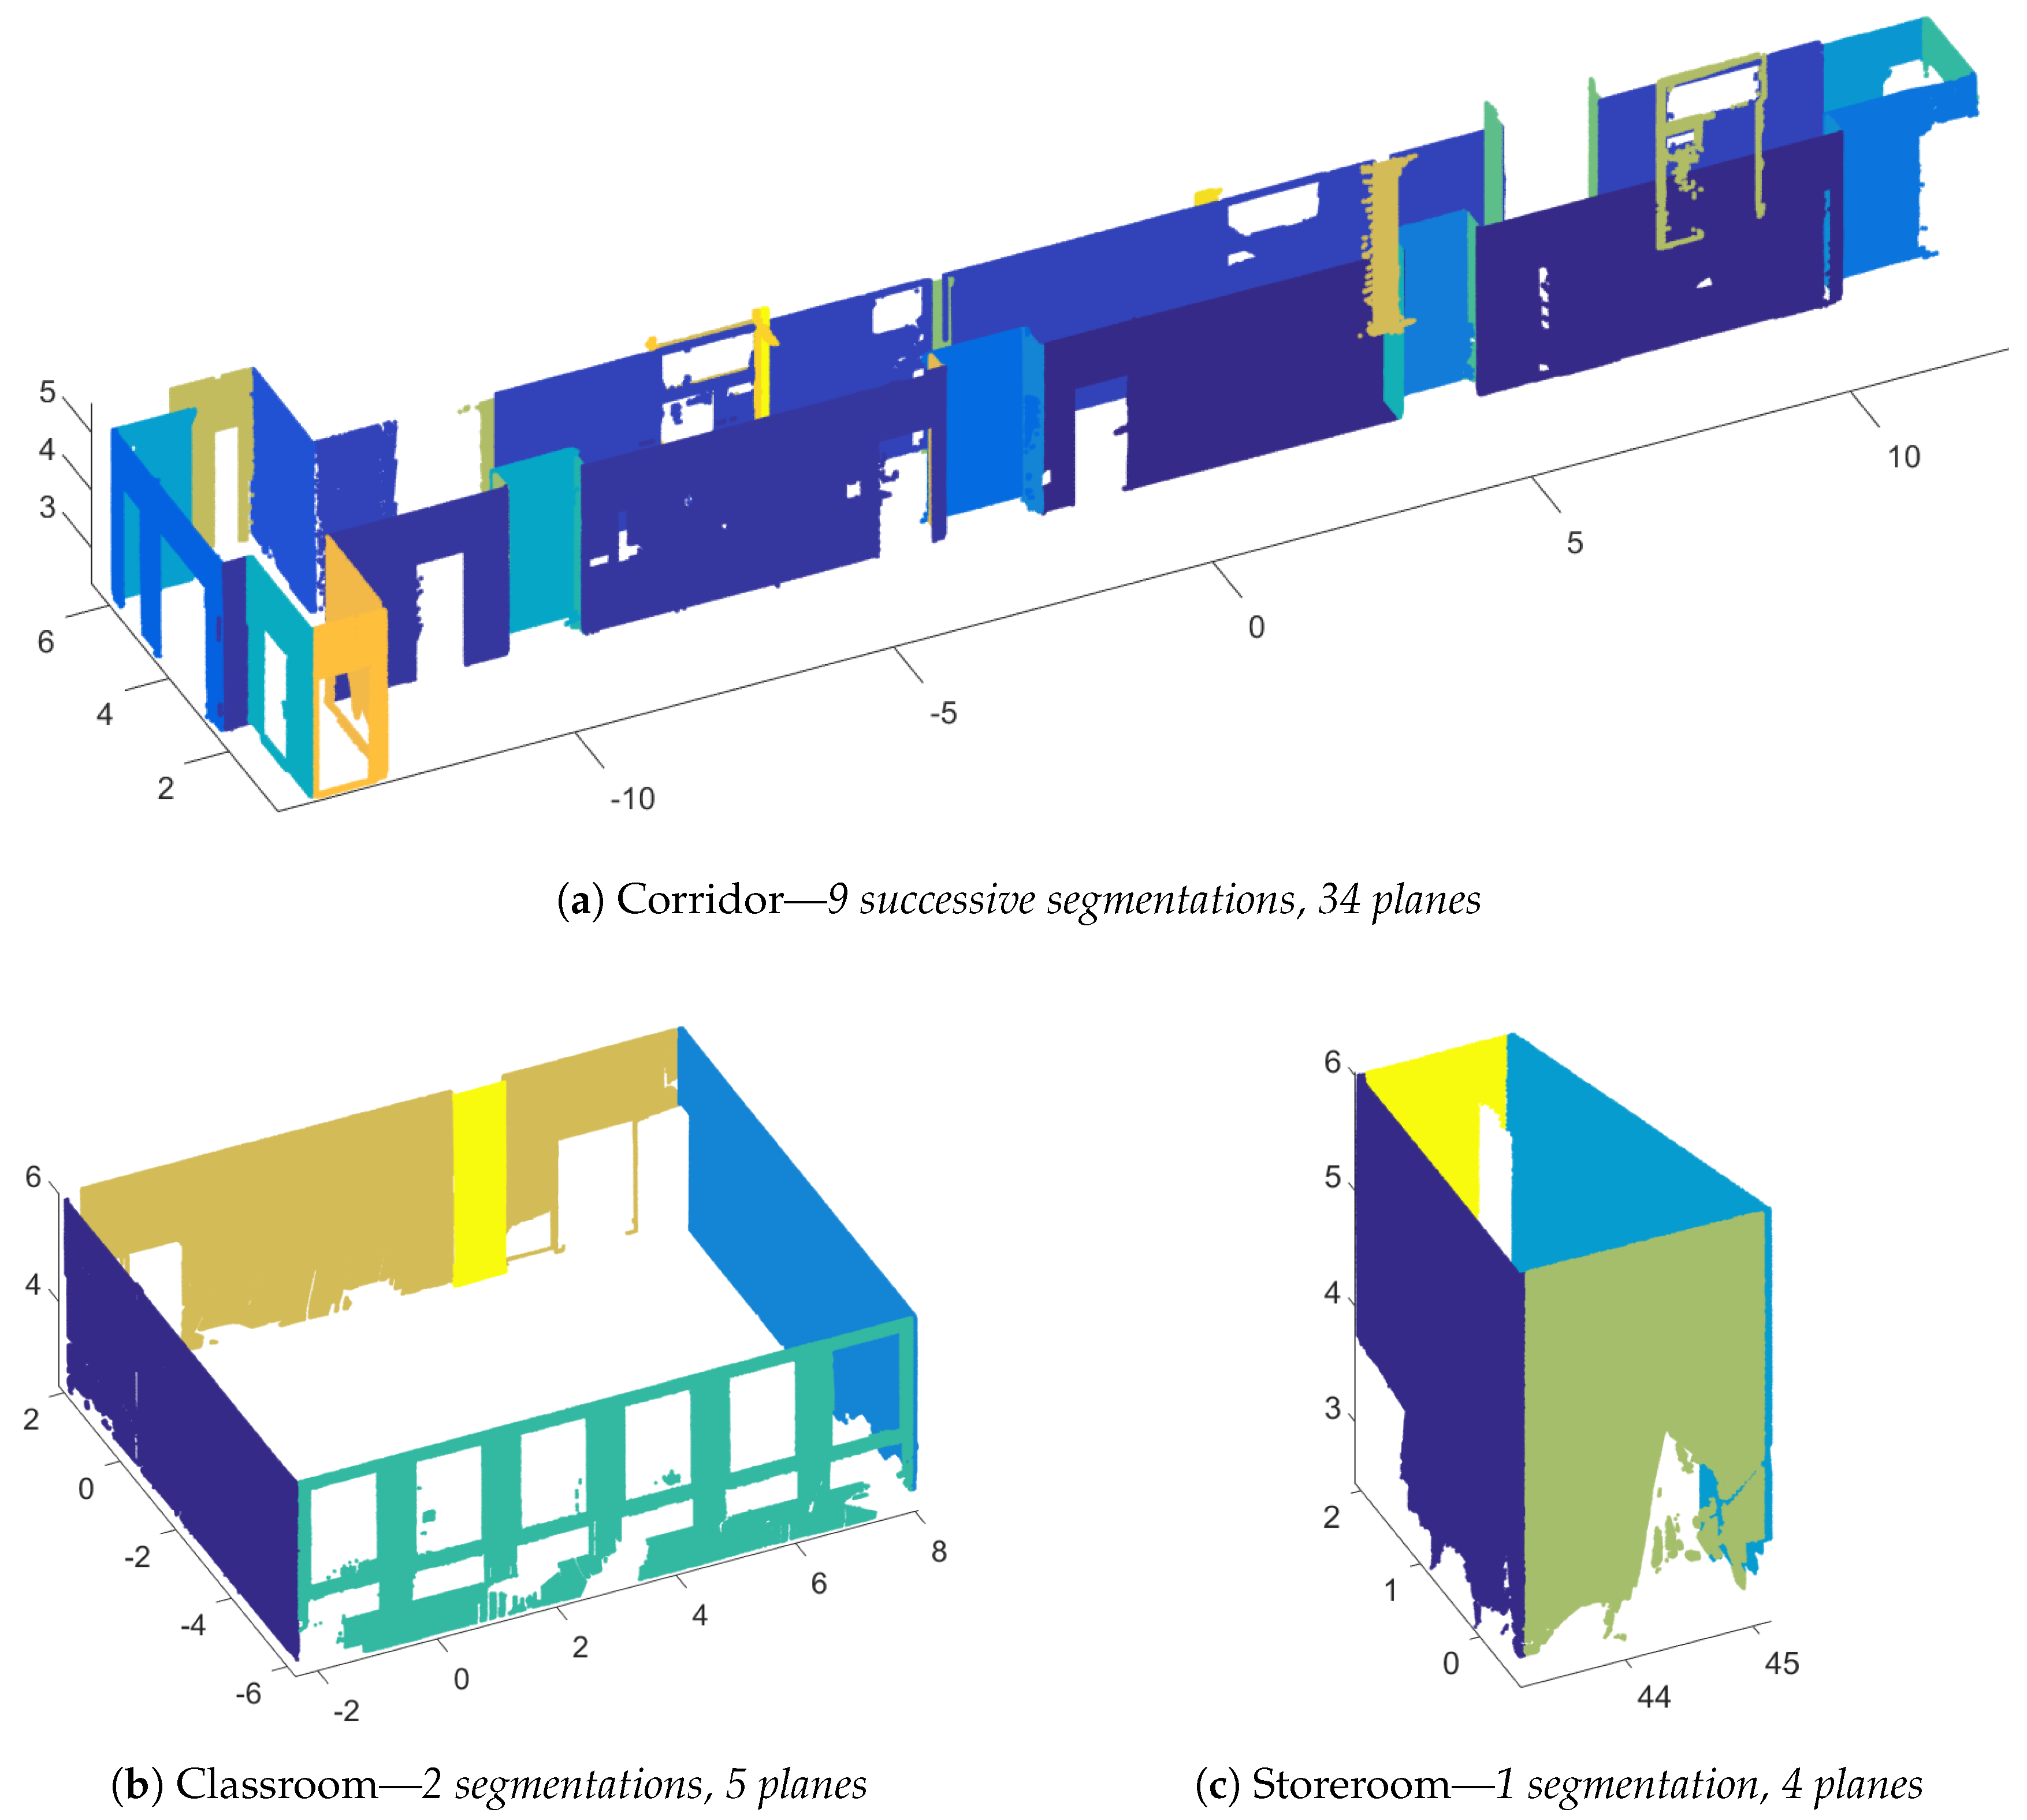
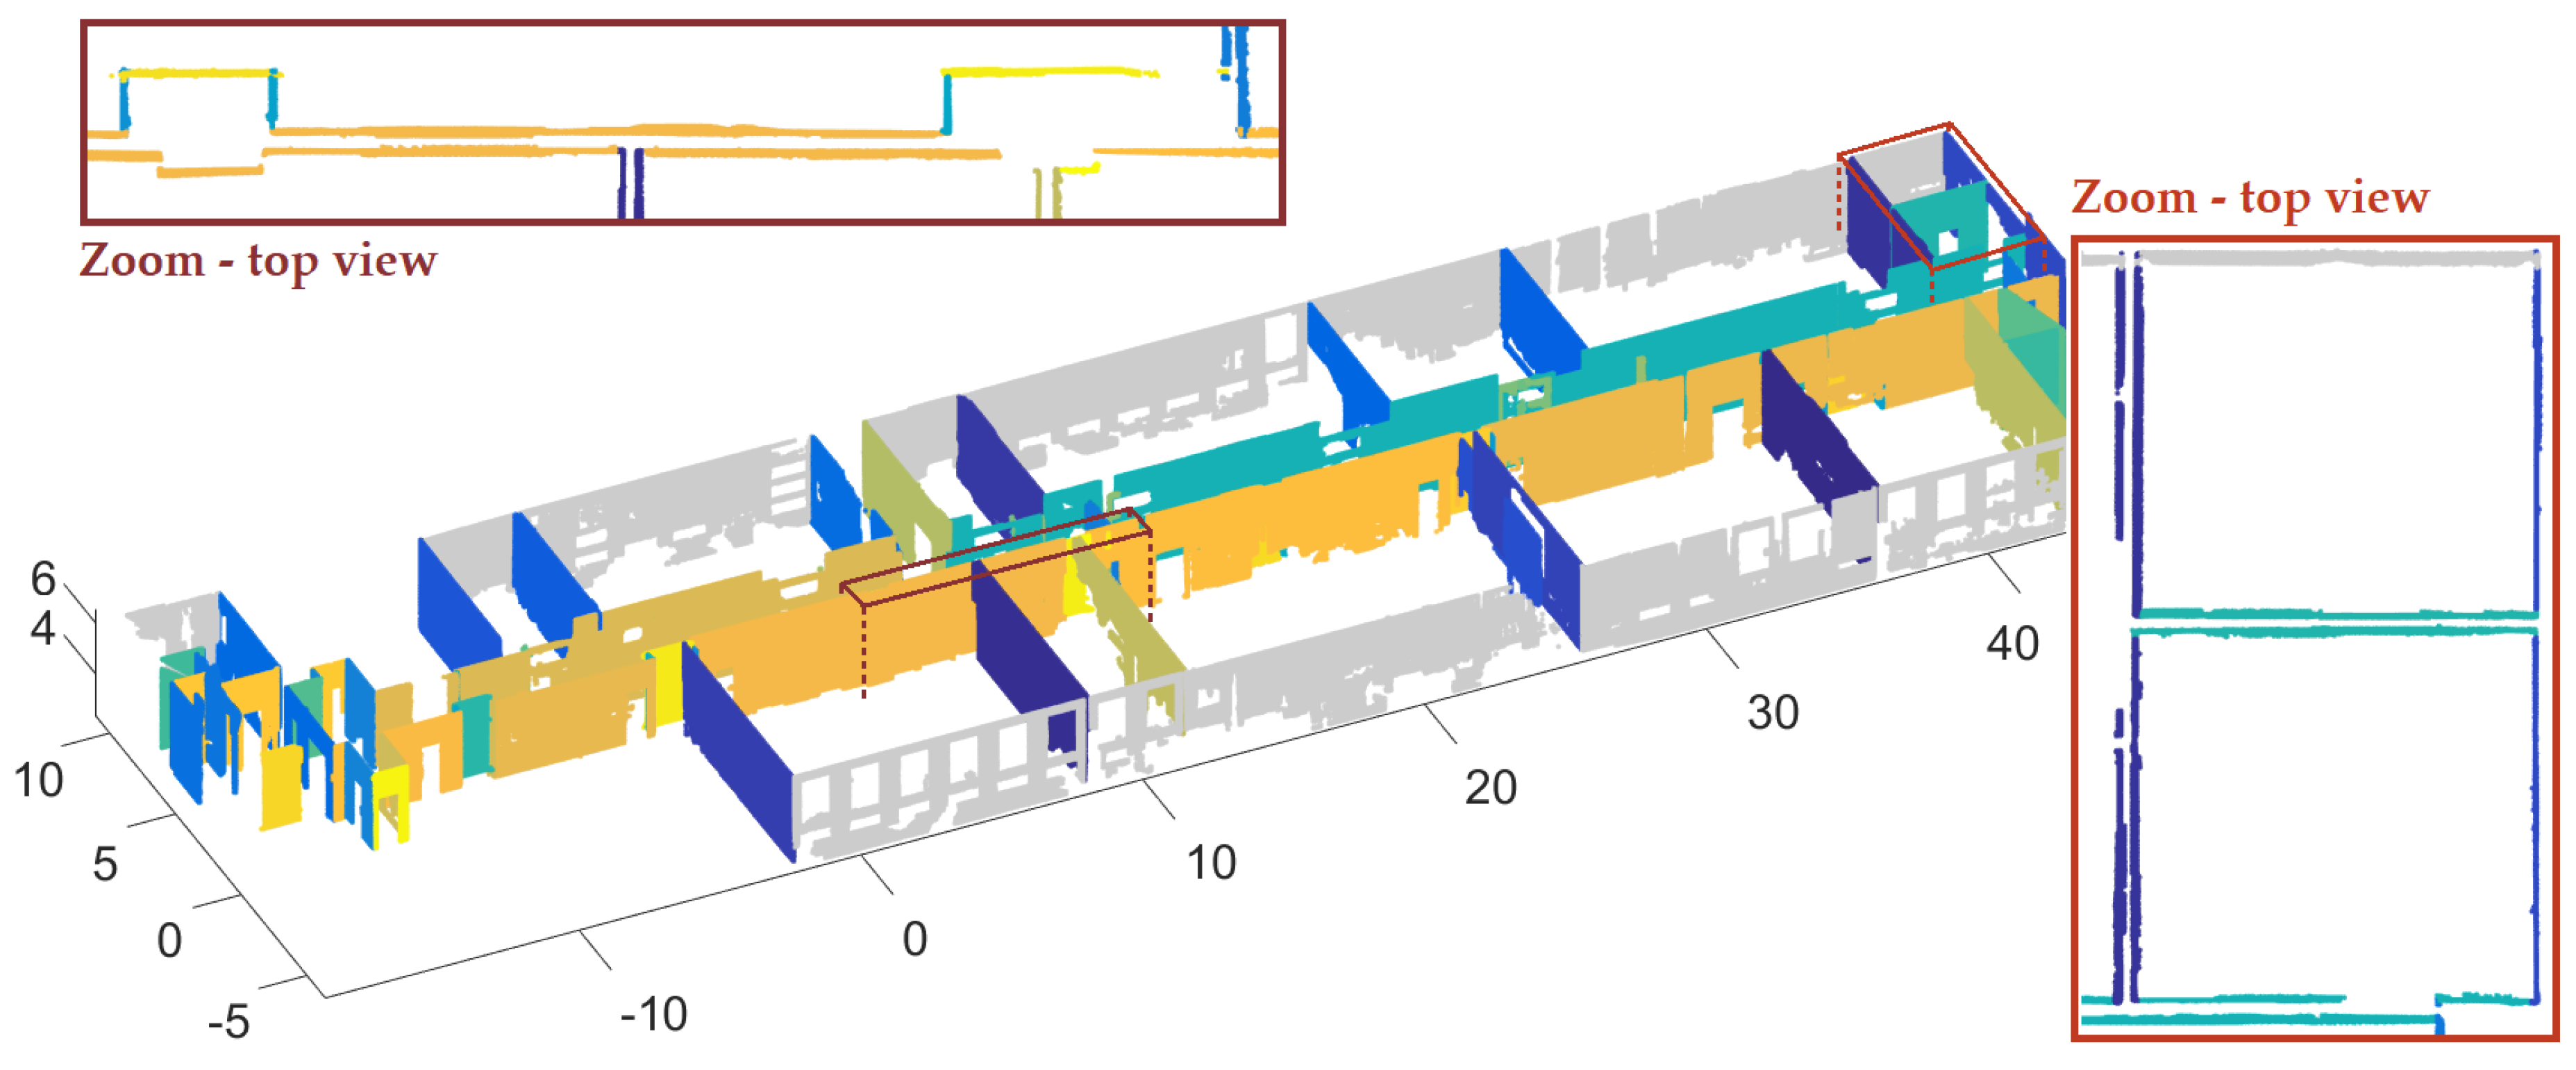
4.2.3. Segmentation into Planes

As explained in Section 3, several plane segmentations are necessary and the number of segmentations is determined automatically. In order to validate if this number is correctly determined, remaining point clouds were analysed for both datasets. At the end of plane segmentations of room point clouds, 6% of points classified as walls were not extracted for the individual house and 12% for the office building.
It is interesting to compare remaining points with reference point clouds of “walls” and “occluding objects” categories. Among remaining points, 70% belong in reality to objects for the individual house whereas 30% for the office building. This means that quality criteria integrated in the approach allows rejecting points belonging to objects falsely classified as walls.

4.3. Assessment of Structural Element Reconstruction

After assessing the segmentation of point clouds, the reconstruction of building elements performed in part two of the approach must be evaluated. The geometric quality of reconstructed elements is investigated. The reconstructed elements are first manually inspected. Then analyses, based on both standard deviations associated to walls and distances points-to-models, are carried out.

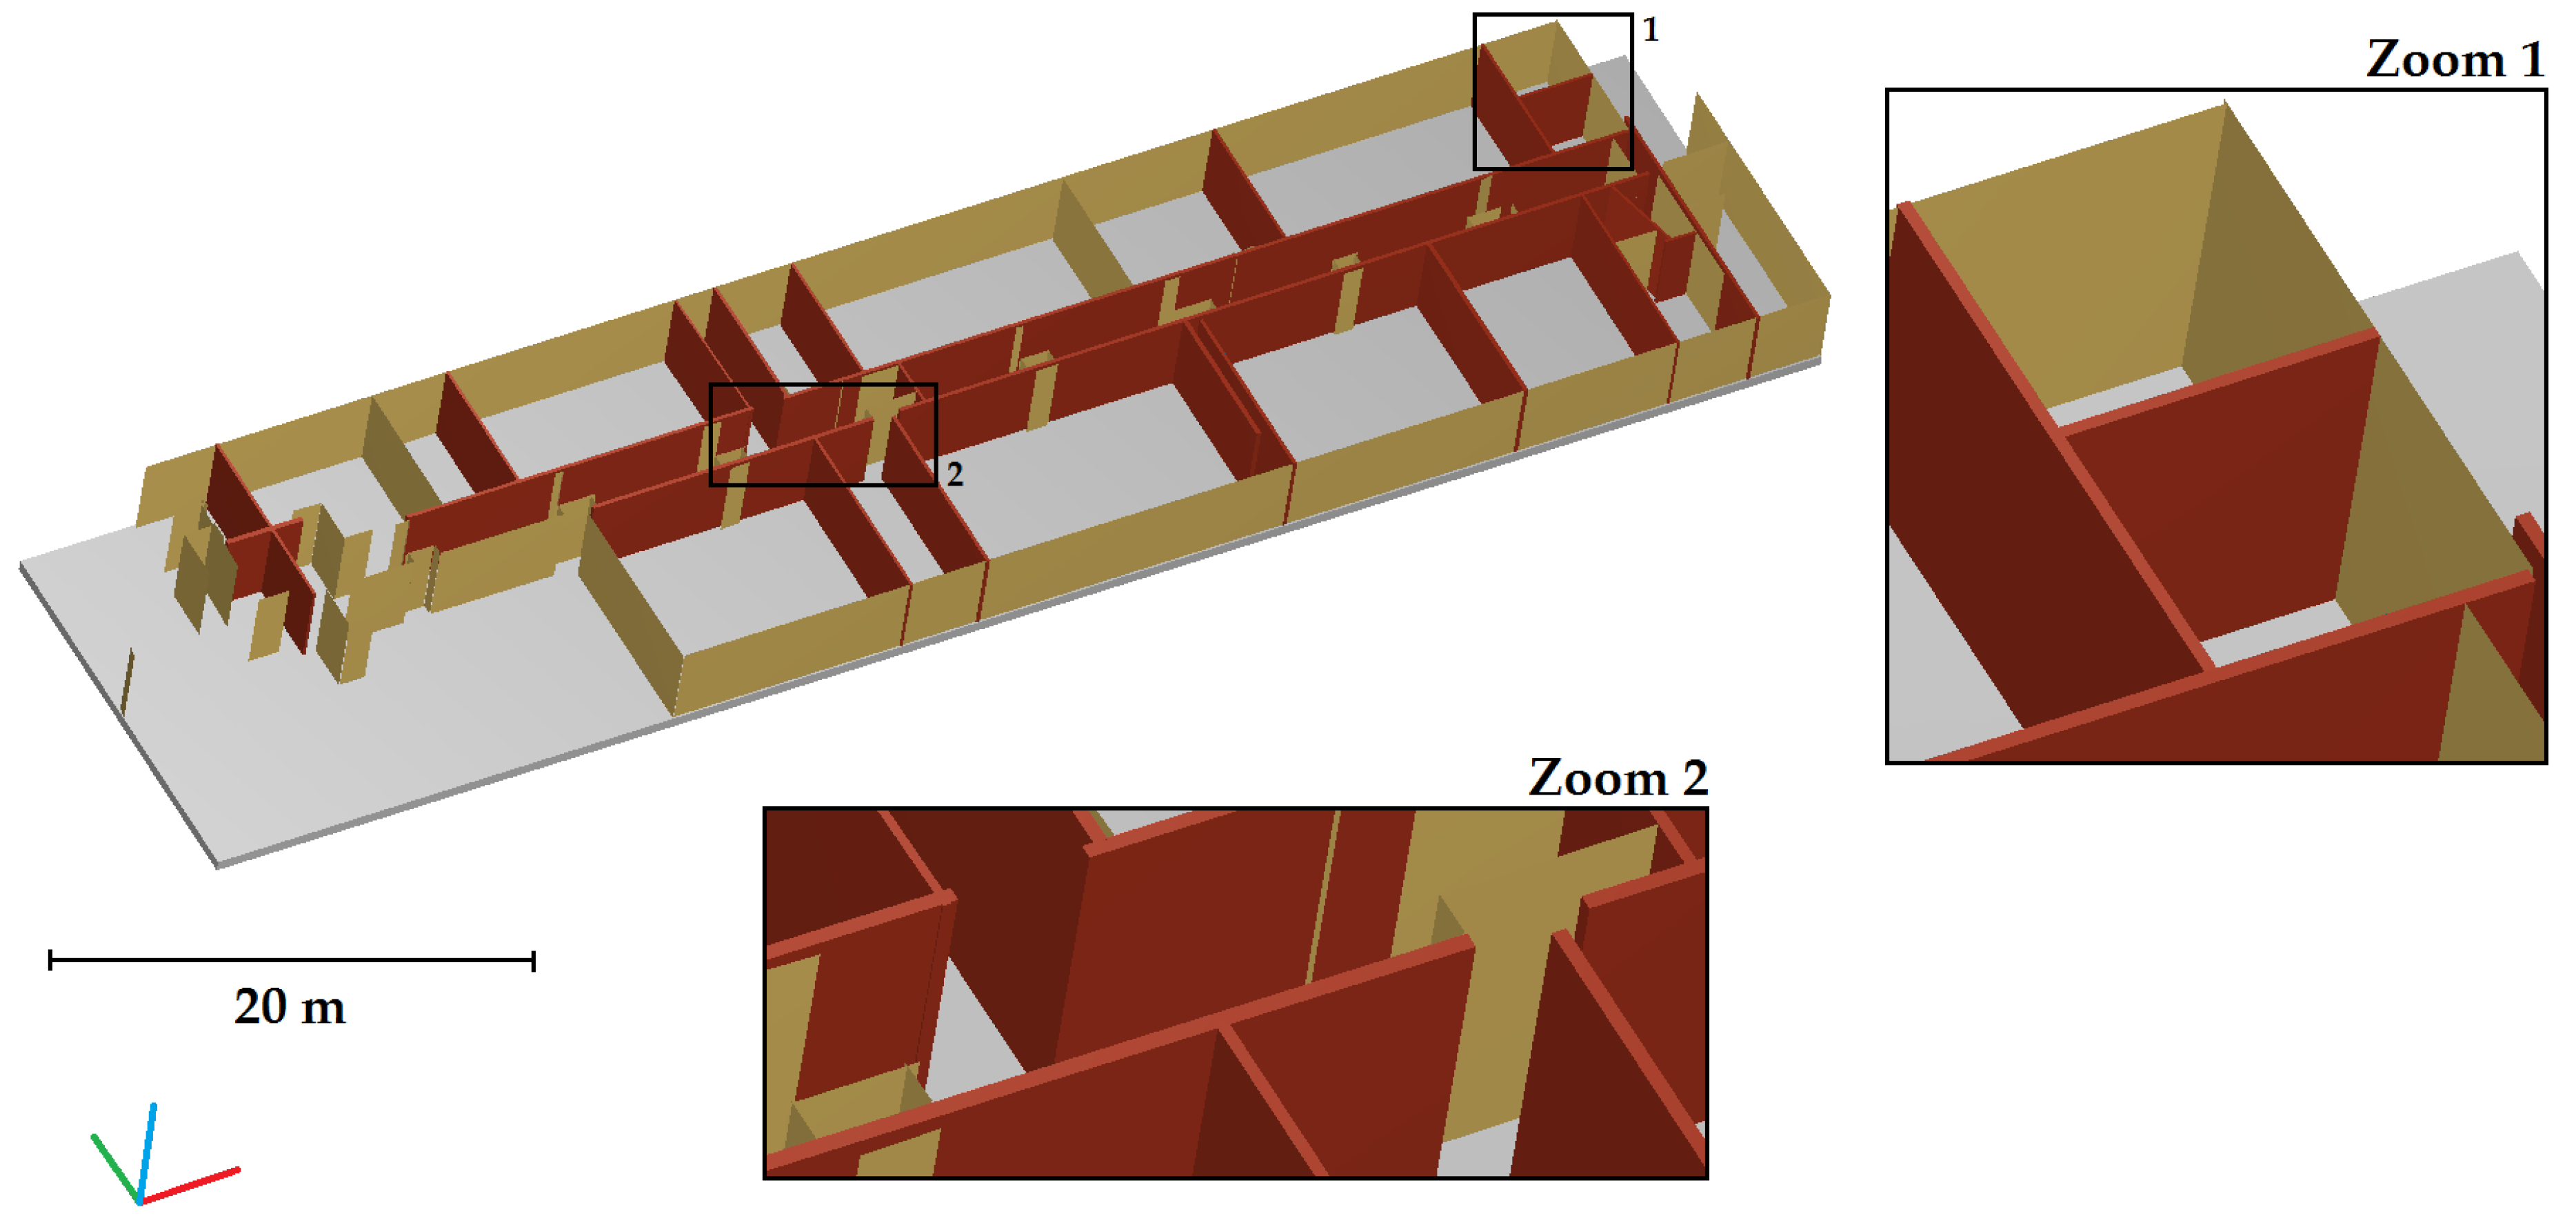
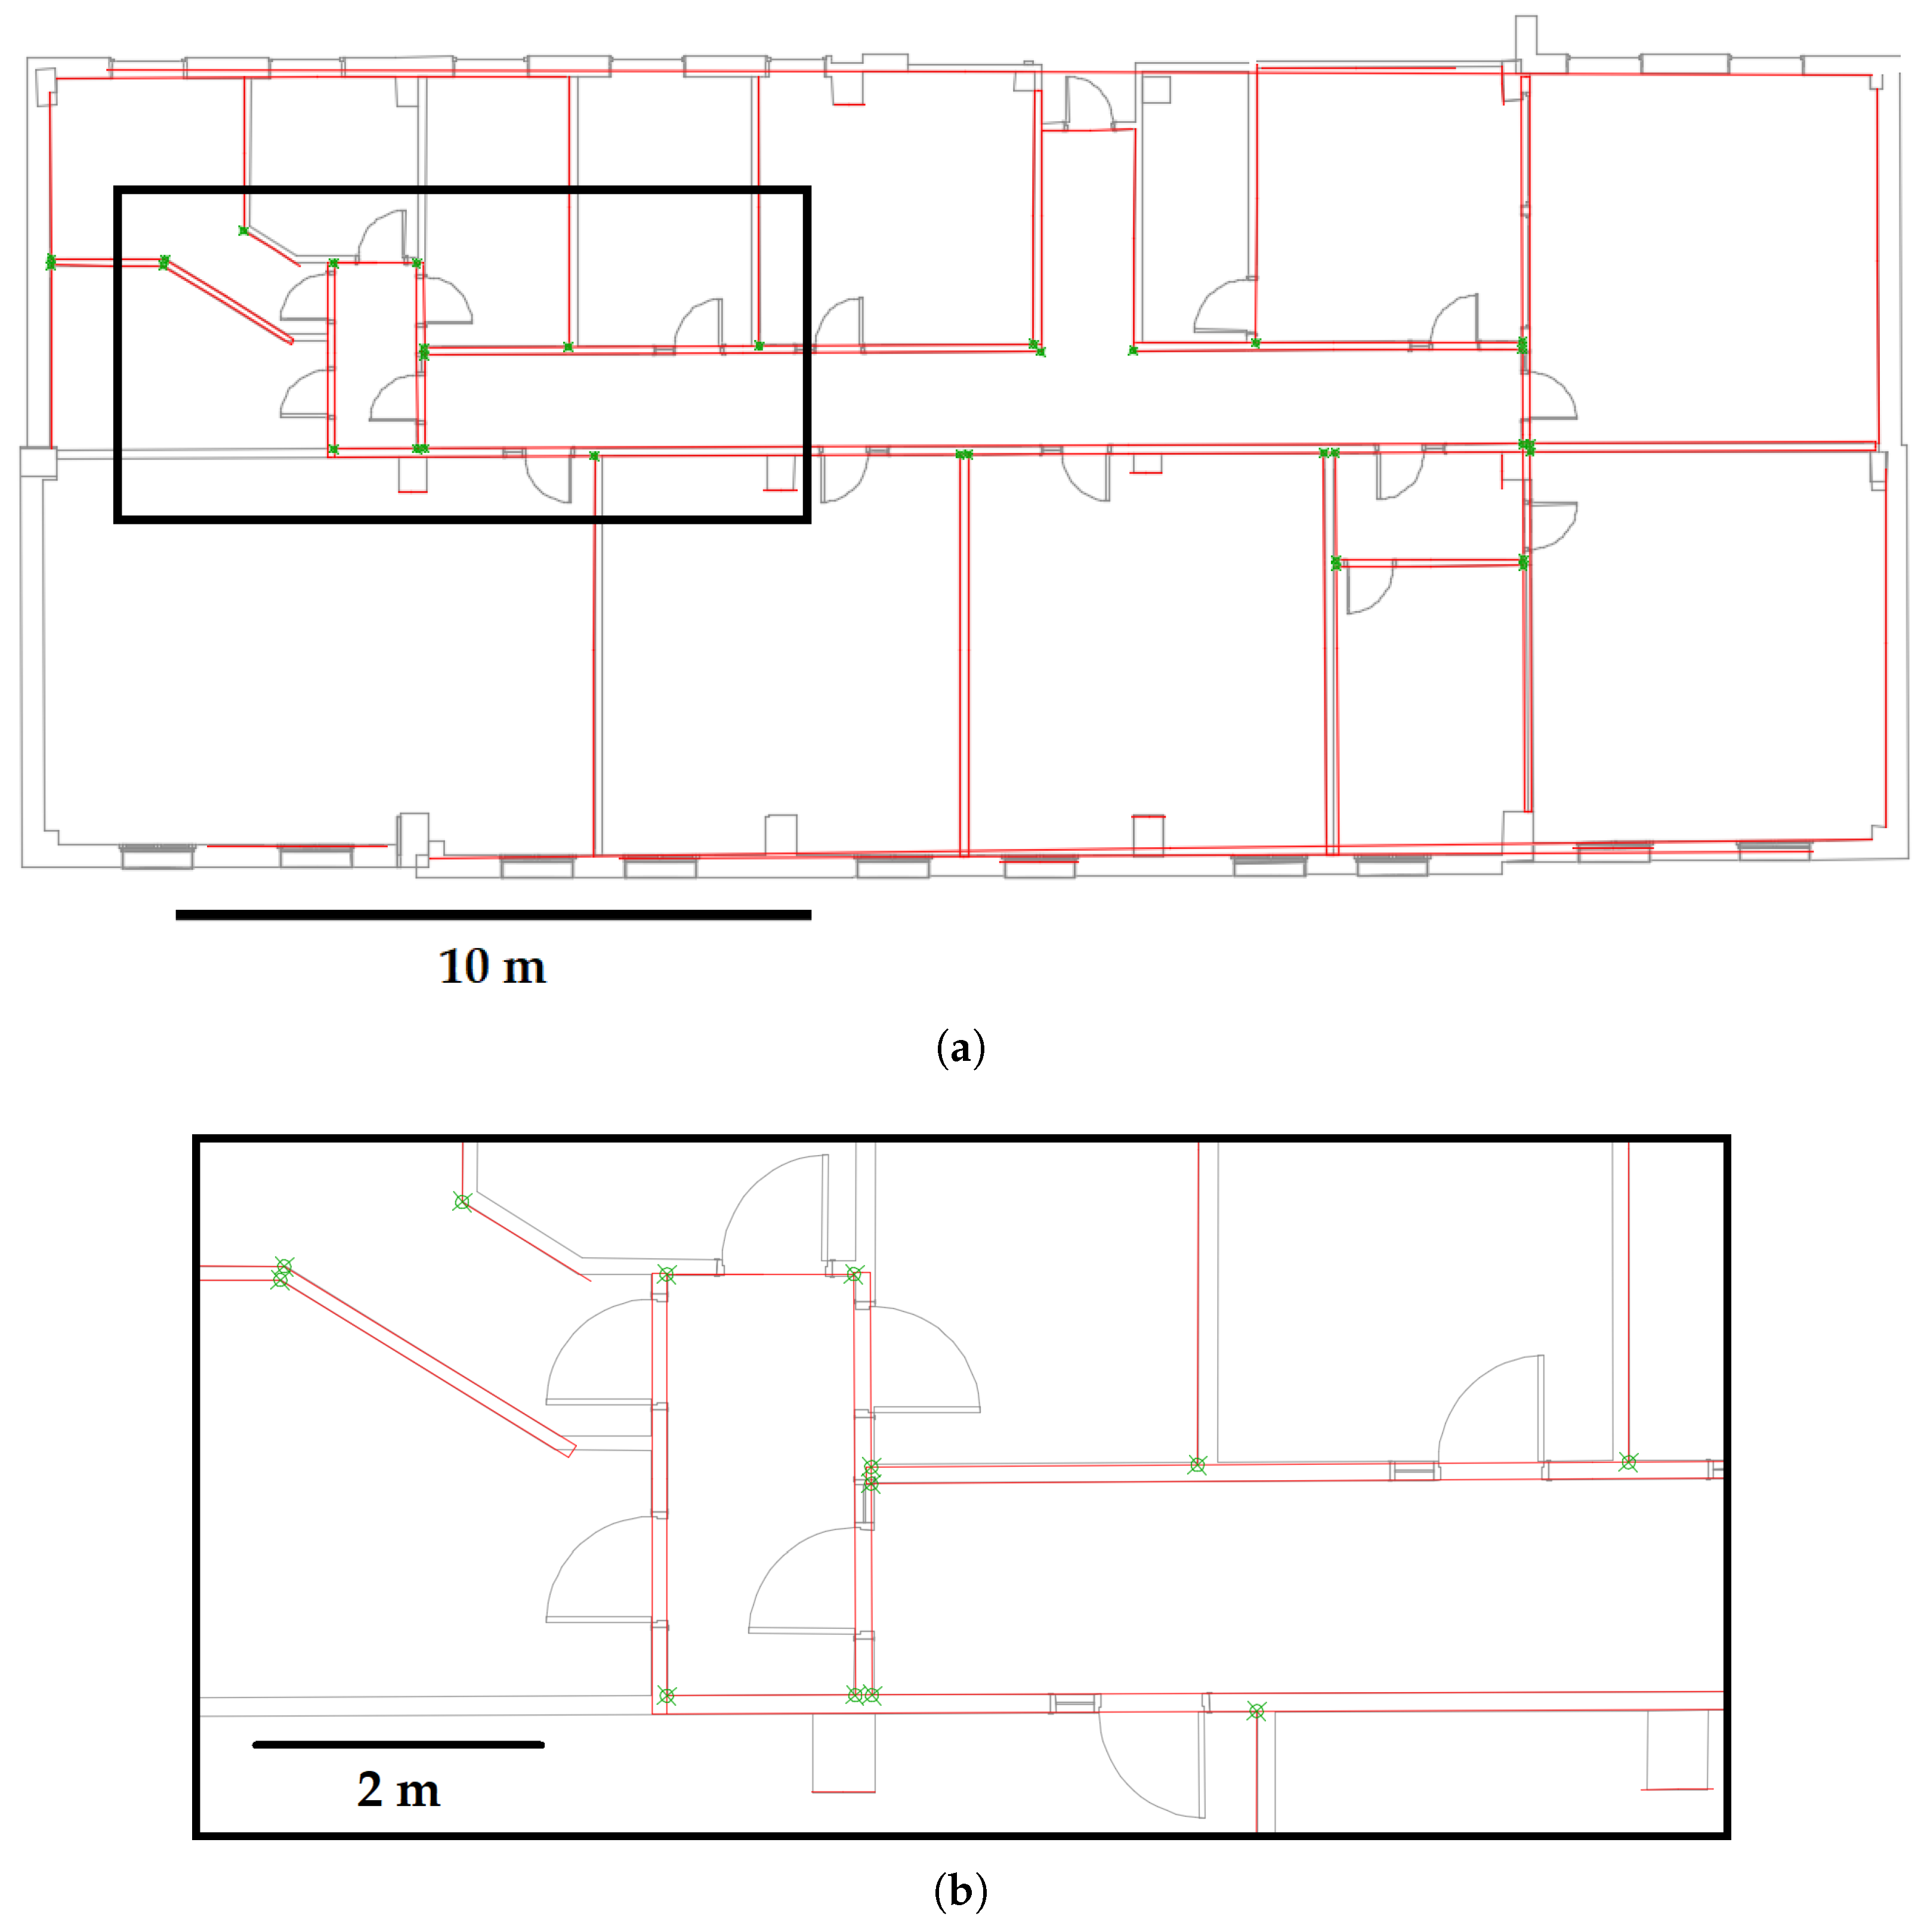
4.3.1. Inspection of Reconstructed Walls

The results of 3D semi-automatic reconstruction of walls and slabs are shown Figure 14 for both datasets. For visualisation purposes exploded perspective views are used. For the individual house 44 objects were created (12 walls and 32 portions of walls) whereas for office building 127 objects were created (35 walls and 92 portions of walls). For both datasets, about a third of wall portions corresponds to indoor parts of façades since the approach considers indoor point clouds exclusively. A visual inspection of the results superimposed with input indoor point clouds allowed to determine that 93% of acquired objects were reconstructed automatically for the individual house and 94% for the office building.
Figure 14. Results of the 3D reconstruction of walls and slabs in an exploded perspective view.
In order to assess the geometric quality of the reconstruction, deliverables created manually based on indoor point clouds of the buildings were exploited. For each floor of the buildings, a 3D rigid body transformation was performed so that floor plan extracted from the results of the 3D automatic reconstruction can be superposed to floor plan created manually. For that purpose, control points corresponding to points in common between the two plans were selected. Table 4 presents the minimum, the maximum and the mean of the 2D deviations observed for these control points for each floor of the two buildings. Deviations of one millimetre to several centimetres are observed between control points selected in floor plans created manually and automatically. Moreover, for all floors the mean of deviations is lower than 2 cm.
Table 4. Deviations between control points selected in floor plans created manually and automatically.
Based on the superimposition of floor plans created manually and automatically, a visual inspection was performed to check if objects correctly describe the buildings. This inspection shows that 93% of objects are correctly placed for the individual house whereas 88% of objects are correctly placed for the office building. The falsely placed objects are mostly portions of façade walls. Figure 15 presents an example of the inspection of reconstructed walls for the 2nd floor of the office building. The floor plan was extracted from a building information model constructed manually based on point clouds. Reconstructed walls and portions of walls are presented in red in the figure and points used for the calculation of the 3D rigid body transformation are in green.
Figure 15. (a) Superimposition of obj file (in red) with a 2D floor plan in dwg format—2nd floor of the office building. (b) Zoom on the map.

4.3.2. Attribution of Standard Deviations to Reconstructed Walls

For each created wall, a quality index is calculated. It deals with the standard deviation of the unsigned distances between points and the reconstructed wall. Figure 16 presents wall point clouds colourized with the standard deviations associated to walls for one floor of each dataset.
Figure 16. Visualisation of standard deviations associated to walls (colour-bar unit in metres).
For the individual house, the mean of standard deviations associated to walls or portions of walls is 9 mm whereas for the office building the mean of standard deviations is 8 mm. This means that on average, the walls are reconstructed with a precision of 1 cm. The visualisation of standard deviations thanks to a colour-bar allows locating rapidly walls or portions of walls for which standard deviations are distinguished from those of the other elements. For example, for the garden level of the individual house, an element point cloud is colourized in red and emerges from the other elements (Figure 16a). It deals with a small portion of wall with a standard deviation of 1.9 cm which was likely not correctly reconstructed or which is not really a portion of wall.
Assuming that there is no significant noise in the data, the factors that influence the standard deviation of a wall are the size of the wall, the number of planes composing it and the amount of points which emerges from the wall (objects leaning against walls). A small wall with a high standard deviation indicates a problem occurred during the reconstruction. However, for a long wall composed of several planes belonging to different rooms (typically the case of a corridor wall or an indoor façade wall) the standard deviation seems not be sufficient to conclude about the quality of the reconstruction. The distances between points and model have to be analysed more specifically.

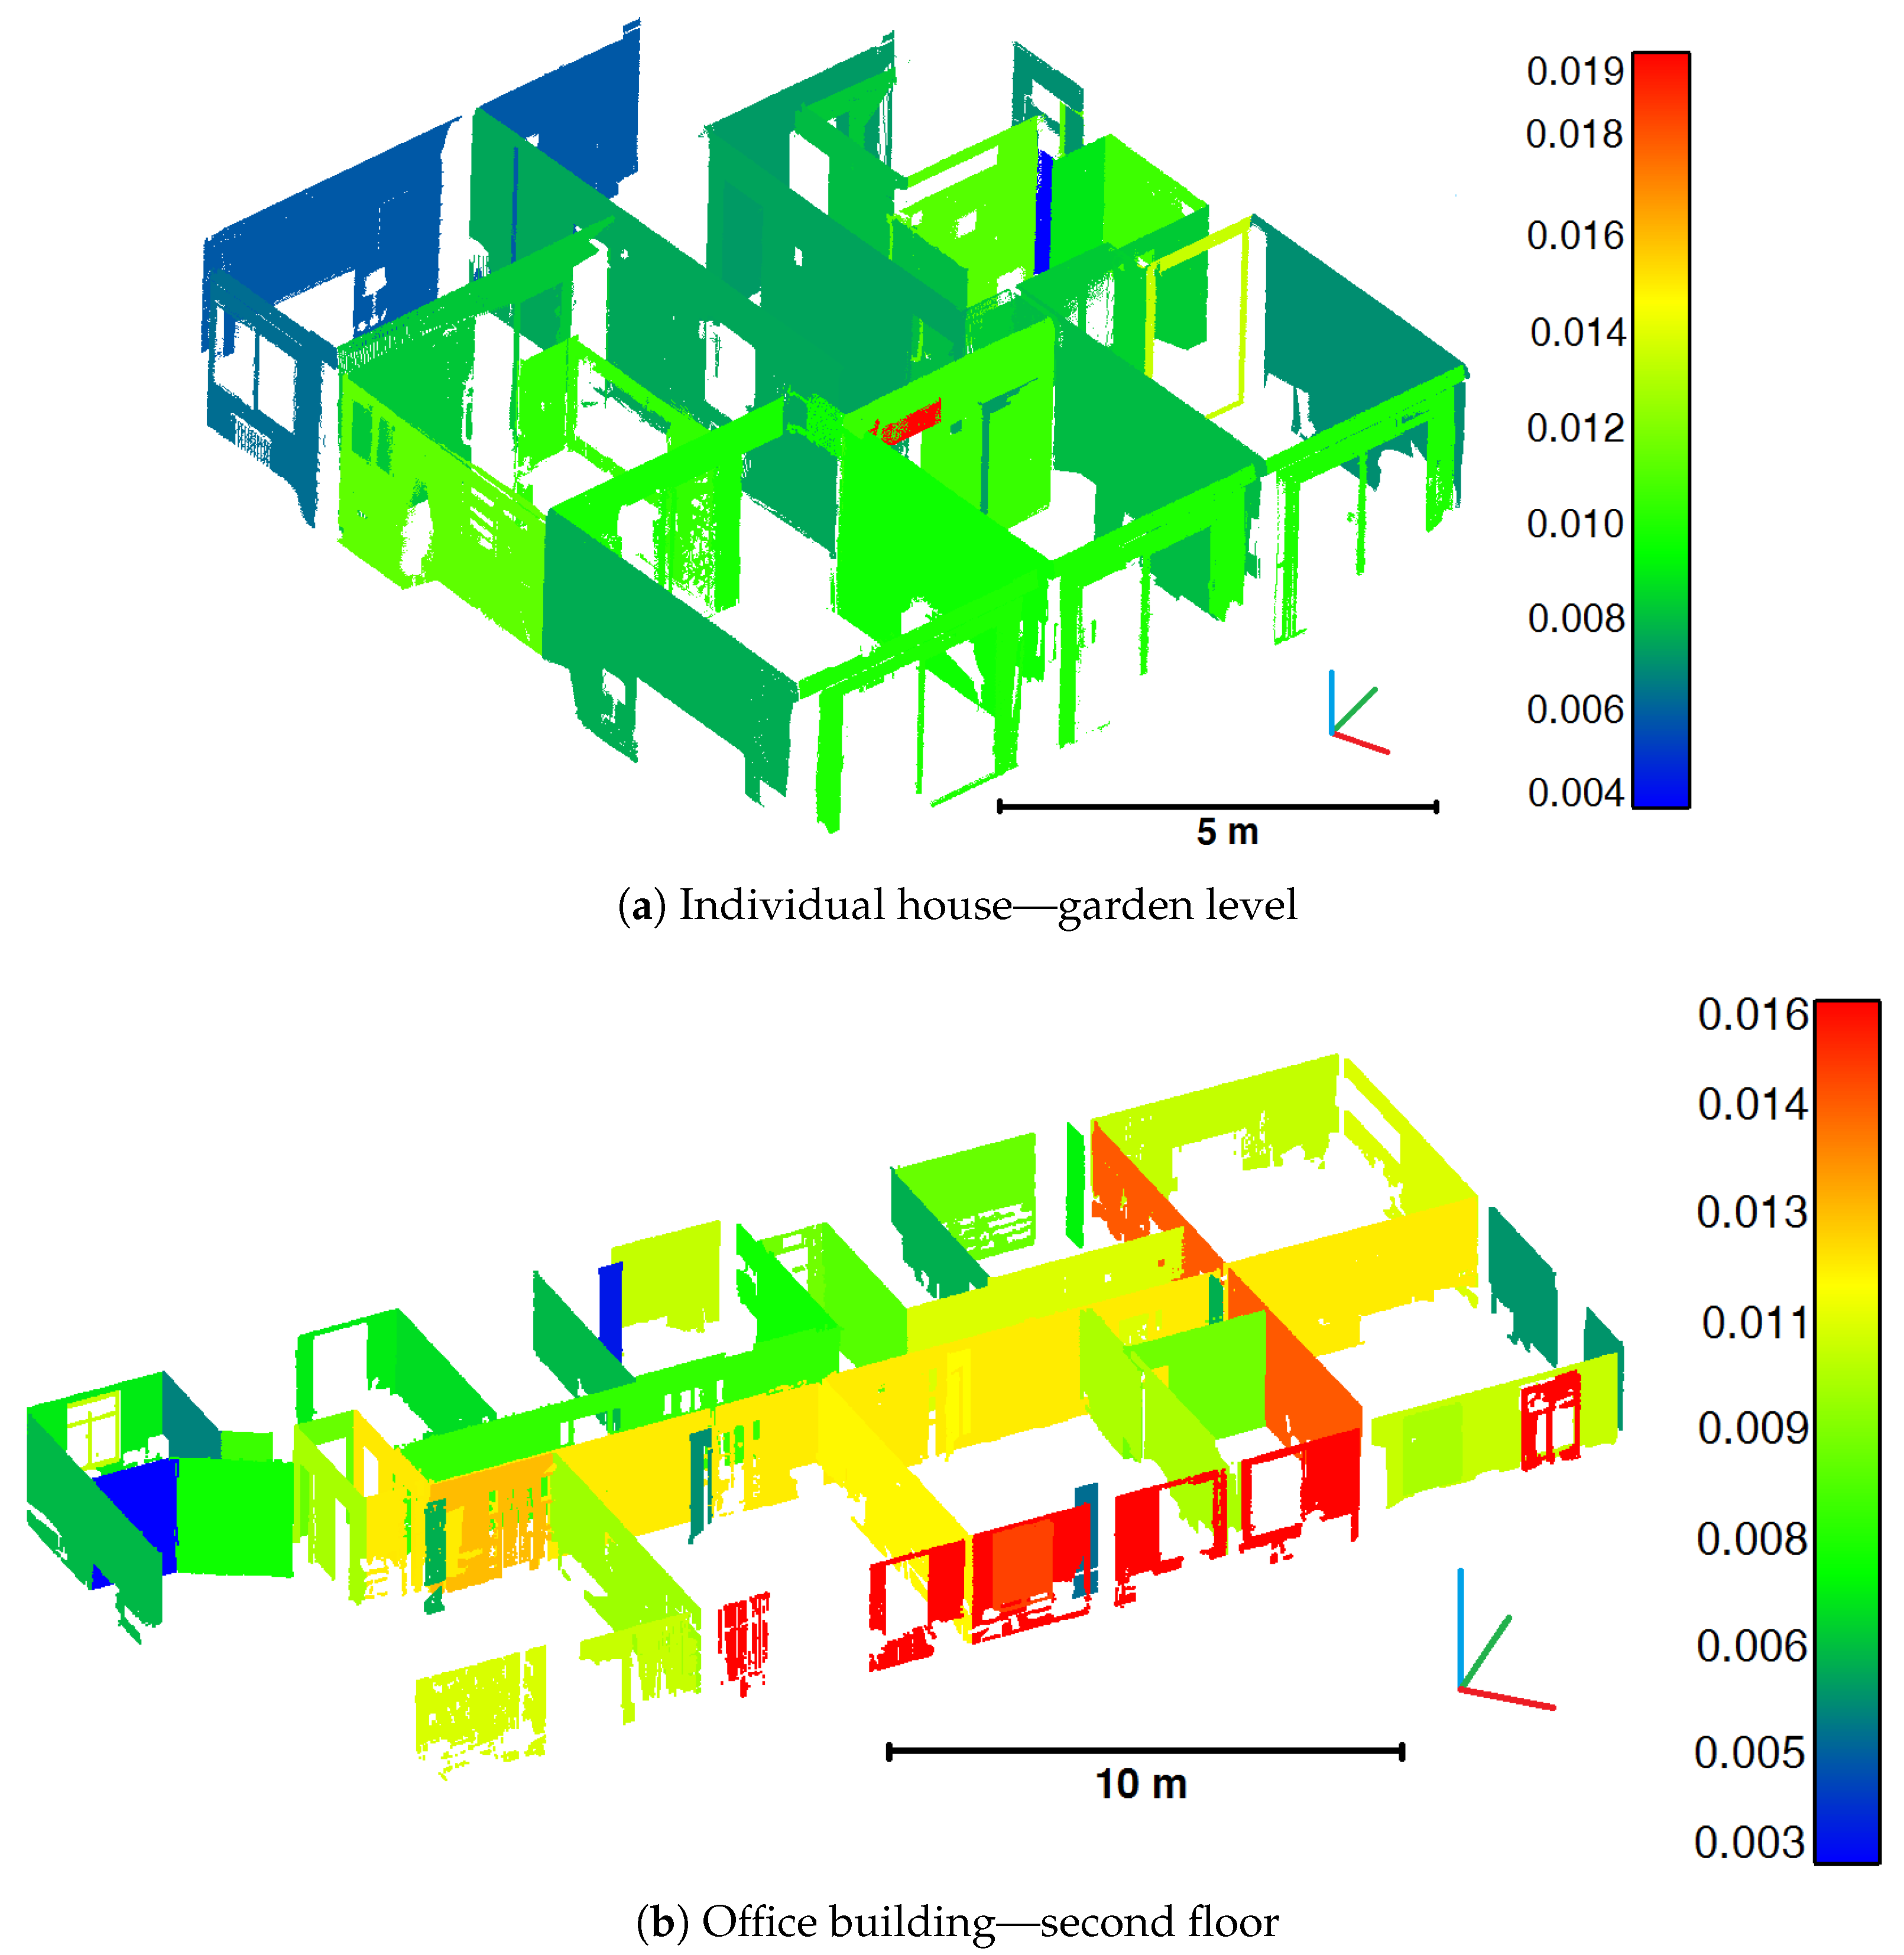
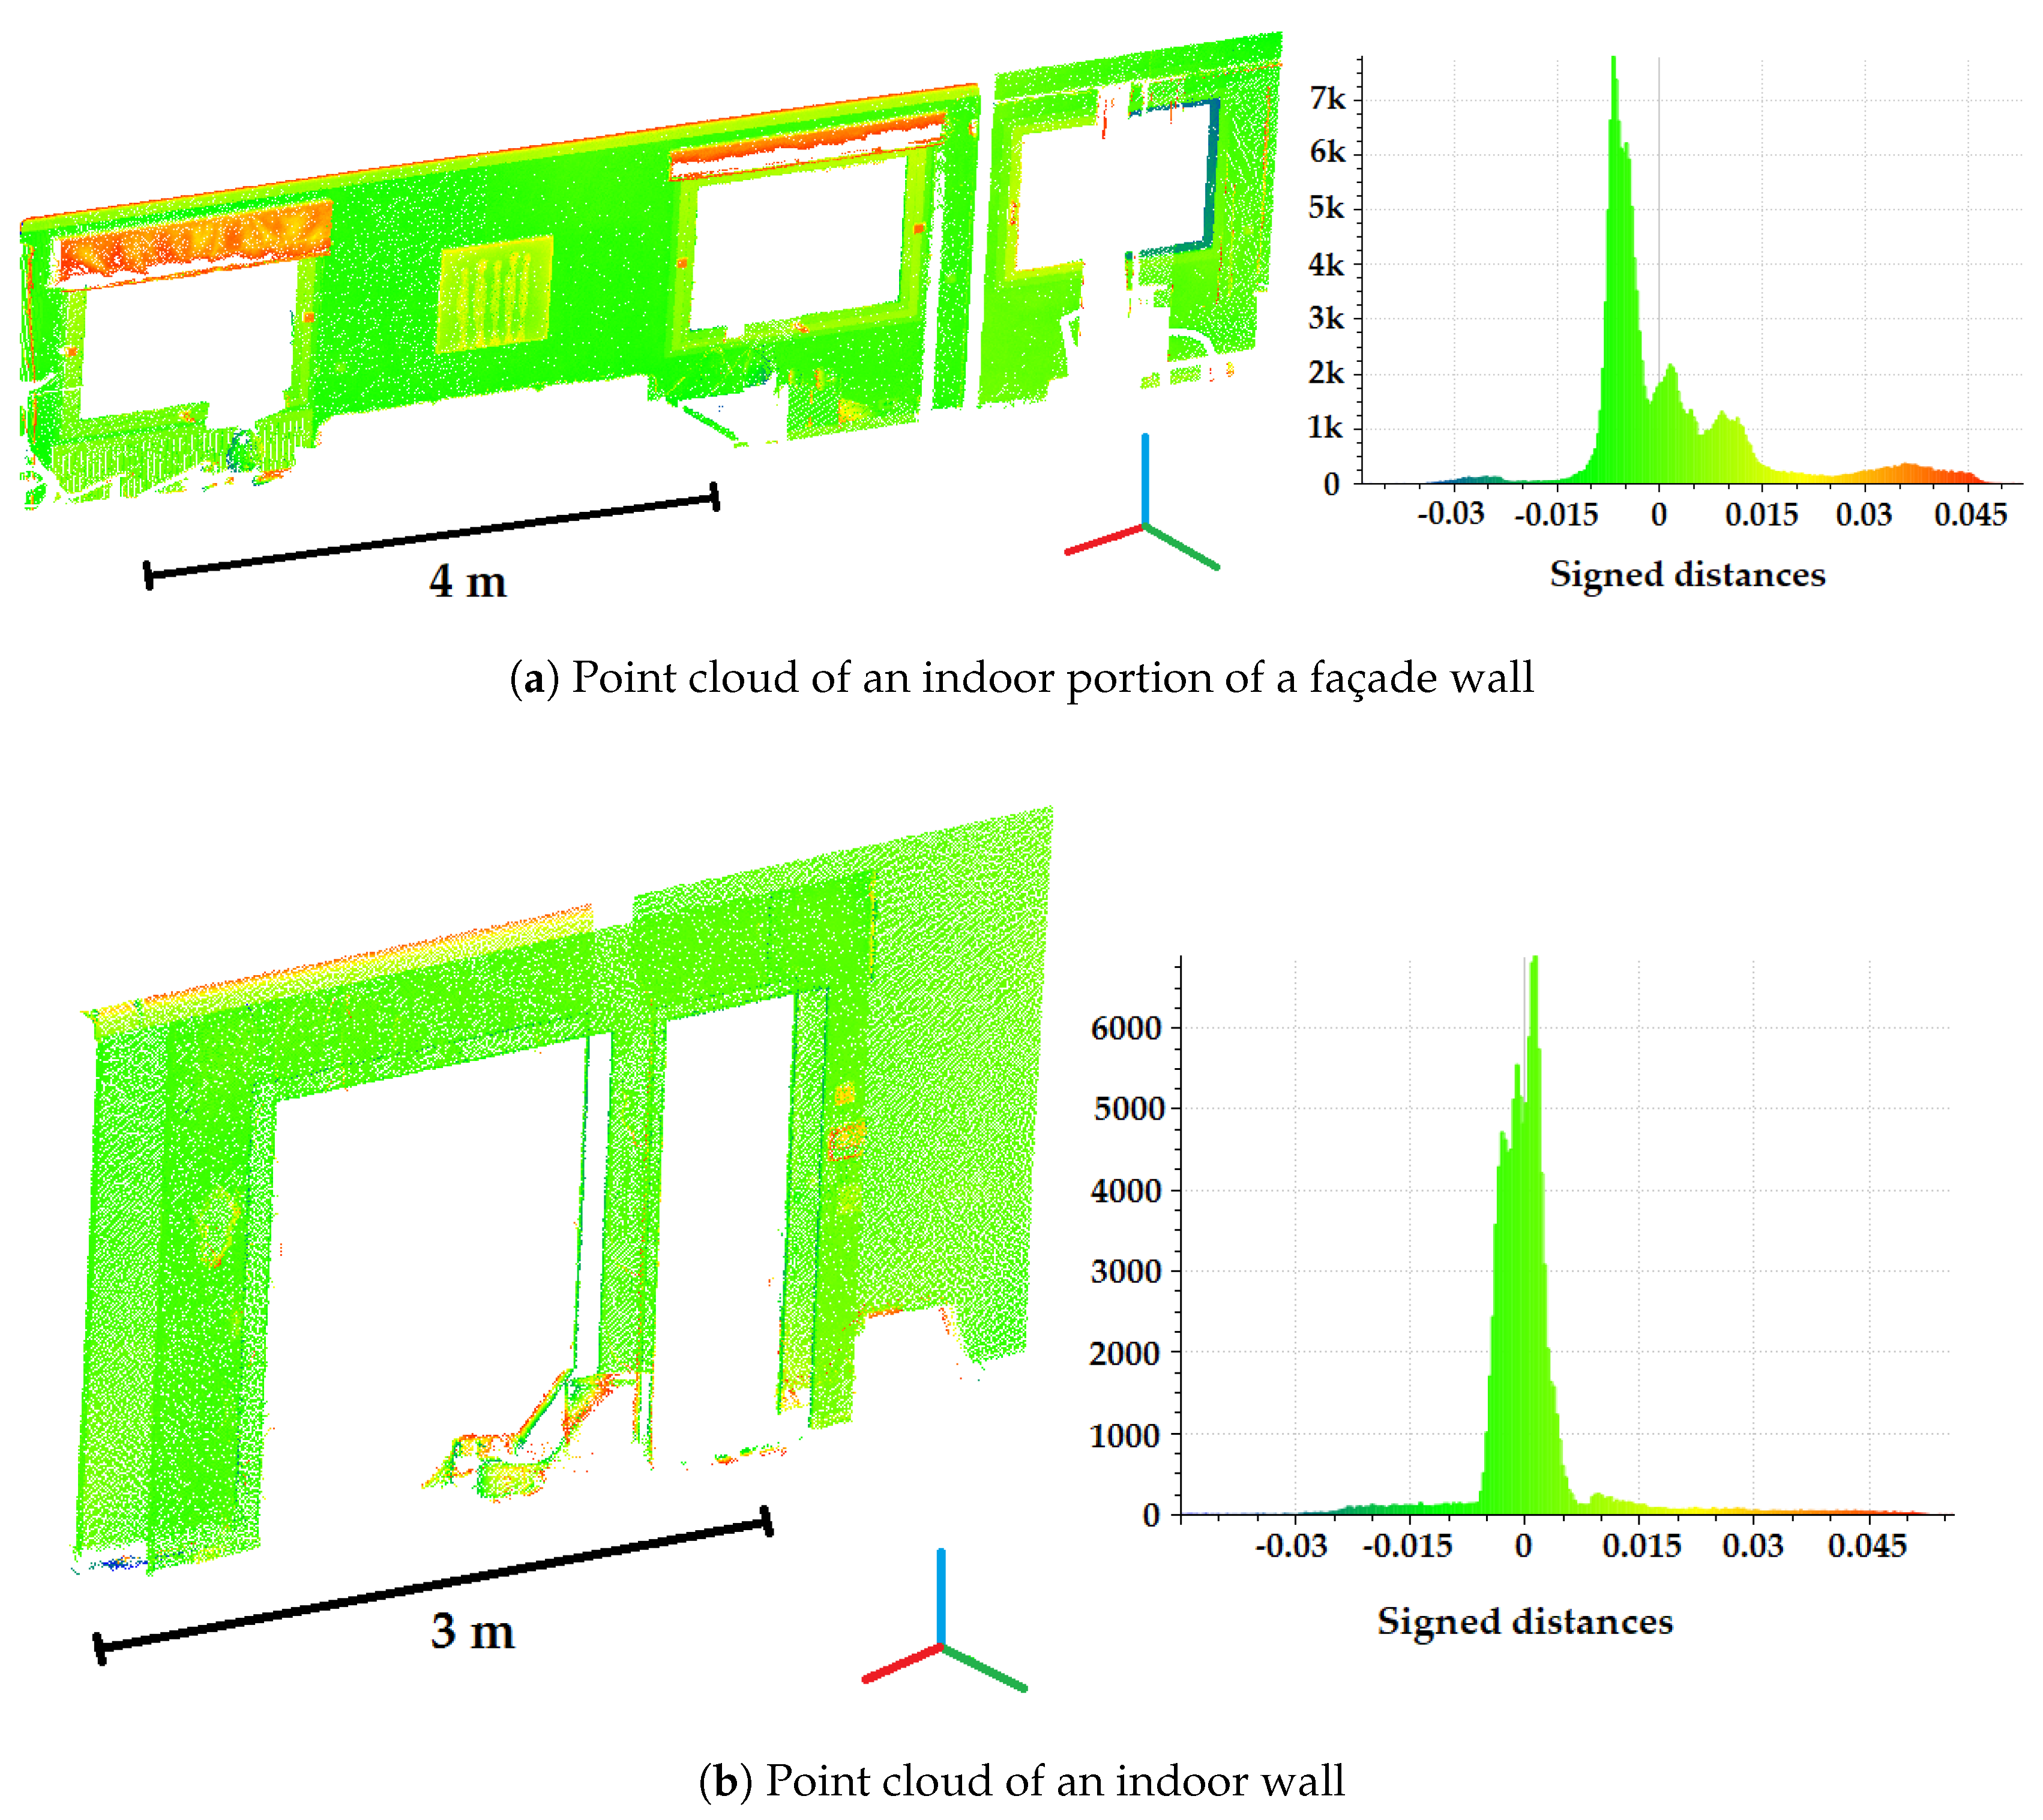
4.3.3. Analysis of Points-to-Model Distances

A second quality index taken into account is the signed distances between points composing an element and the reconstructed element and more specifically the statistical distribution of those distances. Figure 17 proposes two examples of point clouds of respectively a portion of façade wall (Figure 17a) and an indoor wall (Figure 17b). These point clouds are colourized according to the signed distances between points and the reconstructed element. The distributions of the signed distances are shown in the associated histograms representing the number of points related to the signed distances.
Figure 17. Point clouds colourized with points-to-model signed distances: (a) For a surface. (b) For a volume.
Reconstructed walls or portions of walls are based on a set of points which contains inevitably artefacts or objects. It is for example the case, in Figure 17a, where window awnings and a painting emerge from the wall. It is essential that for points which are effectively on the wall, the distances points-to-wall are close to 0. Figure 17b presents an example of a wall very well reconstructed since the highest occurrence frequencies concern distances around 0 and the most part of distances are between −5 mm and 5 mm. For point cloud of Figure 17a, the reconstruction is less satisfying because the most frequent signed distances are located around −5 mm. This is due to the fact that the surface was reconstructed based on two planes located in two different rooms. For the plane located on the right, one can observed that distances are positives for one side and negatives for the other side. This means that the two planes are not utterly coplanar.

5. Future Work

Several future works are planned for our approach. First, the building will be considered in its whole for the 3D reconstruction. Indeed, the 3D reconstruction is performed for each floor individually but some elements of a building are extended to several floors as for example façade walls. Outdoor point clouds will be used to improve the reconstruction of façade walls and to consider the detection of openings. Moreover, the combination of indoor and outdoor models will enable to integrate the building to models at larger scale such as city models.
In parallel to the development of our approach, the potential use of radiometric information of point clouds (colour and intensity) was investigated for the detection of openings. Satisfying results are obtained in condition to dispose of reliable radiometric information. The developed methodologies are for now not applicable to all point clouds. Works on the detection of openings will be deepened. In particular, the fact that façade walls contain windows and the fact that indoor walls contain doors will be exploited.
As describe in Section 4, two quality indexes were defined and can be used to identify if some elements are not correctly reconstructed. In the future, a tool will be developed to automatically interpret these quality indexes in order to propose to the user a manual reconstruction of elements in case of errors. To do that, it is essential to keep the link between point clouds and the as-built BIM. Additionally, tolerances will have to be defined regarding simplification assumptions.
In the context of BIM, it would also be interesting to define a specific acquisition protocol to integrate information which are not available in point clouds as for example ceiling heights when false ceilings are encountered or materials composing building elements. These information could facilitate the reconstruction and semantically enrich the as-built BIM.
One should also notice that acquisition methods are constantly evolving. In this project, data issued from laser scanners were used but, considering the new techniques in photogrammetry and computer vision, point cloud of a building may be obtained by an automatic dense correlation of thousands images. Beside point cloud, the exploitation of images may allow extracting more semantic informations. Moreover, constraints may be imposed during the densification step to optimize the identification of walls, grounds and ceilings for example.
A new trend for the acquisition of building environments is the combined use of several sensors. Multi-sensors systems are increasingly developed. The synchronized data issued from different sensors constitute a significant contribution for the automation of processes and can provide semantic information. For instance, the combination of laser scanning data and data issued from thermal cameras is notably studied in the context of as-built BIM creation.

6. Conclusions

The aim of this article was to present a processing chain conceived for the 3D semi-automatic reconstruction of indoors of existing buildings from point clouds for their integration in BIM software. The developed approach is composed of two parts. Based on indoor point clouds, the first part consists in several segmentations into spaces and planes and in the classification of points into several categories. The second part of the approach deals with the reconstruction of walls and slabs of buildings from the element point clouds extracted in the first part. At the end of the approach, a file in a BIM format is generated and reconstructed walls and slabs can be opened in BIM software.
The approach was assessed based on two datasets which were not used for the development of the approach. The same thresholds were used for both datasets. The results obtained for the first part of the approach are promising in a geometric and a semantic point of view. Indeed, sub-spaces are almost all segmented and points are well classified into the different categories. The second part of the assessment was looked to the reconstruction of building elements. The results are also very satisfying for both datasets since, for individual house and the office building, more than 90% of objects located in the input point clouds were reconstructed automatically. Additionally, percentages of respectively 93% and 88% of walls and portions of walls detected automatically are correctly positioned and deviations from one millimetre to several centimetres are observed in relation to deliverables created manually.
The assessment of the approach demonstrates that the same default thresholds can be applied to several datasets of quite different buildings, in other words that the approach is transferable. Moreover, the high percentages of elements correctly extracted shows that thresholds determined automatically are well determined. Finally, low deviations indicate that the reconstructed elements accurately described the as-is states of the buildings. Thus, the developed approach responds positively to the three items considered namely the transferability, the degree of automation and the geometric quality.
Tools for the inspection of results were also proposed. Standard deviations associated to reconstructed walls and points-to-model distances were proposed as quality indexes. These tools for the quality assessment are essential since a complete automation of reconstruction seems utopian and reconstruction errors can potentially occur. Despite many scan-to-BIM approaches, currently there are very few tools on the market addressing the quality of generated Building Information Models from point clouds.

Acknowledgments

The authors want to thank for its financial support the French College of Chartered Surveyors (Ordre des Géomètres-Experts). They also want to thank the French Land Surveyors Offices Pierre BLOY (Paris), David PIERROT (Mandelieu) and SCHALLER-ROTH-SIMLER (Sélestat) and the French company FUTURMAP (Lyon) who provided datasets for the assessment of the approach.

Author Contributions

Algorithms were developed by Hélène Macher with the help of Tania Landes and Pierre Grussenmeyer. All the authors contributed to the writing of the paper.

Conflicts of Interest

The authors declare no conflict of interest.

Abbreviations

The following abbreviations are used in this manuscript:
BIMBuilding Information Modelling
AECArchitecture, Engineering and Construction
TLSTerrestrial Laser Scanning
MEPMechanical, Electrical and Plumbing
RANSACRANdom SAmple Consensus
MWManhattan-World
PCA Principal Component Analysis
MLESACMaximum Likelihood Estimation SAmple Consensus
RMSERoot Mean Square Error
IFCIndustry Foundation Classes

References

  1. Volk, R.; Stengel, J.; Schultmann, F. Building Information Modeling (BIM) for existing buildings—Literature review and future needs. Automat. Constr. 2014, 38, 109–127. [Google Scholar] [CrossRef]
  2. Del Giudice, M.; Osello, A. BIM for cultural heritage. In Proceedings of the XXIV International CIPA Symposium, Strasbourg, France, 2–6 September 2013; Volume XL-5/W2, pp. 225–229. [Google Scholar]
  3. Juan, Y.K.; Hsing, N.P. BIM-Based Approach to Simulate Building Adaptive Performance and Life Cycle Costs for an Open Building Design. Appl. Sci. 2017, 7, 837. [Google Scholar] [CrossRef]
  4. Azhar, S.; Khalfan, M.; Maqsood, T. Building information modelling (BIM): Now and beyond. Aust. J. Constr. Econ. Build. 2012, 12, 15–28. [Google Scholar] [CrossRef]
  5. Gao, T.; Akinci, B.; Ergan, S.; Garrett, J. Constructing as-is BIMs from progressive scan data. Gerontechnology 2012, 11, 75. [Google Scholar] [CrossRef]
  6. Li, S.; Isele, J.; Bretthauer, G. Proposed Methodology for Generation of Building Information Model with Laserscanning. Tsinghua Sci. Technol. 2008, 13, 138–144. [Google Scholar] [CrossRef]
  7. A Report for the Government Construction Client Group Building Information Modelling (BIM) Working Party Strategy Paper; Technical Report; BIM Industry Working Group: London, UK, 2011.
  8. Client Guide to 3D Scanning and Data Capture; Technical Report; BIM Task Group: London, UK, 2013.
  9. Tang, P.; Huber, D.; Akinci, B.; Lipman, R.; Lytle, A. Automatic reconstruction of as-built building information models from laser-scanned point clouds: A review of related techniques. Automat. Constr. 2010, 19, 829–843. [Google Scholar] [CrossRef]
  10. Anil, E.B.; Akinci, B.; Huber, D. Representation Requirements of As-Is Building Information Models Generated from Laser Scanned Point Cloud Data. In Proceedings of the 28th International Symposium on Automation and Robotics in Construction, Seoul, Korea, 29 June–2 July 2011; Volume 29, pp. 355–360. [Google Scholar]
  11. Käshammer, P.F.; Nüchter, A. Mirror identification and correction of 3D point clouds. In Proceedings of the 2015 3D Virtual Reconstruction and Visualization of Complex Architectures, Avila, Spain, 25–27 February 2015; Volume XL-5/W4, pp. 109–114. [Google Scholar]
  12. Voegtle, T.; Schwab, I.; Landes, T. Influences of different materials on the measurements of a terrestrial laser scanner (TLS). In Proceedings of the XXI ISPRS Congress, Beijing, China, 3–11 July 2008; Volume XXXVII, pp. 1061–1066. [Google Scholar]
  13. Soudarissanane, S.; Lindenbergh, R.; Menenti, M.; Teunissen, P. Incidence Angle Influence on the Quality of Terrestrial Laser Scanning Points. In Proceedings of the ISPRS Workshop Laserscanning 2009, Paris, France, 1–2 September 2009; Volume XXXVIII, pp. 183–188. [Google Scholar]
  14. Adan, A.; Huber, D. 3D reconstruction of interior wall surfaces under occlusion and clutter. In Proceedings of the International Conference on 3D Imaging, Modeling, Processing, Visualization and Transmission, Hangzhou, China, 16–19 May 2011; pp. 275–281. [Google Scholar]
  15. Previtali, M.; Barazzetti, L.; Brumana, R.; Scaioni, M. Towards automatic indoor reconstruction of cluttered building rooms from point clouds. In Proceedings of the ISPRS Technical Commission V Symposium, Riva del Garda, Italy, 23–25 June 2014; Volume II-5, pp. 281–288. [Google Scholar]
  16. Pătrăucean, V.; Armeni, I.; Nahangi, M.; Yeung, J.; Brilakis, I.; Haas, C. State of research in automatic as-built modelling. Adv. Eng. Inform. 2015, 29, 162–171. [Google Scholar] [CrossRef]
  17. Larsen, K.E.; Lattke, F.; Ott, S.; Winter, S. Surveying and digital workflow in energy performance retrofit projects using prefabricated elements. Automat. Constr. 2011, 20, 999–1011. [Google Scholar] [CrossRef]
  18. Rajala, M.; Penttilä, H. Testing 3D Building Modelling Framework in Building Renovation. In Proceedings of the 24th eCAADe Conference, Volos, Greece, 6–9 September 2006; pp. 268–275. [Google Scholar]
  19. Xiong, X.; Adan, A.; Akinci, B.; Huber, D. Automatic creation of semantically rich 3D building models from laser scanner data. Automat. Constr. 2013, 31, 325–337. [Google Scholar] [CrossRef]
  20. Grussenmeyer, P.; Landes, T.; Doneus, M.; Lerma, J.L. Basics of range-based modelling techniques in Cultural Heritage. In 3D Recording, Documentation and Management in Cultural Heritage; Whittles Publishing: Caithness, UK, 2016; Chapter 6. [Google Scholar]
  21. Pu, S.; Vosselman, G. Knowledge based reconstruction of building models from terrestrial laser scanning data. ISPRS J. Photogramm. Remote Sens. 2009, 64, 575–584. [Google Scholar] [CrossRef]
  22. Boulaassal, H.; Landes, T.; Grussenmeyer, P. Automatic extraction of planar clusters and their contours on building façades recorded by terrestrial laser scanner. Int. J. Archit. Comput. 2009, 7, 1–20. [Google Scholar] [CrossRef]
  23. Schnabel, R. Efficient Point-Cloud Processing with Primitive Shapes. Ph.D. Thesis, University of Bonn, Bonn, Germany, 2009. [Google Scholar]
  24. Grussenmeyer, P.; Alby, E.; Landes, T.; Koehl, M.; Guillemin, S.; Hullo, J.F.; Assali, P.; Smigiel, E. Recording approach of heritage sites based on merging point clouds from high resolution photogrammetry and Terrestrial Laser Scanning. In Proceedings of the XXII ISPRS Congress, Melbourne, Australia, 25 August–1 September 2012; Volume XXXIX-B5, pp. 553–558. [Google Scholar]
  25. Landes, T.; Kuhnle, G.; Bruna, R. 3D modeling of the Strasbourg’s cathedral basements for interdisciplinary research and virtual visits. In Proceedings of the 25th International CIPA Symposium 2015, Taipei, Taiwan, 31 August–4 September 2015; Volume XL-5/W7, pp. 263–270. [Google Scholar]
  26. Dimitrov, A.; Golparvar-Fard, M. Segmentation of building point cloud models including detailed architectural/structural features and MEP systems. Automat. Constr. 2015, 51, 32–45. [Google Scholar] [CrossRef]
  27. Runne, H.; Niemeier, W.; Kern, F. Application of Laser Scanners to Determine the Geometry of Buildings. In Proceedings of the Optical 3-D Measurement Techniques V, Vienna, Austria, 1–4 October 2001; pp. 41–48. [Google Scholar]
  28. Boulaassal, H.; Chevrier, C.; Landes, T. From Laser Data to Parametric Models: Towards an Automatic Method for Building Façade Modelling. Digital Heritage 2010, 6436, 450–462. [Google Scholar]
  29. Dore, C.; Murphy, M. Semi-automatic generation of as-built BIM façade geometry from laser and image data. J. Inf. Technol. Constr. 2014, 19, 20–46. [Google Scholar]
  30. Huber, D.; Akinci, B.; Stambler, A.; Xiong, X.; Anil, E.; Adan, A. Methods for automatically modeling and representing as-built building information models. In Proceedings of the 2011 NSF Engineering Research and Innovation Conference, Atlanta, Georgia, 4–7 January 2011. [Google Scholar]
  31. Khoshelham, K.; Díaz-Vilariño, L. 3D modelling of interior spaces: Learning the language of indoor architecture. In Proceedings of the ISPRS Technical Commission V Symposium, Riva del Garda, Italy, 23–25 June 2014; Volume XL-5, pp. 321–326. [Google Scholar]
  32. Oesau, S.; Lafarge, F.; Alliez, P. Indoor scene reconstruction using feature sensitive primitive extraction and graph-cut. ISPRS J. Photogramm. Remote Sens. 2014, 90, 68–82. [Google Scholar] [CrossRef]
  33. Ochmann, S.; Vock, R.; Wessel, R.; Tamke, M.; Klein, R. Automatic Generation of Structural Building Descriptions from 3D Point Cloud Scans. In Proceedings of the 9th International Conference on Computer Graphics Theory and Applications (GRAPP), Lisbon, Portugal, 5–8 January 2014. [Google Scholar]
  34. Budroni, A.; Boehm, J. Automatic 3D Modelling of Indoor Manhattan-World Scenes From Laser Data. In Proceedings of the ISPRS Commission V Technical Symposium – Close Range Image Measurement Techniques, Newcastle upon Tyne, UK, 22–24 June 2010; Volume XXXVIII, pp. 115–120. [Google Scholar]
  35. Mura, C.; Mattausch, O.; Jaspe Villanueva, A.; Gobbetti, E.; Pajarola, R. Automatic room detection and reconstruction in cluttered indoor environments with complex room layouts. Comput. Graph. 2014, 44, 20–32. [Google Scholar] [CrossRef]
  36. Ikehata, S.; Yang, H.; Furukawa, Y. Structured Indoor Modeling. In Proceedings of the 2015 IEEE International Conference on Computer Vision (ICCV), Santiago, Chile, 7–13 December 2015; pp. 1323–1331. [Google Scholar]
  37. Anagnostopoulos, I.; Pătrăucean, V.; Brilakis, I.; Vela, P. Detection of Walls, Floors, and Ceilings in Point Cloud Data. In Proceedings of the Construction Research Congress 2016, San Juan, Puerto Rico, 31 May–2 June 2016; pp. 2302–2311. [Google Scholar]
  38. Hong, S.; Jung, J.; Kim, S.; Cho, H.; Lee, J.; Heo, J. Semi-automated approach to indoor mapping for 3D as-built building information modeling. Comput. Environ. Urban Syst. 2015, 51, 34–46. [Google Scholar] [CrossRef]
  39. Jung, J.; Hong, S.; Jeong, S.; Kim, S.; Cho, H.; Hong, S.; Heo, J. Productive modeling for development of as-built BIM of existing indoor structures. Automat. Constr. 2014, 42, 68–77. [Google Scholar] [CrossRef]
  40. Thomson, C.; Boehm, J. Automatic geometry generation from point clouds for BIM. Remote Sens. 2015, 7, 11753–11775. [Google Scholar] [CrossRef]
  41. Tarsha-Kurdi, F.; Landes, T.; Grussenmeyer, P. Hough-Transform and Extended Ransac Algorithms for Automatic Detection of 3D Building Roof Planes From Lidar Data. In Proceedings of the ISPRS Workshop on Laser Scanning 2007, Espoo, Finland, 12–14 September 2007; Volume XXXVI, pp. 407–412. [Google Scholar]
  42. Díaz-Vilariño, L.; Lagüela, S.; Armesto, J.; Arias, P. Indoor daylight simulation performed on automatically generated as-built 3D models. Energ. Build. 2014, 68, 54–62. [Google Scholar] [CrossRef]
  43. Valero, E.; Adán, A.; Cerrada, C. Automatic method for building indoor boundary models from dense point clouds collected by laser scanners. Sensors 2012, 12, 16099–16115. [Google Scholar] [CrossRef] [PubMed]
  44. Boulch, A.; De La Gorce, M.; Marlet, R. Piecewise-planar 3D reconstruction with edge and corner regularization. In Proceedings of the 35th Annual Conference of the European Association for Computer Graphics, Strasbourg, France, 7–11 April 2014; Volume 33, pp. 55–64. [Google Scholar]
  45. Anagnostopoulos, I.; Belsky, M.; Brilakis, I. Object Boundaries and Room Detection in As-Is BIM Models from Point Cloud Data. In Proceedings of the 16th International Conference on Computing in Civil and Building Engineering, Osaka, Japan, 6–8 July 2016. [Google Scholar]
  46. Stambler, A.; Huber, D. Building Modeling through Enclosure Reasoning. In Proceedings of the 2014 International Conference on 3D Vision, Tokyo, Japan, 8–11 December 2014; Volume 2, pp. 118–125. [Google Scholar]
  47. Coughlan, J.; Yuille, A. Manhattan World: compass direction from a single image by Bayesian Ininference. In Proceedings of the International Conference on Computer Vision ICCV’99, Kerkyra, Greece, 20–27 September 1999; Volume 2, pp. 941–947. [Google Scholar]
  48. Becker, S.; Peter, M.; Fritsch, D. Grammar-Supported 3D Indoor Reconstruction From Point Clouds for “As-Built” BIM. In Proceedings of the PIA15+HRIGI15 – Joint ISPRS conference, Munich, Germany, 25–27 March 2015; Volume II-3/W4, pp. 17–24. [Google Scholar]
  49. Vanegas, C.A.; Aliaga, D.G.; Benes, B. Automatic extraction of Manhattan-World building masses from 3D laser range scans. IEEE Trans. Vis. Comput. Graph. 2012, 18, 1627–1637. [Google Scholar] [CrossRef] [PubMed]
  50. Nüchter, A.; Hertzberg, J. Towards semantic maps for mobile robots. Robot. Auton. Syst. 2008, 56, 915–926. [Google Scholar] [CrossRef]
  51. Bassier, M.; Vergauwen, M.; Van Genechten, B. Automated Semantic Labelling of 3D Vector Models for Scan-to-BIM. In Proceedings of the 4th Annual International Conference on Architecture and Civil Engineering (ACE 2016), Singapore, 25–26 April 2016; pp. 93–100. [Google Scholar]
  52. Golovinskiy, A.; Kim, V.G.; Funkhouser, T. Shape-based recognition of 3D point clouds in urban environments. In Proceedings of the IEEE 12th International Conference on Computer Vision, IEEE, Kyoto, Japan, 27 September–4 October 2009; pp. 2154–2161. [Google Scholar]
  53. Pang, G.; Qiu, R.; Huang, J.; You, S.; Neumann, U. Automatic 3D Industrial Point Cloud Classification and Modeling. In Proceedings of the 14th IAPR International Conference on Machine Vision Applications (MVA), Tokyo, Japan, 18–22 May 2015; pp. 22–25. [Google Scholar]
  54. Günther, M.; Wiemann, T.; Albrecht, S.; Hertzberg, J. Model-based furniture recognition for building semantic object maps. Artif. Intell. 2017, 247, 336–351. [Google Scholar] [CrossRef]
  55. Johnson, A.; Hoffman, R.; Osborn, J.; Hebert, M. A System for Semi-automatic Modeling of Complex Environments. In Proceedings of the International Conference on Recent Advances in 3D Digital Imaging and Modeling, Ottawa, ON, Canada, 12–15 May 1997; pp. 213–220. [Google Scholar]
  56. Nguyen, T.H.; Oloufa, A.A.; Nassar, K. Algorithms for automated deduction of topological information. Automat. Constr. 2005, 14, 59–70. [Google Scholar] [CrossRef]
  57. Belsky, M.; Sacks, R.; Brilakis, I. Semantic Enrichment for Building Information Modeling. Comput.-Aided Civ. Inf. 2016, 31, 261–274. [Google Scholar] [CrossRef]
  58. Macher, H.; Landes, T.; Grussenmeyer, P. Point clouds segmentation as base for as-built BIM creation. In Proceedings of the 25th International CIPA Symposium 2015, Taipei, Taiwan, 31 August–4 September 2015; Volume II-5/W3, pp. 191–197. [Google Scholar]
  59. Macher, H.; Landes, T.; Grussenmeyer, P. Validation of Point Clouds Segmentation Algorithms Through Their Application to Several Case Studies for Indoor Building Modelling. In Proceedings of the XXIII ISPRS Congress, Prague, Czech Republic, 12–19 July 2016; Volume XLI-B5, pp. 667–674. [Google Scholar]
  60. Torr, P.H.; Zisserman, A. MLESAC: A new robust estimator with application to estimating image geometry. Comput. Vis. Image Und. 2000, 78, 138–156. [Google Scholar] [CrossRef]
  61. Murray, J.D.; VanRyper, W. Graphics File Formats. In Encyclopedia of Graphics File Formats, 2nd ed.; O’Reilly: Sebastopol, CA, USA, 1996; pp. 946–952. [Google Scholar]
  62. BuildingSMART. IFC Overview Summary. Available online: http://www.buildingsmart-tech.org/specifications/ifc-overview (accessed on 28 September 2017).
  63. Olson, D.L.; Delen, D. Advanced Data Mining Techniques; Springer: Berlin, Germany, 2008; p. 138. [Google Scholar]

Article Metrics

Citations

Article Access Statistics

Multiple requests from the same IP address are counted as one view.