Abstract
The stability of slopes containing flat caves, frequently employed in mining for transportation and drainage, is critically compromised by alternating dry and wet cycles, posing significant geohazard risks. This study investigates the deformation and damage mechanisms of such a slope at a fluorspar mine in Hunan Province, China. An integrated methodology combining indoor physical similarity simulation and Abaqus CAE finite element numerical simulation was employed. The experimental and numerical results demonstrate that: (1) slope stability deteriorates through three stages: latent, developmental, and eruptive. The highest localized strain reached 0.253% in the mid-to-lower slope area, with a maximum overall deformation of 0.838%. (2) Crack formation was most pronounced during the first two cycles, with a rapid increase in total crack length and area, after which the crack network stabilized. (3) Saturation levels gradually rose from the slope base to the middle section, reaching nearly full saturation at the base after the fourth cycle, which corresponded with concentrated displacement in the mid-lower slope. This research clarifies the phased failure mechanisms of flat-cave slopes under hydrological cycling and offers practical technical guidance for safety monitoring, early warning system development, and protective engineering design for mine slopes with similar geological settings.
1. Introduction
Research on slope stability is a vital area in geotechnical engineering. China has vast mountainous areas, making up roughly two-thirds of its land, where slope-related hazards such as landslides and avalanches happen often, posing serious risks to people’s safety and property [1,2]. In recent years, with the growth of mining activities, the stability of slopes with flat caves has become a more pressing issue [3]. Flat caves are designed to enable ore transportation, drainage, and ventilation at minimal cost and are ideal for areas with significant elevation differences and shallow-buried ore bodies. While flat caves facilitate mining, they also heighten the risk of slope instability, especially under extreme weather conditions [4,5]. In the natural state, the stability of slopes containing caves is often affected by wet and dry cycles (Figure 1), which can lead to deformation and safety accidents. Therefore, it is important to study the stability evolution mechanism of slopes containing flat caves to ensure the safe operation of mines.
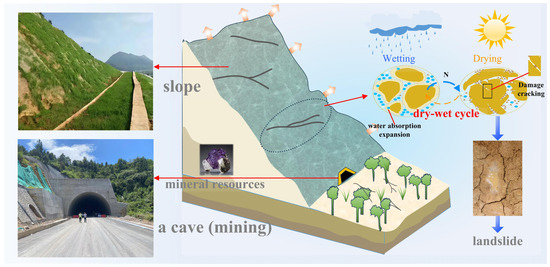
Figure 1.
Schematic diagram of the effects of wet and dry cycles on the slope of a flat cave.
Domestic and foreign scholars have revealed the effects of single factors such as rainfall and earthquakes on slope stability through field observations, numerical simulations and experimental studies [6]. Li et al. [7] proposed an algorithm to generate the slip line field and verified the slope failure mechanism and the rigorous solution under seismic action by comparing it with the conventional method. Liu et al. [8] employed the Bayesian subset simulation updating (BUS) method to estimate multiple spatially varying soil parameters by integrating slope survival data, enabling effective prediction of the probability of slope failure during rainfall events. The study of the influence of a single factor on slope stability has certain condition limitations, and in recent years, scholars have paid more attention to the influence of multi-factor coupling on slope stability [9,10]. Park et al. [11] proposed a heat–water–force analysis model, mainly considering the slope of the line that is in the critical state, and verified the model by combining the triaxial compression test and the simulation analysis of the slope stability to prove the reliability of the calculation of the safety factor of local slopes. Wang et al. [12] studied the slope dynamics model and the evolution of the slope safety coefficient by rainfall–vibration coupling, and the results showed that the surface porosity and horizontal seismic coefficient were negatively correlated with the slope safety coefficient.
The impact of alternating dry and wet cycles on geotechnical materials, resulting from the common natural process of rainfall followed by evaporation, significantly influences their physical and mechanical characteristics. These natural dry and wet cycles represent the real conditions that geotechnical slope materials undergo [13,14]. During dry and wet cycling, the structural changes of the soil body are not fully reversible, and the cumulative expansion and contraction deformation generates macroscopic porosity, which reduces the stability of the rock–soil mass [15,16]. Jing et al. [17] conducted experimental studies on slope destabilization of unsaturated loess under the action of dry and wet cycling, and the results showed that the dry and wet cycle affects the slope stability by changing the volumetric water content of unsaturated loess and the permeability coefficient of unsaturated loess. Existing numerical simulation studies on slopes are mostly focused on the effects of single factors such as rainfall or vibration on slopes and are idealized for target slopes, while numerical simulation studies on complex slope models with wet and dry cycling processes are not common [10]. Chen et al. [18] combined the indoor similarity test of slopes and PFC simulation software to study the mechanism of crack evolution and concluded that the number of cracks and the degree of damage to the slope increased with the increase in the number of wet and dry cycles. Zhang et al. [19] introduced the role of wet and dry cycles in expanding soil slopes based on the discrete element numerical simulation method, and the results showed that seasonal wet and dry cycles were unfavorable conditions and the development of cracks resulted in the decrease in mechanical strength of the soil body and the softening of the soil body and provided guidance for slope engineering.
Research into the instability mechanisms of slopes containing horizontal tunnels under wet–dry cycling conditions remains relatively scarce, constituting a gap in understanding mining-related geological hazards. Unlike conventional homogeneous slopes, slopes incorporating horizontal tunnels exhibit significant structural discontinuities [20]. These artificially excavated cavities disrupt stress fields and create pathways for internal water migration, potentially triggering unique and accelerated degradation processes under seasonal weathering. Existing research predominantly relies on idealized models, failing to address this complexity [21,22]. Consequently, this study employs a synergistic approach combining laboratory physical modeling with Abaqus CAE numerical simulation to investigate a real-world fluorite mine case. The explicit objectives of this study are: (1) to define the characteristic stages of instability specific to flat-tunnel slopes; (2) to elucidate the mechanical mechanisms governing the evolution of fracture networks under hydraulic cycling; (3) to establish a coupled analysis framework linking water migration, deformation, and structural response.
2. Materials and Methods
2.1. Theoretical Model Construction
2.1.1. Coupled Seepage–Stress Model
As a porous medium, the geotechnical materials within a slope undergo coupled seepage–stress interactions under dry–wet cycling. Seepage driven by head differences creates infiltration volume forces that modify the stress field, subsequently influencing soil particle movement, porosity, and seepage properties. This dynamic coupling, governed by relationships dependent on the hydraulic gradient (Equations (1) and (2)), emphasizes the need to analyze how infiltration forces alter the seepage–stress field, particularly given spatial variations in material properties and groundwater conditions [23].
where f is the seepage volume force; , , are the components of the seepage volume force along the x, y, and z axes, respectively; , , are the angles between f and , , respectively; , , are the hydraulic slope drop of the unit in the x, y, and z directions, respectively.
The unit infiltration volume force is converted into equivalent nodal load realized as in Equations (3) and (4):
where is the unit shape function; , are the equivalent junction forces due to the penetration volume forces and their increments, respectively.
Geotechnical deformation arises from external load consolidation in porous media, such as soil infiltration forces, which alter pore volume. This change affects the soil’s permeability coefficient, subsequently modifying the seepage field. The permeability shift stems from infiltration forces altering pore ratio, stress field, and soil structure. Darcy’s law expresses the fluid permeability coefficient as Equation (5) [24]:
where k is the permeability coefficient (cm/s); is the permeability (cm2); is the fluid viscosity (Pa·s); is the kinematic viscosity coefficient (cm2/s). This test refers to the kinematic viscosity of water at 20 °C, which is 1.004 × 10⁻² cm2/s. Equation (5) indicates that the key factors affecting the permeability of a rock–soil mass are its own permeability and fluid properties, which include density and fluid viscosity .
Pore change is one of the important factors of volume change of rock–soil mass; the initial porosity of the soil body is defined as , the total volume of the soil body is , the pore volume change is , and the volumetric strain of the rock–soil mass under the action of the stress field is expressed as Equation (6) [25]:
The porosity of soil elements under stress field action is expressed by Equation (7):
In the equation, n0 denotes the initial porosity and represents the volumetric strain. Under the action of seepage–stress coupling, changes in the stress field induce volumetric strain in the rock–soil mass. This volumetric strain further alters the porosity of the rock–soil mass, and since porosity is closely correlated with the permeability coefficient, the permeability coefficient also undergoes corresponding changes.
The comprehensive mechanical response of the rock–soil mass under such coupled seepage–stress conditions cannot be characterized by individual physical field equations alone. Instead, the coupled seepage–stress response is governed by a system of equations combining mechanical equilibrium and fluid flow continuity. This system can be summarized as follows [26]:
where is the seepage field head distribution function; is the soil stiffness matrix; is the nodal load increment caused by external loads such as soil self-weight ground overload; is the nodal load increment of seepage volume force due to changing seepage field; is the displacement increment; is the permeability coefficient corresponding to , .
2.1.2. Mohr–Coulomb Constitutive Model
Dry–wet cycling induces significant alterations in the strength and deformation characteristics of rock–soil masses, necessitating a suitable constitutive model to accurately characterize their mechanical responses under such cyclic hydrological conditions. The Mohr–Coulomb failure criterion is a classic strength criterion for describing the shear failure behavior of geotechnical materials, and the elastoplastic constitutive model established with this criterion as the yield criterion is widely adopted to depict the mechanical behavior of rock–soil masses in geotechnical engineering. This constitutive model defines a distinct elastoplastic response of geotechnical materials: when the stress state of the material does not reach the yield limit, it exhibits linear elastic deformation with fully recoverable strains; once the stress state exceeds the yield limit, the material enters the plastic stage. The classic Mohr–Coulomb model is characterized by ideal plastic behavior in this stage, while modified forms of the model can also incorporate strain hardening or softening characteristics to match the actual mechanical properties of specific rock–soil masses [27].
The Mohr–Coulomb criterion assumes that: the shear stress acting on a point is equal to the shear strength of the point when the point is damaged, and the shear strength and the positive stress acting on the surface of the linear relationship is shown in the following Equation (9) [28]:
is the shear stress, is the normal stress, is the cohesive force of the material, is the internal friction angle of the material.
The Mohr–Coulomb failure envelope in the σ–τ plane is shown in Figure 2 [29].
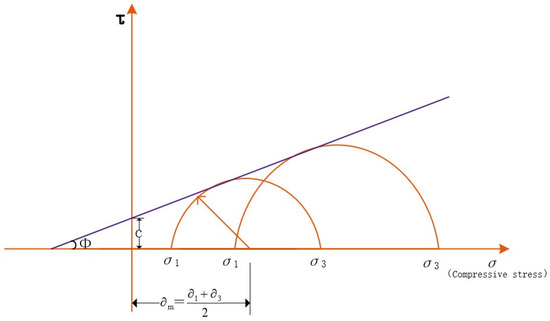
Figure 2.
Mohr–Coulomb failure envelope in the σ–τ plane.
An elastoplastic constitutive model with a Mohr–Coulomb plastic criterion implemented in ABAQUS 2023 was adopted. The model considers linear elastic behavior followed by plasticity governed by the Mohr–Coulomb failure envelope. For detailed descriptions of the yield surface, flow rules, and specific implementation methods for this model, please refer to the relevant ABAQUS documentation [30,31].
The Mohr–Coulomb elastoplastic constitutive model in Abaqus CAE effectively simulates the mechanical behavior of soils, accurately capturing the material characteristics and yielding properties of granular soil layers. Its improved version adopts a smooth elliptical plastic potential surface to replace the sharp-angled yield surface of the original model. By reasonably setting key parameters such as eccentricity, dilatancy angle, and π-plane shape parameter—which are closely related to the plastic response of the model—it fundamentally resolves the discontinuity problem of the stress yield surface. These improvements significantly enhance computational convergence and the consistency of plastic flow directions, making Abaqus CAE particularly suitable for numerical modeling of slope stability under dry–wet cycles, especially for rock–soil masses with undercut level caves.
2.2. Physical Model Experiment
2.2.1. Project Overview
The Xinsanli Fluorspar Mine is located in the south of Yanling County, Hunan Province, China, about 40 km straight ahead; geographic coordinates: 113°51′43″~113°52′30″ E; 26°08′27″~26°09′13″ N, as shown in Figure 3. This area belongs to the warm and humid subtropical monsoon climate zone, with four distinct seasons and abundant rainfall. According to the statistics of Yiling County Meteorological Bureau from 1970 to 2013, the average annual precipitation is 1497 mm, the annual sunshine is 1700 to 1860 h, and the average annual evaporation is 1269.8 mm.
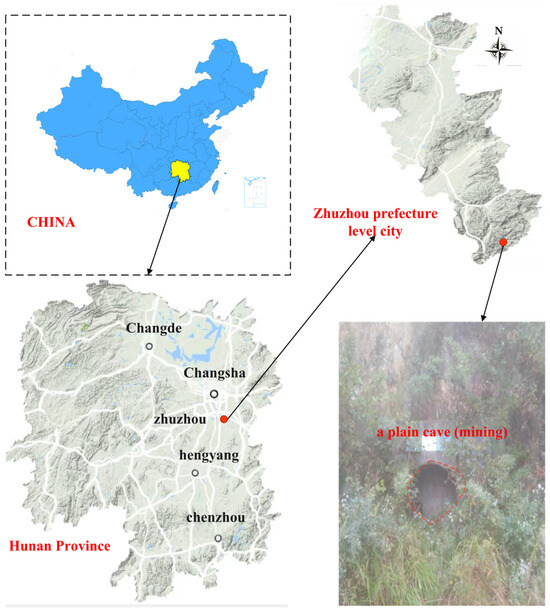
Figure 3.
Map of the Xinshanli Fluorspar Mine cave site.
The geological environment of the mining area can be broadly divided into three main zones. (1) Granite residual soil layer: granite undergoes intense weathering, with slopes featuring residual colluvial deposits of gravelly sandy clay, 0–3 m thick. (2) Intensely weathered granite zone: the thickness of the intensely weathered zone within the granite body in this area ranges from 3 to 10 m, with the rock mass exhibiting poor stability. (3) Weakly weathered granite layer: beneath the strongly weathered zone, the integrity and solidity of the weakly weathered rock mass are relatively better. This study selected the fully enclosed +1380 horizontal tunnel as the research subject. This area features steep slopes with inclines reaching 60°, overlain by unstable granite residual soil and strongly weathered granite, as shown in Figure 3. These factors render the area susceptible to deformation under the influence of wet–dry cycles.
2.2.2. Material Preparation
The success of similarity modeling experiments is dependent on the rational selection of similar materials. In this test, iron fine powder, barite powder and white crystalline sand were used as aggregates, rosin and alcohol were used as binder, and gypsum was used as conditioner to configure the similar materials of strong and weakly weathered granite, and the material parameters are shown in Table 1 [32]. Four factors were set in this test: A: iron powder quality/aggregate; B: barite powder/aggregate; C: (gypsum + rosin)/aggregate; D: rosin quality/(rosin + alcohol); the configured similar material factors were accounted for as shown in Table 2. It is worth noting that, compared with existing similar model materials which often suffer from low precision, the test flats in this study were prepared by 3D printing with a printing accuracy of 0.1 mm and a powder laying thickness of ≤0.1 mm, thereby significantly enhancing the precision of the similar model materials.

Table 1.
Properties and specifications of similar materials.
Table 2.
Granite similar material factor proportion.
2.2.3. Experimental Design
The self-constructed similar experimental setup includes similar side slopes, drying device, rainfall device, and monitoring equipment. The interior of the model box consists of weakly weathered granite analogs, strongly weathered granite analogs, granite residual soil from actual working conditions, and a 3D printed cave to model the slope and the undercut cave; the exterior of the model box consists of an artificial wetting device, an artificial drying device, and a monitoring device to form a wet/dry cycle and a data monitoring system. The main equipment for artificial rainfall is selected from showerheads and atomizing nozzles. Shower nozzles are used to produce stable raindrops and fogging nozzles are used to produce temporary raindrops to overcome the differences in raindrops in order to better simulate natural rainfall. The model box is made of PVC boards bonded together, the corners are fixed by “L” type glass clips, and the top and one side are open, with the dimensions of 1.5 m × 0.5 m × 1.0 m, as shown in Figure 4.
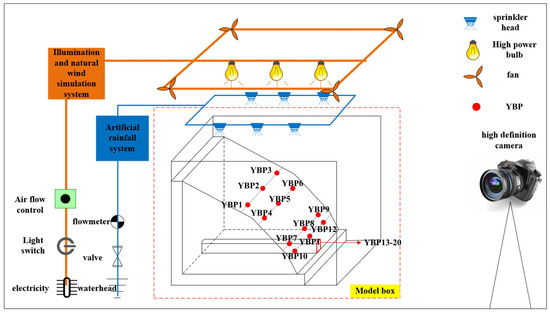
Figure 4.
Experimental design diagram.
Strain gauges (120-20-AA, conductor length 1 m, specification 24.5 × 5.0 mm) were buried to the articulation of the strongly weathered granite layer and the granite residual soil layer, and they were laid out with the symmetry line of the model box as the reference line, numbered YBP1~20, respectively, and the points were laid out as shown in Figure 4. At the same time, since the strain gauge itself is not resistant to pressure or moisture and cannot be directly attached to the soil layer, protective measures such as 703 silicone rubber, gauze, and epoxy resin were used to wrap and shield it. Furthermore, the wires of the strain gauge were bundled and fixed on the surface of the left PVC board to avoid interfering with the experimental process.
After the preparation of the materials, the specific steps of model construction are as follows: (1) Model box and flat cave (Figure 5a) layout. Use a red ink pen to draw a line on the side of the model box according to the layout plan of the model to strictly delineate the areas of strong and weakly weathered granite and soil layers. Fix the cave in the delineated position and wrap it with white film. (2) Strongly weathered granite similar material preparation and filling. I: Weighing: According to the designed mass ratio of similar materials, first crush rosin into powder, weigh the appropriate iron crystal powder, barite powder, white crystal sand, rosin, alcohol and gypsum (as shown in Figure 5b). II: Mixing: Put the weighed iron crystal powder, barite powder, white crystal sand and gypsum into a plastic bucket and mix well, then add the rosin alcohol solution (as in Figure 5c) and mix well (as in Figure 5d). III: Filling: For each mixed part of similar materials, use a small shovel to place them evenly into the area of strongly weathered granite and compact them with a compacting hammer (as in Figure 5e). With 10 cm as the boundary of layered filling, every compaction is 10 cm high and static for 5 h to make it fully solidified. (3) Soil layer material preparation and filling. I: Soil extraction and processing: The soil sample is selected as shallow gravelly sandy clay, the retrieved gravelly sandy clay is evenly spread on a nylon cloth, mashed, air-dried and sieved; observe the degree of drying of the soil and measure its moisture content, and record the moisture content when the moisture content is relatively stable; after the treatment is completed, it is bagged and sealed to ensure that the moisture content of the soil body is stable, so as to be prepared for the subsequent experiments. II: Filling: Add the treated soil to the soil layer in strict layers. Take 3 cm height as the boundary and fill it in layers, use a small shovel to compact it fully every 3 cm, and leave it to stand. The model is built as shown in Figure 5f.
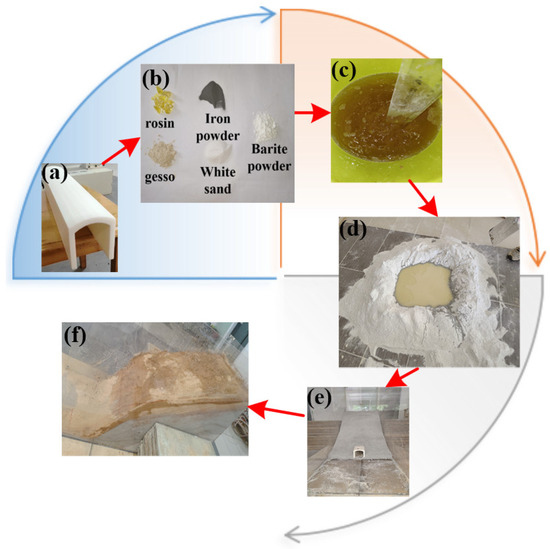
Figure 5.
Model building flow chart ((a): 3D printing adit, (b): Material preparation, (c): binder fusion, (d): material mixing, (e): fill, (f): Complete construction diagram).
To simulate representative hydrologic stresses in a controlled manner, key parameters for the wet–dry cycles were selected with reference to typical values used in analogous experimental studies. The dry and wet cycle experimental process is as follows: (1) Wet: Turn on the rainfall device with uniform rainfall to 15 mm/h water flow simulated rainfall. Use a high-frequency moisture meter to monitor the water content in real time, stop rainfall when the water content rises 8%, and record the rainfall time X. After the rainfall is over, let it stand for 3 h, so that the water penetrates evenly. (2) Drying: Turn on the drying equipment and keep the surface temperature of the soil at about 35°. For real-time monitoring of water content, when the water content drops to the initial level, stop drying, record the drying time Y, and keep it static (subsequent experimental time X, Y unchanged). (3) Cycle the process of (1) (2) according to the rainfall time X, drying time Y, and carry out a total of five cycles.
2.3. Numerical Model Experiment
Based on the actual engineering profile, the model was assembled from four components: granite residual soil, weakly weathered granite, strongly weathered granite, and a flat cave. These components were constructed separately and assigned parameters for density, elasticity, and plasticity. The element type used was CPE4P (a 4-node plane-strain quadrilateral element with bilinear displacement and pore pressure). The mesh consisted of 1041 elements, and analysis confirmed good mesh quality, as shown in Figure 6a.
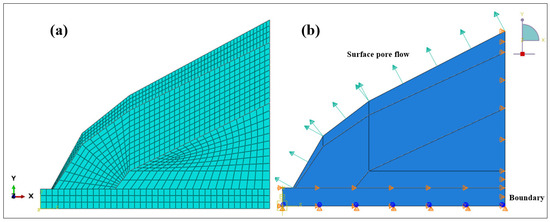
Figure 6.
Numerical model configuration diagram ((a). Grid division, (b). Boundary conditions and loads).
The wet–dry cycling process in Abaqus CAE is set up by controlling the surface pore flow. The wet–dry cycling process is realized by alternating five consecutive steps of rainfall and drying in the initial steady-state environment. The pore fluid response is transient consolidation with a time length of 120–150. Gravity field and surface pore flow field loads are applied to the model. The bottom and right sides of the model were set as completely fixed boundaries as shown in Figure 6b.
Upon completion of the modeling, the material parameters for the components must be determined. The properties of each component are as shown in Table 3: density distribution is uniform, elasticity and permeability are isotropic, and the specific gravity of the interstitial fluid is 10. Within Abaqus CAE, units are expressed in two different dimensions; this study employs the SI (m) dimension, i.e., metric units.
Table 3.
Mechanical properties of each component.
3. Results and Discussion
3.1. Analysis of Experimental Results of Physical Model
The formation of fissures destroys the integrity of the rock–soil mass and reduces its overall strength. As the cycle progresses, the surface saturation of the slope in the wetting step increases compared to the previous cycle from the cave section to the mid-slope area. The first cycle of rainfall stage makes the surface pores in the natural state slowly heal due to rainwater infiltration, and when rainwater infiltration is complete, the slope rock and soil body slowly soften, as shown in Figure 7a. The drying stage of the surface fissures gradually appeared and through each other, resulting in the initial formation of reticulation fissures. The slope is stable in this stage, for the latent period of slope instability, as shown in Figure 7b. The network of fissures serves as the primary pathway for rainwater infiltration, playing a crucial role in reducing the shear strength of the soil layer [33]. During the 2nd–3rd rainfall cycles, infiltration rates decrease significantly as surface pores heal, while rainwater accumulates within the fissure network, preventing its closure. In subsequent drying phases, the fully developed fissure network expands both laterally and vertically. Although slope stability is maintained during this period, critical destabilizing factors—including pore healing and fissure propagation—progress rapidly, marking this as the crucial development stage for potential slope failure, as shown in Figure 7c–f. In the fourth cycle, rainwater saturation occurred in the cave and slope tail sections. The reduced infiltration rate caused surface erosion, while standing water accelerated soil collapse. As the amount of rainfall infiltration decreased, the drying step cracks continued to develop with the pre-formed network of cracks and there was a faceted bulge on the surface, and there was a phenomenon of the particles of soil drooping, some of which were drooping to the entrance of the cave. As shown in Figure 7g–j, by the fifth wet–dry cycle, complete saturation occurs in both the cave and slope toe regions. This saturation prevents further rainwater infiltration, triggering surface runoff that flows from the slope toe into the cave, causing significant surface erosion. The runoff ultimately drains into the cave entrance, while continued drying induces surface bulging. These processes lead to massive granular soil and rock collapse into the cave entrance, initiating slope failure in the cave section—marking the eruptive phase of instability. The stability evolution of submerged cave slopes thus progresses through three distinct stages: latent, developmental, and eruptive phases.
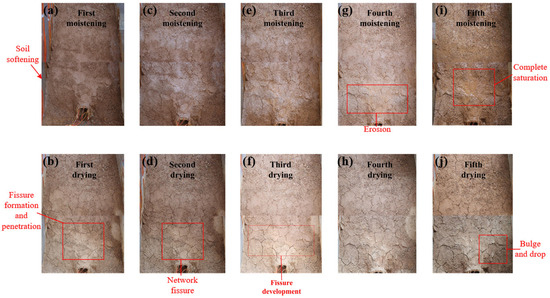
Figure 7.
Drying and wetting cycle diagram ((a,c,e,g,i) in the figure are the results of the first, second, third, fourth and fifth wetting cycles, respectively; (b,d,f,h,j) are the results of the first, second, third, fourth and fifth drying cycles, respectively).
Figure 8 illustrates the strain evolution at six representative monitoring points—YBP-2, YBP-8, YBP-11and YBP-16—positioned along the symmetry line of the slope. These points correspond to the upper slope, slope shoulder, mid-slope, slope toe, cave entrance, and the interior of the flat cave, respectively. The data originates from strain gauge measurements obtained in similar model tests following five consecutive wet–dry cycles. The results show that the mid-slope to slope toe region exhibited the most significant strain accumulation, with strain rising from 5850 µε to 8380 µε, which corresponds to an increase of 0.253 percent and a maximum deformation of 0.838 percent. In contrast, owing to the higher strength of the rock mass around the flat cave, strain changes in this area remained relatively modest, increasing only from 3880 µε to 4470 µε, an increase of 0.059 percent, and reaching a maximum deformation of 0.447 percent. Overall, wetting phases increased rock mass strain, whereas drying phases reduced it. However, the strain increment induced by wetting consistently surpassed the decrement caused by drying, resulting in net cumulative strain over successive cycles. This pattern indicates a progressive deterioration in the stabilizing strength of the rock mass.
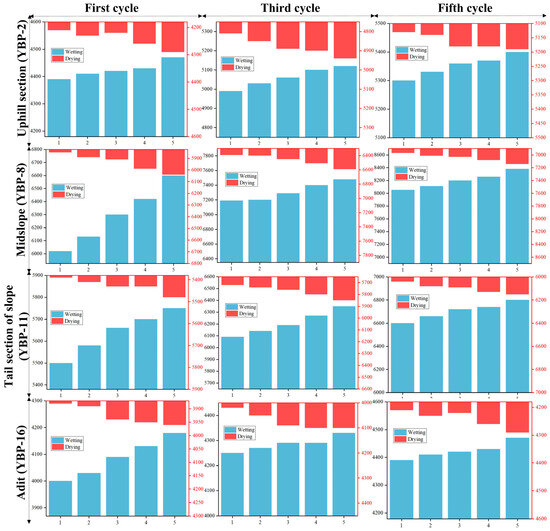
Figure 8.
Variation diagram of strain value during five dry–wet cycles.
In order to quantify the fissures generated on slopes under wet and dry cycling conditions, this study analyzes high-definition images of fissure evolution at different stages of dry and wet cycles in a typical region by means of the Particle (Pore) and Fissure Image Recognition and Analysis System (PCAS), and the analysis process is as follows: (1) importing the images; (2) binary processing; (3) soil block segmentation and fissure repair; and (4) outputting the fissure vector map. The specific analysis process is shown in Figure 9. Through the software automatic binarization and split and repair fissure processing, the number of fissure intersections, the number of nodes, the total area of the fissure, the total length of the fissure, the fissure rate and other parameters are obtained.
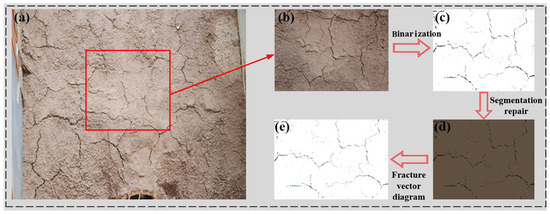
Figure 9.
Image processing process of typical crack area ((a): HD image of slope; (b): Typical area image; (c): binary image; (d): segmentation repair image; (e): fracture vector diagram).
A unified automatic thresholding algorithm was employed throughout image processing to ensure consistency. Whilst threshold selection may influence the extraction of minute fractures, its impact on assessing the evolutionary trends of macro-parameters such as total fracture area and total length remains limited. Furthermore, manual comparison of recognition results from representative stage images validated the reliability of the PCAS method in capturing key characteristics of crack network expansion. The total fissure length exhibited a biphasic growth pattern: rapid increase during cycles 1–2 (critical network formation period) followed by gradual growth in cycles 3–5 as the network stabilized (Figure 10a). Fissure rate consistently exceeded 2% after each drying phase, meeting Zhang’s [34] criteria for high-density fracturing (Figure 10b). The first cycle showed the most dramatic rate change as natural pores filled and new fractures initiated, while cycles 4–5 displayed delayed responses due to increased surface water and prolonged drying.
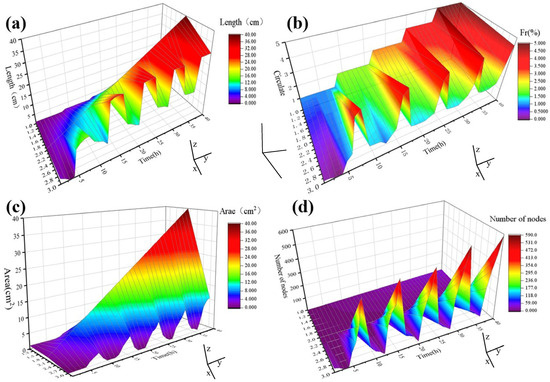
Figure 10.
Analysis results of fracture vector diagram ((a): cloud map of fracture total length variation; (b): cloud map of fracture rate change; (c): Cloud map of total fracture area change; (d): cloud map of fracture node number change).
The fissure area development exhibited a similar trend, where cycles one and two contributed the majority of expansion during the initial network framework establishment, after which subsequent cycles showed more uniform growth as illustrated in Figure 10c. Node formation data, presented in Figure 10d, revealed particularly rapid initial growth during the first cycle as primary nodes formed, with later cycles showing progressive interconnection that ultimately completed the network development. Together, these results clearly demonstrate the three distinct stages of fissure evolution: first, an initial rapid nucleation phase, followed by network propagation, and finally system stabilization.
3.2. Analysis of Numerical Model Experiment Results
Based on the experimental results of the physical model, the numerical simulation further reveals the dynamic variation characteristics of slope saturation, displacement and pore pressure in the process of wet and dry cycles.
The impact of wet and dry cycles on slope stability is primarily due to changes in the degree of saturation caused by water infiltration and evaporation. Research indicates that these wet–dry cycles cause irreversible alterations in the soil’s internal pore structure, which subsequently affect its hydraulic properties [15]. During the wetting phase, saturation increases significantly, whereas the drying phase only partially decreases saturation and does not return it to the original level before wetting [35]. As the cycles continue, rainwater accumulates within the soil, causing saturation to gradually rise from the slope’s entrance toward the mid-slope area. By the fourth cycle, the soil at the slope’s tail section was nearly saturated; after the fifth cycle, this area became fully saturated, as illustrated in Figure 11.
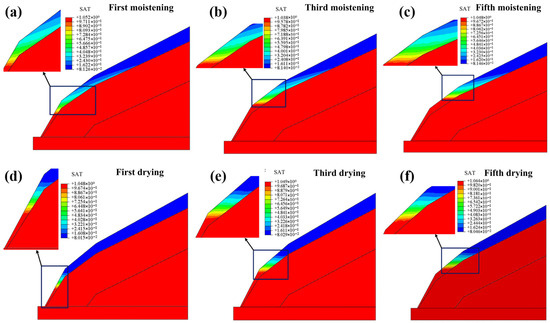
Figure 11.
The saturation change process of the dry and wet cycle numerical simulation ((a–c) are the results of the first, third and fifth wetting cycles, respectively; (d–f) are the results of the first, third and fifth drying cycles, respectively).
The wet–dry cycles cause gradual slope movement, mainly occurring in the mid-slope and toe areas with diagonal downward directions. Rainfall raises pore water pressure, which increases displacement, while drying reduces this effect. Importantly, each cycle shows a cumulative increase in displacement compared to earlier cycles. Due to its high strength, the strongly weathered granite layer experiences minimal displacement, whereas the weakly weathered granite layer shows more significant movement, as illustrated in Figure 12. The wet–dry cycles lead to displacement focusing in the mid-slope and toe regions by changing the soil’s pore structure, raising pore water pressure, expanding fracture networks, and worsening stress redistribution. This impact is further intensified by the contrasting mechanical properties of the strongly and weakly weathered layers. Together, these factors cause a steady rise in displacement magnitude with each wet–dry cycle [36].
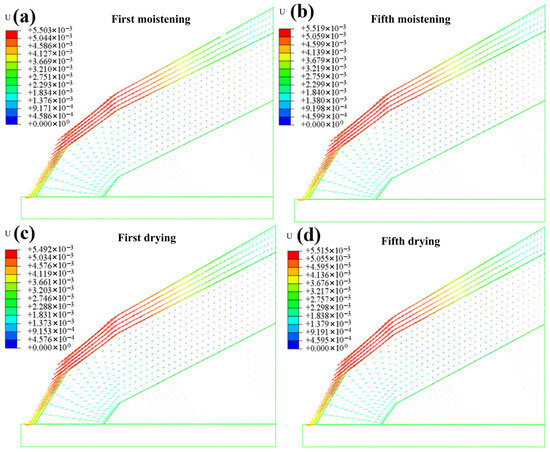
Figure 12.
Displacement changes of the first and fifth dry–wet cycle numerical simulation ((a,b) are the results of the first and fifth rainfall, respectively; (c,d) are the results of the first and fifth drying cycles, respectively).
The pore pressure of the slope rock–soil mass gradually increases after rainfall conditions occur in the wet-dry cycling process and decreases under dry conditions. In static equilibrium, the greater the inner extension of the rock–soil mass, the stronger the pore pressure, and the dry and wet cycling process leads to the pore pressure slowly becoming greater, which may lead to rock–soil mass stability deterioration as one of the factors affecting the stability of the slope rock–soil mass [37]. The pore pressure changes slowly during the dry and wet cycling process, thus the overall distribution of the pore pressure of the slope rock–soil mass is relatively uniform, and the internal pore pressure of the slope rock–soil mass is much greater than the surface pore pressure. The deeper part of the flat cave is the pore pressure high-intensity area; the pore pressure decreases step by step from the flat cave, through the weakly weathered granite layer, the strongly weathered granite layer, and the granite residual soil layer. The pore pressure increases due to the inflow of pore space from the surface soil during rainfall and vice versa during drying. Since the decrease in pore pressure during drying is much smaller than the increase in pore pressure during wetting, the pore pressure gradually increases during each cycle compared to the previous cycle, as shown in Figure 13.
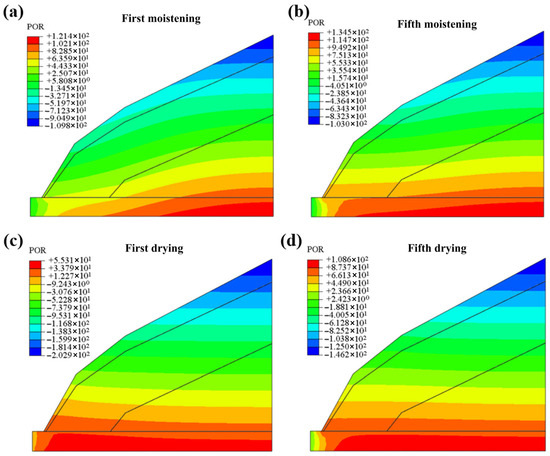
Figure 13.
Pore pressure changes of the first and fifth dry and wet cycle numerical simulation ((a,b) are the results of the first and fifth rainfall, respectively; (c,d) are the results of the first and fifth drying cycles, respectively).
Vertical strain exhibits a gradual decreasing trend from the granite residual soil layer at the upper part down to the weakly weathered granite layer. Constrained by the structural strength of the rock–soil mass, the vertical strain in the deep flat-cave areas and the weakly weathered granite layer is minimal in magnitude. Within the strongly weathered granite layer, the vertical strain shows only a slight variation amplitude, while distinct and notable changes in vertical strain are observed in the granite residual soil layer. As illustrated in Figure 14, strain was predominantly concentrated within two inflectional segments: from the slope shoulder to the mid-slope and from the mid-slope to the toe. The strain-generating zones exhibited considerable similarity during both the rainfall-wetting and dry-evaporation phases. During rainfall wetting, water accumulates within the rock–soil mass’s pores, generating seepage volumetric forces that may be regarded as external loads. The prolonged application of this force alters the stress field, subsequently triggering spatiotemporal evolution of particles within the rock–soil mass. This causes internal strain values to change according to the spatiotemporal distribution of particle deformation. Concurrently, physical model tests employing precision instruments to measure internal soil strains confirmed that strain values within the granitic residual soil layer indeed undergo modification. Both physical model testing and numerical simulation experiments indicate that the flat-tunnel chamber, possessing high inherent strength, exhibits minimal strain generation and may be defined as a strain relaxation zone [38]. Conversely, regions of significant internal strain within the granitic residual soil layer are concentrated in the mid-slope to toe transition zone. This demonstrates consistent results between physical model testing and numerical simulation experiments, validating their mutual consistency and reliability.
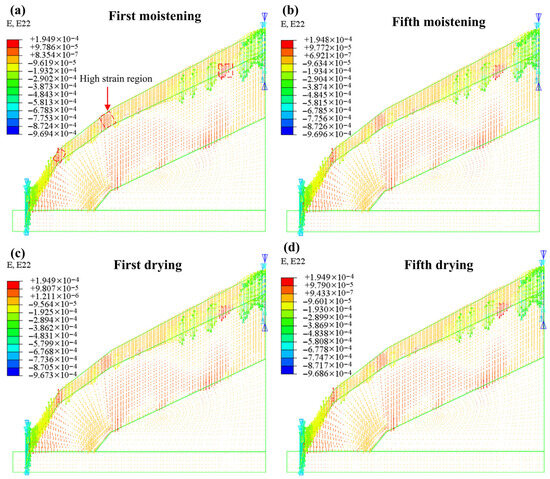
Figure 14.
Strain effects of the first and fifth dry–wet cycle numerical simulation ((a,b) are the results of the first and fifth rainfall, respectively; (c,d) are the results of the first and fifth drying cycles, respectively).
4. Conclusions
A field study of the +1380 level cave at the Xinsanli Fluorspar Mine revealed that the slope of the cave is steep and there are serious safety and environmental problems. This study integrates physical experiments and numerical simulations to investigate the stability evolution mechanisms of mine slopes containing submerged horizontal caves under cyclic wet–dry conditions. The findings provide critical insights for slope risk management and environmental protection in mining areas:
- (1)
- Under dry and wet cycling conditions, the stability of slopes containing an undercut flat cave degrades progressively through three distinct phases: a latent phase during the initial two cycles, a developmental phase in cycles three and four, and a final eruption phase upon the fifth cycle. The maximum strain value reaches 0.838%, with displacement primarily concentrated between the mid-slope and the slope toe. These characteristics can serve as effective early-warning indicators of impending slope damage.
- (2)
- Analysis of typical regional fissure images processed by the Particle and Crack Analysis System reveals that an initial fissure network forms during the first dry–wet cycle, accompanied by a rapid increase in fissure nodes and a linear rise in fissure density. The first and second cycles represent the critical period for network development, during which the total length and area of fissures increase abruptly. By the end of the second cycle, the fissure network stabilizes substantially. These interconnected fissures provide preferential pathways for rainwater infiltration, thereby reducing the shear strength of the slope.
- (3)
- A numerical model of the actual down-cut cave slope was established using Abaqus CAE to simulate the wet–dry cycling process. The results indicate that saturation increases gradually from the cave entrance toward the mid-slope, with the slope-toe soil reaching near-full saturation by the fourth cycle. Displacement concentrates predominantly in the mid-slope and toe regions. Pore pressure distributes uniformly overall, exhibiting a graded decrease from deeper layers toward the surface. Strain concentrates notably at the inflection zones between the slope shoulder and mid-slope and between the mid-slope and toe. These findings underscore the compound instability risk posed by water infiltration in slopes located in monsoon-affected mining areas.
The internal monitoring of slope geotechnical bodies requires in-depth exploration in the future. Techniques such as buried soil pressure sensors or high-precision three-dimensional laser scanners can be employed to capture the spatiotemporal evolution of stress and deformation. Furthermore, as different slope projects are subject to distinct meteorological conditions and material properties, their stability mechanisms under dry–wet cycles may vary. Research should therefore be extended to a wider range of geological and climatic settings. Additionally, the presence of surface vegetation may significantly influence slope surface stability through root reinforcement and evapotranspiration, suggesting the need for comparative studies on vegetated versus bare slopes to guide surface protection design.
Author Contributions
Writing—review & editing, C.X. and G.X.; Writing—original draft, J.C.; Investigation, C.X. and W.Z.; Supervision, G.X.; Formal analysis, X.W.; Software, J.S.; Resources, B.Y.; Methodology, Z.C.; Validation, C.F. All authors have read and agreed to the published version of the manuscript.
Funding
This research was funded by the Excellent Youth Project of Hunan Provincial Department of Ed-ucation (No. 22B0164). This research was funded by the Hunan Province Science Foundation (No. 2021JJ30679).
Informed Consent Statement
Not applicable.
Data Availability Statement
No new data were created or analyzed in this study. Data sharing is not applicable to this article.
Acknowledgments
The authors would like to convey their gratitude to all scholars who participated in the study and helped to collect the necessary data for this research.
Conflicts of Interest
The authors have no relevant financial or non-financial interests to disclose.
References
- Laimer, H.J. Anthropogenically Induced Landslides—A Challenge for Railway Infrastructure in Mountainous Regions. Eng. Geol. 2017, 222, 92–101. [Google Scholar] [CrossRef]
- Wu, W.; Guo, S.; Shao, Z. Landslide Risk Evaluation and Its Causative Factors in Typical Mountain Environment of China: A Case Study of Yunfu City. Ecol. Indic. 2023, 154, 110821. [Google Scholar] [CrossRef]
- Khalil, A.; Khan, Z.; Attom, M.; Khalafalla, O. Evaluation of Ground Improvement with Dynamic Replacement and Rapid Impact Compaction of an Artificial Island in the UAE—A Case Study. In Proceedings of the Geo-Congress 2024; American Society of Civil Engineers: Vancouver, BC, Canada, 2024; pp. 116–125. [Google Scholar]
- Luo, X.; Xiang, Y.; Yu, C. A Semi-Analytical Model and Parameter Analysis of a Collaborative Drainage Scheme for a Deeply Buried Tunnel and Parallel Adit in Water-Rich Ground. Appl. Sci. 2022, 12, 3759. [Google Scholar] [CrossRef]
- Zhang, Z.; Guo, W.; Mao, R.; Ge, L.; Liang, X.; Wu, H. Performance Analysis of an Improved Temperature Control Scheme with Cold Stored in Surrounding Rock for Underground Refuge Chamber. Appl. Therm. Eng. 2024, 236, 121589. [Google Scholar] [CrossRef]
- Zhu, B.; Lei, M.; Gong, C.; Zhao, C.; Zhang, Y.; Huang, J.; Jia, C.; Shi, C. Tunnelling-Induced Landslides: Trigging Mechanism, Field Observations and Mitigation Measures. Eng. Fail. Anal. 2022, 138, 106387. [Google Scholar] [CrossRef]
- Li, C.; Jiang, P.; Zhou, A. Rigorous Solution of Slope Stability Under Seismic Action. Comput. Geotech. 2019, 109, 99–107. [Google Scholar] [CrossRef]
- Liu, X.; Wang, Y. Bayesian Selection of Slope Hydraulic Model and Identification of Model Parameters Using Monitoring Data and Subset Simulation. Comput. Geotech. 2021, 139, 104428. [Google Scholar] [CrossRef]
- Hu, Y.; Liu, M.; Wu, X.; Zhao, G.; Li, P. Damage-Vibration Couple Control of Rock Mass Blasting for High Rock Slopes. Int. J. Rock Mech. Min. Sci. 2018, 103, 137–144. [Google Scholar] [CrossRef]
- Sun, L.; Tang, X.; Abdelaziz, A.; Liu, Q.; Grasselli, G. Stability Analysis of Reservoir Slopes Under Fluctuating Water Levels Using the Combined Finite-Discrete Element Method. Acta Geotech. 2023, 18, 5403–5426. [Google Scholar] [CrossRef]
- Park, D.-S.; Shin, M.-B.; Park, W.-J.; Seo, Y.-K. Slope Stability Analysis Model for the Frost-Susceptible Soil Based on Thermal-Hydro-Mechanical Coupling. Comput. Geotech. 2023, 163, 105715. [Google Scholar] [CrossRef]
- Wang, J.; Guo, J. Risk Pre-Control Mechanism of Mines Based on Evidence-Based Safety Management and Safety Big Data. Environ. Sci. Pollut. Res. 2023, 30, 111165–111181. [Google Scholar] [CrossRef] [PubMed]
- Pallardy, Q.; Fox, N.I. Accounting for Rainfall Evaporation Using Dual-Polarization Radar and Mesoscale Model Data. J. Hydrol. 2018, 557, 573–588. [Google Scholar] [CrossRef]
- Reder, A.; Rianna, G.; Pagano, L. Physically Based Approaches Incorporating Evaporation for Early Warning Predictions of Rainfall-Induced Landslides. Nat. Hazards Earth Syst. Sci. 2018, 18, 613–631. [Google Scholar] [CrossRef]
- Ng, C.W.W.; Peprah-Manu, D. Pore Structure Effects on the Water Retention Behaviour of a Compacted Silty Sand Soil Subjected to Drying-Wetting Cycles. Eng. Geol. 2023, 313, 106963. [Google Scholar] [CrossRef]
- Tang, C.-S.; Cheng, Q.; Gong, X.; Shi, B.; Inyang, H.I. Investigation on Microstructure Evolution of Clayey Soils: A Review Focusing on Wetting/Drying Process. J. Rock Mech. Geotech. Eng. 2023, 15, 269–284. [Google Scholar] [CrossRef]
- Jing, J.; Hou, J.; Sun, W.; Chen, G.; Ma, Y.; Ji, G. Study on Influencing Factors of Unsaturated Loess Slope Stability Under Dry-Wet Cycle Conditions. J. Hydrol. 2022, 612, 128187. [Google Scholar] [CrossRef]
- Chen, X.; Jing, X.; Li, X.; Chen, J.; Ma, Q.; Liu, X. Slope Crack Propagation Law and Numerical Simulation of Expansive Soil Under Wetting-Drying Cycles. Sustainability 2023, 15, 5655. [Google Scholar] [CrossRef]
- Zhang, H.; Yang, J.; Wang, L.; Xu, Y.; Lan, S.; Luo, J.; Chang, Z. Experimental and Numerical Investigation on Failure Mechanism of Expansive Soil Subgrade Slope. Sci. Rep. 2023, 13, 19795. [Google Scholar] [CrossRef]
- Xie, C.; Chen, Z.; Xiong, G.; Yang, B.; Shen, J. Study on the Evolutionary Mechanisms Driving Deformation Damage of Dry Tailing Stack Earth-Rock Dam Under Short-Term Extreme Rainfall Conditions. Nat. Hazards 2023, 119, 1913–1939. [Google Scholar] [CrossRef]
- Chengyu, X.; Weihang, L.; Ziwei, C.; Yabin, W. Study on the Infrared Dynamic Evolution Characteristics of Different Joint Inclination Phyllite under Uniaxial Compression. Sci. Rep. 2023, 13, 9867. [Google Scholar] [CrossRef]
- Zhao, Y.; Zhang, H.; Wang, G.; Yang, Y.; Ouyang, M. Development Characteristics and Mechanism of Crack in Expansive Soil Under Wet–Dry Cycling. Appl. Sci. 2024, 14, 6499. [Google Scholar] [CrossRef]
- Jia, J.; Mao, C.; Tenorio, V.O. Slope Stability Considering Multi-Fissure Seepage Under Rainfall Conditions. Sci. Rep. 2024, 14, 11662. [Google Scholar] [CrossRef] [PubMed]
- Li, L.; Qin, A.; Jiang, L.; Wang, L. Simplified Mathematical Modeling to Plane Strain Consolidation Considering Unsaturated and Saturated Conditions for Ground with Anisotropic Permeability. Comput. Geotech. 2023, 154, 105150. [Google Scholar] [CrossRef]
- Shetty, R.; Singh, D.N.; Ferrari, A. Volume Change Characteristics of Fine-Grained Soils Due to Sequential Thermo-Mechanical Stresses. Eng. Geol. 2019, 253, 47–54. [Google Scholar] [CrossRef]
- Li, Y.; Mou, J.; Zhang, S.; Ma, X.; Xiao, C.; Fang, H. Numerical Investigation of Interaction Mechanism Between Hydraulic Fracture and Natural Karst Cave Based on Seepage-Stress-Damage Coupled Model. Energies 2022, 15, 5425. [Google Scholar] [CrossRef]
- Han, X.; Hu, Z.; Li, H.; Yin, Y.; Zhang, B.; Zhang, L. Study on the Mechanical Properties and Microstructural Evolution of Loess Under Different Wet-Dry and Freeze-Thaw Coupled Cycling Paths. Case Stud. Constr. Mater. 2024, 21, e03924. [Google Scholar] [CrossRef]
- Tian, D.; Zheng, H. The Generalized Mohr-Coulomb Failure Criterion. Appl. Sci. 2023, 13, 5405. [Google Scholar] [CrossRef]
- Abbo, A.J.; Sloan, S.W. A Smooth Hyperbolic Approximation to the Mohr-Coulomb Yield Criterion. Comput. Struct. 1995, 54, 427–441. [Google Scholar] [CrossRef]
- Algarni, M.; Choi, Y.; Bai, Y. A Unified Material Model for Multiaxial Ductile Fracture and Extremely Low Cycle Fatigue of Inconel 718. Int. J. Fatigue 2017, 96, 162–177. [Google Scholar] [CrossRef]
- Saneian, M.; Han, P.; Jin, S.; Bai, Y. Fracture Response of Steel Pipelines Under Combined Tension and Torsion. Thin-Walled Struct. 2020, 154, 106870. [Google Scholar] [CrossRef]
- Yang, X.; Dong, J.; Yang, J.; Han, X. Similar Material Proportioning Tests and Mechanical Properties Based on Orthogonal Design. Materials 2023, 16, 6439. [Google Scholar] [CrossRef]
- Mao, Q.; Guo, K.; Zhang, J.; Xiao, G.; Du, J.; Cheng, X.; Guo, H. Response of Granite Residual Soil Slopes Under Dry-Wet Cycles. Front. Earth Sci. 2024, 11, 1333668. [Google Scholar] [CrossRef]
- Zhang, F.; Hu, Z.; Liang, Y.; Li, Q. Evaluation of Surface Crack Development and Soil Damage Based on UAV Images of Coal Mining Areas. Land 2023, 12, 774. [Google Scholar] [CrossRef]
- Chen, J.; Xie, C.; Zhang, W.; Fu, C.; Shen, J.; Yang, B.; Li, H.; Shi, D. Current Status and Outlook of Roadbed Slope Stability Research: Study Based on Knowledge Mapping Bibliometric Network Analysis. Sustainability 2025, 17, 4176. [Google Scholar] [CrossRef]
- Zhao, Y.; Zhang, H.; Wang, G.; Yang, Y.; Tian, W. Analysis of Slope Stability Based on Layered Infiltration Theory Under Wet-Dry Cycle Conditions. KSCE J. Civ. Eng. 2025, 29, 100028. [Google Scholar] [CrossRef]
- Chen, Q.; Yan, E.; Huang, S.; Chen, N.; Xu, H.; Chen, F. Study on Slope Stability of Paleo-Clay Strength Degradation Under Soaking and Wet-Dry Cycles. Water 2025, 17, 172. [Google Scholar] [CrossRef]
- Li, X.; Jiang, Y.; Sugimoto, S. Slope Stability Analysis Under Heavy Rainfall Considering the Heterogeneity of Weathered Layers. Landslides 2024, 22, 1257–1273. [Google Scholar] [CrossRef]


Disclaimer/Publisher’s Note: The statements, opinions and data contained in all publications are solely those of the individual author(s) and contributor(s) and not of MDPI and/or the editor(s). MDPI and/or the editor(s) disclaim responsibility for any injury to people or property resulting from any ideas, methods, instructions or products referred to in the content. |
© 2026 by the authors. Licensee MDPI, Basel, Switzerland. This article is an open access article distributed under the terms and conditions of the Creative Commons Attribution (CC BY) license.