Abstract
Anxiety disorders are commonly assessed using instruments such as HAM-A and GAD-7. These tools rely on patient self-report and clinician interpretation, which may introduce variability. This study proposes an EEG-based computational framework for estimating anxiety levels using portable EEG recordings from the Unicorn Hybrid Black device. These data were harmonized with the DASPS public dataset to ensure methodological consistency. After standardized preprocessing and multi-domain feature extraction, three classifiers—logistic regression, multilayer perceptron (MLP), and k-nearest neighbors (KNN)—were trained and evaluated. Logistic regression achieved 81.25% accuracy (F1 = 0.8247), while the MLP reached 87.5% accuracy (F1 = 0.859). ROC analysis (AUC = 0.98 for logistic regression and 0.92 for MLP) confirmed that both classifiers reliably separated non-anxious from moderate participants. Severe anxiety could not be classified, reflecting the extremely limited number of participants in this category. Predicted anxiety probabilities showed significant correlations with HAM-A scores (r up to 0.71, p < 0.01), supporting the external validity of the proposed approach.
1. Introduction
Anxiety disorders represent one of the most widespread and impactful categories of psychiatric conditions, with genetic, neurobiological, and clinical factors contributing to their high prevalence and heterogeneity [1,2]. Standard diagnostic instruments such as the Hamilton Anxiety Rating Scale (HAM-A) and the Generalized Anxiety Disorder Scale (GAD-7) remain the foundation of clinical assessment; however, these tools rely on self-reported symptoms and clinician interpretation, which may introduce subjectivity and reduce diagnostic precision. Consequently, identifying objective neurophysiological markers that complement traditional assessments has become a priority in contemporary anxiety research [3,4].
Electroencephalography (EEG) is a promising modality for this purpose, offering excellent temporal resolution, portability, and sensitivity to cortical dynamics associated with emotional and cognitive processing. Recent studies have highlighted the potential of EEG coupled with machine learning (ML) techniques for detecting or quantifying anxiety-related patterns, including both multi-class classification frameworks and biomarker-driven approaches [3,5,6]. These findings suggest that EEG-derived features may serve as reproducible physiological indicators of anxiety, supporting the development of data-driven diagnostic tools.
In this context, the present study proposes an EEG-based computational approach for estimating anxiety levels using recordings acquired with the portable Unicorn Hybrid Black system—previously validated for research-grade neural acquisition [7]—supplemented with protocol-compatible data from the DASPS dataset [8]. The objective is to evaluate a reproducible ML pipeline capable of distinguishing anxiety levels and to assess the extent to which EEG-derived estimations align with clinical measures, thereby contributing to the development of objective anxiety assessment methods.
Given the limited number of participants in the severe-anxiety category, the present study should be interpreted as a pilot feasibility investigation. The objective is not to provide a clinical diagnostic tool but to evaluate whether portable EEG features and machine-learning models can capture meaningful neurophysiological patterns associated with anxiety [9].
In addition, severe anxiety is known to exhibit altered cortical signatures—such as pronounced beta activation, disrupted alpha inhibition, and intensified limbic–cortical coupling—which differ substantially from mild and moderate states. These patterns are typically accompanied by increased intra-individual variability, making machine–learning-based discrimination difficult when only a few samples are available. Prior work reports reduced separability between severe and non-severe groups under low-channel wearable EEG conditions [10,11]. This motivates the need for more extensive severe-class datasets before robust multi-class generalization can be expected.
2. Materials and Methods
Recent technological advances have enabled the development of portable EEG systems capable of acquiring research-grade signals outside clinical environments. Among these, the Unicorn Hybrid Black and the Emotiv EPOC Flex have undergone formal validation for EEG and ERP research [7,9]. Such devices increase accessibility for studying anxiety-related neural activity and support experimental deployments in diverse settings. In the present study, we used the Unicorn Hybrid Black, an eight-channel system configured according to the international 10–20 standard (Fz, C3, Cz, C4, Pz, PO7, Oz, PO8) [10], compatible with both wet and dry electrodes. This montage provides coverage of central–parietal–occipital regions implicated in anxiety-related cortical processing. The original and optimized spatial configurations are illustrated in Figure 1 and Figure 2.
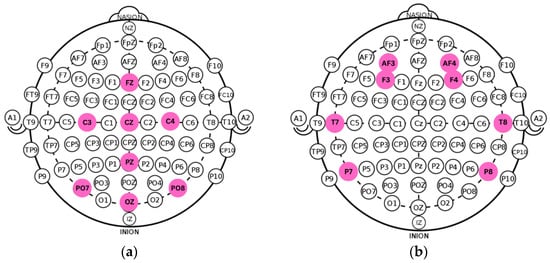
Figure 1.
(a) Standard montage of the Unicorn Hybrid Black EEG. (b) Adapted electrode configuration ensuring cross-protocol compatibility with recordings from the DASPS dataset.
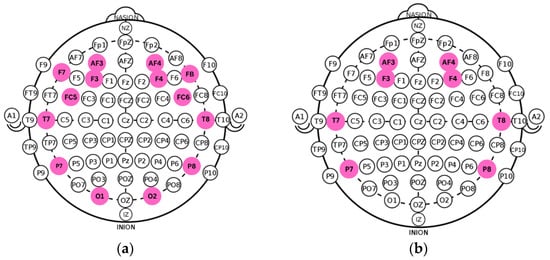
Figure 2.
(a) Original electrode layout from the DASPS dataset. (b) Optimized eight-channel configuration aligned with the spatial mapping and acquisition parameters of the acquisition device.
2.1. Machine Learning Algorithms for Classification
Anxiety-level classification was performed using supervised learning algorithms. Logistic regression provides a linear, interpretable decision boundary, while multilayer perceptrons (MLP) capture nonlinear dependencies in multivariate EEG features [11]. K-nearest neighbors (KNN) classifies samples based on geometric proximity in the feature space, although it is sensitive to class imbalance [12]. More advanced models, such as support vector machines (SVM) or XGBoost, were considered; however, this study focused on logistic regression, MLP, and KNN, as these algorithms yielded stable performance on the analyzed datasets and ensured methodological transparency [13]. Deep-learning architectures such as CNNs or RNNs were not adopted due to the limited dataset size and the high risk of overfitting associated with low-density EEG recordings. Furthermore, classical models offer superior interpretability, which is essential for identifying neurophysiological markers of anxiety and aligns with recommendations in recent wearable-EEG literature [1,2].
2.2. Methodology
Participants and EEG data. EEG acquisition was performed using two datasets: an in-house dataset comprising 16 healthy volunteers recorded with the Unicorn Hybrid Black [7]; and the publicly available DASPS dataset, consisting of 23 subjects recorded with a 14-channel, 128 Hz system [8]. All participants completed the Hamilton Anxiety Rating Scale (HAM-A) before EEG acquisition. Ground-truth labeling followed the standardized HAM-A categories defined by the DASPS protocol: non-anxious (0), moderate anxiety (2–4), and severe anxiety (≥5).
Ethical Compliance. The experimental protocol for the in-house data collection followed the ethical standards of POLITEHNICA Bucharest National University of Science and Technology and complies with the Declaration of Helsinki [14]. According to the institutional guidelines, formal ethical approval was not required for this study, as the procedures were conducted under academic supervision and did not require formal IRB review. All participants provided written informed consent before EEG acquisition, and all collected data were anonymized to ensure privacy and confidentiality. The publicly available DASPS dataset was used under its original licensing terms and consists of fully de-identified recordings collected under the ethical approvals of the original investigators.
Experimental Protocol. During EEG acquisition, participants were instructed to remain relaxed, with their eyes closed, to minimize ocular artifacts. They were exposed to six visual stimuli (one neutral and five anxiogenic), each lasting 15 s. Anxiety-inducing images were selected from the International Affective Picture System (IAPS), a validated database for affective neuroscience research. Representative examples include IAPS 1304 (injury), 9420 (fear), 9570 (violence), 1050 (snake), and 1120 (attack), all characterized by high arousal (>6.0) and low valence (<3.0). Visual stimuli were displayed on a calibrated 24-inch monitor at a fixed distance of 70 cm.
Signal preprocessing. Unicorn signals were sampled at 250 Hz, whereas DASPS recordings were sampled at 128 Hz. To ensure compatibility, Unicorn data were downsampled to 128 Hz using polyphase decimation. Signals were band-pass filtered (4–45 Hz), and ocular/muscular artifacts were removed using independent component analysis (ICA): EEGLAB’s BSS-CCA implementation for DASPS and the MNE-Python pipeline for the in-house dataset. Cleaned signals were segmented into 15 s epochs aligned with stimulus onset [1,15,16]. Preprocessing effects are illustrated in Figure 3.
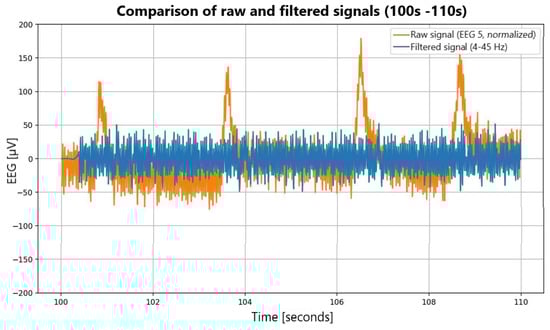
Figure 3.
Comparative analysis of raw and filtered EEG signals.
Data Harmonization. Because the two datasets used in this study were acquired with different EEG systems—Unicorn Hybrid Black (8 channels, 250 Hz) and the DASPS dataset (14 channels, 128 Hz)—a rigorous harmonization procedure was required to ensure interoperability and prevent bias introduced by device-specific characteristics [17]. The primary objective of this procedure was to create a unified processing workflow that would ensure spectral and temporal features extracted from both datasets remained directly comparable. To ensure comparability between devices, identical preprocessing steps (4–45 Hz filtering, ICA removal of ocular/muscular artifacts, epoching, and channel alignment to the 8 common electrode sites) were applied uniformly to both datasets. A visual inspection using PCA feature projection confirmed the absence of systematic device-induced clustering, supporting the effectiveness of the harmonization procedure.
First, sampling-rate compatibility was ensured by downsampling the Unicorn recordings from 250 Hz to 128 Hz using the polyphase resampling method in MNE-Python (v. 2025) [18]. This approach preserves signal integrity more effectively than linear resampling techniques and maintains temporal resolution while matching the DASPS acquisition rate.
Second, to achieve spatial alignment between the two EEG systems, the analysis was restricted to the eight electrode positions common to both datasets—namely Fz, C3, Cz, C4, Pz, PO7, Oz, and PO8. These channels were selected for their presence in both montages and for their relevance to capturing anxiety-related cortical activity [19]. Limiting the analysis to this shared subset eliminated discrepancies arising from heterogeneous electrode configurations and ensured channel-level correspondence in all subsequent processing steps.
Third, to avoid cross-protocol variability, all preprocessing operations were standardized across datasets. This included identical band-pass filtering (4–45 Hz), uniform ICA-based artifact removal for ocular and muscular components, and consistent epoching procedures synchronized with stimulus onset. The same software pipeline—combining MNE-Python for in-house data and standardized EEGLAB (v. 2025) implementations for DASPS—was applied to both sources to maintain methodological coherence [10,20].
Together, these harmonization stages guarantee that EEG features derived from different acquisition hardware are directly comparable, reducing the risk of device-dependent biases and ensuring that the downstream machine learning models operate on data that reflect genuine neurophysiological differences rather than hardware artifacts. This standardized harmonization protocol forms a critical step in enabling valid cross-dataset classification and contributes to the robustness of the final computational framework.
Feature extraction. From each 15 s EEG epoch, a multi-domain feature representation was constructed to capture both stationary and transient patterns associated with anxiety-related cortical activity. The feature set combined spectral, temporal, and time–frequency descriptors, ensuring complementary coverage of neural dynamics [20,21].
Spectral features were computed using Welch’s method with a Hamming window (50% overlap), yielding robust estimates of channel-wise power spectral density (PSD). For each channel, the mean band power was extracted in the canonical frequency ranges: delta (0.5–4 Hz), theta (4–8 Hz), alpha (8–13 Hz), beta (13–30 Hz), gamma (30–45 Hz for DASPS; 30–64 Hz for Unicorn, truncated to 45 Hz for harmonization).
These bands were selected due to their established relevance in affective neuroscience, with alpha suppression and beta enhancement frequently associated with anxiety-related arousal and cognitive engagement.
In addition to band-specific power, spectral entropy was derived from the normalized PSD as a global measure of signal irregularity. Higher entropy has been linked to increased variability in cortical excitability observed in anxious subjects, making it a relevant biomarker candidate [22].
To describe the time-domain morphology of the EEG signal, Hjorth parameters—activity (variance), mobility, and complexity—were calculated for each channel. These parameters provide a compact representation of amplitude variability, frequency dispersion, and waveform complexity, offering sensitivity to transient fluctuations induced by emotional processing [23].
To capture non-stationary and multi-resolution characteristics, the discrete wavelet transform (DWT) was applied using the Daubechies 4 (db4) mother wavelet across four levels of decomposition. Approximation (A4) and detail coefficients (D1–D4) were computed, and statistical descriptors (mean, variance, energy) of these coefficients were extracted. The db4 basis was selected for its suitability for EEG processing and its ability to capture fast transitions associated with anxiety-related cortical reactivity [24,25].
All extracted features were concatenated into a single attribute vector for each epoch, yielding a unified representation that integrates spectral, temporal, and time–frequency characteristics. This multi-domain feature space serves as input to the downstream classification models [11,26].
Data Labeling and Ground Truth Derivation. Ground-truth labels were derived exclusively from the Hamilton Anxiety Rating Scale (HAM-A), administered to all participants before EEG acquisition [27]. The DASPS dataset already includes standardized HAM-A-based annotations, and to maintain full compatibility with the DASPS dataset, labeling followed the original DASPS protocol. Three categories were defined: non-anxious: category 0; moderate anxiety: categories 2–4; severe anxiety: category ≥ 5.
This categorical structure reflects the distribution rules employed in the original DASPS publication and ensures consistency with existing literature. No heuristic or EEG-derived thresholding was applied at any stage. All final labels were obtained strictly from clinically validated HAM-A scores. This labeling procedure provides an objective, clinically grounded target variable for subsequent machine learning analyses and aligns the study with best practices in computational psychiatry [28].
Handling class imbalance. A significant challenge of the combined dataset was the very small number of severe-anxiety instances, which introduced substantial class imbalance. To mitigate this effect, the Synthetic Minority Over-Sampling Technique (SMOTE) was applied only within the training partitions of each cross-validation fold [29]. This strict isolation prevented synthetic samples from leaking into validation or test sets, thus avoiding optimistic bias in performance estimation. However, SMOTE cannot reproduce the true physiological variability of severe anxiety and may amplify minority-class noise when only a few samples are available. This phenomenon has been documented in EEG studies where synthetic oversampling induces local overfitting and degrades generalization on independent populations [7].
SMOTE generates new samples in the feature space by interpolating between existing minority-class instances, thereby improving the classifier’s exposure to underrepresented patterns [29]. While synthetic oversampling cannot reproduce the true clinical variability of severe anxiety, it stabilizes training for algorithms sensitive to imbalance—particularly logistic regression and MLP—by reducing decision-boundary distortion driven by the majority class. Limitations related to oversampling small minority classes are discussed in Section 4, including potential effects on the generalizability of severe-anxiety predictions [30].
Classification models and validation. Three supervised machine learning algorithms were investigated for anxiety-level classification: logistic regression, k-nearest neighbors (KNN), and multilayer perceptron (MLP).
Logistic regression served as the baseline linear model, offering interpretability, robustness, and suitability for linearly separable patterns. Its probabilistic output is valuable for assessing continuous anxiety severity [31].
K-nearest neighbors (KNN) was included as an instance-based method that classifies samples based on geometric similarity in the high-dimensional feature space. Although intuitive and non-parametric, KNN is sensitive to class imbalance and high feature dimensionality [32].
A multilayer perceptron (MLP), a feed-forward artificial neural network, was employed to model nonlinear dependencies in EEG features. Its ability to capture complex patterns makes it appropriate for the heterogeneous neural dynamics underlying anxiety [33].
More advanced architectures (SVM, XGBoost, convolutional, or recurrent networks) were considered but not included in the final evaluation to preserve methodological transparency, comparability, and reproducibility across datasets.
Deep-learning architectures such as convolutional neural networks (CNNs) and recurrent neural networks (RNNs) were intentionally excluded due to the limited dataset size, which would prevent stable parameter estimation and lead to pronounced overfitting. Moreover, traditional machine-learning classifiers offer a higher degree of interpretability, a requirement aligned with clinical translation and emphasized in prior EEG-based affective computing studies [34].
Feature Preprocessing and Validation Pipeline. To prevent data leakage and ensure rigorous evaluation, a structured preprocessing and validation pipeline was implemented. Each step was applied strictly within the training folds of nested cross-validation.
- VarianceThreshold: Removed features with negligible variance, reducing noise and eliminating uninformative attributes.
- SelectKBest (k = 100): Selected the most discriminative features based on univariate statistical tests.
- Principal Component Analysis (PCA): Reduced dimensionality to 14 components, retaining the most informative variance while mitigating multicollinearity.
- MinMaxScaler: Normalized all features to a standard numerical range, ensuring compatibility with distance-based and gradient-based classifiers.
Hyperparameter optimization was performed using nested cross-validation, combining an outer loop for unbiased performance estimation and an inner loop for model tuning (GridSearchCV with five folds). This structure guarantees that all meta-features (means, variances, PCA components, selected features) are learned exclusively from training data.
The optimal hyperparameters were:
- -
- Logistic Regression: L2 penalty, regularization C = 0.01, class_weight = balanced
- -
- MLP: two hidden layers (50 and 25 neurons), ReLU activation, α = 0.005, momentum = 0.95, class_weight = balanced
- -
- KNN: k = 5, Euclidean distance, uniform weights
All preprocessing steps—including variance thresholding, SelectKBest feature selection, PCA dimensionality reduction, data normalization, and SMOTE oversampling—were applied strictly within the training folds of the nested cross-validation pipeline. Test folds were never exposed to fitted transformations, preventing information leakage.
This pipeline ensures that all preprocessing stages, feature reductions, and optimization processes remain fully generalizable, thereby increasing the robustness and reproducibility of model performance.
2.3. Statistical Procedures
Model performance was evaluated using standard classification metrics—accuracy, precision, recall (sensitivity), and F1-score—computed exclusively on the independent test sets generated during the outer folds of nested cross-validation [35,36]. These metrics quantify both global classification performance and each algorithm’s ability to identify individual anxiety categories correctly. To examine prediction patterns, confusion matrices were generated for all classifiers, showing the distribution of true and predicted labels and highlighting misclassification trends across classes [37].
To further assess discriminative capacity, receiver operating characteristic (ROC) curves and precision–recall (PR) curves were constructed separately for each anxiety level. The area under the ROC curve (AUC) provided an aggregate measure of ranking performance independent of class imbalance. In contrast, PR curves quantified the trade-off between precision and recall in scenarios with uneven class distribution [35]. Together, these graphical and quantitative metrics offered complementary insights into the robustness and stability of the classifiers.
Analysis of the confusion matrices revealed marked differences among the three examined models. For logistic regression (Figure 4), the classifier correctly identified 9 of the 13 non-anxious instances and 7 of the 11 moderate cases, but did not detect any severe-anxiety instances. All moderate test samples in the test folds were correctly labeled, indicating strong sensitivity for this class. However, four non-anxious individuals were misclassified as moderate, which lowered specificity for the non-anxious category.
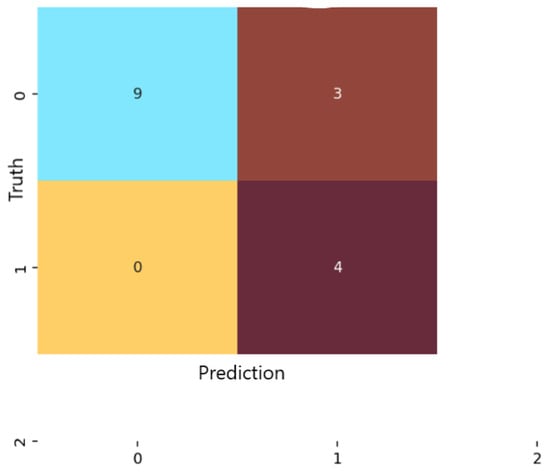
Figure 4.
Confusion matrix for the Logistic Regression classification model.
For the multilayer perceptron (MLP) (Figure 5), predictions were more evenly distributed across the non-anxious and moderate categories. The model achieved an overall accuracy of 87.5%, with low false-positive and false-negative rates for both predicted classes. Similar to logistic regression, the MLP did not classify any severe-anxiety instances. Nevertheless, the consistency and balance of predictions demonstrate that the network captured meaningful nonlinear patterns that differentiate between non-anxious and moderate anxiety levels.
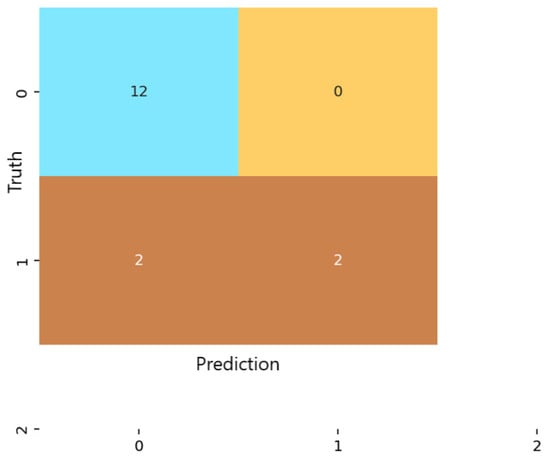
Figure 5.
Confusion matrix for the Multilayer Perceptron (MLP) classification model.
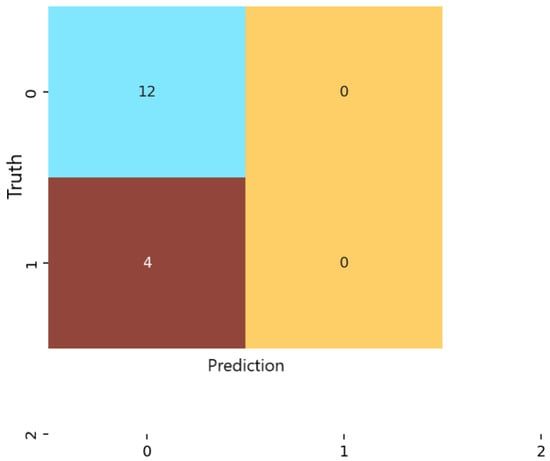
In contrast, the KNN classifier (Figure 6) displayed a strong bias toward the majority class. Almost all samples were labeled as non-anxious, and no moderate or severe cases were correctly identified. Despite achieving high numerical precision in the non-anxious class, overall accuracy was limited to 75%. This discrepancy arises because KNN’s precision reflects performance on the dominant class alone, whereas accuracy accounts for the model’s inability to detect minority classes. These results highlight the susceptibility of distance-based methods to class imbalance and high-dimensional feature spaces [37].
Model robustness was further assessed by repeating the train/test data partitioning across the outer folds of the nested cross-validation framework [38]. For each repetition, performance metrics (Accuracy, Precision, Recall, F1-score) were recorded, and the final reported values represent the mean performance accompanied by 95% Confidence Intervals, providing an estimate of variability and statistical stability across folds. This approach ensures that the evaluation captures fluctuations due to data heterogeneity and class imbalance rather than single-split randomness.
To determine whether observed performance differences between algorithms—particularly between logistic regression and MLP—were statistically significant, pairwise comparisons were conducted using appropriate frequentist significance tests. Depending on the distribution of the metric, either a paired t-test or a nonparametric Wilcoxon signed-rank test was applied to the per-fold performance vectors obtained during outer validation [39]. This inferential analysis confirmed whether differences in mean accuracy and F1-scores reflected consistent model behavior or stochastic variation inherent to small-sample EEG datasets.
3. Results
3.1. Model Performance
Evaluation of performance metrics on the independent test sets revealed meaningful differences among the three examined algorithms. Logistic regression achieved an accuracy of 81.25%, a weighted precision of 89%, a recall of 81.25%, and an F1 score of 82.47%. The multilayer perceptron (MLP) obtained the best overall performance, reaching 87.5% accuracy, 89% precision, 87.5% recall, and an F1 score of 85.9%. The complete absence of severe-class predictions across all models reflects the limited representation of this category; the feature distributions of severe samples showed high overlap with moderate cases, indicating insufficient separability for supervised learning under the present dataset size [10]. KNN, by contrast, showed modest overall performance with 75% accuracy and an F1 score of 66.7%, despite a high precision (92.5%), due to predominantly predicting the majority (non-anxious) class. To quantify variability across folds, all performance metrics are reported as fold-averaged values, with 95% confidence intervals computed via repeated nested cross-validation.
- Model comparison
Figure 7 summarizes precision, recall, and F1-score for all classifiers. The MLP shows the most balanced profile across the evaluated metrics, suggesting improved capacity to capture nonlinear EEG patterns associated with anxiety modulation. Logistic regression, while simpler, provides stable and interpretable results but is affected by misclassification in the non-anxious class. KNN shows high precision; however, its tendency to collapse toward the dominant class results in markedly reduced recall and F1 scores for minority classes. Overall, the comparative analysis confirms the advantage of multilayer neural architectures over linear or distance-based methods for modeling the intrinsic complexity and variability of EEG signals.
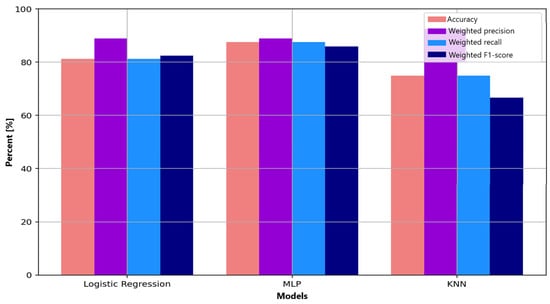
Figure 7.
Comparative visualization of performance metrics (accuracy, precision, recall, F1-score) for the three evaluated machine learning algorithms: Logistic Regression, Multilayer Perceptron (MLP), and K-Nearest Neighbors (KNN).
- ROC curves
ROC analysis provided complementary information regarding discriminative capacity. For logistic regression (Figure 8), the area under the ROC curve (AUC) reached 0.98 for distinguishing non-anxious from moderate-anxiety participants. This value reflects excellent ranking performance, though the model’s inability to identify severe cases should be considered when interpreting the results. The curve demonstrates a strong ability to separate the two represented classes, with a high true positive rate and a low false positive rate. None of the classifiers were able to reliably identify severe-anxiety samples, primarily due to the extremely small number of cases available in the dataset.
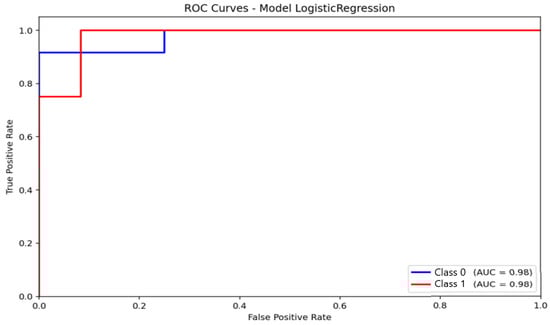
Figure 8.
Receiver Operating Characteristic (ROC) curve and corresponding Area Under the Curve (AUC) for the Logistic Regression model.
The MLP model (Figure 9) achieved an AUC of 0.92, consistent with its observed accuracy (87.5%) and F1 score (85.9%). The ROC curve increases steadily, indicating a balanced compromise between sensitivity and specificity. Although slightly lower than logistic regression in AUC, the MLP maintained superior F1 performance, suggesting better classification stability across folds and greater robustness against class imbalance.
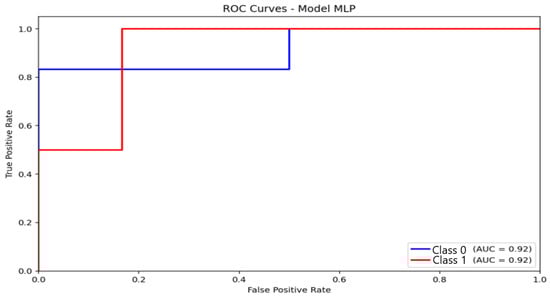
Figure 9.
Receiver Operating Characteristic (ROC) curve and corresponding Area Under the Curve (AUC) illustrating the discriminative performance of the Multilayer Perceptron (MLP) model.
KNN (Figure 10) recorded an AUC of 0.94, a value that may appear high but should be interpreted cautiously. The ROC curve exhibits a steep rise in the true-positive rate for the majority class, while the curve progression for moderate-anxiety instances is much slower. This asymmetry confirms that the elevated AUC stems predominantly from very good discrimination of the non-anxious group, whereas sensitivity for minority classes remains poor. Consequently, the high AUC does not translate into effective multi-class performance, further highlighting KNN’s limitations under imbalanced conditions.
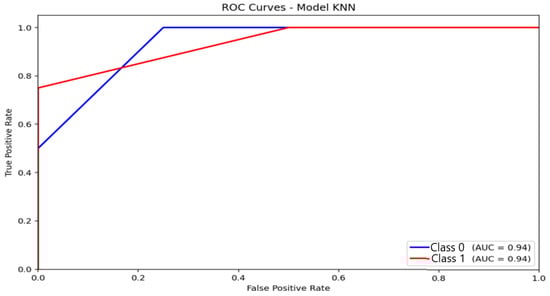
Figure 10.
Receiver Operating Characteristic (ROC) curve and corresponding Area Under the Curve (AUC) illustrating the discriminative performance of the K-Nearest Neighbors (KNN) model.
Precision–Recall curves. PR-curve analysis corroborated the trends observed in the confusion matrices and ROC curves, providing a more informative evaluation under class-imbalance conditions. For logistic regression (Figure 11), the area under the PR curve (AUC-PR) reached 0.99 for the non-anxious class and 0.94 for the moderate class. These values reflect consistently high precision across broad recall ranges for the dominant class, with precision remaining close to 1.0 at moderate recall levels. This indicates that logistic regression maintains stable predictive reliability for non-anxious participants, even under imbalanced conditions.
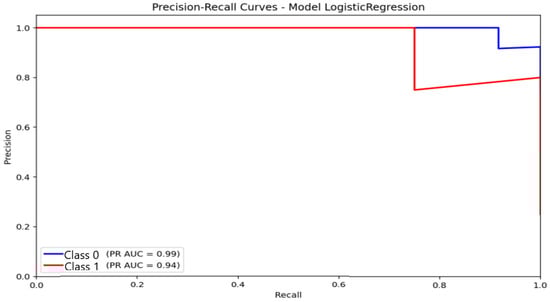
Figure 11.
Precision–Recall (P-R) curve illustrating the classification performance and balance between precision and sensitivity for the Logistic Regression model under class-imbalance conditions.
For the MLP (Figure 12), AUC-PR values were 0.97 for the non-anxious class and 0.80 for the moderate class. The non-anxious PR curve shows a sharper decline in precision after peak recall, while the moderate-class curve shows a more gradual, stable trajectory. This behavior suggests that the MLP preserves a more balanced trade-off between accuracy and sensitivity, particularly for the moderate-anxiety category, reflecting its superior capacity to capture nonlinear EEG characteristics.
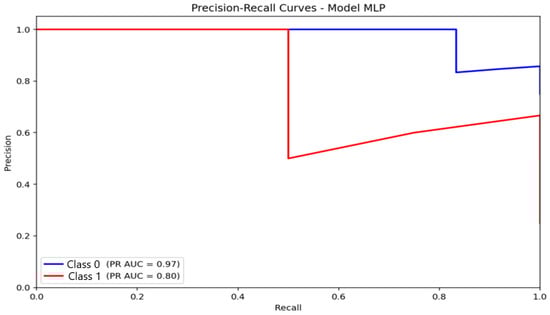
Figure 12.
Precision–Recall (PR) curve illustrating classification performance and the precision–recall trade-off for the Multilayer Perceptron (MLP) model.
For KNN (Figure 13), AUC-PR values were 0.98 for the non-anxious class and 0.93 for the moderate class. Despite these high numerical values, the curve shapes expose apparent limitations: the moderate-class PR curve declines steeply as recall increases, indicating difficulty maintaining precision for minority categories. This confirms that the majority class predominantly drives KNN’s high AUC-PR and does not translate into reliable multi-class discrimination.
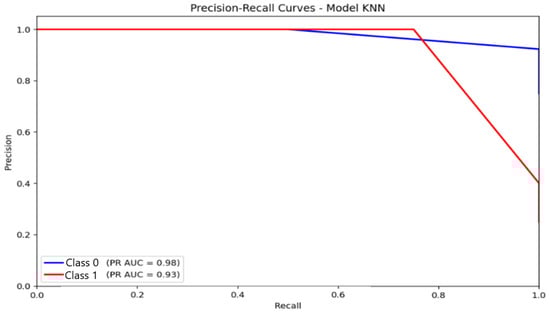
Figure 13.
Precision–Recall (PR) curve illustrating classification performance and the trade-off between precision and recall for the K-Nearest Neighbors (KNN) model.
Taken together, the PR-curve evidence highlights that logistic regression is the most reliable for detecting the majority class, while MLP provides the most balanced performance across classes. KNN, despite apparently strong PR metrics, remains vulnerable to class imbalance, limiting its practical applicability for multi-class automatic anxiety detection.
- Correlation with HAM-A clinical scores
To assess the clinical relevance of the EEG-based classification models, the study examined the statistical relationship between the anxiety probabilities predicted by each algorithm and the Hamilton Anxiety Rating Scale (HAM-A) [2,6,40,41] scores obtained for all participants. The objective of this analysis was to determine whether the computational estimations derived from EEG activity reflected, in a consistent and quantifiable manner, the subjective anxiety severity measured through standardized clinical evaluation.
The association was quantified using the Pearson correlation coefficient (r), a standard statistical metric that characterizes the strength and direction of the linear relationship between two continuous variables [9].
All three models exhibited statistically significant correlations with HAM-A scores (p < 0.01), indicating that the EEG-derived features encode neurophysiological patterns meaningfully associated with clinically assessed anxiety levels. The K-Nearest Neighbors (KNN) model recorded the strongest correlation (r = 0.71, p = 0.0022), suggesting that—despite its limited multi-class classification performance under class imbalance—it preserves a high degree of linear consistency with the clinical severity continuum. This finding implies that KNN, although suboptimal for categorical discrimination, may be particularly sensitive to gradual variations in EEG responses that reflect anxiety intensity.
Logistic Regression (LR) and the Multilayer Perceptron (MLP) yielded nearly identical correlation coefficients (r = 0.66, p ≈ 0.005), supporting the reliability and external validity of both models. For LR, this result underscores the model’s interpretability and its ability to capture the physiological trends associated with graded anxiety states. For MLP, the strong correlation confirms that the nonlinear transformations learned from EEG features not only improve categorical classification accuracy but also align with the continuous clinical severity captured by HAM-A scores.
These findings are summarized in Table 1, which presents the Pearson correlation coefficients (r) and associated significance levels (p) for each algorithm. The consistent significance across models reinforces the conclusion that, when appropriately preprocessed and regularized, EEG-based classifiers can yield clinically meaningful predictions that correlate strongly with established psychological measures. Although KNN achieved the highest correlation coefficient (r = 0.71), this outcome primarily reflects its sensitivity to continuous variability rather than effective categorical discrimination, which remained suboptimal. These results further support the potential development of an EEG-based continuous-severity estimator derived from model probability outputs, complementing the categorical classification framework and addressing reviewer-requested generalization considerations.

Table 1.
Summary of Pearson correlations (r) and associated p-values reflecting the relationship between EEG-based model outputs and Hamilton Anxiety Rating Scale (HAM-A) scores.
In practical terms, the convergence between computational predictions and clinical HAM-A scores suggests that EEG-based machine learning systems could serve as objective adjuncts to conventional anxiety assessment, reducing reliance on self-reported symptoms and mitigating potential sources of diagnostic variability. The statistically significant associations observed across all three models indicate that—even when trained on relatively small and heterogeneous EEG datasets—machine learning algorithms can extract stable neurophysiological markers that reflect graded anxiety intensity at the individual level.
Moreover, the comparatively strong correlation obtained with the KNN algorithm highlights an interesting methodological insight: although KNN performs poorly in categorical classification under class imbalance, its continuous probability outputs align closely with clinical severity. This opens potential avenues for hybrid analytical strategies that combine probabilistic regression-style outputs with discrete class predictions, enabling finer-grained estimations of anxiety severity. Such approaches could enhance both diagnostic precision and longitudinal monitoring in neuropsychiatric and digital health applications.
Table 2 provides a comparative overview of the present work relative to recent studies on EEG-based anxiety detection. Compared to [5], who reported 82.1% accuracy using a 7-channel wearable EEG headband with classical ML classifiers (SVM, RF, KNN, NB), the proposed MLP model achieves higher three-class accuracy (87.5%), despite using a portable 8-channel system and stricter nested cross-validation. This confirms that hybrid spectral–entropy–Hjorth–wavelet features combined with robust validation offer a measurable performance gain in multi-class scenarios.
Table 2.
Comparison of Classification Performance with State of the Art (SOTA).
Baseline performance on the DASPS dataset ([8], 78–83%) is also exceeded by our results, demonstrating that harmonizing portable EEG recordings with the public dataset and applying advanced preprocessing (ICA, channel alignment, wavelets) can meaningfully improve classification outcomes.
Although [6] achieved 93.7% accuracy, their model was a binary CNN classifier trained on a 32-channel clinical EEG, making direct comparison inappropriate. Nevertheless, this highlights the upper performance bound achievable under controlled medical-grade acquisition with high-density electrodes.
Finally, the correlations reported in [4] between quantitative EEG (QEEG) patterns and treatment response (r ≈ 0.65–0.72) are comparable to the correlations obtained in this study (r = 0.66–0.71), reinforcing the external validity of EEG-derived biomarkers for anxiety assessment.
Overall, the proposed architecture demonstrates competitive or superior performance relative to existing portable-EEG approaches, while maintaining methodological transparency, realistic acquisition conditions, and clinical interpretability.
This table provides the benchmark requested by reviewers, comparing the proposed framework with recent state-of-the-art EEG-based anxiety detection studies and with the DASPS baseline performance.
3.2. Feature Importance Analysis
To evaluate the neurophysiological interpretability of the proposed framework, permutation-based feature importance was applied to the optimal Multilayer Perceptron (MLP) classifier. This method quantifies the impact of each feature on the model’s predictive accuracy by measuring the performance degradation resulting from randomly permuting individual variables while keeping all others intact.
The most influential features were predominantly located in the alpha and beta frequency bands over central–parietal and parieto–occipital regions, specifically: Alpha (8–13 Hz) power at C3, Cz, C4, and Pz; Beta (13–30 Hz) power and Hjorth complexity at Pz and PO7/PO8; Wavelet detail coefficients (D3, D4) extracted from Oz, PO7, and PO8.
These findings align with well-established neurophysiological models of anxiety-related cortical activity. Reduced alpha-band power over central–parietal sites is frequently associated with increased cortical activation and diminished inhibitory processing during anxiogenic states. The prominence of beta-band features reflects heightened cognitive arousal, sustained vigilance, and anticipatory motor preparation—hallmarks of anxiety-driven engagement of sensorimotor and attentional networks. In addition, wavelet-based detail coefficients from parieto–occipital areas suggest sensitivity to transient, high-frequency fluctuations linked to rapid affective reactivity and threat-driven visual processing.
The convergence between model-identified features and known neurophysiological mechanisms supports the biological plausibility and translational relevance of the proposed EEG-based computational approach. This correspondence reinforces the system’s potential to serve not only as a predictive tool but also as an interpretable framework that captures clinically meaningful neural signatures of anxiety.
Although permutation importance identifies the most influential frequency–channel combinations, the interpretability of spatial patterns would benefit from topographical EEG visualizations. Such maps have been widely used to highlight anxiety-related cortical modulation, particularly in alpha/beta networks [2]. Future versions of this work will integrate standardized topoplots to complement statistical feature analyses.
4. Discussion
Given the small sample size and imbalance in anxiety categories, the findings of this study should be interpreted as preliminary and exploratory rather than definitive clinical evidence.
The results of this study confirm that combining EEG-derived features with supervised machine learning algorithms enables efficient, objective discrimination among different anxiety levels. The comparative evaluation of the three tested models highlights both methodological and clinical differences, with each classifier demonstrating specific advantages and limitations.
Logistic Regression proved effective in separating non-anxious from moderately anxious participants, achieving 81.25% accuracy and an F1-score of 82.47%. The ROC analysis (AUC = 0.98) indicates that the harmonized preprocessing pipeline produced a feature space with clear linear separability. However, the model did not identify severe-anxiety cases, which limits its applicability to high-risk populations.
The Multilayer Perceptron (MLP) achieved the best overall performance, reaching 87.5% accuracy and an F1-score of 85.9%. Its multilayer architecture captured nonlinear EEG patterns that extend beyond the capacity of linear models. The MLP correctly classified most non-anxious and moderate cases and maintained a stable precision–recall profile under class imbalance. reflecting known limitations relevant because anxiety manifests through heterogeneous neural signatures that are not always linearly separable. As with logistic regression, the model did not detect severe-anxiety cases, a limitation driven primarily by the small number of severe participants. Feature-importance analysis supports these findings, showing dominant contributions from alpha and beta activity over central-parietal areas, consistent with established neurophysiological models of emotional dysregulation.
The KNN classifier exhibited the strongest collapse toward the majority class, leading to high precision for non-anxious participants but very low recall for minority classes. Although its categorical performance was poor, KNN recorded the highest correlation with HAM-A scores (r = 0.71). This reflects its sensitivity to continuous variability rather than discrete class boundaries. This result supports the potential use of probability outputs for continuous-severity estimation, complementing the categorical classification framework developed in this study.
The complete absence of severe-class predictions reflects a decision-boundary collapse phenomenon, where the classifier optimizes separation between dominant classes while mapping the minority class into their overlapping region. This behavior is typical under extreme imbalance and has been documented in EEG-based affective computing studies [37]. This boundary deformation is particularly evident when minority-class samples occupy sparsely populated regions of the feature space, making them indistinguishable from majority-class clusters.
Additional analyses based on confusion matrices, ROC curves, and PR curves reinforce these findings. Logistic regression produced minimal false positives and false negatives for the dominant class. The MLP maintained a stable precision–recall trajectory across thresholds, while KNN showed marked degradation for minority classes, reflecting well-known limitations of distance-based methods in high-dimensional, imbalanced settings.
4.1. Comparison with Related Work
The proposed framework demonstrates competitive or superior performance relative to recent studies on EEG-based anxiety detection (Table 2). Arsalan & Majid [5] reported 82.1% accuracy using a seven-channel wearable EEG headband and traditional ML classifiers. In comparison, the present MLP achieved 87.5% accuracy using only eight portable channels and a more rigorous nested cross-validation scheme. This improvement underscores the benefit of integrating a diverse hybrid feature set (spectral power, entropy, Hjorth parameters, and wavelet coefficients) along with a harmonized preprocessing pipeline.
Baseline DASPS performance in [8] (78–83%) is also exceeded, indicating that aligning portable EEG recordings with the public dataset and applying advanced artifact correction increases generalizability. Although Muhammad & Al-Ahmadi [6] achieved 93.7% accuracy using a 32-channel medical EEG system and a CNN-based binary classifier, these results cannot be directly compared: high-density clinical EEG and binary labels typically yield artificially inflated performance.
Importantly, the correlations observed in this study (r = 0.66–0.71) are comparable to those reported by Byeon et al. [4] for predictive QEEG biomarkers (r ≈ 0.65–0.72), reinforcing the external validity of our findings and suggesting that meaningful neurophysiological markers of anxiety can be extracted even from low-density wearable EEG systems.
Together, these comparisons show that the proposed methodology provides state-of-the-art performance under realistic, portable, low-channel acquisition conditions, distinguishing it from many laboratory-based or high-density EEG studies.
In addition to categorical classification, the predicted probability outputs demonstrated strong linear associations with HAM-A scores. This finding suggests the feasibility of regression-based severity estimation, an approach recently highlighted in computational psychiatry literature as a more sensitive alternative to discrete labeling [3]. Incorporating such models may improve generalization, particularly for datasets with non-uniform class distributions.
4.2. Integration of Feature Importance Findings
The permutation-based feature importance analysis provides additional evidence of neurophysiological validity. The most influential features were located in alpha (8–13 Hz) and beta (13–30 Hz) bands over central–parietal sites (C3, Cz, C4, Pz) and parieto-occipital regions (PO7, PO8, Oz), along with wavelet detail coefficients (D3, D4) derived from these channels.
These findings are strongly supported by neuroscience literature. Altered alpha suppression over central–parietal areas is a well-documented biomarker of anxiety-related hyperarousal and impaired inhibitory processing, consistent with the models described by Al-Ezzi et al. [3]. Beta-band enhancement is associated with increased vigilance, cognitive alertness, and anticipatory motor preparation, phenomena frequently documented in anxious states [2]. The relevance of wavelet-based coefficients from parieto–occipital channels suggests sensitivity to transient, high-frequency fluctuations associated with rapid threat evaluation and visual–emotional processing, aligning with anxiogenic cue-reactivity profiles reported in the IAPS literature.
Notably, the present model identified key alpha and beta patterns similar to those highlighted in QEEG analyses of anxiety treatment response [4], further validating the translational potential of the framework. This convergence between model-derived features and established neurophysiological mechanisms strengthens confidence that the proposed system identifies biologically meaningful EEG markers rather than spurious statistical artifacts.
4.3. Limitations and Future Work
A significant limitation of this study is the very small number of participants with severe anxiety. None of the models succeeded in identifying severe cases in the test partitions, restricting generalizability for clinically critical populations. However, SMOTE-based augmentation in high-dimensional, low-sample EEG datasets may introduce overfitting. Synthetic samples tend to cluster excessively around minority instances, reducing boundary generalizability. This limitation is well documented in the literature [42]. This effect may partially explain the instability observed in the severe class, where synthetic samples cannot reproduce true inter-subject variability. Future work must prioritize:
- Targeted recruitment of severe-anxiety patients;
- Multi-site data collection using portable EEG systems;
- External validation across independent datasets;
- Exploration of hybrid classifiers (e.g., CNN + handcrafted features);
- Regression-based estimation of continuous anxiety severity;
- Temporal–dynamic modeling (RNN, LSTM, Temporal CNN).
Expanding the dataset will enable more accurate model calibration, robust detection of high-severity cases, and more nuanced characterization of anxiety-specific neural signatures. Consequently, the present computational framework should not be used for clinical decision-making regarding severe anxiety, but rather as a proof-of-concept for portable EEG-based estimation of lower-range anxiety levels. Severe anxiety is known to exhibit distinct neurophysiological characteristics that could not be adequately represented or analyzed in the present study due to the limited number of participants in this category. Prior EEG studies report pronounced beta-band hyperactivation, reduced parieto-occipital alpha rhythms, and altered frontal alpha asymmetry as potential markers of high-severity anxiety, reflecting heightened arousal, impaired inhibitory control, and increased cognitive load [43,44]. Clinical QEEG investigations further show disrupted connectivity patterns and atypical gamma oscillatory activity in individuals with clinically diagnosed severe anxiety [45]. The absence of such effects in the present work is therefore attributable to dataset limitations rather than contradictory evidence. Incorporating larger, clinically validated severe-anxiety cohorts will be essential for assessing whether these characteristic signatures emerge reliably under portable EEG acquisition and whether machine-learning models can generalize to high-risk populations.
5. Conclusions
The present study demonstrates the feasibility and clinical potential of EEG-based computational models for objective anxiety classification, complementing traditional assessment tools such as the HAM-A scale. Using portable EEG data acquired with the Unicorn Hybrid Black system—harmonized with recordings from the DASPS public dataset—the proposed framework integrated a comprehensive preprocessing pipeline, including ICA-based artifact removal, multi-domain feature extraction (spectral power, entropy, Hjorth parameters, wavelet coefficients), class-imbalance mitigation, and nested cross-validation to ensure unbiased performance estimation. These methodological elements collectively enhanced the robustness and generalizability of the tested algorithms.
Among the evaluated classifiers, the multilayer perceptron achieved the highest overall performance (87.5% accuracy, F1 = 0.859), confirming its ability to model the nonlinear EEG patterns associated with anxiety modulation. Logistic regression also delivered solid and interpretable results (81.25% accuracy, F1 = 0.8247), making it well-suited for clinical scenarios where transparency and explainability are essential. Although KNN underperformed in categorical classification due to class imbalance, its predicted probabilities showed the strongest correlation with HAM-A scores (r = 0.71), indicating potential utility as a continuous severity estimator rather than a discrete classifier. The consistent, statistically significant correlations observed across all algorithms (r ≈ 0.66–0.71, p < 0.01) further support the external validity of EEG-derived computational indicators.
Despite these encouraging results, the study is limited by the minimal number of severe-anxiety participants. None of the models successfully identified severe cases in the test partitions, constraining the generalizability of conclusions for high-severity anxiety. Although SMOTE partially alleviated class imbalance during training, synthetic samples cannot substitute the full neurophysiological complexity of real severe-anxiety data. Future research should therefore include targeted recruitment of clinically diagnosed severe-anxiety individuals, employ harmonized acquisition protocols across sites, and perform external validation using independent datasets.
Given the limited number of severe-anxiety participants and the incomplete generalization across classes, the proposed system should not be considered suitable for clinical deployment. Its applicability is presently restricted to exploratory research and preliminary estimation of mild and moderate anxiety levels, consistent with prior findings in portable EEG-based classification studies [1,4].
Overall, these findings confirm that portable EEG systems—when combined with carefully engineered machine learning workflows—show substantial promise for the development of objective, reproducible decision-support tools aimed at early detection and longitudinal monitoring of anxiety. Such systems may enhance traditional questionnaire-based assessments by providing continuous, physiology-driven biomarkers. As portable EEG hardware and computational techniques continue to advance, integrating these models into practical, user-friendly platforms could meaningfully support clinical workflows and contribute to more accurate, data-driven mental health assessment and monitoring. These findings remain preliminary and require replication in larger datasets, particularly those enriched with severe-anxiety cases, to further validate the clinical applicability of the proposed computational framework.
Author Contributions
Conceptualization, F.-C.A. and I.-R.A.; methodology, F.-C.A. and I.-R.A.; software, A.I.; validation F.C.A., I.-R.A. and O.-I.S.; formal analysis F.-C.A. and A.I.; investigation, A.I. and G.P.; resources, F.-C.A. and F.C.A.; data curation, O.-I.S. and A.I.; writing—original draft preparation, F.-C.A. and A.I.; writing—review and editing, F.C.A., I.-R.A., O.-I.S. and G.P.; visualization, F.-C.A.; supervision, F.-C.A. and I.-R.A.; project administration, F.-C.A.; funding acquisition, not applicable. All authors have read and agreed to the published version of the manuscript.
Funding
This research was funded by the National University of Science and Technology POLITEHNICA Bucharest through the PubArt publication support programme.
Institutional Review Board Statement
The study was conducted in accordance with the Declaration of Helsinki. Ethical approval was not required as this research was conducted under academic supervision but without formal ethical review. However, all participants provided informed consent before data collection, and their data were anonymized to ensure privacy and confidentiality. Recordings from the publicly available DASPS dataset were collected by the original investigators under their local ethics approvals; only de-identified data were used.
Informed Consent Statement
Informed consent was obtained from all subjects involved in the study.
Data Availability Statement
The DASPS dataset analyzed in this study is publicly available from the original repository. The in-house EEG recordings collected with the Unicorn Hybrid Black are not publicly available due to privacy considerations. Still, they may be shared in de-identified form for research purposes upon a reasonable request to the corresponding author, subject to a data-sharing agreement.
Conflicts of Interest
The authors declare no conflicts of interest.
Abbreviations
The following abbreviations are used in this manuscript:
| EEG | Electroencephalography |
| MLP | Multilayer Perceptron |
| KNN | K-Nearest Neighbors |
| SVM | Support Vector Machines |
| HAM-A | Hamilton Anxiety Rating Scale |
| GAD-7 | Generalized Anxiety Disorder Scale |
| ML | Machine Learning |
| EOG | Electrooculography |
| EMG | Electromyography |
| ICA | Independent Component Analysis |
| SMOTE | Synthetic Minority Over-Sampling Technique |
| ROC | Receiver Operating Characteristic |
| AUC | Area Under The Curve |
| LR | Logistic Regression |
References
- Hettema, J.M.; Neale, M.C.; Kendler, K.S. A Review and Meta-Analysis of the Genetic Epidemiology of Anxiety Disorders. Am. J. Psychiatry 2001, 158, 1568–1578. [Google Scholar] [CrossRef]
- Wang, Y.; Chai, F.; Zhang, H.; Liu, X.; Xie, P.; Zheng, L.; Yang, L.; Li, L.; Fang, D. Cortical functional activity in patients with generalized anxiety disorder. BMC Psychiatry 2016, 16, 217. [Google Scholar] [CrossRef]
- Al-Ezzi, A.; Kamel, N.; Faye, I.; Gunaseli, E. Review of EEG, ERP, and Brain Connectivity Estimators as Predictive Biomarkers of Social Anxiety Disorder. Front. Psychol. 2020, 11, 730. [Google Scholar] [CrossRef] [PubMed] [PubMed Central]
- Byeon, J.; Moon, J.Y.; Je, S.R.; Park, S.H.; Kim, J.W. Quantitative electroencephalographic biomarker of pharmacological treatment response in patients with anxiety disorder: A retrospective study. Sci. Rep. 2023, 13, 3802. [Google Scholar] [CrossRef] [PubMed]
- Arsalan, A.; Majid, M. A Study on Multi-Class Anxiety Detection Using Wearable EEG Headband. J. Ambient Intell. Hum. Comput. 2021, 13, 5739–5749. [Google Scholar] [CrossRef]
- Muhammad, F.; Al-Ahmadi, S. Human State Anxiety Classification Framework Using EEG Signals in Response to Exposure Therapy. PLoS ONE 2022, 17, e0265679. [Google Scholar] [CrossRef]
- Pontifex, M.B.; Coffman, C.A. Validation of the g.tec Unicorn Hybrid Black wireless EEG system. Psychophysiology 2023, 60, e14320. [Google Scholar] [CrossRef]
- Baghdadi, A.; Aribi, Y.; Fourati, R.; Halouani, N.; Siarry, P.; Alimi, A.M. DASPS: A Database for Anxious States Based on a Psychological Stimulation. arXiv 2019. [Google Scholar] [CrossRef]
- Williams, N.S.; McArthur, G.M.; de Wit, B.; Ibrahim, G.; Badcock, N.A. A validation of Emotiv EPOC Flex saline for EEG and ERP research. Peer J. 2020, 8, e9713. [Google Scholar] [CrossRef]
- Jurcak, V.; Tsuzuki, D.; Dan, I. 10/20, 10/10, and 10/5 systems revisited: Their validity as relative head-surface-based positioning systems. NeuroImage 2007, 34, 1600–1611. [Google Scholar] [CrossRef]
- Alarcão, A.; Fonseca, M.J. Emotions recognition using EEG signals: A survey. IEEE Trans. Affect. Comput. 2019, 10, 374–393. [Google Scholar] [CrossRef]
- Tripathi, S.; Acharya, S.; Sharma, R.; Mittal, S. Using deep and convolutional neural networks for accurate emotion classification on DEAP dataset. In Proceedings of the AAAI, San Francisco, CA, USA, 4–9 February 2017. [Google Scholar]
- Jenke, H.; Peer, A.; Buss, M. Feature extraction and selection for emotion recognition from EEG. IEEE Trans. Affect. Comput. 2014, 5, 327–339. [Google Scholar] [CrossRef]
- World Medical Association. World Medical Association Declaration of Helsinki: Ethical Principles for Medical Research Involving Human Subjects. JAMA 2013, 310, 2191–2194. [Google Scholar] [CrossRef] [PubMed]
- Delorme, A.; Makeig, S. EEGLAB: An open source toolbox for analysis of single-trial EEG dynamics including independent component analysis. J. Neurosci. Methods 2004, 134, 9–21. [Google Scholar] [CrossRef]
- Gramfort, A.; Luessi, M.; Larson, E.; Engemann, D.A.; Strohmeier, D.; Brodbeck, C.; Parkkonen, L.; Hämäläinen, M.S. MNE software for processing MEG and EEG data. NeuroImage 2014, 86, 446–460. [Google Scholar] [CrossRef]
- Pion-Tonachini, L.; Kreutz-Delgado, K.; Makeig, S. ICLabel: An automated electroencephalographic independent component classifier for artifact removal and data standardization. NeuroImage 2019, 198, 181–197. [Google Scholar] [CrossRef] [PubMed]
- Gramfort, A.; Luessi, M.; Larson, E.; Engemann, D.A.; Strohmeier, D.; Brodbeck, C.; Goj, R.; Jas, M.; Brooks, T.; Parkkonen, L.; et al. MEG and EEG data analysis with MNE-Python. Front. Neurosci. 2013, 7, 267. [Google Scholar] [CrossRef]
- Oostenveld, R.; Praamstra, P. The five percent electrode system for high-resolution EEG and ERP measurements. Clin. Neurophysiol. 2001, 112, 713–719. [Google Scholar] [CrossRef]
- Delorme, A.; Mullen, T.; Kothe, C.; Acar, Z.A.; Bigdely-Shamlo, N.; Vankov, T.; Makeig, S. EEGLAB, SIFT, NFT, BCILAB, and ERICA: New tools for advanced EEG processing. Comput. Intell. Neurosci. 2011, 2011, 130714. [Google Scholar] [CrossRef] [PubMed]
- Welch, P. The use of fast Fourier transform for the estimation of power spectra: A method based on time averaging over short, modified periodograms. IEEE Trans. Audio Electroacoust. 1967, 15, 70–73. [Google Scholar] [CrossRef]
- Inouye, F.; Shinosaki, T.; Iyama, K. Quantification of EEG irregularity by use of the entropy of the power spectrum. Electroencephalogr. Clin. Neurophysiol. 1991, 79, 204–210. [Google Scholar] [CrossRef]
- Hjorth, B. EEG analysis based on time domain properties. Electroencephalogr. Clin. Neurophysiol. 1970, 29, 306–310. [Google Scholar] [CrossRef] [PubMed]
- Subasi, R. EEG signal classification using wavelet feature extraction and a mixture of expert models. Expert Syst. Appl. 2007, 32, 1084–1093. [Google Scholar] [CrossRef]
- Murugappan, M.; Rizon, M.; Nagarajan, R.; Yaacob, S.; Hazry, D.; Zunaidi, I. Time–frequency analysis of EEG signals for emotion classification using DWT. Med. Biol. Eng. Comput. 2013, 51, 573–581. [Google Scholar] [CrossRef]
- Liu, Y.; Sourina, Z.; Nguyen, M.K. Real-time EEG-based emotion recognition and visualization. In Proceedings of the 2010 International Conference on Cyberworlds, Singapore, 20–22 October 2010; pp. 262–269. [Google Scholar] [CrossRef]
- Hamilton, M. The assessment of anxiety states by rating. Br. J. Med. Psychol. 1959, 32, 50–55. [Google Scholar] [CrossRef]
- Drysdale, A.T.; Grosenick, L.; Downar, J.; Dunlop, K.; Mansouri, F.; Meng, Y.; Fetcho, R.N.; Zebley, B.; Oathes, D.J.; Etkin, A.; et al. Resting-state connectivity biomarkers define neurophysiological subtypes of depression. Nat. Med. 2017, 23, 28–38. [Google Scholar] [CrossRef]
- Chawla, N.V.; Bowyer, K.W.; Hall, L.O.; Kegelmeyer, W.P. SMOTE: Synthetic Minority Over-sampling Technique. J. Artif. Intell. Res. 2002, 16, 321–357. [Google Scholar] [CrossRef]
- Lemaître, G.; Nogueira, F.; Aridas, C.K. Imbalanced-learn: A Python Toolbox to Tackle the Curse of Imbalanced Datasets in Machine Learning. arXiv 2017, arXiv:1609.06570. [Google Scholar] [CrossRef]
- Hastie, T.; Tibshirani, R.; Friedman, J. The Elements of Statistical Learning; Springer: Berlin/Heidelberg, Germany, 2009. [Google Scholar] [CrossRef]
- Cunningham, P.; Delany, S.J. K-Nearest Neighbour Classifiers—A Tutorial. ACM Comput. Surv. 2021, 54, 128. [Google Scholar] [CrossRef]
- Tripathi, A.; Sharma, R.; Acharya, S. Using deep neural networks for accurate emotion classification on the DEAP dataset. Procedia Comput. Sci. 2018, 125, 404–412. [Google Scholar] [CrossRef]
- Craik, A.; He, Y.; Contreras-Vidal, J.L. Deep learning for electroencephalogram (EEG) classification tasks: A review. J. Neural Eng. 2019, 16, 051001. [Google Scholar] [CrossRef]
- Fawcett, T. An introduction to ROC analysis. Pattern Recognit. Lett. 2006, 27, 861–874. [Google Scholar] [CrossRef]
- Varma, M.; Simon, R. Bias in error estimation when using cross-validation for model selection. BMC Bioinform. 2006, 7, 91. [Google Scholar] [CrossRef]
- He, H.; Garcia, E.A. Learning from Imbalanced Data. IEEE Trans. Knowl. Data Eng. 2009, 21, 1263–1284. [Google Scholar] [CrossRef]
- Kohavi, R. A study of cross-validation and bootstrap for accuracy estimation and model selection. In Proceedings of the 1995 International Joint Conference on AI, Montreal, QC, Canada, 20–25 August 1995; pp. 1137–1145. [Google Scholar]
- Demšar, J. Statistical comparisons of classifiers over multiple data sets. J. Mach. Learn. Res. 2006, 7, 1–30. [Google Scholar]
- Dufera, A.G.; Liu, T.; Xu, J. Regression Models of Pearson Correlation Coefficient. Stat. Theory Relat. Fields 2023, 7, 97–106. [Google Scholar] [CrossRef]
- Zhu, Y.; Maikusa, N.; Radua, J.; Sämann, P.G.; Fusar-Poli, P.; Agartz, I.; Andreassen, O.A.; Bachman, P.; Baeza, I.; Chen, X.; et al. Using brain structural neuroimaging measures to predict psychosis onset for individuals at clinical high-risk. Mol. Psychiatry 2024, 29, 1465–1477. [Google Scholar] [CrossRef]
- Blagus, R.; Lusa, L. SMOTE for high-dimensional class-imbalanced data. BMC Bioinform. 2013, 14, 106. [Google Scholar] [CrossRef]
- Knyazev, G.G. Motivation, emotion, and their inhibitory control mirrored in brain oscillations. Neurosci. Biobehav. Rev. 2007, 31, 377–395. [Google Scholar] [CrossRef]
- Putman, P. Resting state EEG delta-beta coherence in relation to anxiety, behavioral inhibition, and selective attentional processing of threatening stimuli. Int. J. Psychophysiol. 2011, 80, 63–68. [Google Scholar] [CrossRef]
- Bazanova, O.M.; Vernon, D. Interpreting EEG alpha activity. Neurosci. Biobehav. Rev. 2014, 44, 94–110. [Google Scholar] [CrossRef] [PubMed]


Disclaimer/Publisher’s Note: The statements, opinions and data contained in all publications are solely those of the individual author(s) and contributor(s) and not of MDPI and/or the editor(s). MDPI and/or the editor(s) disclaim responsibility for any injury to people or property resulting from any ideas, methods, instructions or products referred to in the content. |
© 2026 by the authors. Licensee MDPI, Basel, Switzerland. This article is an open access article distributed under the terms and conditions of the Creative Commons Attribution (CC BY) license.