Abstract
The combined finite–discrete element method (FDEM) is an advanced numerical calculation method that is highly suitable for simulating the entire rock blasting process. Considering that rock mass contains many joints, the present study introduces a rock joint constitutive model to capture the transmission and reflection phenomena of blasting stress waves when they reach the joint. At the same time, based on the original FDEM code, an optimized blasting calculation model is proposed. This model considers the effect of explosive gas and accurately describes the physical relationship between the explosive gas pressure and the change in the blasting chamber area caused by crack propagation. To overcome the limitation of previous blasting models that only apply the pressure of the explosive gas to the borehole wall, the present study optimizes the determination conditions for crack penetration and the calculation method for the blasting chamber area as well as further considered the influence of the embedding effect of explosive gas on crack propagation. Finally, through three examples, the transmission and reflection laws of stress waves at the joints and the entire process of rock mass throw blasting are simulated. The results illustrate that this model can capture the propagation of stress waves, the gas wedge effect of explosive gas, and the entire process of crack initiation, propagation, and penetration in the rock mass during the explosion, demonstrating the potential of FDEM in blasting simulation.
1. Introduction
At present, the simulation methods for rock blasting fragmentation can be classified into three major categories [1,2,3]: continuous simulation methods based on continuum mechanics (FEM, BEM, etc.), discontinuous methods based on Newtonian mechanics (DDA, DEM, etc.), and coupled continuous–discontinuous simulation methods (SPH-FEM, FDEM, etc.). Continuous simulation methods, due to their inherent numerical stability in calculation, usually take less computing time than the other two methods; they are stable and can achieve good simulation results for far-field blasting (Figure 1), but they lack a quantitative description of the generation or propagation of cracks during blasting. The advantage of discontinuous simulation methods is that they can provide a better phenomenological effect in simulating blasting [4,5,6], but their disadvantage is that the computing time is much longer than that of continuous medium simulation methods. The stability and accuracy of the mechanical indicators obtained are not ideal, especially in terms of stress, velocity, and acceleration time histories. This method has obvious advantages in simulating blasting fragmentation and crack propagation (Figure 2), but its accuracy largely depends on the sizes of the elements or blocks and the setting of contact parameters.
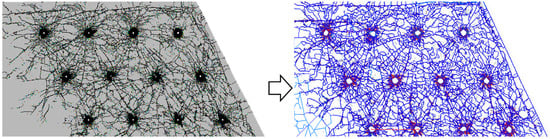
Figure 1.
Simulation effect of blasting fragmentation based on continuous medium methods.
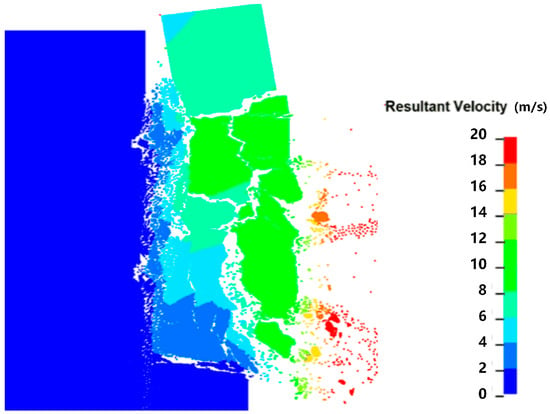
Figure 2.
Simulation of bench blasting fragmentation based on discontinuous medium method.
Both continuous and discontinuous numerical simulation methods have inadequacies when simulating the entire blasting process. Combining the advantages of both methods to establish a coupled discontinuous–continuous simulation method is a significant research goal. There are two main strategies for establishing this type of method. The first is coupling one method of the mature discontinuous methods with one of the continuous methods: Saiang [7] coupled Particle Flow Code (PFC) and Fast Lagrangian Analysis of Continua (FLAC) to study the spatial distribution characteristics of blasting excavation damage and the mechanisms of parameter deterioration [8]. The second is establishing a new calculation method: Feng et al. [9] used the Continuum Discontinuum Element Method (CDEM) to simulate the three-dimensional bench blasting process in open-pit mines; Yan et al. [10] proposed a fracture simulation method in rock mass that can consider explosive-gas-driven crack propagation based on FDEM; Ren et al. [11] used CDEM to simulate rock foundation pit blasting and conducted the comparative analysis of indicators such as average fragmentation size, maximum fragmentation size, large block rate, and system fragmentation degree. This type of method combines the advantages of continuous and discontinuous simulation methods and is becoming essential for rock blasting fragmentation simulation [12].
The FDEM designed by Munjiza [13] establishes a bridge between continuous and discontinuous methods and is an excellent method for dealing with continuous–discontinuous problems, although the method has a high computational requirement, tending to limit the scale and temporal accuracy of the model. However, it is still an excellent solution for the simulation of the entire process of rock blasting. This study employs an in-house FDEM code, which was developed by the authors’ team and has been widely applied in the field of dynamics such as rock fracture and earthquake-induced landslides [2,14,15,16]. The main improvements of this code are as follows: (1) incorporating viscoelastic boundary conditions, free-field boundary conditions, and static–dynamic unified boundary conditions; (2) enhancing the energy dissipation mechanism by introducing local damping technology and simplifying the collision energy dissipation mechanism to implement the code; (3) establishing static and dynamic strength reduction methods considering tensile failure; (4) integrating the dynamic calculation module to facilitate the application of dynamic loads.
This study aims to establish a numerical simulation framework suitable for the entire blasting process of jointed rock masses by improving the FDEM, with a focus on addressing the insufficiencies in the simulation of stress wave propagation in joints and the inaccurate depiction of the mechanism of explosive gas action of existing models. The structure of the present study is as follows: Section 1 introduces the mainstream numerical simulation methods in blasting engineering and the current status of the application of FDEM; Section 2 briefly introduces the basic principle of FDEM. In order to realize the simulation of the entire process of blasting in the jointed rock mass, Section 3 improves the source code of the original FDEM, which mainly introduces the rock joint constitutive model and reproduces the transmission and reflection phenomena when the blasting stress wave is transmitted to the joint; Section 4 introduces a new blasting calculation model, which can take into account the dynamic effect of the explosive gas on the rock mass. Section 5, through two examples, proves that the improved FDEM proposed in this paper depicts the attenuation law of the stress wave in jointed rock masses and accurately describes the entire blasting process caused by the effects of the dual mechanisms of blast stress wave and the explosive gas. The conclusions are given in Section 6.
2. The Basic Principle of FDEM and Its Improvement in Blasting
2.1. Governing Equation
The dynamic equation of the whole system of FDEM is solved in the same way as that of DEM, that is, according to Newton’s second law. At the beginning of each step, the second-order difference method is used to solve the motion equation to obtain the velocity and displacement of nodes and update the coordinates of nodes. Thus, the governing equation can be written as
where C and M are the diagonal damping matrices and lumped mass of the system, respectively; x is the vector of the nodal coordinates; and Fint, Fext, Fc represent the internal resisting forces, external loads and contact forces, respectively. In order to simulate the dissipation of kinetic energy in the dynamic process, damping force is often considered in the dynamic relaxation method. Otherwise, stress wave oscillation will occur during the simulation process, which will cause the results to deviate seriously from reality. Therefore, the damping matrix in FDEM is expressed as follows:
where μ is the viscous damping coefficient, and I is the unit matrix.
2.2. Fracture Model of the Joint Element
The constitutive relationship of the joint elements plays a significant role in crack propagation. In FDEM, material failure is simulated by a combined single and smeared crack model [17]. There are three types of fracture modes, namely, model I (tensile failure), model II (shear failure), and model I–II (tensile-shear failure).
- (1)
- For Model I failure (Figure 3a), the whole stress-strain curve can be divided into three stages: (1) the compression stage, where the compressive stress has a linear elastic relationship with the compression opening; (2) the strain-hardening stage (elastic stage), where the relationship between tension opening and tensile stress is fitted by a parabolic equation, which passes through the origin. When the tension opening is op, the tensile stress reaches its maximum value ft; (3) In the strain-softening stage (yield stage), the tensile stress is also nonlinearly related to the tension opening, Munjiza et al. [17] adopted the functional expression proposed by Evans and Marathe to express it. The joint element breaks and a tension crack is generated when the integration of stress and opening (fill area) reaches GfI (Mode I energy release rate) at maximum opening or.
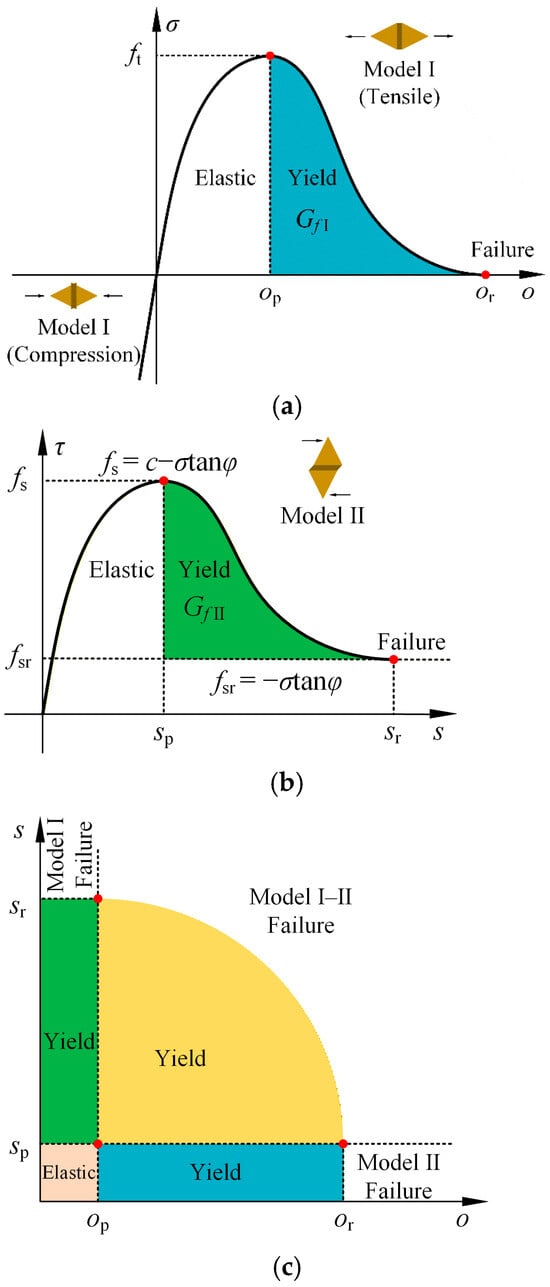 Figure 3. Constitutive models of the joint element: (a) Model I; (b) Model II; (c) Model I–II [14].
 - (2)
- For Model II failure (Figure 3b), in FDEM, shear failure may occur in the joint elements, namely, model II failure, similar to the failure process in Model I. Before the tangential slipping reaches a critical value sp, the stress-strain relationship conforms to the parabolic equation. The maximum shear stress corresponding to sp is the shear strength of the joint element, which can be obtained by the Mohr-Coulomb criterion: fs = c − σtanφ, where c is the cohesion, φ is the internal friction angle, and σ is the normal stress on the joint. As tangential slipping continues to increase, the strain-softening stage is governed by GfII (Mode II energy release rate), and the maximum tangential slipping is sr. When tangential slipping is greater than sr, the joint element breaks, and a shear crack is generated. After that, the shear stress remains constant and equals the residual shear strength: fsr = −σtanφ.
- (3)
- For mixed Model I–II failure (Figure 3c), in addition to the Model I and Model II, the mixed Model I–II may occur when the tension opening and the tangential slipping are less than or and sr, respectively. Therefore, it is necessary to analyze the initiation and propagation of this kind of crack based on mixed model I–II failure. When the following conditions are met, Model I-II failure occurs:
3. Constitutive Law of the Actual Joint in FDEM
Section 2.2 describes the failure process of the joint elements in detail, but it should be noted that these joint elements inserted between each triangular element are not the real joints: they provide possible paths for material fracture after reaching a certain displacement. Therefore, the characterization of the real joints in FDEM is significant. At present, the characterization of the structural planes (fault, joint, fracture, and weak layer) in FDEM is shown in Figure 4. The solid element thickness includes a triangle element and a joint element, which are often used in the simulation of the underlying weak layer. The joint element with zero thickness is used to simulate the real joint only by redefining and changing parameters. According to the bonding and filling states of real joints, the joint element with zero thickness can be divided into a rigid structural plane and a weak structural plane. The rigid structural plane is considered the joint element that has been damaged, while the weak structural plane is considered intact, and its parameter value depends on the situation of the real joint. Thus, the weak structure plane is more suitable for this article.
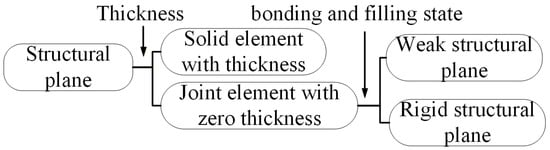
Figure 4.
Characterization of the structural planes in FDEM [14].
The existing constitutive model of the joint element in FDEM is the relationship between force and displacement. The elasticity, yield, failure, and other stages of the joint element are judged by the magnitude of displacement (strain), but this method does not consider the effect of normal stress on the shear strength, and the existing and verified constitutive models (such as the linear elastic model [18] and Bandis–Barton model [19]) of the real joint cannot be used for the wave propagation problems. Therefore, real joint constitutive models, in which the failure criterion is based on stress, were introduced into FDEM, s detailed in Section 5.1.
4. Simulation of Blasting Process Considering Explosive Gas
Many studies [20,21,22] have shown that the failure of rock mass results from the dual effects of stress waves and explosive gas. The gas collaborates with shock waves to complete the fragmentation, ejection, and movement of the rock mass, playing a role throughout the entire blasting process. However, almost all mature commercial software [23] cannot accurately depict the entire effect of explosive gas on rock fragmentation and the evolution of cracks. Yan et al. [10] proposed a calculation model for explosive gas in FDEM, but the calculation of the blast chamber area is cumbersome, affecting the application of FDEM in practical engineering. Ning et al. [20] adopted the DDA method for simulation, but this method cannot describe the process of rock mass transitioning from continuous to discontinuous. Yuan et al. [22] improved the fracture retrieval algorithm based on the PFC method, but the mechanical index stability and accuracy of this method are poor [16].
As mentioned above, FDEM is an advanced numerical calculation method highly suitable for simulating the entire blasting process. However, the original FDEM must be optimized to simulate the blasting process fully. This study improved the single-hole blasting simulation method proposed by Yan et al. [10], simplified the calculation process of the blast chamber area to facilitate the consideration of the group-hole blasting conditions, and further extended this method to more application scenarios.
Figure 5 shows a cross-sectional schematic diagram of the expansion of the blast chamber in FDEM during rock blasting. R0 is the initial radius of the blast hole; R is the diffusion radius of the explosive gas in the crack at time t, R = vp·t, where vp is the diffusion velocity of the gas. Here, it is assumed that the explosive gas is ideal and diffuses outward uniformly and at a constant speed. The blast chamber area is calculated based on the following assumptions: the triangular elements are relatively rigid, the area generated by their mutual embedding is ignored, and the area of the triangular elements on the gas diffusion line is calculated as half. The final blast chamber area is shown in Equation (4), which is approximately equal to the area after gas diffusion minus the initial area and the area of the triangular elements.
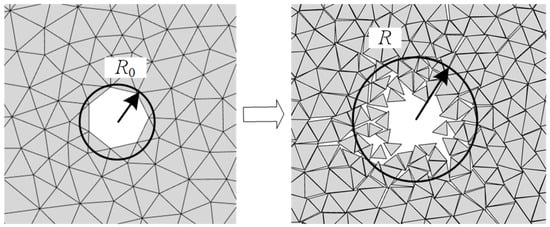
Figure 5.
Schematic diagram of explosive gas diffusion area.
After determining the total area occupied by the explosive gas, the current pressure of the explosive gas is determined based on the ratio of the existing area to the initial area of the explosive gas. The instantaneous pressure of the blast chamber is determined using the exponential explosion pressure state equation shown in Equation (5) [20]. Then, the gas pressure is applied to all the fracture boundaries connected to the blast chamber. The pressure is applied uniformly on their outer boundaries for isolated blocks surrounded by explosive gas.
Here, P and P0 represent the current and initial pressures of the explosion gas, respectively, while S and S0 represent the current and initial areas of the blast chamber. γ is a constant related to the properties of the explosive and rock.
5. Simulation of the Entire Blasting Process of Jointed Rock Mass
5.1. Normally Incident P-Wave Propagation Across a Single Joint with Linearly Normal Deformational Behavior
This example incorporated the actual joint constitutive model (linear model) into FDEM and compared the P-wave velocities before and after attenuation through the joint to verify the accuracy of this model.
Schoenberg et al. [18] and Pyrak-Nolte et al. [24] used the displacement discontinuity model to deduce the transmission and reflection coefficients of normally incident simple harmonic P-wave propagation across a single linearly deformational joint as
where |Tlin| and |Rlin| are the transmission and reflection coefficients for a single linearly deformational joint, kn is the normal joint stiffness, ω is the angular frequency of the incident wave, and zp is the P-wave impedance, which is equal to the product of rock density and P-wave velocity.
The numerical model of the stress wave propagation across the joint is assumed to be fully elastic as shown in Figure 6. Point O is the origin of the coordinates. The model is 300 m long and 1 m wide, and the joint is located in the middle part. A half-sinusoidal P-wave with a frequency of 20 Hz and a peak velocity of 1 m/s is normally applied at the left end of the model. Absorbing boundaries are placed at the left and right ends to avoid wave reflections from the boundaries. Due to a normally incident P-wave, displacements in the y-direction of the upper and lower boundaries are restricted, and the x-direction is free. Incident, reflected, and transmitted waves are obtained from the velocity histories of monitoring points A (75, 0.5) and B (225, 0.5). The present study focuses on the effect of the joints on the propagation of stress waves and does not consider the attenuation caused by rock materials. Normal joint stiffness is varied from 5 × 10⁷ to 5 × 10⁹ Pa/m to achieve different normalized normal stiffness varying from 0.049 to 4.989. The magnitude of the transmission (reflection) coefficient is defined as the ratio of transmitted (reflected) wave peak velocity to incident wave peak velocity.
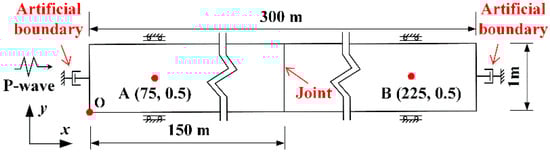
Figure 6.
The numerical model of P-wave propagation across a linearly (nonlinearly) deformational joint (not to scale).
The velocity histories at measurement points A and B for P-wave propagation across a single linearly deformational joint with different normal joint stiffnesses are presented in Figure 7a,b. The transmission coefficients assessed by FDEM and the theoretical expression of the P-wave with different normal joint stiffnesses are presented in Figure 8. According to above figures, we can ee that the transmission coefficients assessed by FDEM agree well with the results from the analytical solution.
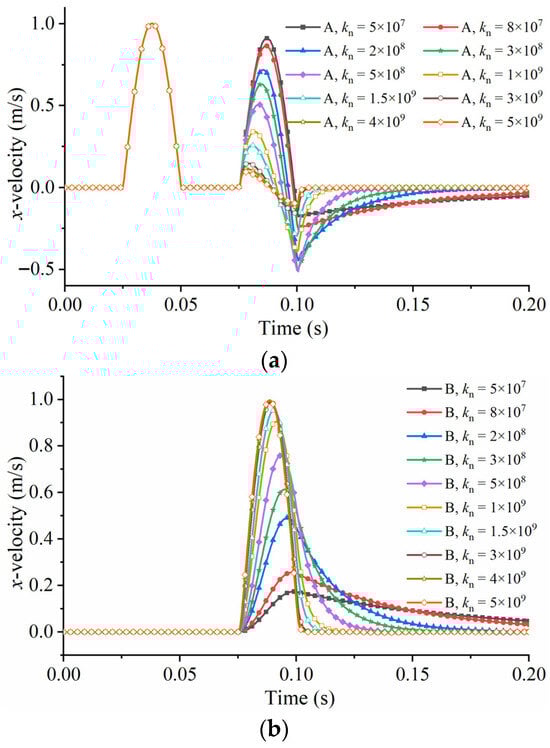
Figure 7.
The velocity histories at points A (a) and B (b) for P-wave propagation through a single joint with different normal joint stiffnesses.
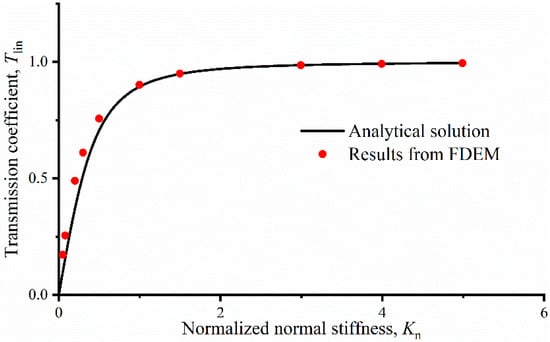
Figure 8.
The modeling results of FDEM and analytical solution of P-wave propagation through a single joint.
5.2. Small-Hole Blasting with Two Joint Sets
In the previous section, the transmission and reflection phenomena of stress waves in the jointed rock mass were perfectly reproduced with the improved FDEM. However, during the blasting process, rocks often undergo severe damage. This section will study the influence of joints on the propagation of blasting cracks using a small-hole blasting example.
As shown in Figure 9, in this example, two joint sets are arranged, with each joint set spaced 2.5 m apart. The two joint sets form a 2.5 m × 2.5 m intact rock core area. The cohesion, friction coefficient, and FDEM-specific parameters (GfI, GfII, etc.) of the joints are taken as 1/10 of the parameters of the intact rock, so that the joints are more prone to damage than intact rock.
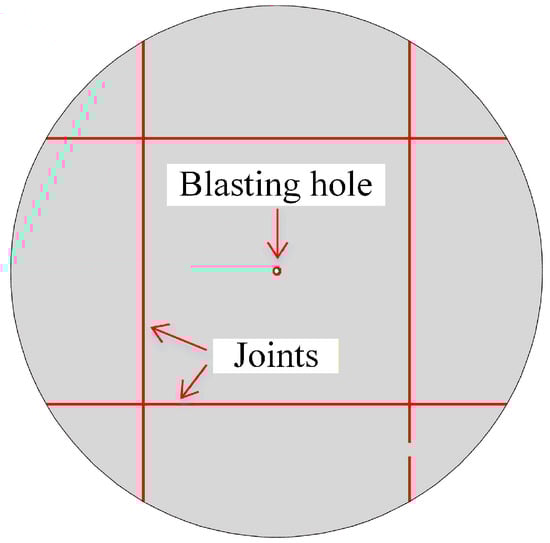
Figure 9.
Schematic diagram of the small-hole blasting joint layout model.
Figure 10 shows the entire process of crack propagation in the intact (Figure 10a) and joint (Figure 10b) conditions. In the initial stage of the intact rock condition, the crack rapidly spreads from the explosion center in all directions. As the distance increases, the energy of the stress wave weakens and the crack propagation density decreases, eventually developing into a scattered pattern. The initial stage of the joint condition is consistent with that of the intact condition, with the crack rapidly forming and spreading outward. The stress wave reaches the joint before the crack, and the joint, having a lower strength, subsequently fractures. The cracks extending from the explosion center are concentrated in the area surrounded by the joint, indicating that the joint attenuates most of the shock wave energy. This observation is consistent with the conclusion obtained by M. Lanari and A. Fakhimi in Smoothed Particle Hydrodynamics (SPH) [25].
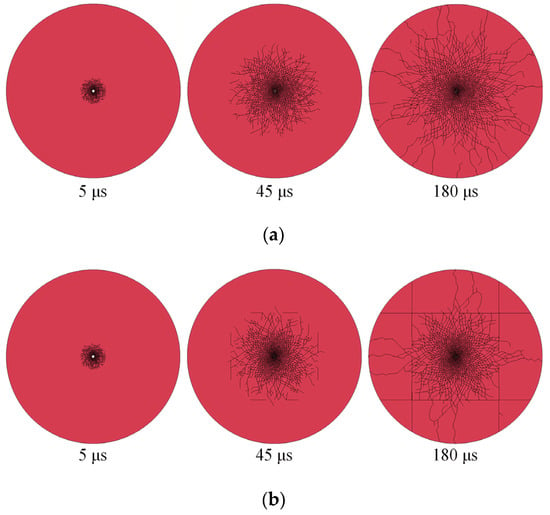
Figure 10.
Schematic diagram of crack propagation in (a) intact rock and (b) two joint sets.
5.3. Rock Mass Throw Blasting
A rock mass blasting model (Figure 11) is established, with a length of 16 m and a height of 7 m. The borehole radius R0 is 0.05 m, and the center coordinate of the borehole is O (0,0), with a minimum resistance line distance of 2 m. The model contains 8950 triangular elements and 13,542 no-thickness joint elements. The initial peak pressure of the explosive gas P0 is set at 1 GPa, the explosive gas vp diffusion velocity is 100 m/s, and the constant γ related to the properties of the explosive and rock is 1.4 [20,26,27].
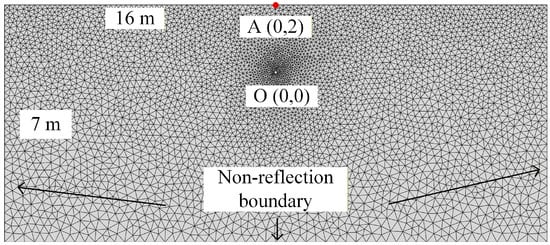
Figure 11.
FDEM model of blasting.
In this section, the evolution of blast-induced cracks is simulated under two conditions: with and without considering the effect of gas. The entire blasting process is illustrated in Figure 12. As depicted in Figure 12a, the proposed FDEM model successfully reproduces the propagation of the explosion stress wave. Under the action of the explosion stress wave, dense radial initial shear cracks are first generated in the rock mass surrounding the blasthole, while tensile cracks form in the far-field region. The propagation velocity of cracks is slower than that of the stress wave, which aligns with the findings reported in the literature [25,27]. As shown in Figure 12b, the pattern of crack formation under the condition considering explosive gas is largely consistent with that without considering gas, except for the absence of the gas wedge effect and the accelerated ejection effect induced by gas. This aspect will be further discussed in the subsequent sections.
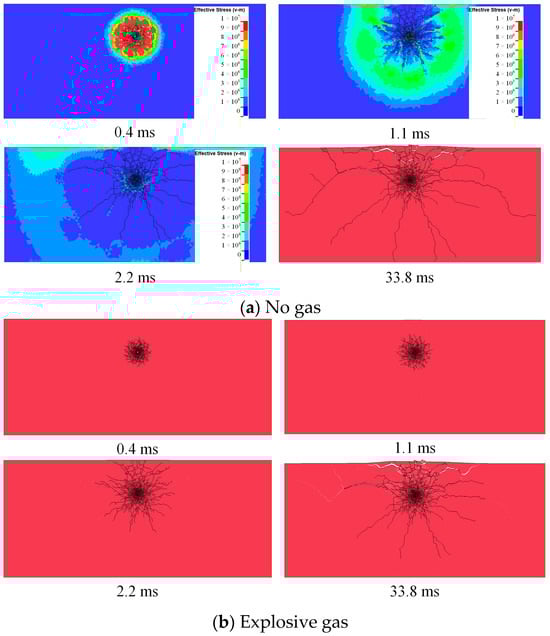
Figure 12.
Schematic diagram of the entire blasting process.
Figure 13 presents detailed comparative diagrams illustrating the crack evolution around the blasthole at different time instants under two conditions: with and without considering the gas effect. It can be observed that in the condition excluding explosive gas, crack growth decelerates after 5.4 ms. In contrast, when gas is considered, upon entering the cracks, the gas induces significant stress concentration at the crack tips. Serving as a crack-driving force, it overcomes the rock’s fracture toughness and in situ stress, promoting the continuous propagation and opening of cracks, which manifest as a distinct gas wedge effect. Simultaneously, cracks oriented in different directions compete for propagation under gas pressure. Ultimately, the gas preferentially drives extensive crack propagation along the path of least resistance, connecting cracks or natural fractures between adjacent blastholes to form a fracture plane.
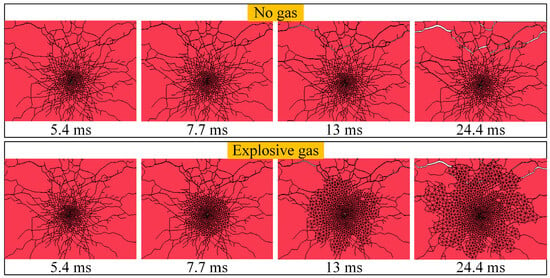
Figure 13.
Comparison of gas wedge effects.
Figure 14a shows the time histories of the crack number under the two conditions. The final number of cracks is 2049 in the condition without considering explosive gas and 3450 in the condition considering it. It can be inferred that explosive gas can significantly increase the number of blasting cracks. In addition to accelerating crack initiation via the gas wedge effect, the gas can also drive fractured rock masses toward the free surface in the vicinity of the latter, causing bulging and the formation of a “heave” phenomenon. When the gas energy is sufficiently high, it propels fragmented rock blocks along the free surface, resulting in the formation of a blasting crater. Even in the absence of ejection, the rock mass is fully pried open by the gas and rendered loose and fragmented. As illustrated in Figure 14b, which records the y-direction velocity of monitoring point A under the two conditions, during the upward ejection of each rock block, explosive gas exerts a pronounced acceleration effect on the ejection process. Figure 14c shows the time histories of the blast chamber area and the detonation pressure throughout the blasting process. Due to the approximate calculation of the blast chamber area, the detonation pressure curve exhibits significant fluctuations. Still, it shows an exponential decay trend, consistent with the decay law in Equation (5). In summary, the improved FDEM proposed in this paper can capture the entire process of stress wave propagation and the interaction of explosive gas with rock mass cracks, including crack initiation, propagation, and subsequent block separation and ejection, demonstrating the potential of this method for blasting simulation.
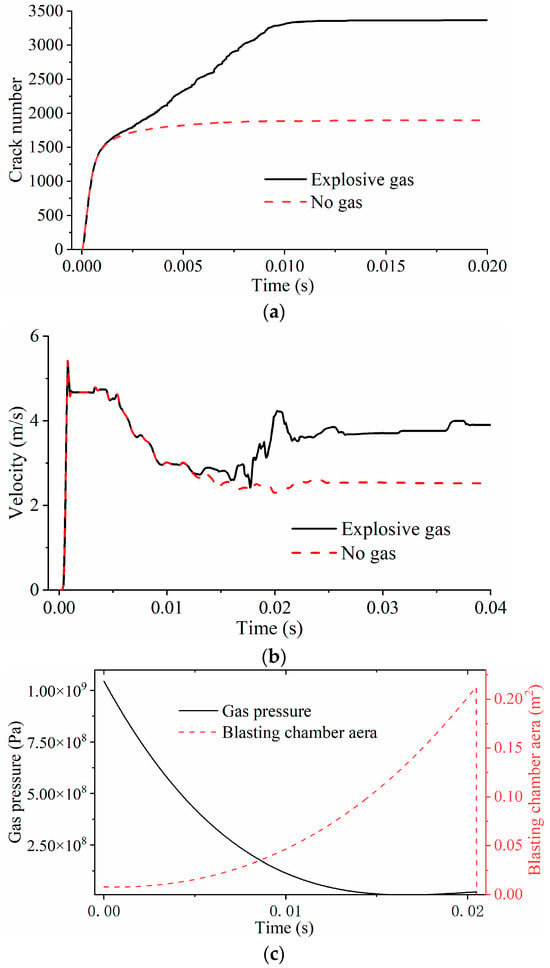
Figure 14.
Analysis of numerical simulation results. (a) The time histories of crack number, (b) the time histories of velocity at monitoring point A, (c) the time histories of the blast chamber area and the detonation pressure.
6. Conclusions
- (1)
- This study enriches the methods for simulating rock discontinuities with FDEM, showing that the stress failure model can be used to characterize rock joints in FDEM through accordingly introducing an actual joint constitutive model to realize the simulation of the entire process of propagation, reflection, and attenuation of blasting stress waves on joint surfaces. The simulation results show that FDEM can accurately reproduce the propagation law and attenuation characteristics of blasting stress waves in joints, which provides a necessary calculation basis for follow-up research on the entire process of rock blasting in jointed rock masses.
- (2)
- Joints have a significant controlling effect on the propagation of blasting cracks. The FDEM simulation results show that when small-hole blasting is carried out in rock masses with two joint sets, the joint surfaces are damaged prior to the intact rock, which significantly attenuates the energy of the stress wave, resulting in the crack propagation mainly concentrated within the rock blocks surrounded by the joints. It is difficult to penetrate the joints. This phenomenon is consistent with the conclusion of the existing SPH method, indicating that joints play dual roles as energy barriers and providing crack guidance during the blasting process.
- (3)
- Building upon previous research, the FDEM blasting calculation model was further optimized. Specifically, this model improves the calculation method for the blasting chamber area, enhances the overall computational efficiency, and now accounts for the effect of explosive gas—enabling the accurate capture of both the blasting chamber area and the explosive gas pressure. This optimization allows for the restoration of the embedding effect of explosive gas on crack initiation and propagation, demonstrating the potential of this method for blasting simulation and facilitating its engineering application.
- (4)
- The failure mechanism of rock mass in rock mass blasting was discussed. It is believed that after the stress wave generates the initial radial fracture of the rock mass, the explosive gas expands and is embedded in the fracture, causing the expansion of the fracture. Explosive gas plays a significant role in the fracturing and throwing of rock mass.
In the future, FDEM research on 3D and GPU acceleration will be further conducted to promote its application in practical blasting engineering.
Author Contributions
Methodology, validation, formal analysis, and writing, C.X.; conceptualization, supervision, and funding acquisition, J.S.; writing—review and editing, G.L.; software, R.N.; investigation, Y.H. All authors have read and agreed to the published version of the manuscript.
Funding
This research was funded by the Basic Research Fund for Central Public Research Institutes (CKSF20241007/YT) and the National Natural Science Foundation of China (52279093).
Institutional Review Board Statement
Not applicable.
Informed Consent Statement
Not applicable.
Data Availability Statement
The data presented in this study are available upon request from the corresponding authors.
Acknowledgments
The work in this paper is based on Y2D of Munjiza et al. and Y-Geo and Y-GUI of Grasselli’s Geomechanics Group (http://www.geogroup.utoronto.ca/) (accessed on 15 August 2019).
Conflicts of Interest
The authors declare no conflicts of interest.
References
- Yang, P.; Lei, Q.; Xiang, J.; Latham, J.; Pain, C. Numerical simulation of blasting in confined fractured rocks using an immersed-body fluid-solid interaction model. Tunn. Undergr. Space Technol. 2020, 98, 103352. [Google Scholar] [CrossRef]
- Xu, C.; Hu, Y.; Li, G.; Ma, C.; Liu, M. Study on Dynamic Evolution of the Landslide–Anchorage Structure System Under Earthquake with the Combined Finite—Discrete Element Method. Appl. Sci. 2025, 15, 6248. [Google Scholar] [CrossRef]
- Yin, X.; Liu, Q.; Huang, X.; Pan, Y. Real-time prediction of rockburst intensity using an integrated CNN-Adam-BO algorithm based on microseismic data and its engineering application. Tunn. Undergr. Space Technol. 2021, 117, 104133. [Google Scholar] [CrossRef]
- Zhao, H.; Zhang, L.; Wu, Z.; Liu, A. A new discrete element model for rock-like materials. Comput. Struct. 2022, 261–262, 106730. [Google Scholar] [CrossRef]
- Yang, Y.; Xia, Y. A nodal-based continuous-discontinuous deformation analysis method. Comput. Meth. Appl. Mech. Eng. 2024, 421, 116790. [Google Scholar] [CrossRef]
- Yin, X.; Gao, F.; Chen, Z.; Pan, Y.; Liu, Q.; Cheng, S. Intelligent multi-channel classification of microseismic events upon TBM excavation. J. Rock Mech. Geotech. Eng. 2025, 17, 7056–7077. [Google Scholar] [CrossRef]
- Saiang, D. Stability analysis of the blast-induced damage zone by continuum and coupled continuum—Discontinuum methods. Eng. Geol. 2010, 116, 1–11. [Google Scholar] [CrossRef]
- Yin, X.; Huang, X.; Pan, Y.; Liu, Q. Point and interval estimation of rock mass boreability for tunnel boring machine using an improved attribute-weighted deep belief network. Acta Geotech. 2023, 18, 1769–1791. [Google Scholar] [CrossRef]
- Feng, C.; Li, S.; Zheng, B.; Cui, X.; Jia, J. Numerical simulation on complete process of three-dimensional bench blasting in an open-pit mine based on CDEM. Explos. Shock. Waves 2019, 39, 110–120. (In Chinese) [Google Scholar]
- Yan, C.; Sun, G.; Zheng, H.; Ge, X. Simulation of explosive gas-driven rock fracture by FEM/DEM. Rock Soil Mech. 2015, 36, 2419–2425. (In Chinese) [Google Scholar]
- Ren, H.; Feng, C.; Tang, H.; Zhang, D.; Wang, B.; Zhao, H. Numerical simulation of blasting effect of rock foundation pits based on CDEM. Eng. Blasting 2022, 28, 1–10. (In Chinese) [Google Scholar]
- Yin, X.; Cheng, S.; Yu, H.; Pan, Y.; Liu, Q.; Huang, X.; Gao, F.; Jing, G. Probabilistic assessment of rockburst risk in TBM-excavated tunnels with multi-source data fusion. Tunn. Undergr. Space Technol. 2024, 152, 105915. [Google Scholar] [CrossRef]
- Munjiza, A.; Latham, J.P.; Andrews, K.R.F. Detonation gas model for combined nite-discrete element simulation of fracture and fragmentation. Int. J. Numer. Methods Eng. 2000, 49, 1479–1588. [Google Scholar] [CrossRef]
- Xu, C.; Liu, Q.; Wu, J.; Deng, P.; Liu, P.; Zhang, H. Numerical study on P-wave propagation across the jointed rock masses by the combined finite-discrete element method. Comput. Geotech. 2022, 142, 104554. [Google Scholar] [CrossRef]
- Xu, C.; Liu, Q.; Xie, W.; Wang, Y.; Li, S.; Lu, W.; Zhang, H. Investigation on artificial boundary problem in the combined finite-discrete element method (FDEM). Comput. Geotech. 2022, 151, 104969. [Google Scholar] [CrossRef]
- Xu, C.; Liu, Q.; Tang, X.; Sun, L.; Deng, P.; Liu, H. Dynamic stability analysis of jointed rock slopes using the combined finite-discrete element method (FDEM). Comput. Geotech. 2023, 160, 105556. [Google Scholar] [CrossRef]
- Munjiza, A.; Andrews, K.R.F.; White, J.K. Combined single and smeared crack model in combined finite-discrete element analysis. Int. J. Numer. Methods Eng. 1999, 44, 41–57. [Google Scholar] [CrossRef]
- Schoenberg, M. Elastic wave behavior across linear slip interfaces. J. Acoust. Soc. Am. 1980, 68, 1516–1521. [Google Scholar] [CrossRef]
- Bandis, S.C.; Lumsden, A.C.; Barton, N.R. Fundamentals of rock joint deformation. Int. J. Rock Mech. Min. Sci. Geomech. Abstr. 1983, 20, 249–268. [Google Scholar] [CrossRef]
- Ning, Y.; Yang, J.; Ma, G.; Chen, P. Modelling Rock Blasting Considering Explosion Gas Penetration Using Discontinuous Deformation Analysis. Rock Mech. Rock Eng. 2011, 44, 483–490. [Google Scholar] [CrossRef]
- Zhu, W.C.; Wei, C.H.; Li, S.; Wei, J.; Zhang, M.S. Numerical modeling on destress blasting in coal seam for enhancing gas drainage. Int. J. Rock Mech. Min. Sci. 2013, 59, 179–190. [Google Scholar] [CrossRef]
- Yuan, W.; Su, X.; Wang, W.; Wen, L.; Chang, J. Numerical study of the contributions of shock wave and detonation gas to crack generation in deep rock without free surfaces. J. Pet. Sci. Eng. 2019, 177, 699–710. [Google Scholar] [CrossRef]
- Saadatmand Hashemi, A.; Katsabanis, P. The Effect of Stress Wave Interaction and Delay Timing on Blast-Induced Rock Damage and Fragmentation. Rock Mech. Rock Eng. 2020, 53, 2327–2346. [Google Scholar] [CrossRef]
- Pyrak Nolte, L.J.; Myer, L.R.; Cook, N.G.W. Transmission of seismic waves across single natural fractures. J. Geophys. Res. Solid Earth 1990, 95, 8617–8638. [Google Scholar] [CrossRef]
- Lanari, M.; Fakhimi, A. Numerical study of contributions of shock wave and gas penetration toward induced rock damage during blasting. Comput. Part. Mech. 2015, 2, 197–208. [Google Scholar] [CrossRef]
- Han, H.; Xu, L.; Liu, H.; Fukuda, D.; Zhao, J.; Chan, A. FDEM modeling of the fracture, fragmentation and collapse process of rock masses with pre-existing joints by smooth blasting during deep tunnelling. Comput. Geotech. 2026, 191, 107769. [Google Scholar] [CrossRef]
- Cunningham, C. Concepts of blast hole pressure applied to blast design. Fragblast 2006, 10, 33–45. [Google Scholar] [CrossRef]


Disclaimer/Publisher’s Note: The statements, opinions and data contained in all publications are solely those of the individual author(s) and contributor(s) and not of MDPI and/or the editor(s). MDPI and/or the editor(s) disclaim responsibility for any injury to people or property resulting from any ideas, methods, instructions or products referred to in the content. |
© 2026 by the authors. Licensee MDPI, Basel, Switzerland. This article is an open access article distributed under the terms and conditions of the Creative Commons Attribution (CC BY) license.