Abstract
Background: Pain management for preterm infants has emerged as a key intervention aimed at enhancing their developmental trajectories. However, little is known regarding the response and recovery of the neonatal brain following procedural pain. This study examined the temporal dynamics of electroencephalography (EEG) power in preterm infants during and up to 30 min after procedural pain. Methods: fifty-seven datasets were collected from preterm infants (mean gestational age 32.5 ± 3.3 weeks). We computed Time–Frequency analysis for EEG power and EEG power ratio relative to baseline across eight EEG channels in the low delta (1–2 Hz), high delta (2–4 Hz), theta (4–8 Hz), alpha (8–16 Hz), and beta (16–20 Hz) during the procedure, immediately after, and at intervals up to 30 min post-procedure. Results: EEG power increased significantly in all channels and frequency bands during the procedure compared to baseline (p < 0.05), declined immediately after but remained above baseline (p < 0.05), and recovered to near-baseline levels by four minutes post-procedure (p > 0.05), except for alpha and beta power at C3 and C4, which were lower than baseline (p < 0.05). The EEG power ratio at the frontal, occipital, and temporal showed the greatest power changes in the beta. The C3 and C4 exhibited the most prominent relative changes in the low delta. Conclusion: the preterm brain exhibits widespread responses to procedural pain and recovers gradually, not returning to the resting state for at least four minutes after a painful procedure. These results underscore the potential benefit of quantifying the time-integral of EEG power, rather than its peak intensity, when developing a biosensor for procedural pain using neonatal EEG.
1. Introduction
Preterm infants in the neonatal intensive care unit (NICU) frequently experience repeated painful procedures [1], such as heel lancing for blood sampling, which is the most common source of procedural pain [2,3,4]. These procedures occur during a critical period of rapid brain development, which is characterized by the maturation of nervous systems with immature pain-suppression pathways, resulting in heightened sensitivity to nociceptive stimuli [5]. Moreover, repeated and prolonged exposure to pain in early life can have a negative long-term consequence on brain structure, function, and development, as well as heightened pain sensitivity, and may contribute to progression from acute to chronic pain [6]. Therefore, pain assessment is necessary in order to obtain appropriate management of pain and stress in infant pain [7].
A skin-puncture pain processing in preterm infants is mediated by the peripheral nociceptors, spinal cord processing, and supraspinal modulation and pain integration [6,8]. At the peripheral nociceptor, noxious sensations are converted to electrical activity and immediately transmit the nerve impulses to the spinal cord [6]. These impulses terminate in the gray matter of the thalamus, where they are integrated and modified before thalamic projections to the cerebral cortex convey the processed information to specific cortical regions [8]. However, the mechanisms of cerebral response and recovery following procedural pain in neonates are poorly understood, primarily because these vulnerable patients cannot provide verbal self-reports. Consequently, establishing objective biosensors to quantify neonatal pain has become a clinical priority.
Neurophysiological assessments such as electroencephalography (EEG) were used as alternative measures of neural activity [9]. Notably, EEG is a non-invasive tool for monitoring brain electrical activity with high temporal precision [10,11]. By combining spatial and temporal brain-function data, EEG provides a more detailed understanding of brain dynamics. Furthermore, its non-invasiveness allows repeated assessments and longitudinal investigation to be conducted safely and is well-tolerated [11]. Nonetheless, research on pain processing utilizing EEG has demonstrated that evoked pain potentials and neural response patterns occur in distinct regions at different time scales and throughout different frequency bands [12,13].
Time–Frequency analysis facilitates an understanding of neurophysiological processes by monitoring EEG signals. It examines how the amplitude and phase of neural oscillations change over time at different frequency bands. Therefore, Time–Frequency analysis is more suitable for examining complex and rapidly changing dynamics in neural processes [14]. Due to the fact that EEG signals are non-stationary, the Time–Frequency domain is the most appropriate for EEG data processing and interpretation. Furthermore, Time–Frequency analysis considers both temporal and spectral domains, making it an appropriate approach to capture relevant EEG data from both domains [15,16]. The wavelet-based Time–Frequency analysis is an advance approach for presenting EEG data in both temporal and spectral domains, allowing for the observation of rapid fluctuations [17] and non-phase-locked activities by analyzing the EEG signals in both temporal and spectral domains. We can further investigate brain response to procedural pain in infants by analyzing brain activity in the temporal and spatial distribution across various electrode sites in the Time–Frequency domain [18]. Furthermore, Time–Frequency analysis employing continuous wavelet transform (CWT) can identify subtle brain responses to painful stimuli [19], revealing the most pronounced power changes in pain response among preterm infants [20].
A wide range of studies have investigated how the brain responds to different types of pain; however, the majority have focused primarily on the acute phase of the response [18,20,21,22,23,24]. These studies prove that pain assessment in infants can be measured using EEG-based measurements. For instance, noxious-evoked potentials have been shown to be a useful parameter of analgesic effectiveness in infants [18]. EEG studies demonstrate that power increases across multiple frequency bands and brain regions during and immediately after heel puncture [20]. Furthermore, the brain can discriminate between noxious and non-noxious stimuli, with the low delta band (1–2 Hz) proving especially significant in discriminating pain in preterm infants [21]. Combined EEG and near-infrared spectroscopy (NIRS) recordings demonstrate different responses to painful and non-painful stimuli in term infants [22]. In addition, brain oscillations induced by noxious heel-lance stimulation in infants are specific to the delta band (2–4 Hz), and this pattern does not present in adults [23]. Maimon et al. discovered that heel lance does not alter frontal EEG asymmetry, but it was associated with behavioral pain indicators in infants born between 28 and 33 weeks. However, follow-up was limited to 10 min post-procedure [24]. Despite these important findings, most previous studies have emphasized immediate brain responses, leaving longer-term recovery from procedural pain relatively unaddressed. However, it remains unclear which specific metric—such as peak intensity during the painful procedure, the duration of pain, or the cumulative pain burden—is most strongly associated with long-term morbidities. Therefore, to establish a clinically useful EEG-based biosensor for neonatal pain, the assessment window must be broadened to encompass the entire sequence of the EEG response to pain stimuli—ranging from the initial perception and acute reaction to the habituation phase and the return to baseline.
Brain responses to heel puncture procedural pain recover gradually, rather than instantaneously. Our previous study [20] demonstrated that these responses do not return to pre-puncture baseline immediately after the event. While our previous research focused on the immediate EEG response to procedural pain, the current study extends the temporal scope to 30 min following the procedure, which enables the characterization of the full recovery trajectory and the development of time-integral metrics reflecting cumulative pain-related cortical activity. Understanding the duration of painful procedure-related brain activity may clarify the causes of distress and guide interventions for hospitalized preterm infants. If related brain regions remain activated for a certain period, interventions to accelerate the recovery of cerebral activity to the resting state might help minimize the potential long-term effects of noxious stimuli. In the present study, we analyzed EEG signals during heel puncture and for up to 30 min post-procedure. Time–Frequency wavelet analysis was applied across eight EEG channels and five frequency bands to objectively quantify brain responses. The primary objective is to characterize both acute and prolonged cortical dynamics following procedural pain and to assess temporal changes up to 30 min after the procedure. We aim to estimate the duration and magnitude of brain response alterations, as well as the time required to return to baseline levels.
2. Materials and Methods
2.1. Ethics Approval and Consent
The protocol for this study was approved by the Ethics Committee of Nagoya City University Graduate School of Medical Sciences, Nagoya, Japan (approval number: 60-20-0157). Written informed consent was obtained from the parents of each newborn infant.
2.2. Participants
This was a prospective study of premature infants admitted to the Neonatal Intensive Care Unit (NICU) of Nagoya City University Hospital, Japan, between January 2022 and April 2024. Inclusion criteria included infants with a gestational age of less than 37 weeks at birth, stable cardiac and respiratory status without the need for invasive medical cares, such as venous drip infusion, invasive or non-invasive positive pressure ventilation, and no requirement for pharmacological treatment, with the exception of routine supplements, such as vitamins, iron, sodium, potassium, phosphate, and caffeine. Infants with major congenital anomalies, chromosomal abnormalities, severe intracranial hemorrhage, necrotizing enterocolitis requiring surgical intervention, or sepsis were excluded to minimize potential bias. Some infants were enrolled multiple times at intervals of at least two weeks.
2.3. EEG Recording and Study Protocol
Surface electroencephalogram (sEEG) signals were recorded at a sampling rate of 500 Hz, using the NeuroFax EEG-1250 (NIHON KOHDEN, Tokyo, Japan). Electrodes were placed at Fp1, Fp2, C3, Cz, C4, O1, O2, T3, T4, and both ear lobes (A1 and A2), following the international standard 10–20 system. EEG signals were referenced to Cz, resulting in eight channels for further analysis [25]. Infants were fed milk 60 to 90 min before the procedure. The procedure consisted of a puncture at the lateral surface of the left heel using an automatic heel lancet (Quikeel Lancet, Becton, Dickinson and Company, Franklin Lakes, NJ, USA), followed by gentle skin squeezing to collect blood samples. The procedure typically lasted no longer than 1 min, from puncture to blood collection. EEG signals were recorded continuously before, during, and up to 30 min after, the heel puncture. Repeated EEG recordings were performed in infants hospitalized for an extended period, with at least 2 weeks between each session. Thus, the dataset included repeated measurements from some participants. All procedures were performed by a pediatrician in the neonatal intensive care unit (NICU), following clinical practice guidelines. An experienced neurologist visually inspected all EEG recordings to ensure high-quality signals were retained.
2.4. EEG Pre-Processing
Preprocessing was performed using the same procedure as in our previous study [20]. The raw EEG signals were processed and analyzed using MATLAB software (The MathWorks, Natick, MA, USA, R2024a). The signals were filtered at 60 Hz using a notch filter to remove electrical line noise, and then further filtered in the 0.5–30 Hz band-pass range with a fourth-order Butterworth filter to reduce irrelevant low- and high-frequency noise. A Daubechies 4 (db4) wavelet was utilized, along with a fifth-level decomposition and a soft thresholding approach to eliminate the electrooculogram (EOG) and electromyogram (EMG) artifacts. Additionally, a threshold filter criterion was set for the following conditions: absolute amplitude greater than 200 μV, absolute difference between consecutive samples greater than 50 μV, and standard deviation greater than 50 μV. Artifact rejection was conducted through a combination of expert visual inspection and automated thresholding. Amplitudes that exceeded these thresholds were replaced with values obtained from linear interpolation [26]. The channels that were detected with high artifacts after filtering in at least one of the specified segments were removed from the analysis.
The filtered EEG signals were segmented into eight distinct time points: baseline (2 min before the procedure), procedural pain (1 min during the heel lance and skin squeeze), immediate post-procedure (after the procedural pain was completed, up to 2 min), and extended recovery periods at 4, 6, 8, 20, and 28 min following the procedure (Figure 1). Epoch duration was set to 2 min, except for the procedural pain window, which was 1 min. The specified segments of this study extended the observation period to 30 min, beyond the duration of the Maimon et al. study, which examined changes in brain activity for up to 5 and 10 min post-procedure [24]. The segments were designed to measure the EEG power changes in both the acute and recovery periods following procedural pain. The period at 10 min post-procedure was excluded from this analysis because saliva samples were collected during these time points, which could interfere with the study’s analysis.
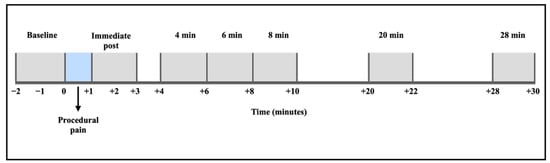
Figure 1.
EEG signal segmentation and time periods of analysis.
2.5. EEG Power (Time–Frequency Analysis)
EEG power was computed according to our previous study [20]. The signals of each segment were analyzed independently in 30 s non-overlapping windows, using continuous wavelet transform (CWT) with Morlet wavelets with a central frequency (ω0) of 6 radians and six cycles to obtain Time–Frequency EEG power. The power in each frequency band was calculated for the low delta (1–2 Hz), high delta (2–4 Hz), theta (4–8 Hz), alpha (8–16 Hz), and beta (16–20 Hz) bands, and transformed into logarithmic values. The power in each segment was then calculated by averaging the power values across all windows.
The CWT is provided by [27]:
The wavelet coefficient at scale and time is represented by , the EEG signal is represented by , the complex conjugate of the wavelet function is represented by , the frequency resolution is controlled by , and the temporal localization is controlled by .
The CWT is a signal analysis procedure that is specific to the frequency of the signal and is performed in the Time–Frequency domain. The CWT is suitable for EEG signals that contain both short windows at high frequencies and long windows at low frequencies. This adaptability is achieved by employing wavelets, such as the Morlet wavelet, which are constrained in both time and frequency. Consequently, CWT enables effective visualization of signal characteristics across both time and frequency domains [28].
The Morlet wavelet is defined as [27]:
where .
The Morlet wavelets provide a reliable and interpretable approach for analyzing the time-varying spectral characteristics of non-stationary signals such as EEG signals. This approach ensures a balance between temporal and frequency accuracy by providing a clear representation in both time and frequency domains [28,29].
2.6. EEG Power Ratio
EEG power ratio was calculated as the ratio between the EEG power at each time point and the baseline for each channel in each frequency band using the following equation:
where indicates the power values during procedural pain, immediately post-procedure, and 4, 6, 8, 20, and 28 min post-procedure. represents the power value at the baseline time point.
The power ratio can illustrate the fluctuations in power across different frequencies within the specified time period. Additionally, results can be displayed as a topographic map, demonstrating the regions on the scalp where power is maximized at certain times and frequencies throughout the electrode montage [14]. The power ratio is defined as follows: a value of 1.0 indicates no change from the baseline, a value greater than 1.0 indicates an increase in power compared to the baseline, and a value less than 1.0 indicates a reduction in power compared to the baseline.
2.7. Behavioral State Assessment
Behavioral state was assessed from video recordings using an adaptation of Prechtl’s behavioral state categories, as described by Grunau and Craig. Assessments were performed continuously before, during, and after the procedure for up to 30 min. Behavioral states were assigned ordinal scores as follows: active awake = 0, quiet awake = 1, active sleep = 2, and quiet sleep = 3 [30,31].
2.8. Statistical Analysis
We used linear mixed-effect models to evaluate the EEG power of each channel across various frequency bands during procedural pain, immediately post-procedure, and throughout prolonged recovery intervals at 4, 6, 8, 20, and 28 min after the procedure, in comparison to baseline measurements. We utilized a fixed-effect model to analyze the mean EEG power at various time intervals (during procedural pain, immediately post-procedure, and during extended recovery periods at 4, 6, 8, 20, and 28 min post-procedure) in relation to the baseline. Participants were included as a random effect with a random intercept for infant ID, to account for repeated measurements. Model estimation was performed using restricted maximum likelihood (REML). Standard errors for pairwise comparisons of marginal means were derived from the estimated variance–covariance matrix incorporating the random effects, with Dunnett’s correction applied for multiple comparisons relative to baseline. Prism (version 10.2.3; GraphPad Software, San Diego, CA, USA) was used for all statistical analyses. A p-value < 0.05 was considered statistically significant.
3. Results
This study examined the EEG power and power ratio from 42 preterm infants with a mean gestational age of 32.5 ± 3.3 weeks and a postconceptional age at study of 38.7 ± 2.6 weeks. EEG recordings were repeated in 11 participants, resulting in a total of 57 data sets (2 recordings from 9 participants, 3 from 1, and 5 from 1). Based on artifact detection criteria, one dataset of O1, O2, and T4, and two datasets of T3 channels were excluded from the analysis. Consequently, channels Fp1, Fp2, C3, and C4 had all 57 recordings included, and channel O1 had 56; O2 had 55; T3 had 54; and T4 had 56. Participant characteristics are illustrated in Table 1.

Table 1.
Characteristics of participants.
3.1. EEG Power
The comparison of EEG power at different time points to the baseline from eight channels in five frequency bands revealed significant increases during procedural pain and immediately post-procedure in all frequency bands and channels. A representative example of raw EEG traces illustrating typical neonatal EEG activity is shown in Figure 2.
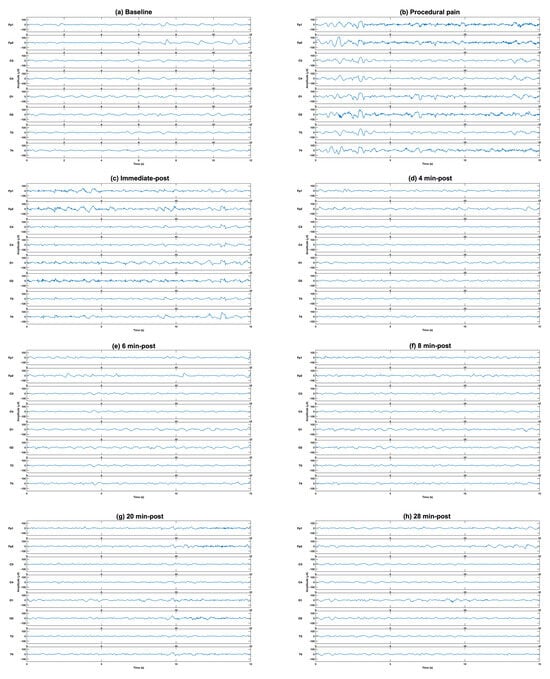
Figure 2.
Representative example of raw EEG traces illustrating typical neonatal EEG activity at (a) baseline, (b) during the procedure, (c) immediately post-procedure, and (d) 4 min, (e) 6 min (f) 8 min, (g) 20 min and (h) 28 min post-procedure, demonstrating the increase in EEG activity after puncture (b,c), followed by gradual reduction with time (d–h).
During procedural pain, significant increases were observed across all channels in the low delta (Figure 3), high delta (Figure 4), and theta (Figure 5) (all p < 0.0001). Alpha (Figure 6) and beta (Figure 7) power also increased during procedural pain at frontal (Fp1, Fp2), occipital (O1, O2), and temporal (T3, T4) channels (p < 0.0001), with significant increases at central channels (C3 and C4; alpha p < 0.001, beta p < 0.01).
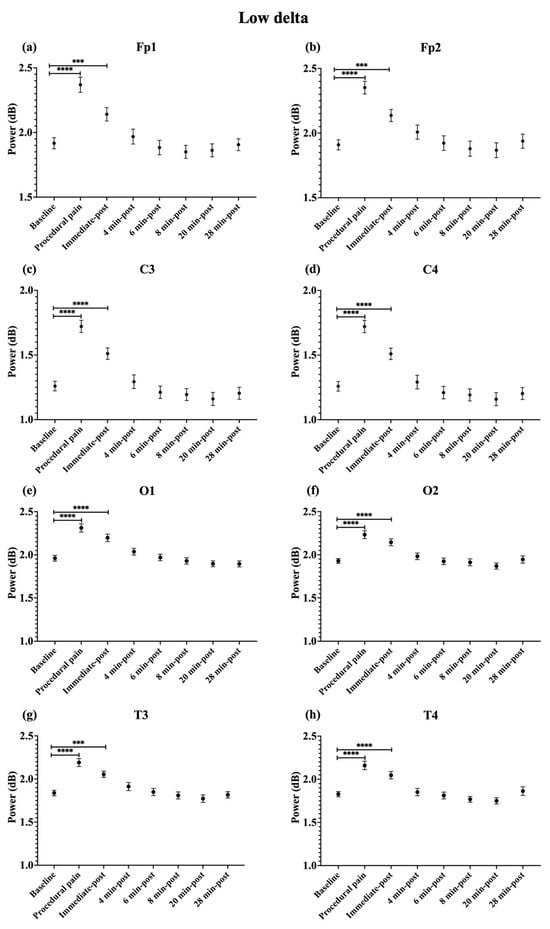
Figure 3.
Line plot of mean EEG power of low delta band (mean ± standard error of the mean is shown for (a) Fp1, (b) Fp2, (c) C3, (d) C4, (e) O1, (f) O2, (g) T3, and (h) T4 at baseline, during procedural pain, immediately post-procedure, and at 4, 6, 8, 20, and 28 min post-procedure. *** p < 0.001 and **** p < 0.0001 indicate statistically significant differences compared to the baseline period.
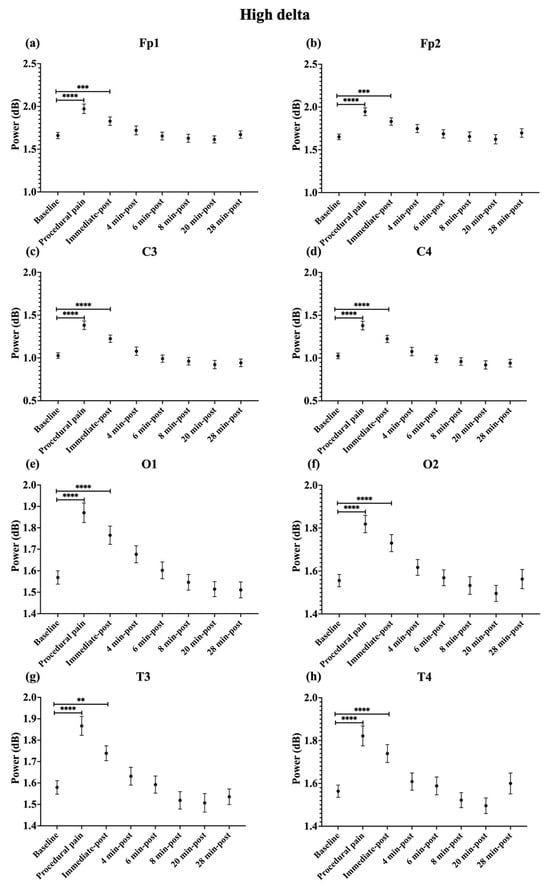
Figure 4.
Line plot of mean EEG power of high delta band (mean ± standard error of the mean) is shown for (a) Fp1, (b) Fp2, (c) C3, (d) C4, (e) O1, (f) O2, (g) T3, and (h) T4 at baseline, during procedural pain, immediately post-procedure, and at 4, 6, 8, 20, and 28 min post-procedure. ** p < 0.01, *** p < 0.001 and **** p < 0.0001 indicate statistically significant differences compared to the baseline period.
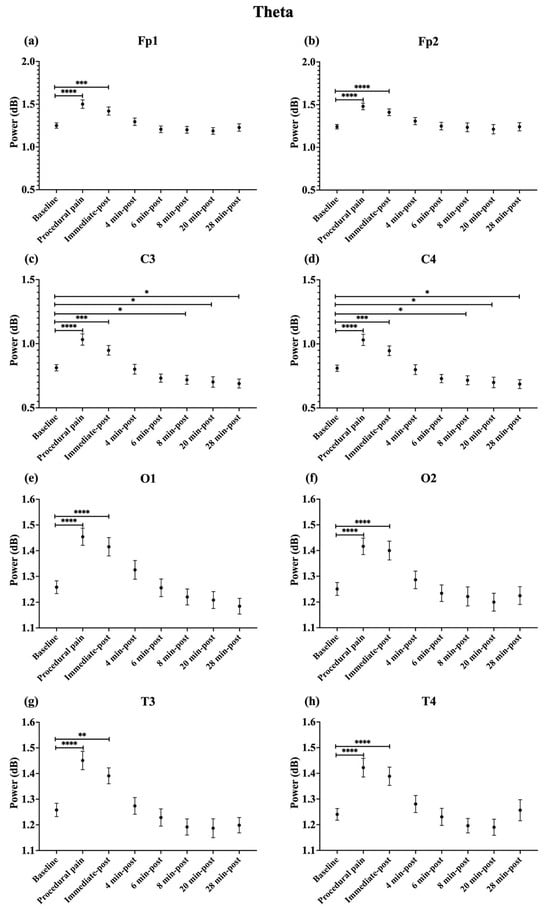
Figure 5.
Line plot of mean EEG power of theta band (mean ± standard error of the mean ) is shown for (a) Fp1, (b) Fp2, (c) C3, (d) C4, (e) O1, (f) O2, (g) T3, and (h) T4 at baseline, during procedural pain, immediately post-procedure, and at 4, 6, 8, 20, and 28 min post-procedure. * p < 0.05, ** p < 0.01, *** p < 0.001 and **** p < 0.0001 indicate statistically significant differences compared to the baseline period.
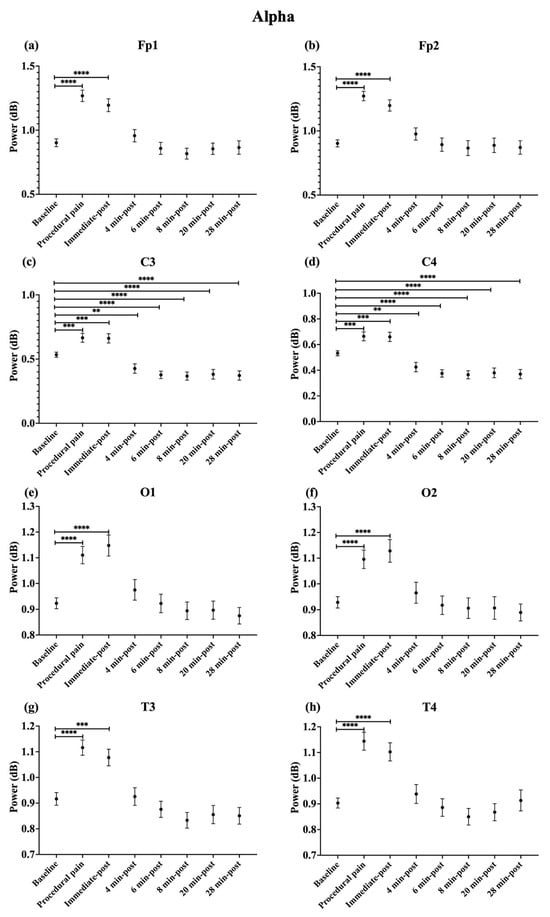
Figure 6.
Line plot of mean EEG power of alpha band (mean ± standard error of the mean) is shown for (a) Fp1, (b) Fp2, (c) C3, (d) C4, (e) O1, (f) O2, (g) T3, and (h) T4 at baseline, during procedural pain, immediately post-procedure, and at 4, 6, 8, 20, and 28 min post-procedure. ** p < 0.01, *** p < 0.001 and **** p < 0.0001 indicate statistically significant differences compared to the baseline period.
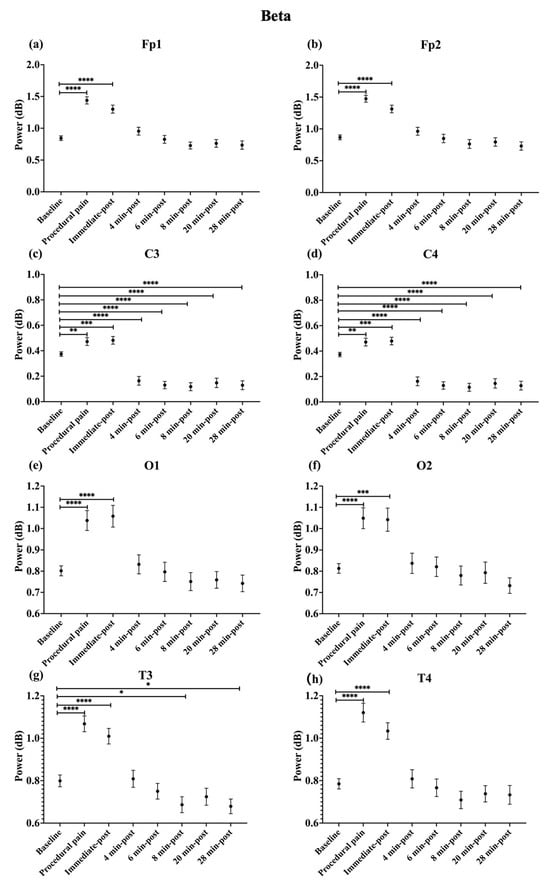
Figure 7.
Line plot of mean EEG power of beta band (mean ± standard error of the mean) is shown for (a) Fp1, (b) Fp2, (c) C3, (d) C4, (e) O1, (f) O2, (g) T3, and (h) T4 at baseline, during procedural pain, immediately post-procedure, and at 4, 6, 8, 20, and 28 min post-procedure. * p < 0.05, ** p < 0.01, *** p < 0.001 and **** p < 0.0001 indicate statistically significant differences compared to the baseline period.
Immediately post-procedure, EEG power remained significantly elevated relative to baseline across all frequency bands and channels: low delta (Fp1, Fp2, T3 p < 0.001; C3, C4, O1, O2, T4 p < 0.0001; Figure 3), high delta (Fp1, Fp2 p < 0.001; C3, C4, O1, O2, T4 p < 0.0001; T3 p < 0.01; Figure 4), theta Fp1, C3, C4 p < 0.001; Fp2, O1, O2, T4 p < 0.0001; T3 p < 0.01; Figure 5), alpha (Fp1, Fp2, O1, O2, T4 p < 0.0001; C3, C4, T3 p < 0.001; Figure 6), and beta (Fp1, Fp2, O1, T3, T4 p < 0.0001; C3, C4, O2 p < 0.001; Figure 7).
By 4 min post-procedure, EEG power in the low delta, high delta, and theta bands no longer differed significantly from baseline across any channel (all p > 0.05; Figure 3, Figure 4 and Figure 5). Similarly, alpha and beta power at frontal (Fp1, Fp2), occipital (O1, O2), and temporal (T3, T4) channels showed no significant differences from baseline at this time point (all p > 0.05; Figure 6 and Figure 7).
In contrast, central channels exhibited a distinct recovery pattern. Theta power at C3 and C4 declined below baseline at 8, 20, and 28 min post-procedure (p < 0.05; Figure 5). Alpha power at C3 and C4 decreased significantly below baseline at 4 min (p < 0.01) and remained decreased at 6, 8, 20, and 28 min post-procedure (p < 0.0001; Figure 6). Beta power at C3 and C4 channels also showed a sustained reduction below baseline from 4 through 28 min post-procedure (all p < 0.0001; Figure 7). In addition, a reduction in beta power was observed at T3 and T4 channels, reaching statistical significance at T3 at 8 and 28 min post-procedure (p < 0.05; Figure 7). A summary of the main effects of time on EEG power across channels and frequency bands, including F-statistics derived from linear mixed-effects models, is provided in Table 2.
Table 2.
Main effects of time on EEG power across channels and frequency bands.
3.2. EEG Power Ratio
The EEG power ratio was calculated as the change in power at each time point relative to baseline. This ratio demonstrates how frequency power fluctuates over time. EEG power ratio values for each channel (Fp1, Fp2, C3, C4, O1, O2, T3, and T4) and frequency band (low delta, high delta, theta, alpha, and beta) during procedural pain and at each post-procedure time point (immediate, 4, 6, 8, 20, and 28 min) are shown in Table S1.
The power ratio in Fp1 and Fp2 in the beta band showed its maximum value during procedural pain (Fp1: 1.810 ± 0.681, Fp2: 1.812 ± 0.679), then declined to 1.145 ± 0.528 and 1.135 ± 0.518, respectively, at 4 min post-procedure, and remained low through 28 min.
C3 and C4 channels had the most prominent relative change in the low delta during procedural pain (C3: 1.415 ± 0.375, C4: 1.415 ± 0.374), which decreased to 1.043 ± 0.308 and 1.043 ± 0.309 by 4 min post-procedure, respectively. Beta power in both channels dropped from 1.275 ± 0.524 to 0.183 ± 0.657 for C3 and from 1.277 ± 0.525 to 0.177 ± 0.657 for C4 at 8 min, staying low at 28 min. Similarly, alpha power in C3 and C4 decreased from 1.249 ± 0.368 and 1.250 ± 0.370 to 0.657 ± 0.381 and 0.655 ± 0.381, respectively, by 8 min, and remained low thereafter.
In O1 and O2, the beta band power ratios exhibited increases during procedural pain (O1: 1.320 ± 0.451, O2: 1.293 ± 0.381), followed by gradual decreases over time. At 4 min post-procedure, beta power was 1.076 ± 0.499 for O1 and 1.025 ± 0.370 for O2.
T3 and T4 channels displayed the most prominent relative change in beta power during procedural pain (T3: 1.358 ± 0.282, T4: 1.461 ± 0.472), decreasing to 1.018 ± 0.331 for T3 and 1.019 ± 0.328 for T4 at 4 min.
3.3. Topographic Map of the EEG Power Ratio
Power ratios were determined at each time point and plotted on a topographic map (Figure 8) to reflect changes in each frequency band: low delta (Figure 8a), high delta (Figure 8b), theta (Figure 8c), alpha (Figure 8d), and beta (Figure 8e). During procedural pain, a power ratio greater than 1 was observed in the low delta, high delta, and theta bands at C3 and C4, while the alpha and beta bands were evident at Fp1 and Fp2. These values decreased slightly immediately after the procedure, and the power ratio remained greater than 1. At 4 min after the procedure, power ratios in all frequency bands began to drop near the baseline (≈1.0), particularly in C3 and C4. At 6, 8, 20, and 28 post-procedure, power ratios were mostly <1 in all frequency bands and all channels, especially in the theta, alpha, and beta at C3 and C4, which had the lowest power ratios.
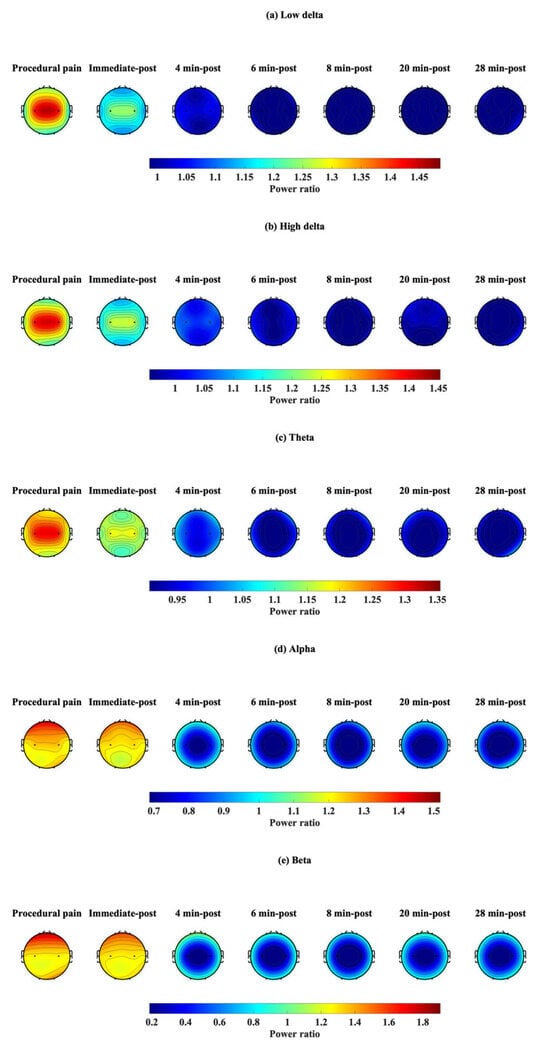
Figure 8.
Topographic visualization of EEG power ratio over time in five frequency bands: (a) low delta, (b) high delta, (c) theta, (d) alpha, and (e) beta, during procedural pain and post-procedure.
3.4. Behavioral State
Behavioral state assessed using the Premature Infant Pain Profile–Revised (PIPP-R) varied across time points, relative to the procedure (Figure 9). Compared with baseline, PIPP-R scores increased significantly during the procedure and at the immediate post-procedure time point (p < 0.0001). No significant differences were observed between baseline and post-procedural time points at 4, 6, 8, 20, or 28 min.
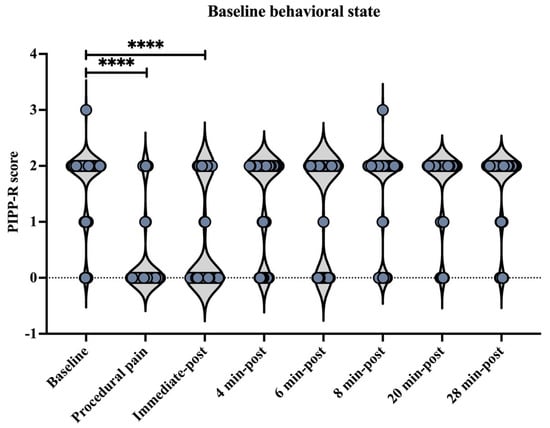
Figure 9.
Behavioral state across time points assessed using the Premature Infant Pain Profile–Revised (PIPP-R). Violin plots illustrate the distribution of PIPP-R behavioral state scores at each time point (before, during procedural pain, immediate-post procedural pain, and 4, 6, 8, 20, and 28 min post-procedure). **** p < 0.0001 indicate statistically significant differences compared to the baseline period.
4. Discussion
Our previous analysis, which focused on immediate responses before, during, and after the procedure, demonstrated that procedural pain in preterm infants elicited strong EEG responses in the central region for frequency power and Time–Frequency power analysis, particularly in the low delta band [20]. The current analysis broadened the assessment window and investigated EEG activity by encompassing the entire sequence of the EEG response to procedural pain, ranging from the resting state to the initial perception of pain, acute reaction, habituation, and return to baseline, up to 30 min post-procedure. Subsequently, the widespread EEG responses observed during the acute phase were followed by a period of persistent activation, before gradually returning to a resting state within approximately four minutes post-procedure. These results underscore the importance of monitoring and managing pain-induced cerebral changes and recovery in preterm infants, while highlighting the need for further refinement of EEG-based pain biosensors. Future studies are required to clarify whether the peak intensity or the time-integral of EEG power serves as a more reliable predictor of long-term neurodevelopmental outcomes in fragile neonates.
In the current study, we used Time–Frequency analysis to calculate EEG power, representing brain activity across eight channels in five frequency bands. To assess temporal changes in EEG power across several brain regions and frequency bands, we calculated the EEG power ratio relative to the baseline. We analyzed the same participant groups as in our previous study. This approach ensured consistency and comparability between immediate and prolonged post-procedure evaluations. The results demonstrated significant increases in EEG power across all frequency bands and channels during the procedure, compared to baseline. This finding aligns with previous studies showing that nociceptive stimulation in neonates induces cortical activity [32,33,34]. The observed EEG activation across all frequency bands and channels indicates that painful stimuli evoke widespread neuronal activities, such as burst activity and delta, with or without brush, in the immature brain [35,36]. Although the infant brain is not fully mature, it exhibits a robust response to painful stimuli. Bursts triggered by heel lance are associated with stimulus intensity rather than the type of stimulus [36]. Neuronal bursts, defined as delta brushes, consist of fast-frequency ripples (8–25 Hz) superimposed on a slow wave (0.3–1.5 Hz). Their frequency and amplitude peak at 32–34 weeks postmenstrual age, and diminish by 42 weeks. These neuronal bursts can be triggered by various sensory stimuli across extensive brain regions [36,37]. The present study included infants at 38.7 (2.6) weeks postmenstrual age. This age may correspond with the most prominent and widespread delta brushes and the transitional phase to brain waves that are specific to the stimulus pattern. Following the procedure, EEG power decreased but remained above baseline. Prior research reported that pinprick stimulation elevated EEG power in term infants for up to 90 s [38]. Collectively, these findings suggest a gradual recovery of brain activity following painful procedure, rather than an immediate return to baseline.
At four minutes after the procedure, we found that EEG power in the frontal (Fp1, Fp2), occipital (O1, O2), and temporal (T3, T4) regions generally approached baseline levels across all frequency bands. The frontal region regulates mental activity and emotional processing [39,40], while the temporal and occipital regions are involved in sensory reception and arousal management [39]. This suggests that these regions recovered to near baseline levels following cortical transient activation, perhaps due to their involvement in arousal and sensory integration, which resulted in activation during pain stimulation and subsequent return to baseline after the stimulation. In line with the findings of Maimon et al. [24], EEG recovery was investigated at 5 and 10 min post-procedural pain (heel lance and skin squeeze) in preterm infants. Their findings found no significant change in frontal and central EEG asymmetry between baseline, post-procedure, and recovery periods. Nonetheless, the EEG asymmetry was not assessed during or immediately after the procedure in their research. The results of our investigation suggest that the preterm brain may begin to recover toward a resting state four minutes after a painful procedure, although recovery patterns may vary across different brain regions.
Reductions in EEG power relative to baseline were observed in several frequency bands and on some channels, with power levels lower than the baseline during the recovery period. The central electrodes (C3, C4) exhibited persistent reductions in theta power from 8 to 28 min post-procedure, as well as in alpha and beta power from 4 to 28 min post-procedure. Additionally, a discontinuous reduction in T3 beta power was observed at 8 and 28 min post-procedure, following the recovery period. A substantial decline in theta, alpha, and beta power at the central region during recovery may reflect neuronal modulation related to the painful stimulus. However, differences in sleep state between baseline and recovery periods (e.g., active versus quiet sleep) may also contribute to these observations. In accordance with the Witteveen et al. [41] study, the power in the theta and alpha bands of preterm infants was significantly reduced in their resting state, resulting in a flatter power-spectrum slope than that of term infants. The preterm infants had a typical distribution of high power in low frequencies and low power in high frequencies [41]. In line with the study by Gonzalez et al., preterm infants had lower means of spectral coherence in the beta band for most cortical areas, especially during quiet sleep, compared to full-term newborns with higher corrected age [42]. Because the commencement of recording generally overlaps with the beginning of sleep, this may be different from the deeper sleep states observed towards the end (30 min) of the monitoring. We speculate that the preterm brain may revert to its resting state. Alternatively, painful stimuli-induced neuronal suppression following the procedure may explain the reduction of alpha and beta power at the central brain region [43].
The EEG power ratio was used as a descriptive measure to visualize within-channel, within-frequency changes relative to the baseline. We observed that different brain regions tended to show higher relative changes in certain frequency bands in response to procedural pain. This suggests that each brain region may exhibit different dominant frequency bands in response to procedural pain, as reported in previous studies [12,13]. However, the observations are descriptive, and based on relative changes in power ratio. In the present study, the frontal, occipital, and temporal regions exhibited the greatest power changes in the beta band, consistent with previous studies that highlight the most prominent EEG change as an increase in high-frequency (10–30 Hz) activity, particularly in the frontotemporal regions, during noxious stimuli in healthy term infants [38]. The C3 and C4 channels exhibited most prominent relative change in the low delta band, since the central brain region is associated with the primary somatosensory cortex [44], which is responsible for receiving and processing sensory information related to pain [40]. As previously reported in the Van Der Vaart et al. study [21], they discovered that preterm infants respond to noxious stimuli by increasing power mostly in the delta, alpha, and high beta bands at Cz, with the low delta being the most important band for classifying pain and non-pain. However, this study focused specifically on the brain response at Cz, whereas our study investigated the frontal, central, temporal, and occipital regions, but not Cz. Since peripheral nociceptors and cortical pain perception are fully mature and functional by 24 weeks of gestation [1,6,45], infants are able to localize pain and exhibit reflexive motor responses after this developmental stage [1]. This suggests that central brain regions respond dominantly to procedural pain in the low delta frequency band.
In this study, both absolute EEG power and the power ratio (relative to baseline) were calculated to capture different aspects of brain activity. This dual analysis approach allows us to capture both the magnitude and proportional dynamics of EEG responses to procedural pain across different frequencies within the specified time period. To facilitate clinical translation, future bedside monitoring approaches could incorporate a moving-window integration of painful stimuli-sensitive EEG power in the beta or delta bands following noxious stimulation. The normalization of this integrated measure to an individualized baseline may provide an objective marker of recovery from pain-related cortical activity, thereby enabling real-time clinical assessment and timely caregiver intervention.
This study has some limitations that warrant further investigation. For the current analysis, we only examined a monopolar analysis of EEG power. Future studies may benefit from incorporating brain functional connectivity analysis, to investigate changes in the interaction between different brain regions during the painful procedure and the recovery stage. As this study focused solely on EEG measurements, combining EEG with heart rate, near-infrared spectroscopy, or neonatal pain scales might provide more informative insights into interpreting EEG findings in the context of physiological and behavioral states. Also, we did not control for sex distribution in the study, which may be associated with differences in EEG responses to painful stimulation and could introduce potential bias in the interpretation of the results. We further emphasize that future studies incorporating formal sleep-state classification are necessary to disentangle pain-specific effects from state-dependent EEG variability.
5. Conclusions
By focusing on the entire sequence of the EEG response—from initial perception to full recovery—this study revealed the temporal dynamics of cerebral recovery following procedural pain. Heel lancing induced significant increases in both EEG power and the EEG power ratio across all channels and frequency bands. These levels gradually declined, but remained significantly elevated at least until approximately four minutes post-procedure. Interestingly, persistent reduction relative to baseline was observed in the theta, alpha, and beta frequency bands during the recovery phase. Further refinement of EEG-based pain monitoring techniques is essential to facilitate the establishment of optimal pain management strategies for vulnerable infants. Specifically, to develop this technique into a clinically useful biosensor, it must be determined which metric of EEG power—either its peak intensity or time-integral—more accurately reflects the impact of a procedure and its association with long-term neurodevelopmental outcomes. Such biosensors may help ascertain whether specific treatments and care aimed at accelerating the recovery of cerebral activity to a resting state can ameliorate the potential long-term effects of noxious stimuli on the brain.
Supplementary Materials
The following supporting information can be downloaded at: https://www.mdpi.com/article/10.3390/app16031446/s1, Table S1: EEG power ratio values of eight channels in five frequency bands across time points.
Author Contributions
Conceptualization, O.I., T.S., C.H. and S.S.; methodology, O.I., T.S., C.H. and S.S.; software, N.H.; validation, N.H., O.I., K.Y. and M.H.; formal analysis, N.H.; investigation, T.S., C.H. and S.S.; resources, T.S., C.H. and S.S.; data curation, N.H.; writing—original draft preparation, N.H.; writing—review and editing, N.H., O.I., M.H. and K.Y.; visualization, N.H.; supervision, O.I. and K.Y.; project administration, O.I.; funding acquisition, O.I. and K.Y. All authors have read and agreed to the published version of the manuscript.
Funding
This research was funded by JSPS KAKENHI (Scientific Research (B) 24K02709), the Grant-in-Aid for Research in Nagoya City University (grant number 2024102) and the Japan Science and Technology Agency (FOREST Program, JPMJFR200I). O I was also funded by the Japanese Ministry of Education, Cult ure, Sports, Science and Technology (Grant-in-Aid for Scientific Research, 20H00102).
Institutional Review Board Statement
This study was conducted in accordance with the Declaration of Helsinki and approved by the Ethics Committee of Nagoya City University Graduate School of Medical Sciences, Nagoya, Japan (reference number: 60-20-0157, approved on 15 January 2021).
Informed Consent Statement
Written informed consent was obtained from all parents before data collection in accordance with the ethical principles of clinical research.
Data Availability Statement
The data presented in this study are available on request from the corresponding author due to participants of this study did not give written consent for their data to be shared publicly.
Acknowledgments
The authors would like to thank the participants’ parents for their consent and confidence in enabling their infants to participate in this study.
Conflicts of Interest
The authors declare no conflicts of interest.
References
- Perry, M.; Tan, Z.; Chen, J.; Weidig, T.; Xu, W.; Cong, X.S. Neonatal Pain. Crit. Care Nurs. Clin. N. Am. 2018, 30, 549–561. [Google Scholar] [CrossRef]
- Cruz, M.D.; Fernandes, A.M.; Oliveira, C.R. Epidemiology of painful procedures performed in neonates: A systematic review of observational studies. Eur. J. Pain 2016, 20, 489–498. [Google Scholar] [CrossRef] [PubMed]
- Rocha, V.A.D.; Silva, I.A.; Cruz-Machado, S.D.S.; Bueno, M. Painful procedures and pain management in newborns admitted to an intensive care unit. Rev. Esc. Enferm. USP 2021, 55, e20210232. [Google Scholar] [CrossRef] [PubMed]
- Britto, C.D.; Rao Pn, S.; Nesargi, S.; Nair, S.; Rao, S.; Thilagavathy, T.; Ramesh, A.; Bhat, S. PAIN--Perception and Assessment of Painful Procedures in the NICU. J. Trop. Pediatr. 2014, 60, 422–427. [Google Scholar] [CrossRef]
- Eckstein Grunau, R. Neonatal Pain in Very Preterm Infants: Long-Term Effects on Brain, Neurodevelopment and Pain Reactivity. Rambam Maimonides Med. J. 2013, 4, e0025. [Google Scholar] [CrossRef]
- Hatfield, L. Neonatal pain: What′s age got to do with it? Surg. Neurol. Int. 2014, 5, 479. [Google Scholar] [CrossRef]
- Committee on Fetus and Newborn and Section on Anesthesiology and Pain Medicine; Keels, E.; Sethna, N.; Watterberg, K.L.; Cummings, J.J.; Benitz, W.E.; Eichenwald, E.C.; Poindexter, B.B.; Stewart, D.L.; Aucott, S.W.; et al. Prevention and Management of Procedural Pain in the Neonate: An Update. Pediatrics 2016, 137, e20154271. [Google Scholar] [CrossRef]
- Evans, J.C. Physiology of acute pain in preterm infants. Newborn Infant Nurs. Rev. 2001, 1, 75–84. [Google Scholar] [CrossRef]
- Campbell-Yeo, M.; Eriksson, M.; Benoit, B. Assessment and Management of Pain in Preterm Infants: A Practice Update. Children 2022, 9, 244. [Google Scholar] [CrossRef]
- Zhang, H.; Zhou, Q.-Q.; Chen, H.; Hu, X.-Q.; Li, W.-G.; Bai, Y.; Han, J.-X.; Wang, Y.; Liang, Z.-H.; Chen, D.; et al. The applied principles of EEG analysis methods in neuroscience and clinical neurology. Mil. Med. Res. 2023, 10, 67. [Google Scholar] [CrossRef]
- Yen, C.; Lin, C.-L.; Chiang, M.-C. Exploring the Frontiers of Neuroimaging: A Review of Recent Advances in Understanding Brain Functioning and Disorders. Life 2023, 13, 1472. [Google Scholar] [CrossRef] [PubMed]
- Yordanova, J.; Nicolardi, V.; Malinowski, P.; Simione, L.; Aglioti, S.M.; Raffone, A.; Kolev, V. EEG oscillations reveal neuroplastic changes in pain processing associated with long-term meditation. Sci. Rep. 2025, 15, 10604. [Google Scholar] [CrossRef] [PubMed]
- Ploner, M.; Sorg, C.; Gross, J. Brain Rhythms of Pain. Trends Cogn. Sci. 2017, 21, 100–110. [Google Scholar] [CrossRef] [PubMed]
- Morales, S.; Bowers, M.E. Time-frequency analysis methods and their application in developmental EEG data. Dev. Cogn. Neurosci. 2022, 54, 101067. [Google Scholar] [CrossRef]
- Singh, A.K.; Krishnan, S. Trends in EEG signal feature extraction applications. Front. Artif. Intell. 2023, 5, 1072801. [Google Scholar] [CrossRef]
- Rashid, M.; Sulaiman, N.; P. P. Abdul Majeed, A.; Musa, R.M.; Ab. Nasir, A.F.; Bari, B.S.; Khatun, S. Current Status, Challenges, and Possible Solutions of EEG-Based Brain-Computer Interface: A Comprehensive Review. Front. Neurorobot. 2020, 14, 25. [Google Scholar] [CrossRef]
- Bârzan, H.; Ichim, A.-M.; Moca, V.V.; Mureşan, R.C. Time-Frequency Representations of Brain Oscillations: Which One Is Better? Front. Neuroinform. 2022, 16, 871904. [Google Scholar] [CrossRef]
- Hartley, C.; Duff, E.P.; Green, G.; Mellado, G.S.; Worley, A.; Rogers, R.; Slater, R. Nociceptive brain activity as a measure of analgesic efficacy in infants. Sci. Transl. Med. 2017, 9, eaah6122. [Google Scholar] [CrossRef]
- Goudman, L.; Laton, J.; Brouns, R.; Nagels, G.; Huysmans, E.; Buyl, R.; Ickmans, K.; Nijs, J.; Moens, M. Cortical mapping of painful electrical stimulation by quantitative electroencephalography: Unraveling the time–frequency–channel domain. JPR 2017, 10, 2675–2685. [Google Scholar] [CrossRef]
- Hohsoh, N.; Iwata, O.; Suzuki, T.; Hanai, C.; Huang, M.; Yokoyama, K. Quantification electroencephalography response to procedural pain during heel puncture in preterm infants. Physiol. Meas. 2025, 46, 065004. [Google Scholar] [CrossRef]
- Van Der Vaart, M.; Hartley, C.; Baxter, L.; Mellado, G.S.; Andritsou, F.; Cobo, M.M.; Fry, R.E.; Adams, E.; Fitzgibbon, S.; Slater, R. Premature infants display discriminable behavioral, physiological, and brain responses to noxious and nonnoxious stimuli. Cereb. Cortex 2022, 32, 3799–3815. [Google Scholar] [CrossRef]
- Verriotis, M.; Fabrizi, L.; Lee, A.; Cooper, R.J.; Fitzgerald, M.; Meek, J. Mapping Cortical Responses to Somatosensory Stimuli in Human Infants with Simultaneous Near-Infrared Spectroscopy and Event-Related Potential Recording. eNeuro 2016, 3, ENEURO.0026-16.2016. [Google Scholar] [CrossRef] [PubMed]
- Fabrizi, L.; Verriotis, M.; Williams, G.; Lee, A.; Meek, J.; Olhede, S.; Fitzgerald, M. Encoding of mechanical nociception differs in the adult and infant brain. Sci. Rep. 2016, 6, 28642. [Google Scholar] [CrossRef] [PubMed]
- Maimon, N.; Grunau, R.E.; Cepeda, I.L.; Friger, M.; Selnovik, L.; Gilat, S.; Shany, E. Electroencephalographic Activity in Response to Procedural Pain in Preterm Infants Born at 28 and 33 Weeks Gestational Age. Clin. J. Pain 2013, 29, 1044–1049. [Google Scholar] [CrossRef] [PubMed]
- Lavanga, M.; Bollen, B.; Caicedo, A.; Dereymaeker, A.; Jansen, K.; Ortibus, E.; Van Huffel, S.; Naulaers, G. The effect of early procedural pain in preterm infants on the maturation of electroencephalogram and heart rate variability. Pain 2021, 162, 1556–1566. [Google Scholar] [CrossRef]
- Toole, J.M.O.; Boylan, G.B. NEURAL: Quantitative features for newborn EEG using Matlab. arXiv 2017, arXiv:1704.05694. [Google Scholar] [CrossRef]
- Bajaj, N. Wavelets for EEG Analysis. In Wavelet Theory; Mohammady, S., Ed.; IntechOpen: London, UK, 2021; ISBN 978-1-83881-947-7. [Google Scholar]
- Hu, L.; Zhang, Z. (Eds.) EEG Signal Processing and Feature Extraction; Springer: Singapore, 2019; ISBN 978-981-13-9112-5. [Google Scholar]
- Cohen, M.X. A better way to define and describe Morlet wavelets for time-frequency analysis. NeuroImage 2019, 199, 81–86. [Google Scholar] [CrossRef]
- Gibbins, S.; Stevens, B.J.; Yamada, J.; Dionne, K.; Campbell-Yeo, M.; Lee, G.; Caddell, K.; Johnston, C.; Taddio, A. Validation of the Premature Infant Pain Profile-Revised (PIPP-R). Early Hum. Dev. 2014, 90, 189–193. [Google Scholar] [CrossRef]
- Stevens, B.J.; Gibbins, S.; Yamada, J.; Dionne, K.; Lee, G.; Johnston, C.; Taddio, A. The Premature Infant Pain Profile-Revised (PIPP-R): Initial Validation and Feasibility. Clin. J. Pain 2014, 30, 238–243. [Google Scholar] [CrossRef]
- Goksan, S.; Hartley, C.; Emery, F.; Cockrill, N.; Poorun, R.; Moultrie, F.; Rogers, R.; Campbell, J.; Sanders, M.; Adams, E.; et al. fMRI reveals neural activity overlap between adult and infant pain. eLife 2015, 4, e06356. [Google Scholar] [CrossRef]
- Bartocci, M.; Bergqvist, L.L.; Lagercrantz, H.; Anand, K.J.S. Pain activates cortical areas in the preterm newborn brain. Pain 2006, 122, 109–117. [Google Scholar] [CrossRef]
- Slater, R.; Cantarella, A.; Gallella, S.; Worley, A.; Boyd, S.; Meek, J.; Fitzgerald, M. Cortical Pain Responses in Human Infants. J. Neurosci. 2006, 26, 3662–3666. [Google Scholar] [CrossRef] [PubMed]
- Verriotis, M.; Chang, P.; Fitzgerald, M.; Fabrizi, L. The development of the nociceptive brain. Neuroscience 2016, 338, 207–219. [Google Scholar] [CrossRef] [PubMed]
- Fabrizi, L.; Slater, R.; Worley, A.; Meek, J.; Boyd, S.; Olhede, S.; Fitzgerald, M. A Shift in Sensory Processing that Enables the Developing Human Brain to Discriminate Touch from Pain. Curr. Biol. 2011, 21, 1552–1558. [Google Scholar] [CrossRef] [PubMed]
- Chan, D.W.S.; Yamazaki, M.; Akiyama, T.; Chu, B.; Donner, E.J.; Otsubo, H. Rapid oscillatory activity in delta brushes of premature and term neonatal EEG. Brain Dev. 2010, 32, 482–486. [Google Scholar] [CrossRef]
- Norman, E.; Rosén, I.; Vanhatalo, S.; Stjernqvist, K.; Ökland, O.; Fellman, V.; Hellström-Westas, L. Electroencephalographic Response to Procedural Pain in Healthy Term Newborn Infants. Pediatr. Res. 2008, 64, 429–434. [Google Scholar] [CrossRef]
- Mollet, G.A.; Harrison, D.W. Emotion and Pain: A Functional Cerebral Systems Integration. Neuropsychol. Rev. 2006, 16, 99–121. [Google Scholar] [CrossRef]
- Modares-Haghighi, P.; Boostani, R.; Nami, M.; Sanei, S. Quantification of pain severity using EEG-based functional connectivity. Biomed. Signal Process. Control 2021, 69, 102840. [Google Scholar] [CrossRef]
- Witteveen, I.F.; McCoy, E.; Holsworth, T.D.; Shen, C.Z.; Chang, W.; Nance, M.G.; Belkowitz, A.R.; Dougald, A.; Puglia, M.H.; Ribic, A. Preterm birth accelerates the maturation of spontaneous and resting activity in the visual cortex. Front. Integr. Neurosci. 2023, 17, 1149159. [Google Scholar] [CrossRef]
- González, J.J.; Mañas, S.; De Vera, L.; Méndez, L.D.; López, S.; Garrido, J.M.; Pereda, E. Assessment of electroencephalographic functional connectivity in term and preterm neonates. Clin. Neurophysiol. 2011, 122, 696–702. [Google Scholar] [CrossRef]
- Miltner, W.H.R.; Franz, M.; Naumann, E. Neuroscientific results of experimental studies on the control of acute pain with hypnosis and suggested analgesia. Front. Psychol. 2024, 15, 1371636. [Google Scholar] [CrossRef]
- De Klerk, C.C.J.M.; Johnson, M.H.; Southgate, V. An EEG study on the somatotopic organisation of sensorimotor cortex activation during action execution and observation in infancy. Dev. Cogn. Neurosci. 2015, 15, 1–10. [Google Scholar] [CrossRef]
- Thill, B. The fetal pain paradox. Front. Pain Res. 2023, 4, 1128530. [Google Scholar] [CrossRef]


Disclaimer/Publisher’s Note: The statements, opinions and data contained in all publications are solely those of the individual author(s) and contributor(s) and not of MDPI and/or the editor(s). MDPI and/or the editor(s) disclaim responsibility for any injury to people or property resulting from any ideas, methods, instructions or products referred to in the content. |
© 2026 by the authors. Licensee MDPI, Basel, Switzerland. This article is an open access article distributed under the terms and conditions of the Creative Commons Attribution (CC BY) license.