Abstract
In the proper management of construction, the use of BIM software allows for tracking of the entire lifecycle of buildings, enabling informed design and better management of the product lifecycle, easier collaboration among professionals, and a more efficient system. The combination of BIM tools and today’s information technologies allows the advantages of the BIM methodology to be amplified and expanded. In particular, creating a 3D model with BIM software and linking it to a data stream from sensors allows us to obtain a key component for a Digital Twin of a construction. By integrating BIM methodologies and Digital Twins, this manuscript describes the development of a Digital Twin prototype of a highway bridge, with a 3D model of the structure reproduced using BIM software serving as the core of the Digital Twin. To complete the Digital Twin architecture, an ADXL345 accelerometer sensor, a DTH22 humidity and temperature sensor, an ESP32 microcontroller, the Postgres database, Python (for communication between the backend and the frontend), and the JavaScript library CesiumJS were employed. This methodology produced a Digital Twin prototype capable of collecting vibration and temperature data from the previously mentioned sensors and displaying values through a graphical interface. It can be observed how this technology represents an expansion of the capabilities of BIM software, also highlighting the maintenance potential throughout the product lifecycle. Moreover, the technologies used make the methodology scalable, allowing additional BIMs to be added or the methodology to be applied in different contexts.
1. Introduction
A Building Information Model (BIM) represents an evolution of ordinary Computer-Aided Design, where the digital representation of the building is enriched with its physical and functional attributes [1]. A BIM shares all information (architectural, structural, electrical, etc.) about the model among all stakeholders, leading to the smoother integration of design, construction, and management processes, enhancing cooperation with specialists [2]. Studies [3,4] have also shown that projects that employ BIM methodologies present a cost reduction of up to 20%.
The application of BIM in the Architecture, Engineer, and Construction (AEC) sector is evident in a wide range of projects that highlight its potential in process optimization and construction sustainability [5,6,7]. A notable example is the Sydney Metro Project in Australia, where the adoption of an integrated BIM platform enabled the coordinated management of design, construction, and maintenance of one of the largest metropolitan infrastructures in the world. This approach led to enhanced quality control and reduced coordination times, demonstrating the effectiveness of the BIM in the management of complex infrastructure projects [8].
On a different scale, the Hammarby Sjöstad project in Sweden demonstrates the use of the BIM for sustainable urban planning; through digital modeling integrated with environmental and social data, it was possible to assess the energy lifecycle of neighborhoods and support strategic decisions for emission reduction and urban efficiency [9]. Another significant case is that of the Hinkley Point C nuclear power plant in the United Kingdom, where the BIM was used to manage high-security environments, enabling the traceability of millions of components and the coordination between highly specialized technical disciplines [10]. These examples demonstrate how the BIM, through different approaches, can be adapted to different scales and levels of design complexity, and how it has become a key technology for innovation and sustainability in the construction industry.
Besides AEC sector, the BIM is also employed in the cultural heritage sector [11,12,13,14]. In particular, authors from [15] combined the BIM and GIS information to a little village in Reggio Calabria, to obtain a preliminary framework for the digital twin (DT) of the village. Another study [16] presents an H-BIM (Heritage Building Information Modeling) approach designed to collect and manage data useful for seismic vulnerability analysis of monumental buildings. The method involves three main phases: geometric survey, scan-to-BIM modeling, and data collection. It was applied to the oldest part of Palazzo Vecchio in Florence, an important historic masonry structure. The BIM model was organized according to structural criteria to support the investigation of the existing building. Finally, a simplified seismic assessment was conducted, and its results were integrated into the H-BIM model, contributing to the continuous improvement of the database.
The BIM is also employed in combination with other tools, for example, it is often used together with Geographic Information System (GIS) software [17,18,19]. The integration of the BIM and GIS enables effective management of information throughout the various stages of a project’s lifecycle, namely planning, design, construction, operation, and maintenance. Within such a system, information on any spatial and temporal scale can be made available for different applications. Moreover, the effective management of heterogeneous data from various sources provides essential support for decision-making [20]. More in detail, Ref. [21] proposes an integrated approach to building energy management based on the combination of Building Information Modeling (BIM) and the Geographic Information System (GIS). The methodology allows detailed building information—such as geometry, materials, and systems—to be combined with spatial and environmental data from the surrounding area, creating a digital platform that supports energy efficiency analysis at the urban level. Through a case study in the municipality of Reggio Calabria, the authors show how BIM-GIS integration allows buildings to be visualized and evaluated in their urban context, promoting more informed decisions for sustainable planning and energy management optimization. The approach also highlights the challenges associated with the difference in scale and data formats between the two systems, emphasizing the importance of software tools capable of federating complex models and supporting more accurate and contextualized energy efficiency strategies.
BIM is also employed together with ITC technologies, such as Virtual Reality (VR) and Internet of Things (IoT) [22,23,24].
In Ref. [25] the authors developed a BIM environment based on VR and a game engine to face the key issues for building emergency management in order to obtain an immersive game environment to provide real-time fire evacuation guidance. Regarding BIM and IoT integration, a comprehensive review is offered by Ref. [26].
Nowadays, BIM technology is also employed in DT development [27]; several definitions of a DT were given among the years; according to Ref. [28], a DT is defined as an integrated simulation that combines multiple physical domains and scales of analysis, using a probabilistic approach to accurately represent a complex system. It is based on advanced physical models, along with sensor data and other inputs, to mirror and track the real-life behavior and evolution of its physical counterpart during its entire lifecycle.
More in detail, Ref. [29] develops an integrated ICT platform aimed at improving the design, construction, and performance of residential buildings. The platform was intended for use by citizens, AEC stakeholders, city administrations, and urban developers, enabling them to access and share data in a way that would optimize the construction process. In Ref. [30], authors present a new Digital Twin framework for real-time indoor environment monitoring and visualization that integrates BIM, IoT, autonomous robot-based mapping and sensing, and indoor positioning technologies.
The aim of this work is to propose and validate a novel, cost-effective, and scalable architecture for a BIM-based DT of linear infrastructure, focusing on real-time sensor data visualization using the CesiumJS (vers. 1.110; Cesium GS Inc., Philadelphia, PA, USA) geospatial platform, applied to a highway bridge in Reggio Calabria. In this context, the contribution of the present work lies in the definition of a low-cost and web-based BIM-based DT architecture, developed using freely accessible or open-source technologies, and specifically applied to linear infrastructure. The proposed methodology demonstrates how a georeferenced BIM can be integrated with real-time sensor data and visualized through a browser-based geospatial environment, ensuring accessibility, scalability, and replicability
The BIM was developed in Revit 2024 (vers. 2024.4; Autodesk Inc., San Rafael, CA, USA); meanwhile the DT is hosted by a CesiumJS platform; the data flux from the sensor is allowed by a Python (vers. 3.10; Python Software Foundation, Wilmington, DE, USA) backend.
The paper is structured as follows: the first section is dedicated to the introduction where the main theme of the proposed study is presented. Section 2 focuses on material and methods, where the IT procedure and the methodology for the realization of the prototype are detailed. Section 3 is dedicated to the obtained results. Section 4 discuss the preliminary results obtained. Section 5 is dedicated to the conclusion, highlighting the main limitations and the future developments.
2. Materials and Methods
In the following paragraph, the study object and the main components of the prototype will be described, with particular attention to their development, integration, and the material section of the BIM-based Digital Twin.
2.1. Study Area
The study object is a bridge on the A2 Highway, “Viadotto Annunziata”, which crosses the area of the river “Annunziata” in Reggio Calabria. The bridge is collocated near the city university in an urban zone, as shown in Figure 1.
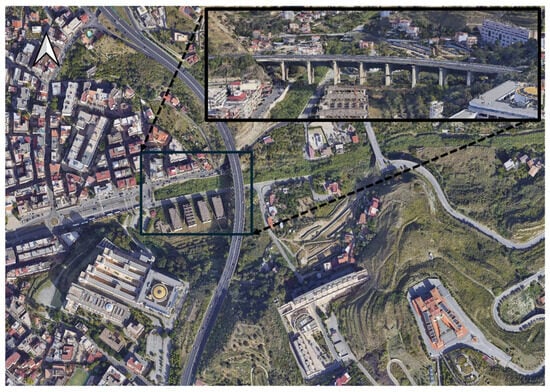
Figure 1.
Study object and study area.
2.2. Methodology
The overall workflow of the proposed BIM-based DT is divided into four phases that connect the geometric model, the physical sensor, the backend services, and the visualization interface.
The process starts with the creation of the BIM inside Autodesk Revit 2024 (vers. 2024.4; Autodesk Inc., San Rafael, CA, USA), where the main structural components are defined. The model is then uploaded and converted into a 3D Tiles format to CesiumION (Cesium GS Inc., Philadelphia, PA, USA). During this conversion, each element maintains a unique identifier that will be used to establish the connection between the virtual representation and the physical sensing layer.
The sensing layer is based on the ESP32 microcontroller (Espressif Systems, Shanghai, China), connected with two sensors:
- ADXL345 accelerometer (Analog Devices Inc., Wilmington, MA, USA);
- DHT22 temperature e humidity sensor (Aosong Electronics Co., Ltd., Guangzhou, China).
The ESP32 (Espressif Systems, Shanghai, China) periodically samples the sensing data, computes simple indicators such as peak and RMS acceleration values, and packages both acceleration and temperature measurements into lightweight JSON messages transmitted over Wi-Fi.
These data are received by a Python-based (vers. 3.10; Python Software Foundation, Wilmington, DE, USA) backend that exposes a REST API that is responsible for ingesting, validating, and timestamping the received data. The data are stored inside a database create in PostgresSQL (vers. 16.9, PostgreSQL Global Development Group)/PostGIS (vers. 3.5, PostGIS Steering Committee), where each record is associated with both the physical sensor node and the corresponding BIM element. Basic pre-processing is performed server-side, including the computation of sliding-window RMS values and the integration of thermal information, allowing the system to derive simple yet meaningful state indicators for each monitored component.
The obtained indicators are then compared with threshold values to assign a qualitative state (Warning or Critical) to BIM elements. This information is subsequently interrogated through the web application developed in CesiumJS (vers. 1.110; Cesium GS Inc., Philadelphia, PA, USA), which dynamically refreshes the 3D representation by changing the colors of the elements based on their current status and allowing the visualization of acceleration and temperature time series. Continuous integration between BIM geometry, actual measurements, and evaluation logic allows the three-dimensional model to reflect the actual behavior of the structure in near real time.
This final phase transforms everything into a true Digital Twin: the BIM ceases to be a simple static representation and becomes a dynamic, up-to-date digital replica, capable of representing the current state of the physical structure, highlighting anomalies, showing trends over time, and offering an environment in which the real and virtual bridges evolve together.
The workflow is resumed in the following figure, Figure 2.
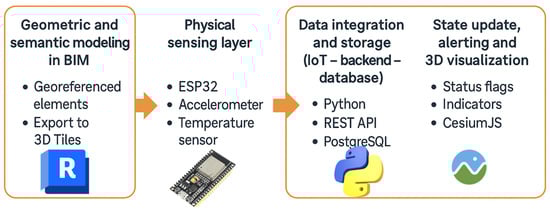
Figure 2.
Methodology workflow.
2.3. BIM Creation
For this experimentation we used Revit 2024 (vers. 2024.4; Autodesk Inc., San Rafael, CA, USA) software, which is owned by Autodesk Inc. (San Francisco, CA, USA).
The model creation started with the upload of two 3D models in .stl in order to obtain the Digital Terrain Model (DTM) and the surrounding buildings. The 3D model was obtained from www.opentopography.org (last accessed 18 November 2022) [31]. After the importation of .stl, the topology was created through the specific functionality “topographic solid”.
For the BIM of the bridge, the surface was created through the “floor” function, which was also used for the lateral section, despite their geometric versatility and the need for parametric control of slopes and layers within the Revit 2024 (vers. 2024.4; Autodesk Inc., San Rafael, CA, USA) environment. Although the floor category is primarily architectural, additional non-structural parameters were included to ensure semantic consistency within an infrastructural context. These include material type, layer thickness, and surface roughness.
This modeling choice allowed for correct geometric representation and information enrichment suitable for the current stage of DT development.
For the modeling of the bridge support structure, a generic concrete beam family was used and duplicated eight times to create the set of main girders of the deck.
For the pylons, a specific family was created, as shown in Figure 3. Creating families in Autodesk Revit 2024 (vers. 2024.4; Autodesk Inc., San Rafael, CA, USA) is a fundamental process for defining custom objects within the BIM. The Family Editor allows users to set up three-dimensional geometries controlled by dimensional constraints, parametric relationships, and family types. Each family is structured according to predefined categories (system or loadable) and can contain instance or type parameters for dynamic variable management. The resulting file (.rfa) can then be loaded into the project to ensure interoperability and standardization in the BIM workflow.
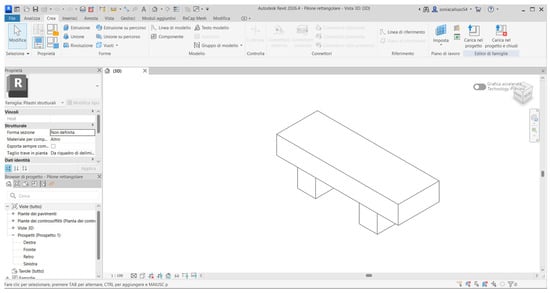
Figure 3.
Family creation.
Although the bridge girders were modeled using a generic concrete beam family replicated across the spans, this modeling choice is consistent with the Level of Information required for the present prototype. The objective of the study was not to produce a high-fidelity geometric replica of the Viadotto Annunziata but to validate the proposed end-to-end Digital Twin workflow. In this context, an LOD corresponding approximately to LOD 200 was deemed sufficient, as the focus lies on integrating sensor data, state visualization, and data streaming rather than representing as-built construction details. A higher LOD (e.g., 300–400) was not necessary for demonstrating the feasibility of the DT architecture. This distinction between the simplified prototype model and the true as-built conditions is acknowledged, and future developments will incorporate higher information requirements where operational applications demand it.
The elements were assembled with the aim of maintaining the highest possible consistency with the topographic surface. Some adjustments were performed using the “Edit Secondary Elements” tool, since the terrain does not represent an accurate topographic solid, as it was not generated from an actual survey but was obtained through free sources. The main limitation associated with the use of free topographic data for solid model generation is the reduced spatial and vertical resolution, which can introduce significant uncertainties in the representation of the actual morphology. Compared to advanced technologies such as LiDAR surveys or high-density photogrammetry, these datasets have lower altimetric accuracy and greater local variability.
In the following figure, Figure 4, we can see the complete model inside Revit 2024.3 software.
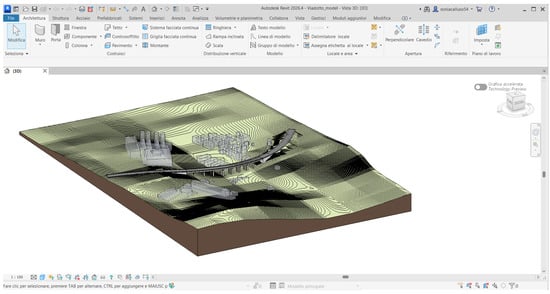
Figure 4.
Complete BIM inside Revit.
The last file was uploaded inside CesiumION through the specific plugin “CesiumION for Autodesk Revit”.
2.4. MCU and Sensors
For this study, Microcontroller Unit (MCU) ESP32 (Espressif Systems, Shanghai, China) was employed, as shown in Figure 5. This kind of MCU presents several advantages such as the following:
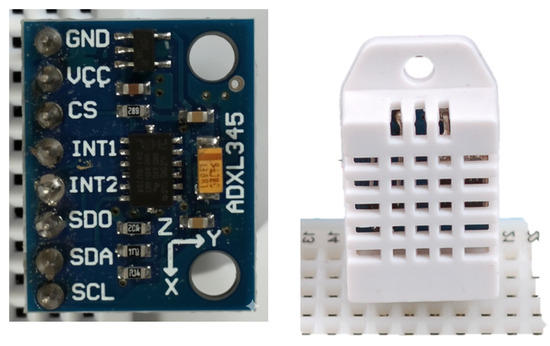
Figure 5.
ADXL345 three axis accelerator and DHT22 sensors.
- Integrated Wi-Fi and Bluetooth connectivity, crucial for real-time data transmission and remote monitoring.
- Low energy consumption.
- High processing power, thanks to its dual-core processor able to track, analyze data, and to spot anomalies.
- Wide range of peripheral interfaces, such as I2C, SPI, UART, DAC, and ADC.
- Cost-effectiveness, compared to other MCUs.
Regarding the sensors, an ADXL345 three-axis digital accelerometer (Analog Devices Inc., Wilmington, MA, USA), shown in Figure 5, was employed to measure acceleration and vibration levels of the system. The device provides high-resolution (13-bit) data for each axis and is capable of detecting both static and dynamic acceleration. Communication with the microcontroller is established via an I2C or SPI interface, ensuring reliable data transmission and low power consumption. The ADXL345 three-axis digital accelerometer (Analog Devices Inc., Wilmington, MA, USA) was connected to the ESP32 microcontroller using the I2C communication protocol, where the SDA and SCL pins of the sensor were linked to the corresponding pins on the ESP32 (Espressif Systems, Shanghai, China) (GPIO 21 for SDA and GPIO 22 for SCL). The VCC and GND pins were connected to the 3.3 V power output and ground, respectively. This configuration enables continuous acquisition of acceleration data, which is processed and transmitted for further analysis. The ADXL345 three-axis digital accelerometer (Analog Devices Inc., Wilmington, MA, USA) was selected due to its compact size, ±16 g measurement range, and high sensitivity, making it suitable for applications involving motion tracking, vibration monitoring, and structural health assessment. The ADXL345 three-axis digital accelerometer (Analog Devices Inc., Wilmington, MA, USA) accelerometer was configured with a sampling frequency of 100 Hz, which provides sufficient temporal resolution to capture the dominant modal frequencies expected for medium-span bridge structures (typically below 20 Hz) and vibration components induced by vehicular traffic.
According to the manufacturer’s datasheet, noise level is approximately 290 µg/√Hz in the x- and y-axes in normal power conditions. According to the previous 100 Hz sampling frequency, the theoretical RMS noise can be estimated at about 0.0015, which is significantly lower than the measured values (0.01–0.08 g). These findings suggest that the data reflect actual structural responses to environmental factors and light traffic, rather than being mere artifacts of sensor instrumentation. Nevertheless, the ADXL345 three-axis digital accelerometer (Analog Devices Inc., Wilmington, MA, USA) is not intended to compete with seismic-grade accelerometers and is not suitable for high-precision operational modal analysis of large bridges. In this prototype, it was deliberately selected as a low-cost device in order to validate the proposed BIM-based Digital Twin architecture and the end-to-end data pipeline.
Furthermore, a DHT22 digital temperature and humidity sensor (Aosong Electronics Co., Ltd., Guangzhou, China) digital temperature and humidity sensor was integrated into the monitoring node. The addition of thermal measurements provides valuable contextual information for interpreting the vibration data, as temperature variations can influence material stiffness and boundary conditions. DHT22 digital temperature and humidity sensor (Aosong Electronics Co., Ltd., Guangzhou, China) was chosen due to its low cost, and easy integration with ESP32 microcontroller (Espressif Systems, Shanghai, China), making it suitable for a long-term structural monitoring application. The sensor communicates through a single-wire digital interface, requiring only one GPIO pin on the microcontroller. In this study, the DATA pin of the DHT22 digital temperature and humidity sensor (Aosong Electronics Co., Ltd., Guangzhou, China) was connected to GPIO 4 of the ESP32 ESP32 microcontroller (Espressif Systems, Shanghai, China), while the VCC and GND pins were connected to the 3.3 V power supply and ground, respectively.
This value represents a trade-off between temporal resolution and computational efficiency on the ESP32 microcontroller (Espressif Systems, Shanghai, China), ensuring stable data transmission over the wireless link without packet loss.
The energy supply was ensured by a solar power bank; meanwhile, the internet connection was ensured through a local hotspot connection.
Lastly, the following figure, Figure 6, shows the wiring connection between the MCU and the sensor.
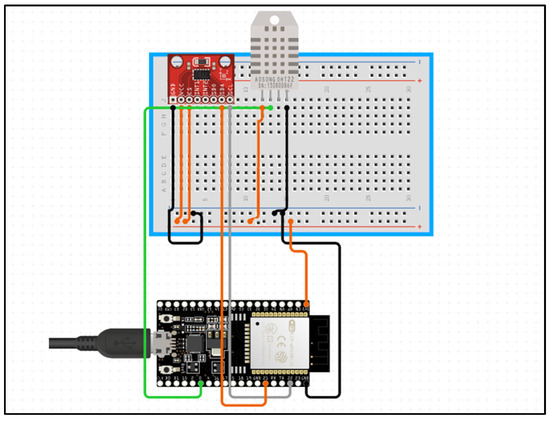
Figure 6.
Wired diagram connection of esp32 and ADXL 345.
In this first experimentation, the sensor and MCU were installed on a single pillar of the bridge at a height of about 2.5 m. The pillar closer to the Wi-Fi hotspot and the system were fixed via a fast-setting two-component epoxy resin, as it can be easily removed with solvents and it is impossible to drill holes in public infrastructure.
2.5. Platform Structure and Development
The architecture of the platform is based on three main components: a frontend, a backend, developed in Python (ver. 3.10, Python Software Foundation, Wilmington, DE, USA) and a database.
The frontend architecture integrates CesiumJS (vers. 1.110; Cesium GS Inc., Philadelphia, PA, USA)) and Chart.js (vers. 3.9.1) as core JavaScript libraries, while CSS was employed for responsive and aesthetic interface design. CesiumJS (vers. 1.110; Cesium GS Inc., Philadelphia, PA, USA) enables the rendering and interaction with 3D geospatial BIM data, whereas Chart.js (vers. 3.9.1); manages the real-time visualization of sensor values.
The frontend structure is shown in the following figure, Figure 7.

Figure 7.
Frontend structure.
The backend was developed in Python (ver. 3.10, Python Software Foundation, Wilmington, DE, USA) and structured using a FastAPI micro-framework (vers. 0.121), which provides a lightweight but flexible environment for exposing RESTful API endpoints. Endpoints manage bidirectional communication between the sensing layer and the web-based visualization interface. The use of FastAPI micro-framework (vers. 0.121) enables modular routing, JSON serialization, and fluid integration with background services.
Furthermore, several dedicated Python libraries were incorporated to support backend operations. In detail, psycopg2 (vers. 2.9.11) was employed to interact with the Postgres database. Data ingestion from the ESP32 sensor nodes was managed using the paho-mqtt (vers. 2.1.0) library. This architecture ensures low latency communication with the physical layer and supports scalable data acquisition.
For data storage, processing, and long-term analysis, Postgres (PostgresSQL (vers. 16.9, PostgreSQL Global Development Group) was adopted as the primary relational database. The database was extended with the PostGIS (vers. 3.5, PostGIS Steering Committee) extension, enabling geospatial capabilities, which are essential for linking each sensor record to its corresponding BIM element and geographic position within the 3D model. This integration allows spatial queries, spatial indexing, and the possibility of advanced geospatial analysis in future development.
The following figure, Figure 8, summarizes the architecture of the platform and the workflow of the methodology.
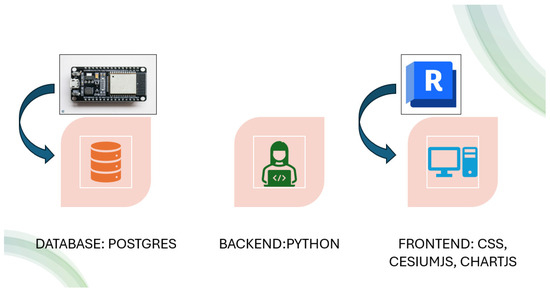
Figure 8.
Platform architecture and workflow.
3. Results
Figure 9 shows the BIM of the bridge uploaded into the CesiumION online platform. The use of CesiumION enables the model to be hosted as a 3D Tiles resource within a private online workspace. This approach provides several advantages: reduces local computational load, since the model geometry is streamed on demand; allows precise geospatial alignment, enabling the user to correct the model position directly in the CesiumION environment when original coordinates are unavailable or inaccurate; ensures that the BIM resource remains remotely accessible, allowing continuous integration with other online data flows.
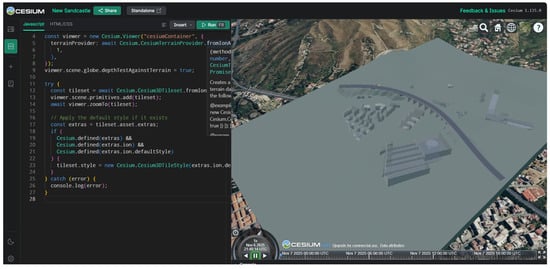
Figure 9.
BIM inside CesiumION platform.
Each uploaded resource is automatically assigned to a unique asset ID, which is used by the CesiumJS (vers. 1.110; Cesium GS Inc., Philadelphia, PA, USA) frontend to dynamically recall and visualize the model in the web platform, maintaining a live connection between the BIM database and the 3D visualization layer.
The imported BIM retains its semantic information when visualized in CesiumJS (vers. 1.110; Cesium GS Inc., Philadelphia, PA, USA). Each element, such as families, categories, materials, volumes, and areas, can be queried interactively through the web interface, as shown in Figure 10.
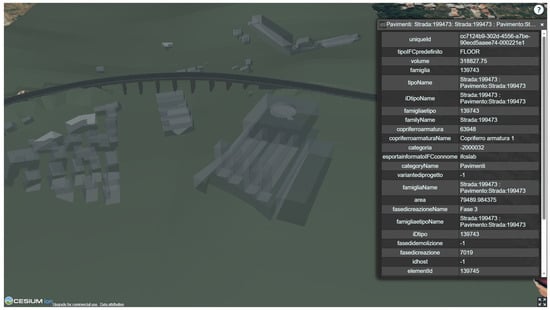
Figure 10.
BIM characteristics inside platform.
This demonstrates that the BIM serves not only as a geometric representation but also as a semantic data container, capable of supporting further layers of monitoring and management information. In this sense, the integration within CesiumJS (vers. 1.110; Cesium GS Inc., Philadelphia, PA, USA) confirms the central role of the BIM as the core of interoperability: technical and geometric information remains available to the user in a web-based environment, thus opening the possibility of linking real-time data streams to specific structural components.
The platform connects the BIM with real-time vibration data acquired from an ADXL345 triaxial digital accelerometer (Analog Devices Inc., Wilmington, MA, USA) and a DHT22 temperature and humidity sensor (Aosong Electronics Co., Ltd., Guangzhou, China), installed on the deck and connected to an ESP32 microcontroller (Espressif Systems, Shanghai, China). The first sensor measures vibration in terms of Root Mean Square (RMS) acceleration, expressed in units of gravitational acceleration (g). In the experimental setup, the sensor was configured with a sampling frequency of 100 Hz, ensuring adequate resolution for detecting the low-frequency oscillations typically associated with bridge dynamics and ambient traffic.
The DHT22 temperature and humidity sensor (Aosong Electronics Co., Ltd., Guangzhou, China) provides ambient temperature and relative humidity measurements at 1 Hz, a rate sufficient to capture slow environmental variations relevant to structural interpretation.
The ESP32 microcontroller (Espressif Systems, Shanghai, China) processes data locally and transmits averaged RMS values together with the most recent temperature readings every 2 s to the backend server via the MQTT protocol.
The backend, implemented in Python (vers. 3.10; Python Software Foundation, Wilmington, DE, USA) using FastAPI (vers. 0.121), broadcasts this data in real time to the frontend through WebSocket communication. All readings are also stored in the backend database, allowing further analysis, statistical evaluations, and traceability.
Figure 11 shows the visualization of the RMS oscillation values over time, dynamically plotted using the Chart.js (vers. 1.110) library.
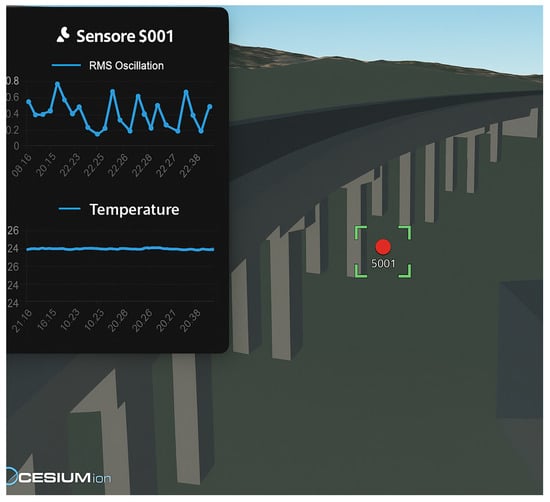
Figure 11.
Visual representation of data flux derived from the sensor. The red dot indicates the position of the sensor.
The Y-axis represents RMS acceleration (in g), while the X-axis represents the acquisition time.
During the prototype test, recorded values ranged between 0.01 g and 0.08 g, corresponding to low-intensity vibrations caused by ambient excitations and minor traffic.
The red dot (S001) displayed on the CesiumJS (vers. 1.110; Cesium GS Inc., Philadelphia, PA, USA) 3D scene identifies the physical location of the sensor within the model.
The Digital Twin continuously updates the condition state of each BIM element by combining real-time sensor measurements with the alert thresholds. When the ingested data exceed these values, i.e., an abnormal rise in RMS acceleration, the system automatically flags the affected component. As shown in the following figure, Figure 12, the corresponding bridge elements are highlighted in red within the 3D scene, and a warning banner is also displayed. The integrated visualization allows not only the identification of the presence or absence of anomalies, but also, its spatial location within the digital representation of the structure, supporting decision-making.
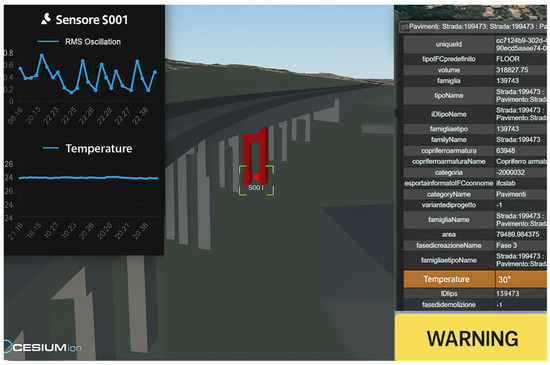
Figure 12.
Alert example.
The threshold values adopted for this study were chosen keeping in mind two critical aspects: the typical vibration levels observed in reinforced-concrete bridges, generally below 0.05 g in low traffic conditions, and the noise floor for the ADXL345 three-axis digital accelerometer (Analog Devices Inc., Wilmington, MA, USA), which for the adopted frequency is about 0.0015 g. In order to avoid false detections, the warning threshold was therefore set slightly above the typical ambient responses (>0.05 g) while the critical threshold was placed at 0.10 g to denote a substantially higher dynamic response. The adoption of these values provides a solid basis for the alert mechanism within the context of a prototype DT system.
For improved user experience, the interface includes a toggle option to show or hide the vibration chart (Figure 13a,b), allowing the user to focus either on the structural model or on the sensor data as needed.
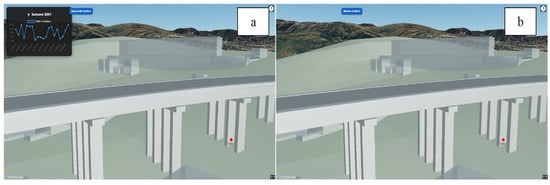
Figure 13.
Ability to show (a) or hide (b) sensor data graph.
The developed prototype primarily focuses on the architectural validation of the integration framework, rather than a quantitative structural assessment. However, the results confirm the stability of the data exchange architecture and the consistency of BIM semantics across the visualization and monitoring layers. The continuous, real-time synchronization between the physical and digital representations demonstrates the feasibility of a BIM-based Digital Twin architecture for structural monitoring.
From the database, data were exported regarding a specific day, 15 October 2025, and were analyzed, always inside SQL, in order to obtain the main statistic metric, Mean, Standard Deviation (STdev), Minimum (min), and Maximum (Max), to provide a preliminary statistical analysis. Analysis results are shown in Table 1.

Table 1.
Statistical analysis results derived from psql query.
To complement the descriptive statistics provided in Table 1, a basic frequency-domain analysis was performed in order to verify whether the recorded accelerations contained meaningful structural information. A Fast Fourier Transform (FFT) was applied to the acceleration time series acquired by sensor S001. The resulting spectrum, shown in Figure 14, exhibits a clear dominant peak around approximately 2–3 Hz, which is consistent with the expected vibration range for a medium-span reinforced-concrete viaduct under ambient excitation and light traffic.
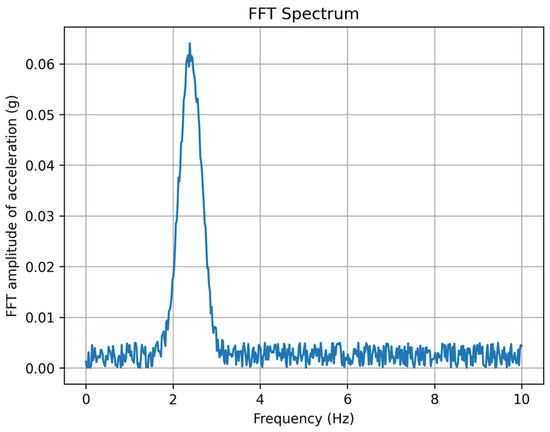
Figure 14.
Fast Fourier Transformation.
This result confirms that the measured response is not random fluctuation but reflects an identifiable dynamic signature of the structure. Although the analysis remains preliminary and is not intended to emulate full operational modal analysis, the presence of a stable frequency component demonstrates that the proposed low-cost monitoring node is capable of capturing meaningful dynamic behavior that can be integrated into the DTvisualization and alerting system.
4. Discussion
The paper shows an integrated approach to the construction of a BIM-Based Digital Twin with 3D geospatial visualization through CesiumJS (vers. 1.110; Cesium GS Inc., Philadelphia, PA, USA). At the moment, the experimentation focuses only on the collection of real-time sensor data and on the integration of the BIM into a web-based environment. The results confirm the stability of the proposed architecture and its suitability for real-time monitoring and smart management scenarios. A key aspect of the developed DT is the use of lightweight, widely available technologies, which makes the system economically sustainable and easily transferable. Moreover, the architecture proved to be particularly well suited to linear infrastructure, where geospatial context and continuous spatial representation play a crucial role.
The adoption of the BIM as the DT core represents the main advantage of the system. Actually, the BIM is not used as simple 3D geometry but as a semantic container of technical information, onto which dynamic data from real sensors can be projected. In this way, the 3D representation of the structure becomes the meeting point of the physical and digital world, allowing for associating the external variables, e.g., the vibration in this case, with its structural components.
From an architectural point of view, the platform implemented ensures scalability and modularity, making possible the extension to more complex scenarios. Another crucial aspect of this platform is its accessibility: the DT is accessible through a web browser, without the necessity of specific software.
The current prototype represents an initial implementation of a BIM-based Digital Twin, in which the geometric and semantic structure of the BIM remains static. In this study, sensor data are primarily used for real-time monitoring and visualization. However, in future developments, the same data streams could be exploited to enable physics-based simulations and predictive analyses. This evolution would allow the DT to move beyond monitoring toward simulation-driven decision support.
5. Conclusions
In conclusion, the work represents the first stage for the realization of a BIM-based DT dedicated to structural monitoring and smart management of complex infrastructure. From this experimentation was highlighted the possibility to integrate a traditional 3D BIM with sensor data in real time, also allowing for a continuous synchronization between the physical object and its digital representation. The BIM represents a central element of interoperability, allowing not only accurate geometric visualization but also properly semantic information management. This feature makes the BIM the core of the entire platform, connecting fields traditionally separated.
Future improvements can rely on the integration of time series from different sources and more installed sensors, as well as the integration of AI and machine learning algorithms.
Due to the platform’s structure, it is also possible to add more geometric models and sensor layers in order to have more DTs inside the same platform.
The ongoing work focuses on enabling the dynamic modification of BIM geometric properties based on real-time data through the use of 3D engines such as Unity (Unity Technologies, San Francisco, CA, USA)or Unreal Engine (Epic Games, Cary, NC, USA), integrated with CesiumJS (vers. 1.110; Cesium GS Inc., Philadelphia, PA, USA).
Author Contributions
Conceptualization, V.B., C.M., E.G. and S.C.; methodology, V.B., C.M., E.G. and S.C.; software, V.B., C.M., E.G. and S.C.; validation, V.B., C.M., E.G. and S.C.; formal analysis, V.B., C.M., E.G. and S.C.; investigation, V.B., C.M., E.G. and S.C.; resources, V.B., C.M., E.G. and S.C.; data curation, V.B., C.M., E.G. and S.C.; writing—original draft preparation, V.B., C.M., E.G. and S.C.; writing—review and editing, V.B., C.M., E.G. and S.C.; visualization, V.B., C.M., E.G. and S.C.; supervision, V.B., C.M., E.G. and S.C.; project administration, V.B., C.M., E.G. and S.C.; funding acquisition, V.B., C.M., E.G. and S.C. All authors have read and agreed to the published version of the manuscript.
Funding
This research received no external funding.
Institutional Review Board Statement
Not applicable.
Informed Consent Statement
Not applicable.
Data Availability Statement
The original contributions presented in this study are included in the article. Further inquiries can be directed to the corresponding author.
Conflicts of Interest
The authors declare no conflicts of interest.
Abbreviations
The following abbreviations are used in this manuscript:
| BIM | Building Information Model |
| AEC | Architectural, Engineer, Construction |
| GIS | Geographic Information System |
| H-BIM | Historical Building Information Model |
| DT | Digital Twin |
| MCU | Micro Controller Unit |
References
- Pan, X.; Khan, A.M.; Eldin, S.M.; Aslam, F.; Rehman, S.K.U.; Jameel, M. BIM adoption in sustainability, energy modelling and implementing using ISO 19650: A review. Ain Shams Eng. J. 2024, 15, 102252. [Google Scholar] [CrossRef]
- Zhou, X.; Ma, C.; Wang, M.; Guo, M.; Guo, Z.; Liang, X.; Han, J. BIM product recommendation for intelligent design using style learning. J. Build. Eng. 2023, 73, 106701. [Google Scholar] [CrossRef]
- Çepni, Y. BIM-Based Formwork and Cladding Quantity Take-Off Using Visual Programing. Master’s Thesis, Middle East Technical University, Ankara, Turkey, 2021. [Google Scholar]
- Zhang, Y.; Jiang, X.; Cui, C.; Skitmore, M. BIM-based approach for the integrated assessment of life cycle carbon emission intensity and life cycle costs. Build. Environ. 2022, 226, 109691. [Google Scholar] [CrossRef]
- Grilo, A.; Jardim-Goncalves, R. Challenging electronic procurement in the AEC sector: A BIM-based integrated perspective. Autom. Constr. 2011, 20, 107–114. [Google Scholar] [CrossRef]
- Herr, C.M.; Fischer, T. BIM adoption across the Chinese AEC industries: An extended BIM adoption model. J. Comput. Des. Eng. 2019, 6, 173–178. [Google Scholar]
- Mehran, D. Exploring the Adoption of BIM in the UAE Construction Industry for AEC Firms. Procedia Eng. 2016, 145, 1110–1118. [Google Scholar] [CrossRef]
- Shivasami, A.; Lai, D.; Dowdell, S.; Gklotsos, N.; Clifton, G.; Thorin, S. Early implementation of BIM in large infrastructure projects to manage complex interfaces in a dense urban environment. In Expanding Underground-Knowledge and Passion to Make a Positive Impact on the World; CRC Press: Boca Raton, FL, USA, 2023; pp. 2893–2901. [Google Scholar]
- Pandis Iverot, S.; Brandt, N. The development of a sustainable urban district in Hammarby Sjöstad, Stockholm, Sweden? Environ. Dev. Sustain. 2011, 13, 1043–1064. [Google Scholar] [CrossRef]
- Bui, N.H.; Charles, P.; Blieck, H. Nuclear civil engineering towards the simplification and digitalisation. In Congrès International de Géotechnique–Ouvrages–Structures; Springer: Singapore, 2017; pp. 1134–1141. [Google Scholar]
- Iadanza, E.; Maietti, F.; Ziri, A.E.; Di Giulio, R.; Medici, M.; Ferrari, F.; Bonsma, P.; Turillazzi, B. Semantic web technologies meet BIM for accessing and understanding cultural heritage. Int. Arch. Photogramm. Remote Sens. Spat. Inf. Sci. 2019, 42, 381–388. [Google Scholar]
- López, F.J.; Lerones, P.M.; Llamas, J.; Gómez-García-Bermejo, J.; Zalama, E. A review of heritage building information modeling (H-BIM). Multimodal Technol. Interact. 2018, 2, 21. [Google Scholar] [CrossRef]
- Grazianova, M.; Mesaros, P. Cultural heritage management from traditional methods to digital systems: A review from bim to digital twin. In E3S Web of Conferences; EDP Sciences: Les Ulis, France, 2024; Volume 550, p. 01015. [Google Scholar]
- EDP Sciences; Crisan, A.; Pepe, M.; Costantino, D.; Herban, S. From 3D point cloud to an intelligent model set for cultural heritage conservation. Heritage 2024, 7, 1419–1437. [Google Scholar] [CrossRef]
- Genovese, E.; Bilotta, G.; Calluso, S.; Maesano, C.; Manti, M.P.; Barrile, V. Innovation in the Monitoring and Control of Cultural Heritage: An Integrated BIM-GIS Approach. In Proceedings of the Italian Conference on Geomatics and Geospatial Technologies, Padua, Italy, 9–13 December 2024; Springer Nature: Cham, Switzerland, 2024; pp. 121–131. [Google Scholar]
- Cardinali, V.; Ciuffreda, A.L.; Coli, M.; De Stefano, M.; Meli, F.; Tanganelli, M.; Trovatelli, F. An Oriented H-BIM Approach for the Seismic Assessment of Cultural Heritage Buildings: Palazzo Vecchio in Florence. Buildings 2023, 13, 913. [Google Scholar] [CrossRef]
- Pelden, S.; Banihashemi, S.; Mohandes, S.R.; Arashpour, M.; Kalantari, M. Enhancing infrastructure planning and design through BIM-GIS integration. Struct. Infrastruct. Eng. 2025, 1–20. [Google Scholar] [CrossRef]
- Demir, S.; Yomralioglu, T. Bridging geo-data and natural gas pipeline design standards: A systematic review of BIM-GIS integration for natural gas pipeline asset management. Energies 2024, 17, 2306. [Google Scholar]
- Barrile, V.; La Foresta, F.; Calcagno, S.; Genovese, E. Innovative System for BIM/GIS Integration in the Context of Urban Sustainability. Appl. Sci. 2024, 14, 8704. [Google Scholar] [CrossRef]
- Liu, X.; Wang, X.; Wright, G.; Cheng, J.C.; Li, X.; Liu, R. A state-of-the-art review on the integration of Building Information Modeling (BIM) and Geographic Information System (GIS). ISPRS Int. J. Geo-Inf. 2017, 6, 53. [Google Scholar]
- Barrile, V.; Genovese, E.; Favasuli, F. Development and application of an integrated BIM-GIS system for the energy management of buildings. WSEAS Trans. Power Syst. 2023, 18, 232–240. [Google Scholar] [CrossRef]
- Abdelalim, A.M.; Essawy, A.; Alnaser, A.A.; Shibeika, A.; Sherif, A. Digital trio: Integration of BIM–EIR–IoT for facilities management of mega construction projects. Sustainability 2024, 16, 6348. [Google Scholar] [CrossRef]
- Rangasamy, V.; Yang, J.B. The convergence of BIM, AI and IoT: Reshaping the future of prefabricated construction. J. Build. Eng. 2024, 84, 108606. [Google Scholar] [CrossRef]
- Liu, X.; Antwi-Afari, M.F.; Li, J.; Zhang, Y.; Manu, P. BIM, IoT, and GIS integration in construction resource monitoring. Autom. Constr. 2025, 174, 106149. [Google Scholar] [CrossRef]
- Wang, B.; Li, H.; Rezgui, Y.; Bradley, A.; Ong, H.N. BIM Based Virtual Environment for Fire Emergency Evacuation. Sci. World J. 2014, 2014, 589016. [Google Scholar] [CrossRef]
- Tang, S.; Shelden, D.R.; Eastman, C.M.; Pishdad-Bozorgi, P.; Gao, X. A review of building information modeling (BIM) and the internet of things (IoT) devices integration: Present status and future trends. Autom. Constr. 2019, 101, 127–139. [Google Scholar] [CrossRef]
- Baghalzadeh Shishehgarkhaneh, M.; Keivani, A.; Moehler, R.C.; Jelodari, N.; Roshdi Laleh, S. Internet of Things (IoT), Building Information Modeling (BIM), and Digital Twin (DT) in construction industry: A review, bibliometric, and network analysis. Buildings 2022, 12, 1503. [Google Scholar] [CrossRef]
- Tao, F.; Cheng, J.; Qi, Q.; Zhang, M.; Zhang, H.; Sui, F. Digital twin-driven product design, manufacturing and service with big data. Int. J. Adv. Manuf. Technol. 2017, 10, 2233. [Google Scholar] [CrossRef]
- Alonso, R.; Borras, M.; Koppelaar, R.H.E.M.; Lodigiani, A.; Loscos, E.; Yöntem, E. SPHERE: BIM Digital Twin Platform. Proceedings 2019, 20, 9. [Google Scholar] [CrossRef]
- Hu, X.; Assaad, R.H. A BIM-enabled digital twin framework for real-time indoor environment monitoring and visualization by integrating autonomous robotics, LiDAR-based 3D mobile mapping, IoT sensing, and indoor positioning technologies. J. Build. Eng. 2024, 86, 108901. [Google Scholar] [CrossRef]
- NASA Shuttle Radar Topography Mission (SRTM). Shuttle Radar Topography Mission (SRTM) Global. Distributed by OpenTopography. 2013. Available online: https://portal.opentopography.org/datasetMetadata?otCollectionID=OT.042013.4326.1 (accessed on 18 November 2022).


Disclaimer/Publisher’s Note: The statements, opinions and data contained in all publications are solely those of the individual author(s) and contributor(s) and not of MDPI and/or the editor(s). MDPI and/or the editor(s) disclaim responsibility for any injury to people or property resulting from any ideas, methods, instructions or products referred to in the content. |
© 2026 by the authors. Licensee MDPI, Basel, Switzerland. This article is an open access article distributed under the terms and conditions of the Creative Commons Attribution (CC BY) license.