Abstract
This study tackles the critical challenges of stress evolution and pillar optimization in underground potash mining, with a focus on the 351-stope of Kaiyuan Mining in Laos. Integrating theoretical calculations, large-scale 3D numerical modeling, and an AHP-Fuzzy comprehensive evaluation, we systematically analyze the complex mechanical behaviors of the mining environment. Applying key stratum theory, we reveal the unique mechanism by which overlying hard rock bends without fracturing in carnallite layers under room-and-pillar conditions. Comparative numerical simulations of four pillar-width schemes—involving 8 m rooms with 10 m, 8 m, 6 m, and 4 m pillars—show that reducing pillar width markedly increases vertical stress, triggers exponential roof subsidence, and expands pillar failure zones. Using an AHP-Fuzzy method that incorporates safety, technical, and economic factors, the Simultaneous Backfilling with 8 m Mining and 6 m Pillar Retention is identified as the optimal scheme. This configuration demonstrates superior stability, exhibiting an average pillar stress of 9.3 MPa and only limited plastic failure zones at pillar ends. These findings offer a robust scientific and technical foundation for enhancing the safety, efficiency, and sustainability of underground potash mining operations.
1. Introduction
Potash, a key strategic mineral resource, is vital to global food security and sustainable agricultural development [1,2,3,4]. With ongoing population growth and agricultural intensification, global potash consumption continues to rise, raising concerns over the stability and security of supply [5,6,7]. As the world’s largest potash consumer, China faces long-term challenges due to limited domestic resources, with external dependence consistently exceeding 50%. This situation not only increases agricultural production costs and vulnerability but also poses risks to national food security. In response, China has actively pursued overseas investment under its “going global” strategy, developing potash resources in regions such as Central and Southeast Asia. Deep underground solid potash deposits in Laos, for instance, have become strategic assets, driving a technological shift from traditional salt-lake extraction to the underground mining of deep, complex solid potash orebodies [8,9,10]. This transition, however, introduces significant engineering challenges, particularly concerning the long-term stability of soft surrounding rock and the safe, efficient design of mine layouts.
In underground mining, pillar sizing is a fundamental design issue directly affecting both operational safety and resource recovery [11,12,13]. For coal and metal mines, pillar design benefits from decades of empirical, analytical, and numerical research, resulting in relatively mature criteria for hard to moderately strong rock conditions [14,15]. In contrast, potash deposits often exhibit unfavorable mechanical properties: potash ore and surrounding rock are typically soft, with low uniaxial compressive strength (generally below 15 MPa) and pronounced time-dependent creep behavior [16]. Consequently, the long-term strength of potash pillars may be only 60–70% of their instantaneous strength, with substantial deformation accumulating under sustained load [17,18]. Conventional pillar design methods, based largely on instantaneous strength and elastic–plastic assumptions, are therefore inadequate for accurately assessing the long-term stability and bearing capacity of potash pillars.
Engineering complexity is further increased by the presence of overlying hard rock strata (e.g., gypsum or anhydrite), which often form a stiff roof above the soft potash layer. Under mining disturbance, the mechanical interaction between the hard roof and the underlying soft pillars creates a coupled “stope–pillar–hard roof” system. The stiff roof can alter load transfer paths, induce arching effects, and significantly modify stress distributions within pillars and adjacent rock [19,20]. In particular, the stress evolution in central pillars and the development of high-stress zones are strongly influenced by the stiffness, thickness, and spatial position of these overlying hard layers. Traditional design approaches—such as those based on Terzaghi’s rock load theory or the Hoek–Brown criterion—typically assume hard rock behavior, neglect creep, and rarely account rigorously for such rigid–flexible coupling. When applied directly to soft, creeping potash mines with strong roof–pillar interaction, these methods can misjudge pillar loads and long-term stability, resulting either in overly conservative designs that limit recovery or in unsafe layouts that increase failure risk.
Over recent decades, significant progress has been made in pillar stability research across various underground mining contexts [21,22,23,24]. Empirical formulas, numerical simulations, and field monitoring are widely used in coal, metal, and non-metallic mines to analyze pillar stress distribution, deformation, and failure modes [25,26,27]. However, several critical gaps remain when applying these approaches to potash mining. First, the effect of potash creep on long-term strength degradation is often overlooked in practice. Most existing methods still rely on instantaneous strength parameters and conventional safety factors, without quantitatively linking creep behavior to long-term bearing capacity [28]. Second, the mechanical coupling mechanism between overlying hard strata and underlying soft potash pillars is not fully understood. The influence of hard roof properties—such as thickness, stiffness, and burial depth—on load redistribution, stress arching, and the evolution of plastic and damage zones in pillars remains insufficiently quantified [29]. Third, current pillar optimization methods tend to focus on single objectives (e.g., maximizing safety or recovery), lacking a comprehensive multi-criteria framework that simultaneously addresses safety, technical feasibility, and economic efficiency under potash-specific geo-mechanical conditions.
Given these challenges, there is a clear need to develop pillar design theories and optimization methods tailored to the rheological behavior of soft rock and the rigid–flexible coupling characteristic of deep potash mines. The Laotian potash deposits, featuring deep solid potash orebodies overlain by hard roof strata, provide a representative setting to address these issues. In such mines, mining-induced stress redistribution, time-dependent pillar deformation, and the self-supporting behavior of the hard roof interact to control the evolution of the stress field, displacement field, and failure patterns in the stope system [30]. A thorough understanding of these coupled processes is essential for achieving safe, efficient, and economically viable potash extraction.
This study takes the Kyuan Mining 351-stope in a typical Laotian potash mine as its engineering background. A combined approach of theoretical analysis, three-dimensional numerical simulation (FLAC3D), and multi-criteria decision-making (AHP–Fuzzy comprehensive evaluation) is used to systematically investigate the mechanical behavior and stability of the “stope–pillar–hard roof” system under mining disturbance. The specific objectives are: (1) to establish a refined 3D numerical model of the stope, analyze the evolution of stress, deformation, and plastic zones in surrounding rock, and reveal the failure mechanisms and load-transfer characteristics of the coupled system; (2) to quantitatively evaluate the effects of potash creep and hard roof parameters (e.g., thickness and position) on pillar long-term strength and stability, clarifying the combined influence of rheology and roof structure; and (3) to develop an AHP–Fuzzy-based multi-factor decision model integrating safety, technical, and economic indicators, and apply it to optimize pillar width schemes. Through these efforts, this study aims to provide a more scientific theoretical basis and practical methodology for the safe, efficient, and economical mining of overseas deep solid potash resources.
The remainder of this paper is organized as follows. Section 2 describes the geological and engineering conditions of the Kyuan Mining 351-stope and summarizes relevant rock mechanical parameters. Section 3 introduces the theoretical framework and modeling approach, incorporating key strata theory and rheological behavior into the 3D numerical model, and analyzes stress, displacement, and plastic zone distributions under different pillar width scenarios. Section 3 also constructs the AHP–Fuzzy comprehensive evaluation system, establishes a multi-objective decision model for pillar design, and performs optimization and comparison of alternative schemes. Finally, Section 4 presents the main conclusions and discusses their implications for pillar design in similar deep underground potash mines, as well as potential directions for future research.
2. Project Setting and Geological Context
The 351-stope of Kaiyuan Mining in Laos was selected as the research subject for this study. This stope is excavated within a carnallite layer—a potassium-bearing mineral characterized by its colorless to white appearance, granular texture, and loosely structured form. Carnallite is transparent to opaque, highly deliquescent in air, and readily soluble in water, often exhibiting a pink hue when impurities are present. It has a bitter and salty taste, a greasy luster, a hardness of approximately 2–3, and a specific gravity of 1.3. The mineral is brittle, non-cleavable, fluorescent, and produces a violet flame coloration, confirming its potassium content. The location of 351-stope is shown in Figure 1, located west of the 352 belt roadway, south of the North 7 belt roadway, east of the North 8 belt haulage roadway, and north of the North 9 trackless roadway, the 351-stope comprises 28 mining rooms, 4 backfill roadways, and 2 development roadways, with a total length of 1425 m. The mining area employs a rectangular cross-section measuring 8000 mm in width and 4500 mm in height, yielding a cross-sectional area of 36 m2. Designed with an 8 m mining width and 10 m protective pillars, the stope is projected to yield 570,000 tons of salt ore, based on a specific gravity of 1.6. Using a continuous miner with a monthly production capacity of 50,000 tons, the estimated mining duration is 11.4 months.
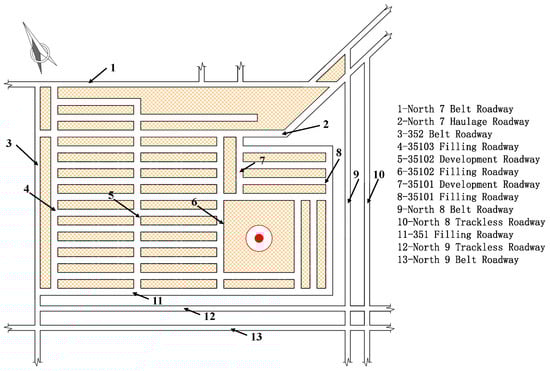
Figure 1.
351-Stope Location.
The mining area lies on an alluvial-proluvial plain along the east bank of the Mekong River. The terrain is generally flat, with elevations ranging from 141 to 145 m. Hydrologically, the area is primarily recharged by atmospheric precipitation and groundwater, exhibiting seasonal flow variations. Riverbed incision is typically less than 2.0 m deep, except near the Ban He Ang iron bridge in the southern section, where depths reach 5–8 m. Due to the gentle topography, low-lying zones are prone to inundation during flood seasons, with major flooding events occurring every 5–7 years and surface water depths reaching 1–3 m. Groundwater in the area can be classified as pore water and bedrock fissure water based on occurrence conditions. Geological surveys of surrounding ore layers indicate no aquifer presence within the 351-stope; nevertheless, a drainage system is required prior to mining to mitigate potential water hazards.
According to mining technical specifications, the panel strip room-and-pillar method with subsequent backfilling is adopted in this area, focusing primarily on room mining. Mining operations are conducted according to equipment capabilities, with the first layer extracted in each room and roadway following the designated room numbering sequence. Based on production and haulage planning, certain rooms are scheduled for undercutting first. The mining height is controlled within 16 m (adjusted according to actual ore thickness where the deposit is thinner). All rooms feature rectangular cross-sections, and slope design follows relevant geological profiles. Key physical and mechanical parameters of the main rock types, derived from geological exploration data and in-door experiments, are summarized in Table 1.

Table 1.
Basic Rock Physical and Mechanical Property Parameters for Potash Mining.
3. Results and Discussion
3.1. Numerical Calculation Analysis of Pillar Stability
3.1.1. Numerical Simulation Scheme
In this paper, the FLAC3D version 7.0 numerical simulation software is adopted to conduct simulation analysis on the stope structure parameters of the potash mine. FLAC3D (3D Fast Lagrangian Analysis Code) is a high-end 3D numerical analysis program developed based on the theory of continuous medium and explicit finite difference method. It is widely used in the analysis and design of geotechnical and mining engineering, and is particularly suitable for solving complex geotechnical problems that are difficult to handle by the Finite Element Method (FEM). It can simulate the stress characteristics and analyze the plastic flow of 3D structures of soil, rock and other materials, with typical application scenarios including large deformation, nonlinear material behavior, and the occurrence and development of instability and failure under complex multi-working conditions [31].
FLAC3D describes physical media from a 3D perspective. Compared with 2D analysis, the 3D analysis method can more truly reflect the morphological characteristics, stress conditions and corresponding stress–strain properties of the medium. Linear or nonlinear constitutive models can be selected for the element materials in the software. Under the action of external forces, when the material undergoes yield flow, the mesh can generate deformation and movement synchronously (large deformation mode). In terms of simulating plastic failure and plastic flow, FLAC3D adopts the “mixed discrete method”, which is more accurate and reasonable than the “discrete integration method” commonly used in the finite element method [32].
A large-scale numerical model measuring X × Y × Z = 200 m × 300 m × 219 m was established to simulate the mining process. The model incorporated ten geological strata with standard mechanical parameters, including eight overlying roof layers, one floor stratum, and the carnallite ore layer. The bottom and lateral boundaries were fixed. To accurately capture the stress evolution, surrounding rock damage, and spatial displacement patterns during potash extraction, selective mesh refinement was applied. Within the carnallite mining layer, the cross-sectional mesh size was refined to 1 m, while mesh sizes in other layers were appropriately coarsened. The mesh resolution in the Z-direction was determined proportionally based on the thickness of each layer. The corresponding model configuration is illustrated in the Figure 2 below.
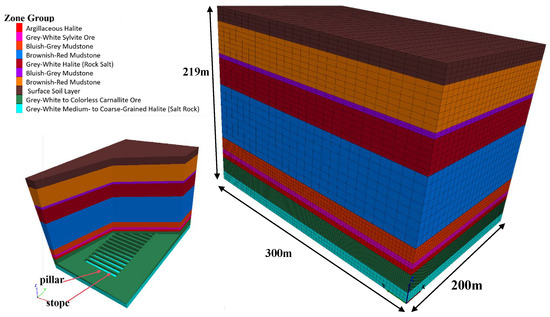
Figure 2.
Numerical Simulation Model for the Stope.
The numerical model employed the Mohr–Coulomb constitutive criterion with large-strain mode enabled. Prior to excavation, the model underwent an initial equilibrium stage to establish the in situ stress field, during which all displacements were reset to zero. Following this, full-scale stope excavation was simulated until the macroscopic stress field reached equilibrium. The model boundaries were fixed on all lateral sides and at the base. Within the simulation, the development roadways of the 351-stope were excavated first. After allowing the model to reach computational equilibrium, sequential room mining was conducted. Each room was excavated individually, with stress equilibrium achieved before proceeding to the next excavation step. To analyze the influence of pillar dimensions on the stress field, deformation field, and failure zone distribution, four different pillar width schemes were simulated. The specific configurations of these schemes are outlined in Table 2:
Table 2.
Basic Rock Physical and Mechanical Property Parameters for Potash Mining (The physical and mechanical properties of the rock are shown in the parameters of the Grey-White to Colorless Carnallite Ore formation in Table 1).
3.1.2. Analysis of Numerical Simulation Results
Numerical models were developed and simulated for four distinct pillar dimension schemes. In Scheme 1 (mine 8 m, pillar 10 m), 13 rooms were excavated sequentially; Scheme 2 (mine 8 m, pillar 8 m) involved 14 rooms; Scheme 3 (mine 8 m, pillar 6 m) comprised 16 rooms; and Scheme 4 (mine 4 m, pillar 10 m) included 18 rooms. For each scheme, the distribution of surrounding rock stress, displacement, and plastic failure zones following room excavation was analyzed.
- (1)
- Distribution Law of Surrounding Rock Stress Field for Different Pillar Widths
The underlying mechanism of surrounding rock damage involves its gradual transition from elastic deformation to plastic failure once the external stress exceeds the material’s inherent triaxial strength. Although deformation within the plastic zone is irreversible, the rock mass within this zone retains residual load-bearing capacity. The formation of a failure zone occurs as micro-scale damage within the plastic zone coalesces into macro-scale instability. In mining engineering, abutment pressure most effectively characterizes the regional stress distribution of the surrounding rock. Therefore, examining the general patterns of mining-induced lateral stress evolution—through the vertical stress response under various room excavation conditions—provides fundamental insights and data to guide subsequent analysis.
Taking Scheme 4 as an example, Figure 3 illustrates the characteristic stress changes in the surrounding rock during the mining process, based on the evolution of vertical stress at different excavation stages.
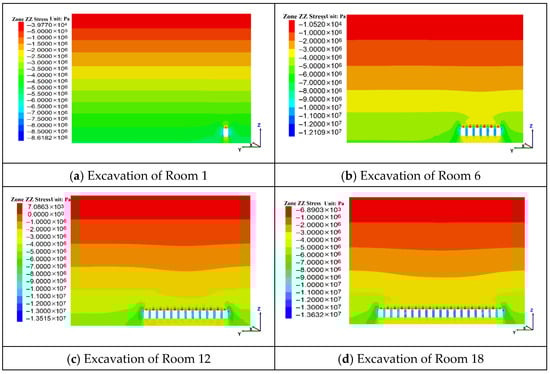
Figure 3.
Characteristics of Surrounding Rock Stress Changes at Different Mining Stages (Scheme 4).
During the excavation of Room 1, the limited mining scope resulted in a confined influence area. Vertical stress redistribution was localized around the room: stress reduction zones developed in the roof and floor, while stress concentration zones formed on both sides, with a peak stress of 8.61 MPa. As the number of excavated rooms increased, the range of stress disturbance expanded progressively. High-stress concentrations emerged within the pillars and the upper sidewalls of the rooms. The maximum stress reached 12.1 MPa upon the excavation of Room 6, and further increased to 13.5 MPa by Room 12, indicating that the stope had entered a fully mined state. When Room 18 was excavated, the peak stress reached 13.6 MPa, showing only a marginal increase.
The following section analyzes the stress distribution characteristics in the surrounding rock under different mining schemes.
Based on the vertical stress distribution contours under different mining schemes shown in Figure 4, it can be observed that as pillar width decreases, the stress disturbance range in the stope gradually expands and the stress concentration intensifies. The maximum vertical stresses for Schemes 1 through 4 are 10.8 MPa, 11.3 MPa, 11.9 MPa, and 13.7 MPa, respectively. The mining-induced stress influence zone in the roof extends approximately 30 m for Schemes 1, 2, and 3, whereas in Scheme 4 it reaches about 50 m. In Schemes 1 and 2, pillar stress concentration exhibits an “X”-shaped distribution pattern, with peak stress occurring at the bottom corners of the pillars. In contrast, Schemes 3 and 4 show overall high stress concentration throughout the pillars. In Scheme 4, influenced by the pressure arch effect in the stope, the central pillar experiences higher stress compared to the side pillars.
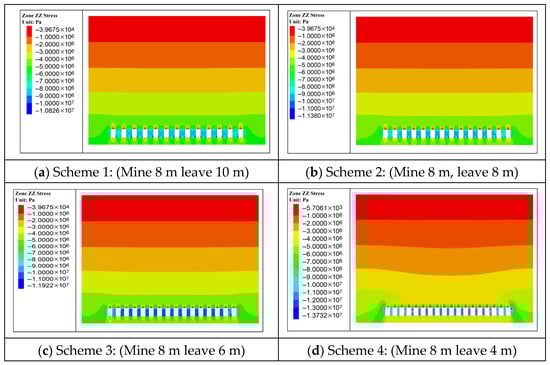
Figure 4.
Vertical Stress Distribution Contour under Different Mining Schemes (X = 100 m Section).
Figure 5 illustrates vertical stress profiles measured along the central pillars under the four mining schemes. Pillar stress is markedly higher than that in the adjacent roof and floor strata. Significant stress concentrations occur at both ends of the pillars. For Schemes 1 through 4, the maximum stress values at the pillar ends are 12.3 MPa, 13.2 MPa, 14.3 MPa, and 18.3 MPa, respectively. In Scheme 4, the reduced pillar dimensions result in an abrupt and pronounced increase in stress concentration.
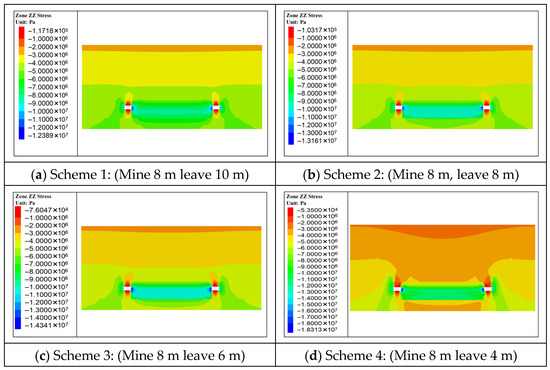
Figure 5.
Vertical Stress Distribution Contour under Different Mining Schemes (Y = 150 m Section).
Figure 6 presents the distribution of vertical stress on a horizontal section through the pillars for the different mining schemes. The results indicate that pillar stresses consistently exceed those in the surrounding rock, with pronounced stress concentrations occurring at both pillar ends. The maximum pillar stresses for Schemes 1 through 4 are 11.8 MPa, 12.6 MPa, 14.3 MPa, and 18.3 MPa, respectively. Among the four schemes, Scheme 4 exhibits the most significant degree of pillar stress concentration.
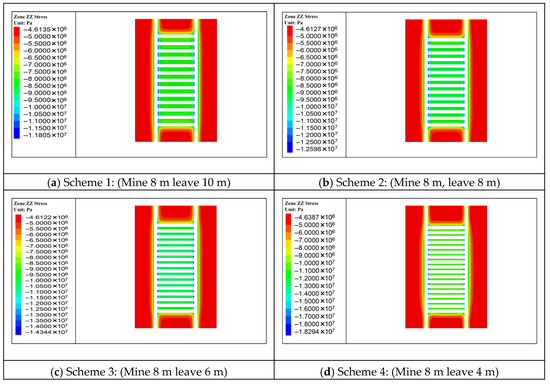
Figure 6.
Vertical Stress Distribution Contour under Different Mining Schemes (Z = 22 m Section).
The pillars, with a height of 14 m, were instrumented with monitoring lines at different elevations: Lines 1 through 5 correspond to pillar heights of 2 m, 5 m, 7 m, 9 m, and 12 m, respectively. As shown in Figure 7, the side pillars—supported by the surrounding rock—consistently experience lower stress compared to the central pillars. In Scheme 1, the average stresses along monitoring lines 1–5 are 7.2 MPa, 8.2 MPa, 8.4 MPa, 7.8 MPa, and 7.1 MPa, respectively. Scheme 2 yields corresponding averages of 7.4 MPa, 9.2 MPa, 9.4 MPa, 9.0 MPa, and 8.1 MPa, while Scheme 3 shows values of 8.8 MPa, 11.5 MPa, 11.4 MPa, 11.0 MPa, and 9.1 MPa. Across Schemes 1–3, the pillar stress distribution follows a characteristic pattern of higher stress in the middle and lower stress near the ends. In contrast, Scheme 4 exhibits average stresses of 11.3 MPa, 11.1 MPa, 11.0 MPa, 11.4 MPa, and 11.8 MPa along the same monitoring lines, revealing a distinct stress profile with elevated concentrations closer to the roof.
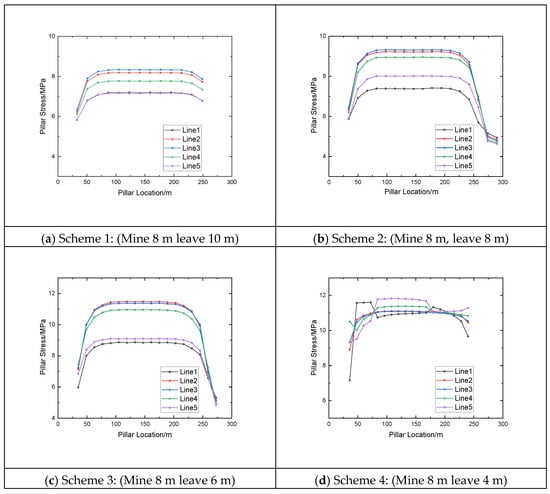
Figure 7.
Pillar Stress Distribution under Different Mining Schemes (Pillar Stress Monitoring Lines).
As shown in Figure 8, based on monitoring data collected from internal pillar points and lines, the average pillar stresses were calculated as 7.7 MPa for Scheme 1, 9.3 MPa for Scheme 2, 11.2 MPa for Scheme 3, and 11.8 MPa for Scheme 4. These results indicate that as pillar width decreases, the vertical stress borne by the pillars increases. Moreover, influenced by the pressure arch effect in the stope, the central pillars consistently experience higher stress than the side pillars.
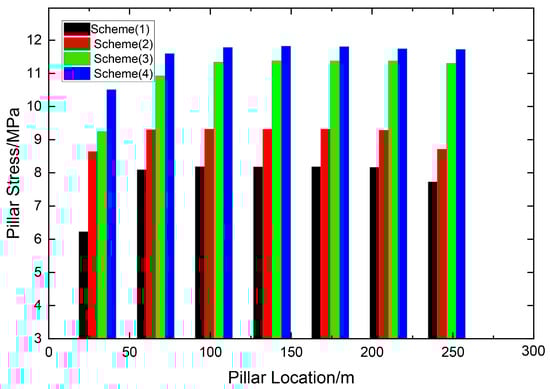
Figure 8.
Average Pillar Stress Distribution under Different Mining Schemes.
- (2)
- Distribution Law of Surrounding Rock Displacement Field for Different Pillar Widths
Mining operations inevitably induce bending and subsidence deformation in the roof strata. The following analysis examines the variation in the displacement field of the surrounding rock under different stages of room extraction and across the four mining schemes.
As shown in Figure 9, excavation of the first room induces initial deformation in the surrounding rock. The roof exhibits a maximum subsidence of 16.4 mm, while the floor experiences heave with a maximum value of 10.8 mm. As mining progresses, the enlargement of the excavated space leads to increased roof displacement. By the sixth room, the maximum roof subsidence reaches 99.5 mm. Upon excavation of the 14th room, the roof begins to subside fully, with maximum subsidence increasing to 219.2 mm. When the 18th room is excavated, roof subsidence peaks at 235.7 mm. The deformation profile of the roof layer displays a characteristic symmetrical arch-shaped subsidence pattern.
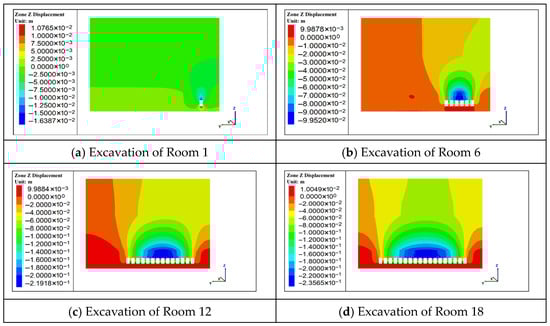
Figure 9.
Vertical Displacement Contour under Different Room Excavation Conditions for Scheme 4.
As illustrated in Figure 10, roof subsidence increases with decreasing pillar width, exhibiting a settlement funnel profile characterized by greater displacement in the central region and lesser displacement toward the sides. In Schemes 1 through 3, mining induces overall roof settlement, with the maximum subsidence occurring at the midpoint of each room—except at the stope extremities. In contrast, Scheme 4—where pillars are narrowest—results in pervasive roof settlement, with peak subsidence concentrated in the central portion of the stope.
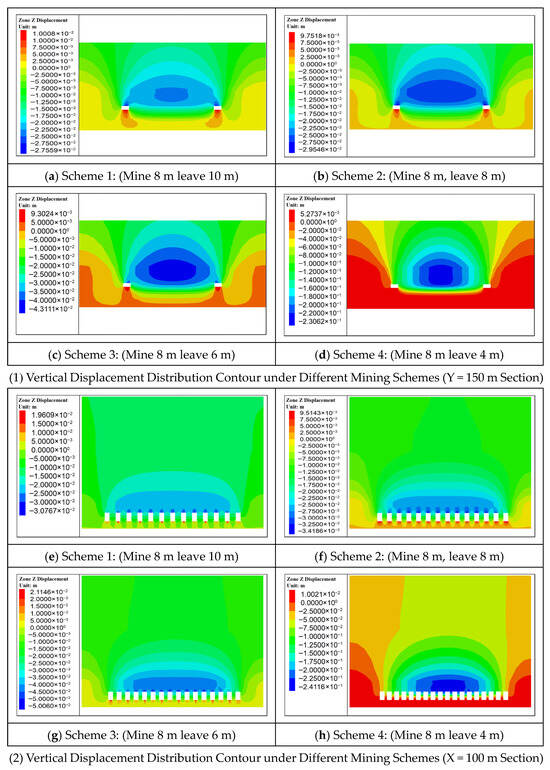
Figure 10.
Roof Subsidence Displacement Contour under Different Mining Schemes.
To monitor roof subsidence, three monitoring lines were positioned at distances of 1 m, 30 m, and 70 m from the room roof. As presented in Figure 11, the results indicate that room mining induces varying degrees of roof subsidence, with the displacement profile exhibiting a characteristic funnel-shaped distribution along the excavation section. According to the monitoring data, the maximum subsidence values are 31 mm for Scheme 1, 34 mm for Scheme 2, 51 mm for Scheme 3, and 245 mm for Scheme 4—the latter representing the most significant roof deformation among all schemes.
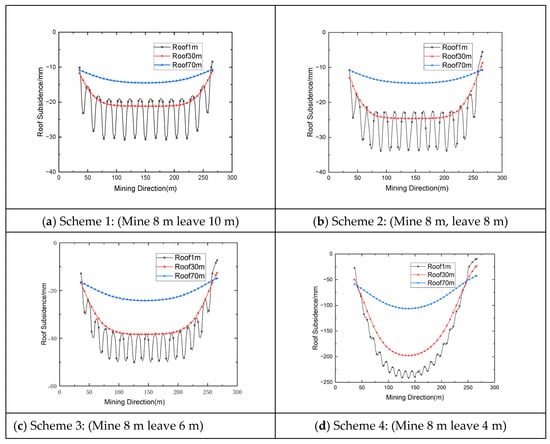
Figure 11.
Roof Subsidence Monitoring Chart under Different Mining Schemes.
As shown in Figure 12, according to monitoring data collected at a depth of 10 m within the roof, roof subsidence increases progressively as pillar width decreases. The maximum subsidence values are 23 mm for Scheme 1, 25 mm for Scheme 2, 49 mm for Scheme 3, and 234 mm for Scheme 4.
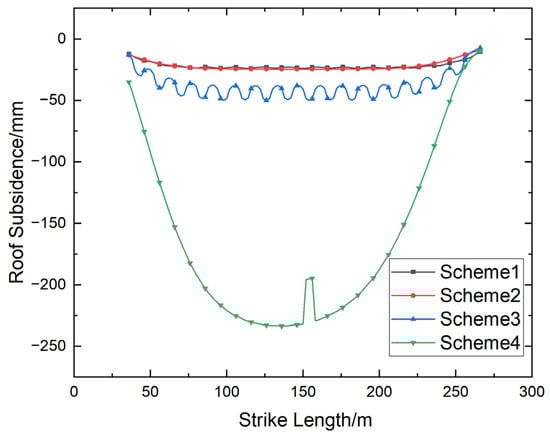
Figure 12.
Roof Subsidence Curve under Different Mining Schemes (at 10 m depth).
- (3)
- Distribution Law of Surrounding Rock Failure Zone for Different Pillar Widths
Due to the stress redistribution induced by room excavation, the surrounding rock in the stope exhibits varying degrees of failure. The following section provides a detailed analysis of the failure distribution patterns observed in the pillars under each mining scheme.
As shown in Figure 13, under Scheme 1, plastic failure zones are confined to the corners where pillars intersect with main roadways; other areas remain intact, with only minor shear failure observed in the pillars. In Scheme 2, plastic failure zones extend approximately 1 m from both ends of the pillars, representing a slightly larger affected area compared to Scheme 1, though the pillars remain generally stable. Under Scheme 3, extensive shear failure develops within the central portion of the pillars, occupying roughly 80% of the pillar volume, indicating compromised pillar stability. In Scheme 4, the pillars undergo complete plastic failure, with the plastic zone extending over 12 m into the floor and 8 m into the roof, demonstrating the most severe failure depth observed in the room roof. As shown in Table 3, the numerical simulation results under different mining schemes are presented.
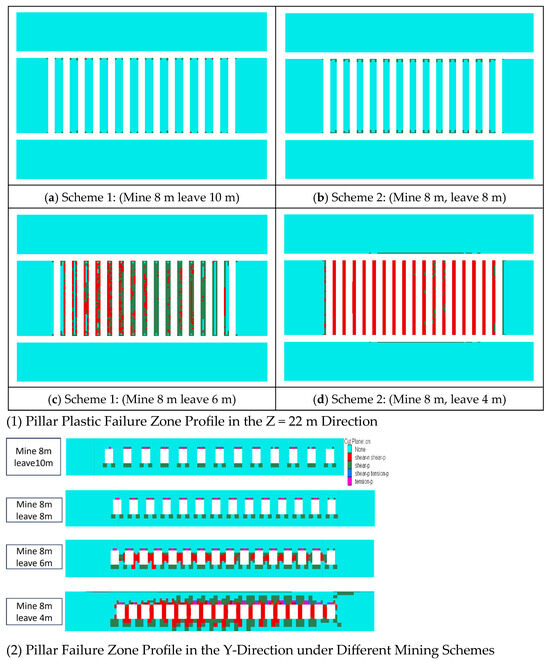
Figure 13.
Distribution Diagram of Pillar Failure Zones.
Table 3.
Numerical Simulation Results under Different Mining Schemes.
3.2. Optimization of Mining Process Parameters Based on AHP-Fuzzy Method
3.2.1. Evaluation Index System
The optimization of process parameters in potash mining constitutes a complex systematic engineering challenge, influenced by multiple factors such as stope-pillar stability, backfilling costs, and technical complexity. These influencing factors cannot be precisely quantified using classical mathematical formulas, yet they play a decisive role in determining the overall mining process.
Fuzzy mathematical models are particularly suited for studying objects and relationships characterized by inherent fuzziness. Fuzzy comprehensive evaluation is an effective multi-criteria decision-making method for assessing systems influenced by various interrelated factors. Its key feature is that evaluation results are not expressed in absolute terms, but rather as fuzzy sets, allowing for graded and nuanced judgments [33,34]. The mining process optimization index system comprises both qualitative and quantitative indicators, which interact and constrain one another. The system is designed under the principle of maximizing information comprehensiveness while minimizing the number of indicators. Following Analytic Hierarchy Process (AHP) theory, the overall goal of this study is the optimization of stope process parameters in potash mining. Accordingly, an evaluation index system was established, consisting of 3 first-level indicators and 16 second-level indicators, as detailed in Table 4.
Table 4.
Evaluation Index System for Optimization of Mining Process Parameters in Potash Mines.
3.2.2. Fuzzy Decision Making
- (1)
- Scheme Selection in Fuzzy Comprehensive Decision Making
To rank the elements in the set of alternative schemes (i.e., the universe of discourse) U = {u1, u2, …, un}, an expert group M consisting of m experts (denoted as |M| = m) can be formed to rank the elements in U separately, resulting in m opinions:
V = {v1, v2, ……, vm}
These opinions are often subjective and inherently ambiguous, reflecting experts’ overall impressions and influenced by psychological factors. Integrating such diverse viewpoints into a reasonably unified judgment is known as **fuzzy opinion aggregation decision-making**. Under defined conditions, ranking alternative schemes and determining their relative merits constitute the central research question addressed in this study.
- (2)
- Classical Comprehensive Evaluation Decision Making
In practical assessment, evaluating an object or process often involves multiple factors or criteria, necessitating an integrated judgment based on all relevant dimensions rather than relying on a single factor. This approach is known as comprehensive evaluation. Fuzzy comprehensive evaluation serves as an effective multi-criteria decision-making method for such tasks, as it allows outcomes to be expressed not in absolute terms but as fuzzy sets, accommodating uncertainty and partial membership.
The weighted scoring method is widely employed in comprehensive evaluations. This approach recognizes that different factors (or indicators) play varying roles in the evaluation and therefore should not be treated equally. Determining the weight of each factor is particularly important, as it reflects the relative influence or significance of each factor within the overall assessment.
The weighted scoring method is generally expressed as:
where E represents the weighted average score, ai (i = 1, 2, …, n) is the weight of the i-th factor, and it is required that .
- (3)
- Determination of Factor Weights Based on Analytic Hierarchy Process
The classic 9-scale method was used for hierarchical determination. Expert scoring and quantitative evaluation methods were employed to obtain the indicator weights as follows in Table 5:
Table 5.
Indicator Weight System.
3.2.3. Fuzzy Comprehensive Demonstration of Mining Technology
Based on expert scoring, the evaluation matrix is established as follows:
After determining the B and R matrices, the fuzzy transformation method is used to convert the fuzzy vector A on U into the fuzzy vector B on V, i.e., B = A × R = [b1, b2, …, bm], where “×” is the composition operator.
After the comprehensive evaluation model is established, the final total score is determined by calculating F = B × STT, where F and ST represent the total system score and the grade scores of the corresponding factors, respectively.
Based on the comprehensive evaluation matrix S and the weight coefficient A determined for the factors via the Analytic Hierarchy Process (AHP), the comprehensive fuzzy evaluation value is calculated: B = A × S. The calculation results are as follows:
According to the fuzzy comprehensive evaluation results, Scheme 5—Simultaneous Backfilling with 8 m Mining and 6 m Pillar Retention—has become the preferred option following this evaluation, due to its high ore recovery rate, superior economic indicators, and low safety risk.
3.3. Engineering Practice
As of the writing of this paper, 351-stope has commenced stoping operations. Preliminary on-site observations (as shown in the Figure 14) indicate that the stope maintains good overall stability during the first round of stoping and multiple undercutting operations. No significant signs of instability, such as noticeable roof subsidence or pronounced convergence of the sidewalls, have been observed. Both the roof and the sidewalls remain in a stable condition.
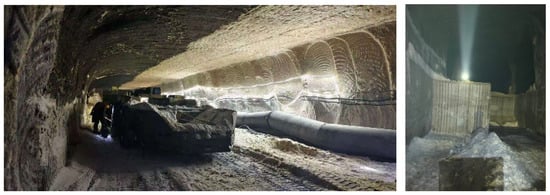
Figure 14.
Field Photograph of Stope Stoping.
Given that 351-stope is still in the early stages of extraction, systematic internal monitoring data are still being accumulated. This study prioritizes the analysis of long-term deformation monitoring data from the adjacent North No. 5 Main Conveyor Drift, which has been in stable service for many years, to assess the macroscopic deformation characteristics of the salt-bearing strata in the mining area. Deformation monitoring of this drift was conducted using a total station, covering the period from January 2023 to December 2025. The monitoring data over approximately three years are shown in Figure 15. The results indicate that the maximum roof subsidence of the drift is 24 mm, the maximum floor heave is 61 mm, and the maximum relative convergence of the sidewalls is 10 mm. These deformation values are generally at a low level, suggesting that under the current mining-induced disturbances, the deformation response of the salt-bearing strata in the mining area is relatively moderate, and the overall stability is satisfactory.
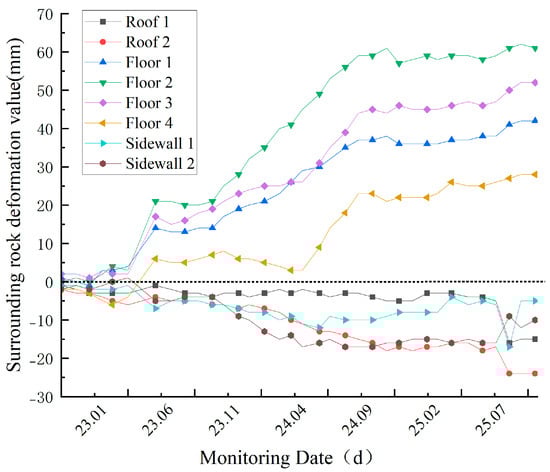
Figure 15.
Monitoring Diagram of Surrounding Rock Deformation in the North No. 5 Main Conveyor Drift.
4. Conclusions
This study systematically investigates the coupled mechanical behavior and long-term stability of the “stope–pillar–hard roof” system in a deep Laotian potash mine through a combination of theoretical analysis, 3D numerical simulation (FLAC3D), and an AHP–Fuzzy multi-criteria decision framework. The research elucidates how mining-induced stress redistribution, potash rheological (creep) behavior, and hard-roof parameters interact to govern pillar stress concentration, deformation, and failure evolution. Furthermore, it establishes a practical multi-objective optimization method for pillar width selection, balancing safety, technical feasibility, and economic efficiency. The key findings are summarized as follows:
The overlying hard roof fundamentally alters load transfer within the stope system. Stiff and thick roof strata induce stress arching, concentrating vertical stress in central pillars and accelerating high-stress zone formation compared to scenarios without a hard roof.
The strength of potash pillars may degrade under sustained loading over time. Numerical analyses based on an instantaneous strength criterion demonstrate that even under constant load, pillars can exhibit progressive stress redistribution and plastic zone expansion. This leads to a long-term load-bearing capacity that is substantially lower than the instantaneous strength would suggest—a time-dependent characteristic that must be explicitly accounted for in pillar design.
Roof stiffness and thickness significantly influence pillar stability. Numerical simulations indicate that increased roof stiffness or thickness amplifies stress concentration within the pillars. Under sustained long-term loading, this stress concentration may further interact with time-dependent material behavior, thereby increasing the potential for progressive deformation and instability risks. The present model focuses on revealing the instantaneous mechanical response, while the long-term coupling effects warrant further investigation.
Pillar width non-linearly affects the trade-off between safety and recovery. Excessively narrow pillars result in unacceptable stress concentration and rapid plastic failure, whereas overly wide pillars reduce recovery efficiency. Mechano-economic analysis reveals an optimal pillar width range that ensures long-term stability with reasonable ore recovery.
The AHP–Fuzzy multi-criteria decision model effectively integrates heterogeneous indicators—safety, technical feasibility, and economic benefit—objectively ranking alternative pillar schemes. This approach reduces reliance on single-factor heuristics and supports balanced design decisions in complex geomechanical environments.
These findings provide a realistic foundation for pillar design in soft, time-dependent potash deposits overlain by stiff strata and offer guidance for safer, more resource-efficient underground potash mining.
Author Contributions
Conceptualization, P.W. and P.G.; methodology, X.S., T.H. and P.W.; software, P.W. and P.G.; data curation, X.S.; visualization, X.C.; writing—original draft, P.W.; writing—review and editing, T.H., P.G. and X.C.; funding acquisition, P.W. and X.C.; supervision, X.C. and X.S. All authors have read and agreed to the published version of the manuscript.
Funding
This paper was funded by Anhui Postdoctoral Scientific Research Program Foundation (No. 2023B664) and the 2025 Initial Research Project of China Coal Mine Construction Group Co., Ltd. (No. 2025ZM001).
Institutional Review Board Statement
Not applicable.
Informed Consent Statement
Not applicable.
Data Availability Statement
The original contributions presented in the study are included in the article, further inquiries can be directed to the corresponding author.
Conflicts of Interest
Authors Ping Wu, Xuejun Sun and Tengfei Hu were employed by the company China Coal Mine Construction Group Co., Ltd. The remaining author declares that the research was conducted in the absence of any commercial or financial relationships that could be construed as a potential conflict of interest.
References
- Zhang, Y.; Lapatsin, S.; Zhuravkov, M.; Yu, G.; Karpovich, I. The Stability and Failure of Deep Underground Structures at Potash Mining Deposits. Appl. Sci. 2024, 14, 9434. [Google Scholar] [CrossRef]
- Jin, R.; Wang, X.; Zhang, S.; Huo, H.; Li, J.; Ni, W. Slurry Transportation Characteristics of Potash Mine Cemented Paste Backfills via Loop Test Processing. Processes 2024, 12, 2929. [Google Scholar] [CrossRef]
- Amadghous, Y.; Ait-Khouia, Y.; Aboulaich, A.; Zagriri, A.; Ouabid, M.; Raji, O.; Mansouri, S.; Elghali, A.; Taha, Y.; Benzaazoua, M. Resource recovery from potash brine effluent: Integrated chemical precipitation and evaporative crystallization for zero liquid discharge and sustainable brine management. Chemosphere 2025, 388, 144700. [Google Scholar] [CrossRef]
- Li, J.; Zhou, Y.; Liu, C.; Zhang, S.; Yao, F.; Yang, G.; Hou, W. Geochemical Exploration Techniques with Deep Penetration: Implications for the Exploration of Concealed Potash Deposits in the Covered Area on the Southern Margin of the Kuqa Basin. Water 2025, 17, 298. [Google Scholar] [CrossRef]
- Rodeja, J.; Coello, F.; Sardans, J.; Penuelas, J. The Potash Trilemma: Geopolitics, Market Dynamics, and Global Food Security. J. Sustain. Agric. Environ. 2025, 4, e70050. [Google Scholar] [CrossRef]
- Ushakova, E.; Perevoshchikova, A.; Menshikova, E.; Khayrulina, E.; Perevoshchikov, R.; Belkin, P. Environmental aspects of potash mining: A case study of the Verkhnekamskoe potash deposit. Mining 2023, 3, 176–204. [Google Scholar] [CrossRef]
- Sidki-Rius, N.; Sanmiquel, L.; Bascompta, M.; Parcerisa, D. Subsidence management and prediction system: A case study in potash mining. Minerals 2022, 12, 1155. [Google Scholar] [CrossRef]
- Sun, H.; Ren, J.; Wang, J.; Wu, X.; Tang, W. A review of the geological characteristics and resource potential analysis of potash deposits in Africa. J. Afr. Earth Sci. 2024, 213, 105226. [Google Scholar] [CrossRef]
- Liu, J.; Xu, T.; Gao, T.; Geng, D.; Du, W. Integrated Gravity Data Interpretation for Potash Exploration in the Vientiane Basin, Laos. Minerals 2025, 15, 842. [Google Scholar] [CrossRef]
- Huang, C.; Chen, K.; Hei, W.; Fan, L. Identification of deep-buried potassium-rich brines in evaporate basin with aid of geophysical logging methods in co-exploration of oil and potash: A case study of Southwestern Sichuan Basin. Arab. J. Geosci. 2022, 15, 869. [Google Scholar] [CrossRef]
- Cao, S.; Xue, G.; Yilmaz, E.; Yin, Z.; Yang, F. Utilizing concrete pillars as an environmental mining practice in underground mines. J. Clean. Prod. 2021, 278, 123433. [Google Scholar] [CrossRef]
- Han, P.; Zhang, C.; Wang, W. Failure analysis of coal pillars and gateroads in longwall faces under the mining-water invasion coupling effect. Eng. Fail. Anal. 2022, 131, 105912. [Google Scholar] [CrossRef]
- Li, C.; Zhou, J.; Du, K.; Dias, D. Stability prediction of hard rock pillar using support vector machine optimized by three metaheuristic algorithms. Int. J. Min. Sci. Technol. 2023, 33, 1019–1036. [Google Scholar] [CrossRef]
- Zhang, C.; Zhao, Y.; Han, P.; Bai, Q. Coal pillar failure analysis and instability evaluation methods: A short review and prospect. Eng. Fail. Anal. 2022, 138, 106344. [Google Scholar] [CrossRef]
- Kamran, M.; Chaudhry, W.; Taiwo, B.O.; Hosseini, S.; Rehman, H. Decision intelligence-based predictive modelling of hard rock pillar stability using K-nearest neighbour coupled with grey wolf optimization algorithm. Processes 2024, 12, 783. [Google Scholar] [CrossRef]
- Kuskova, Y.V.; Lipnitsky, N.A. Mechanical properties and mineralogical composition of potash ore as a factor in selecting the processing method. In Materials Science Forum; Trans Tech Publications Ltd.: Stafa-Zurich, Switzerland, 2021; Volume 1022, pp. 17–26. [Google Scholar]
- Wang, M.; Cai, M. Numerical modeling of time-dependent spalling of rock pillars. Int. J. Rock Mech. Min. Sci. 2021, 141, 104725. [Google Scholar] [CrossRef]
- Zhang, L.; Ren, G.; Ge, Y.; Zhang, C.; Wang, X. Study of the spatiotemporal evolution of the stress, deformation and creep characteristics of pillars in solid potash mines. Geomech. Geophys. Geo-Energy Geo-Resour. 2025, 11, 100. [Google Scholar] [CrossRef]
- Vlachogiannis, I.; Benardos, A. Proposed formulas for pillar stress estimation in a regular room-and-pillar pattern. Int. J. Rock Mech. Min. Sci. 2024, 180, 105826. [Google Scholar] [CrossRef]
- Bu, Q.; Tu, M.; Fu, B. Research on the redistribution law of lateral mining stress and the bearing characteristics of section coal pillar in extra-thick fully mechanized top-coal caving mining. Shock Vib. 2021, 2021, 4355977. [Google Scholar] [CrossRef]
- Wang, X.; Yang, T.; Guan, K.; Liu, X.; Zhao, Y. Stability evaluation of multi-pillar and roof system based on instability theory. Rock Mech. Rock Eng. 2022, 55, 1461–1480. [Google Scholar] [CrossRef]
- Li, C.; Zhou, J.; Armaghani, D.J.; Cao, W.; Yagiz, S. Stochastic assessment of hard rock pillar stability based on the geological strength index system. Geomech. Geophys. Geo-Energy Geo-Resour. 2021, 7, 47. [Google Scholar] [CrossRef]
- Zheng, H.; Li, P.; Ma, G. Stability analysis of the middle soil pillar for asymmetric parallel tunnels by using model testing and numerical simulations. Tunn. Undergr. Space Technol. 2021, 108, 103686. [Google Scholar] [CrossRef]
- Luo, S.; Gong, F. Evaluation of energy storage and release potentials of highly stressed rock pillar from rockburst control perspectives. Int. J. Rock Mech. Min. Sci. 2023, 163, 105324. [Google Scholar] [CrossRef]
- Dong, H.; Zhu, W.; Hou, C.; Liu, X. Load transfer behavior during cascading pillar failure: An experimental study. Rock Mech. Rock Eng. 2022, 55, 1445–1460. [Google Scholar] [CrossRef]
- Sarfarazi, V.; Babanouri, N.; Fattahi, S.; Asgari, K. Study on failure mechanism of room and pillar with different shapes and configurations under uniaxial compression using experimental test and numerical simulation. Undergr. Space 2023, 9, 105–121. [Google Scholar] [CrossRef]
- Tan, Y.; Ma, Q.; Liu, X.; Liu, X.; Elsworth, D.; Qian, R.; Shang, J. Study on the disaster caused by the linkage failure of the residual coal pillar and rock stratum during multiple coal seam mining: Mechanism of progressive and dynamic failure. Int. J. Coal Sci. Technol. 2023, 10, 45. [Google Scholar] [CrossRef]
- da Fontoura, S.A.; Teixeira, E.C. The design of pillars of potash underground mines in Brazil. In Modelling of Mine Structures; Routledge: New York, NY, USA, 2021; pp. 151–162. [Google Scholar]
- Wang, X.; Xia, Z.; Yao, Q.; Li, X.; Xu, Q.; Zhu, L. Numerical investigation of coal pillar damage mechanisms for various width-to-height ratios. Sci. Rep. 2025, 15, 2705. [Google Scholar] [CrossRef] [PubMed]
- Zhu, Q.; Zhao, X.; Westman, E. Review of the Evolution of Mining-Induced Stress and the Failure Characteristics of Surrounding Rock Based on Microseismic Tomography. Shock Vib. 2021, 2021, 2154857. [Google Scholar] [CrossRef]
- Luo, L.H.; Xia, G.J.; Wang, C.; Zhu, H. Optimization of mining method selection and stope structure parameters based on FLAC3D. Min. Metall. Eng. 2021, 41, 129–133. [Google Scholar]
- Wang, T. FLAC3D Numerical Simulation Method and Engineering Application: An In-Depth Analysis of FLAC3D 5.0; Architecture & Building Press: Beijing, China, 2015. [Google Scholar]
- Guo, S.; Guo, G.L.; Li, H.Z.; Cui, H. Stability Evaluation of Mining-Induced Sites Based on Dimensionality Reduction Fuzzy C-Means Clustering Algorithm. Coal Sci. Technol. 2020, 48, 137–142. [Google Scholar]
- Zhang, K.X.; Wang, X.L.; He, M.C.; Yin, S.X.; Li, S.B.; Sun, J.D.; Li, D.; Cheng, Z.H.; Zhao, Q.F.; Yin, S.F.; et al. Multi-level fuzzy comprehensive evaluation of applicability for intelligent fully-mechanized unmanned mining face. J. Min. Strat. Control Eng. 2021, 3, 013532. [Google Scholar]
Disclaimer/Publisher’s Note: The statements, opinions and data contained in all publications are solely those of the individual author(s) and contributor(s) and not of MDPI and/or the editor(s). MDPI and/or the editor(s) disclaim responsibility for any injury to people or property resulting from any ideas, methods, instructions or products referred to in the content. |
© 2026 by the authors. Licensee MDPI, Basel, Switzerland. This article is an open access article distributed under the terms and conditions of the Creative Commons Attribution (CC BY) license.