Abstract
Analyzing large datasets of animal vocalizations requires efficient bioacoustic methods for categorizing the vocalization types. This study evaluates the effectiveness of different vocalization clustering methods, comparing fully automated and semi-automated methods against the gold standard of manual expert annotations. Effective methods achieve good clustering performance whilst minimizing human effort. We release a new dataset of 1454 zebra finch vocalizations manually clustered by experts, on which we evaluate (i) fully automated clustering using off-the-shelf methods based on sound embeddings and (ii) a semi-automated workflow relying on refining the embedding-derived clusters. Clustering performance is assessed using the Adjusted Rand Index (ARI) and Normalized Mutual Information (NMI). Results indicate that while fully automated methods provide a useful baseline, they generally fall short of human-level consistency. In contrast, the semi-automated workflow achieved agreement scores comparable to inter-expert reliability, approaching the levels of expert manual clustering. This demonstrates that refining embedding-derived clusters reduces annotation time while maintaining gold standard accuracy. We conclude that semi-automated workflows offer an optimal strategy for bioacoustics, enabling the scalable analysis of large datasets without compromising the precision required for robust behavioral insights.
1. Introduction
The study of animal vocalizations provides critical insights into animal behavior and social interactions. Bioacoustic analysis involves identifying and classifying distinct vocal units—frequently termed syllables, notes, or calls, depending on the species and research context. As access to vast datasets increases, manually processing these recordings has become a major bottleneck.
Vocal units tend to be associated with well-defined behavioral categories [1,2,3], but some vocalizations, such as song syllables, tend to co-occur in the same context, implying that they must be discriminated purely from sound-based features. With regards to sound-based classification, traditionally, expert annotations depend on visual inspection of sound spectrograms and auditory assessment [1,4,5]. This manual approach, while capable of capturing nuanced acoustic details and incorporating crucial contextual knowledge, is inherently slow, labor-intensive, susceptible to human variability, and requires significant domain expertise.
To overcome the limitations of manual annotation, researchers have increasingly turned to computational approaches. Supervised methods [6,7,8] can achieve high performance but depend on extensive expert-annotated training data, which is rarely available for new species or studies. Unsupervised methods [9,10] avoid the need for labels but often fail to capture biologically meaningful categories, relying on low-level spectrogram features that do not fully align with expert perceptual judgments. While semi-supervised interfaces like Koe [11] have improved the manual annotation workflow by providing interactive tools for segmentation and classification, these often still rely on traditional feature representations or require significant manual effort to define classes from scratch.
Therefore, a critical gap remains regarding a workflow that is both scalable and highly accurate without requiring massive labeled datasets. We propose that foundation models—large-scale pre-trained transformers like Whisper [12]—can bridge this gap. By utilizing the complex, high-level feature representations learned by these models, we hypothesize that a semi-automated workflow can achieve expert-level accuracy with minimal human effort, effectively reducing the task to refining pre-grouped clusters rather than labeling individual vocalizations.
Given the tradeoffs inherent in each approach, a systematic comparison is needed. This study directly compares the performance and characteristics of three distinct clustering strategies for animal vocalizations: (1) fully manual annotation by multiple experts, (2) a fully automated pipeline using the K-Means and HDBSCAN algorithms [13] on UMAP [14]-projected Whisper embeddings [15], and (3) a semi-automated workflow involving initial embedding and automated clustering followed by expert proofreading. By evaluating the agreement within and between these methods using standard metrics like the Adjusted Rand Index (ARI) and Normalized Mutual Information (NMI), we aim to quantify their relative performance, identify sources of disagreement, and assess the potential of automated and semi-automated techniques in bioacoustics research.
2. Materials and Methods
2.1. Vocal Activity Detection (VAD)
Since clustering operates on discrete vocalization segments, we first needed to detect and define these segments in the continuous audio recordings. Vocal activity detection (VAD) is a crucial preprocessing step aimed at distinguishing signal (animal vocalizations) from noise (other sounds). The VAD preprocessing step extracts from raw recordings the sound segments that contain the vocalizations to be clustered. Because VAD can introduce clustering variability on its own that we wanted to minimize, we did not treat VAD as a variable in the present study and instead worked with pre-defined vocalization segments, assuming that each segment is associated with one vocalization (one-to-one mapping). We automatically extracted the vocal segments using WhisperSeg, a fully automated method [16], with pretrained weights from https://huggingface.co/nccratliri/whisperseg-base-animal-vad-ct2.
2.2. Expert Manual Clustering
Given a set of vocal segments, the vocal clustering task boils down to classifying the vocal segments. In the following section, we describe the clustering guidelines that we recommend in general and that were followed by the three experts in our study.
2.2.1. Guidelines for a Gold Standard Dataset
In practice, vocal clustering deals with the tradeoff of defining (1) many clusters and (2) clusters of large sizes. The first aim (many clusters) is motivated by it being easier to merge different clusters at a later stage than to divide an existing one. That is, if a researcher decides that two clusters should be regarded as one, their merge is straightforward. However, if one cluster is later to be divided, then new criteria would have to be put into place to do so. The second aim (large clusters) is motivated by the desire to avoid treating every vocalization as a different cluster. Large clusters are constructed by grouping all vocalizations that look/sound similar. The two aims oppose each other, and each annotator must use their personal judgment to find the right balance between these aims.
We define vocalization types based merely on their sounds, disregarding the contexts in which the vocalizations are produced. Vocalization types should not be defined based on temporal context, i.e., depending on the structure and timing of preceding and following calls, because otherwise, by definition, animals cannot produce a given call in more than a single context, e.g., animals could not reuse a syllable type in a new song, which would be absurd.
We adopted a five-step procedure to manually cluster vocalizations:
- Segment the stream of raw recordings into separate vocal segments (Section 2.1 Vocal activity detection; this is fixed for all clustering methods in our study).
- For every vocal segment, check if the vocalization can be integrated into any existing cluster. If so, place the vocalization in the identified cluster. If not, create and assign a new cluster to the vocalization.
- Repeat step 2 until every vocalization has been assigned a cluster.
- Once the vocalizations are all assigned to a cluster, compare clusters, and check if the clusters can be merged or split.
- Repeat step 4 until no merging or splitting is needed.
The annotator makes subjective decisions in step 2 (whether a vocalization belongs to a certain cluster) and in step 4 (whether different clusters should be merged or further split). To provide flexibility and minimize inter-expert disagreement, we encouraged the annotators to assign an additional label (covered in the next section) to ambiguous cases.
2.2.2. Using Additional Labels (Tags)
The additional labels (we call them ‘tags’) act as auxiliary identifiers attached to vocalizations: they can provide useful information when needed, but they can also be ignored in analyses that rely only on primary cluster assignments.
For example, if one expert calls a vocalization a truncation (tag), and the other believes that it belongs to a distinct cluster on its own, it would still be possible to examine their agreement, despite the different labels. Although not part of this study, the labels are provided in the dataset for a more fine-grained future analysis.
- Truncated vocalizations
It can happen that vocalizations have a truncated ending (Figure 1a, top). Such truncated vocalizations resemble a well-recognizable vocalization type, but they end prematurely. We advocate placing such truncated vocalization in the same cluster as the untruncated renditions and tagging them as having a truncated ending.
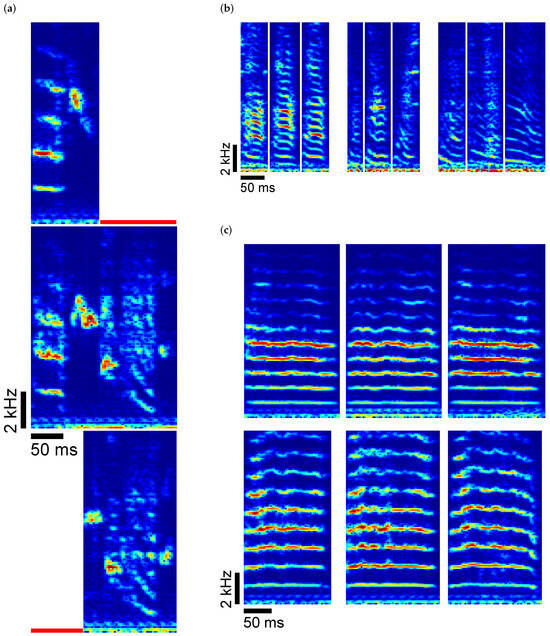
Figure 1.
(a) Example spectrograms of truncations, marked by red lines. Compared to the center vocalization, at the top, the end is truncated, and at the bottom, the beginning is truncated. (b) Example spectrograms where the cluster membership is uncertain. The three vocalizations in the center are somewhat ambiguous: they could be assigned either to Cluster A (left) or Cluster B (right). (c) Example spectrograms of merging. Suppose an expert started by differentiating the examples on the top from the examples at the bottom, and later decided to merge these because their difference is negligible. The subtle difference can still be kept in the record as tags.
Truncations can also occur at vocal onsets, when the beginning of a vocalization is missing, but the ending is intact (Figure 1a, bottom). Such vocalizations should be tagged as having a truncated beginning.
- Uncertain cluster membership
There are also cases in which a vocalization could reasonably belong to one of several clusters (Figure 1b). Forcing a single assignment in such cases introduces unnecessary variance and repeatability issues: an annotator may focus on a subtle feature that others do not recognize, leading to disagreement, and they may not even make the same choice upon re-annotation. To avoid such problems, we suggest assigning multiple candidate clusters as tags to vocalizations whose identity is ambiguous.
- Merging and splitting of clusters
The act of annotating is a learning process for the human expert, whereby, with time, the expert becomes more experienced with the vocalizations of the specific animal at hand. As a consequence, the expert could at some point decide to merge clusters because the initially chosen discriminatory features were not found to be sufficiently reliable. Moreover, an expert could learn to treat vocalizations in one cluster differently and decide to split the cluster. These subjective redefinitions of clusters should be made explicit using tags, which in turn help explain disagreements between experts (Figure 1c).
2.3. Fully Automated Clustering
Following the guideline above, manual clustering, although precise, requires a lot of manual work, making it labor-intensive and not scalable to large datasets. Thus, an automated method for clustering would be desirable. Here, we describe the method we used to perform clustering in a fully automated manner.
Given a set of segmented vocalizations, we extract the embedding of each vocalization, apply a dimensionality-reduction step, and then cluster the vocalizations using an off-the-shelf method.
To automate clustering, we represented vocalizations by the output of the Whisper encoder [12], serving as an embedding. We use the first column vector of the encoder embedding matrix, which provides a robust representation of vocalizations. To validate this choice, we benchmarked the Whisper embeddings against two spectral baselines: (1) raw spectrograms and (2) spectrograms reduced via Principal Component Analysis (PCA, n = 50). This comparative framework allows us to rigorously assess whether Whisper embeddings offer a tangible advantage over traditional spectral features. All three feature sets (Whisper, Raw, and PCA) were processed identically to ensure a fair comparison: we first normalized the data using standard scaling, then reduced dimensionality to two using Uniform Manifold Approximation (UMAP) [10,14] with a cosine metric, which we found to be optimal for high-dimensional embeddings. On these 2D projections, we compared two standard automated clustering algorithms: K-Means and HDBSCAN [13]. For HDBSCAN, we optimized the parameter (set to 20) to balance cluster granularity. To ensure a fair comparison, we set the number of K-Means clusters to match the number of valid clusters identified by HDBSCAN (excluding noise points labeled as invalid, −1).
2.4. Semi-Automated Clustering
As the third clustering method, we introduced a semi-automated clustering method that combines expert knowledge with machine assistance. The idea of this approach is to combine the scalability of the automated clustering method with human supervision to correct for errors that might have been introduced by a fully automated approach.
The semi-automated approach is based on the UMAP 2D coordinates in Section 2.3. Instead of using HDBSCAN or K-Means clusters, the annotator is given the freedom to choose clusters interactively with the help of a nearest neighbor grouping method. We borrow the idea from the 2N extraction algorithm introduced in the paper by Lorenz and colleagues [17]. To identify a cluster, we use two parameters that we manually tune: a radius r and a density threshold . Namely, we draw a disk of radius r and unit height around each 2D data point and sum up the overlapping disks to obtain a 2D manifold, with a local height that is proportional to the density of underlying data points. We then identify a cluster as the data points that fall into a contiguous 2D region (a blob), where the manifold height exceeds a density threshold . While manually fine-tuning the radius and density threshold to change the blob shape, we visualize 10–16 example vocalizations near manually selected points inside the blob to obtain a sense of their cluster identity. When a set of vocalizations should not be part of a cluster, we decrease the radius or increase the threshold, trying to optimally set the shape of the blob. For each cluster, we strive to maximize the blob size to include as many vocalizations as possible while avoiding intersections with other clusters (Figure 4).
After creating the blobs and vocalization clusters, we asked experts to proofread the result by following the steps defined for manual clustering in Section 2.2. To minimize the involved labor, we advised adopting the implicit cluster definitions generated by the blobs and focusing only on outliers, rather than redefining the clusters based on new criteria.
Quantitative Evaluation of Semi-Automated Clustering
To quantitatively assess the scalability and generalization capability of the semi-automated method, we conducted a split-validation experiment. For each bird and each annotator, we randomly partitioned the dataset of semi-automatically labeled vocalizations into a training set () and a test set (). We then trained a K-Nearest Neighbors (KNNs) classifier () on the first 100 principal components of the spectrograms from the training set. The trained classifier was then used to predict the labels of the held-out test set. This process was repeated for all 9 bird–annotator combinations to measure how well cluster definitions generalize to unseen data.
2.5. Dataset
To compare the three approaches, we analyzed a dataset of 1454 randomly chosen vocalizations from three isolated birds recorded between 55 and 136 days post-hatch (sample rate: 44.1 kHz). We released this dataset, together with independent manual cluster annotations from three experts for each bird.
3. Results
This section illustrates the results of the three clustering methods: fully manual (expert annotated), fully automated, and semi-automated, followed by their quantitative evaluation.
3.1. Illustration of the 3 Methods
3.1.1. Manual Clustering
The vocalizations of each bird were manually clustered independently by three experts (Figure 2). The experts mostly agreed, except for the upper-right corner in the 2D UMAP plane of Bird 3. As can be seen from the panel below, the ambiguous vocalizations in the upper-right corner are mostly short calls with no distinct features; their correct classification is debatable.
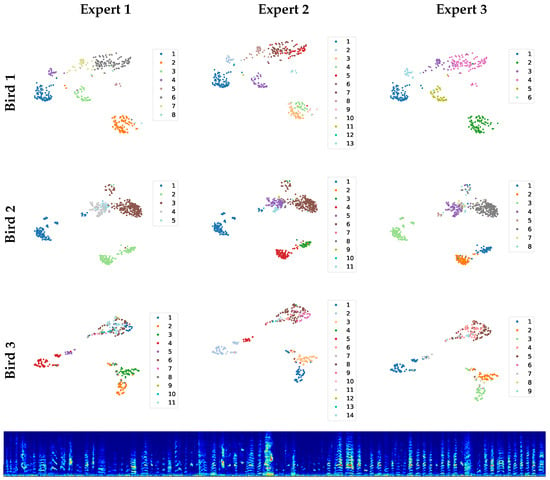
Figure 2.
The scatter plots on top show the manual clusterings achieved by three experts, represented on the UMAP plane of each bird. Below are examples from the upper-right corner in the 2D plane of Bird 3, vocalizations that are hard to cluster.
3.1.2. Fully Automated Clustering
Figure 3 shows the clusterings of the fully automated methods using K-Means (left) and HDBSCAN (right), illustrated using the UMAP 2D coordinates.
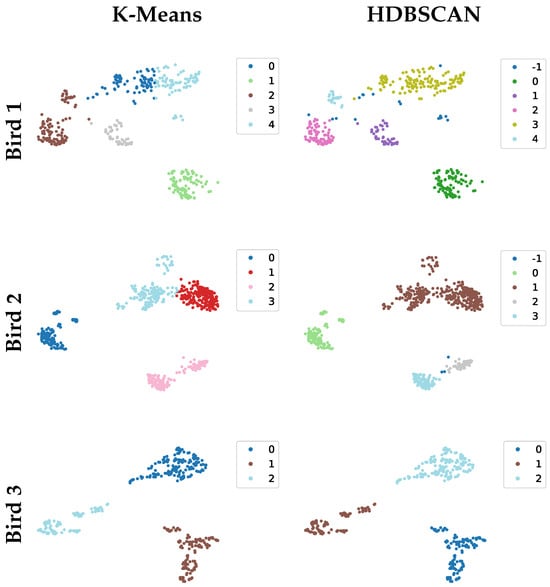
Figure 3.
K-Means (left) and HDBSCAN (right) clustering applied to the 2D UMAP coordinates of the three birds.
3.1.3. Semi-Automated Clustering
Figure 4 shows the UMAP plane of the Whisper embeddings, the defined blobs, and the associated vocalizations. Each blob contains mostly self-similar vocalizations. However, the blobs do not serve as perfect clusters because of occasional outliers, indicated by the red rectangles in the lower panel. We semi-automatically detected outliers from a blob using a 5-nearest neighbor distance ranking procedure (Euclidean spectrogram distance), which places outliers at the bottom of the ranked list. Many outliers had to be manually moved to another cluster (Figure 4), hence the need to check for outliers as a proofreading step; see Section 2.4.
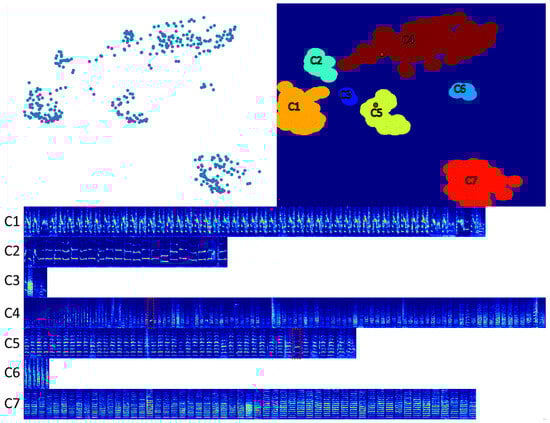
Figure 4.
The upper-left panel shows the 2D UMAP plane of Whisper embedded vocalizations from Bird 1. The upper-right panel shows the blobs defined by setting the threshold density and the radius r. The lower panel shows spectrograms of all vocalizations from this bird, grouped according to their assigned blobs. The red dotted rectangles indicate outlier vocalizations, shown as red dots in the upper-right panel. These are outliers that are not in the UMAP space (i.e., furthest from the center of the blob) but in the true spectrogram space.
In the semi-automated approach, experts first fine-tuned each blob by setting its r and parameters, and then they proofread the resulting clusters (Figure 5). A comparison of the first row (Bird 1) and Figure 4 shows that proofreading led to the blob C3 being reassigned to other clusters (it was reassigned to two separate clusters by Expert 2, and to a single cluster by Experts 1 and 3). Although this method frees the annotator from comparing vocalizations against all pre-existing clusters and then having to decide whether to create a new cluster, it introduces another type of bias: choosing the parameters and r. This bias is nicely illustrated by Expert 1 and Expert 2. While Expert 1 tends to use a larger r, leading to fewer clusters, Expert 2 tends to use a smaller r, leading to more clusters.
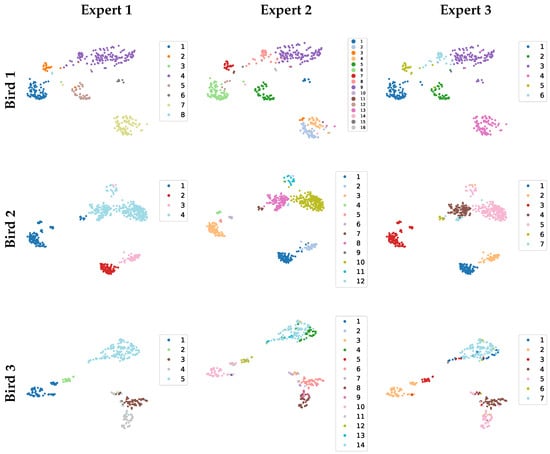
Figure 5.
Semi-automated (SemiAuto) clustering results from three experts (columns: SemiAuto1–3 correspond to Experts 1–3) are shown for three birds (rows). Each expert selected their own threshold and radius r, resulting in clusters of varying sizes.
3.2. Cluster Evaluation
We first assessed the inter-annotator agreement (IAA) among human expert annotations (Manual vs. Manual) to serve as the target benchmark (Figure 6 and Figure 7). The Manual vs. Manual comparisons showed consistently high agreement (IAA).
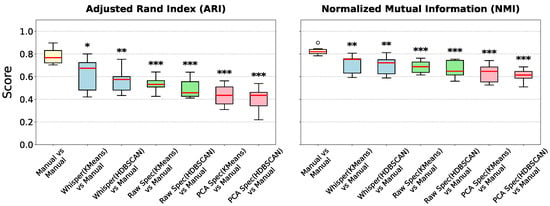
Figure 6.
Benchmarking feature representations for automated clustering. Boxplots show the Adjusted Rand Index (ARI) (left) and Normalized Mutual Information (NMI) (right) for automated clustering methods compared against expert manual labels. ‘Whisper’ (blue) denotes our proposed method using Whisper encoder embeddings. ‘Raw Spec’ (green) and ‘PCA Spec’ (pink) represent baselines using raw and PCA-reduced spectrograms, respectively. The ‘Manual vs Manual’ (yellow) gold standard represents the inter-annotator agreement among human experts. Significance is tested against this expert gold standard (Mann–Whitney U test; * p < 0.05, ** p < 0.01, *** p < 0.001). White circles represent outlier data points.
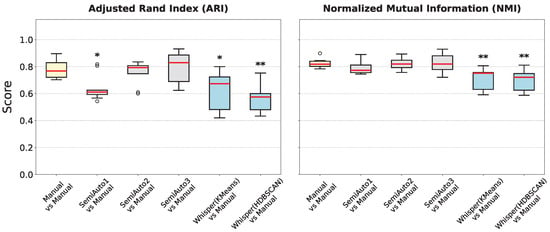
Figure 7.
Boxplots summarize clustering performance of manual, semi-automated, and automated methods. (Left) Adjusted Rand Index (ARI); (Right) Normalized Mutual Information (NMI). ‘Manual vs Manual’ (yellow) establishes the inter-annotator gold standard. ‘SemiAuto’ (gray) represents the semi-automated workflow. ‘Whisper’ (blue) represents Whisper-based automated clustering (HDBSCAN/KMeans). As with Figure 6, significance is tested against the manual expert gold standard (Mann–Whitney U test; * p < 0.05, ** p < 0.01). White circles represent outlier data points.
3.2.1. Comparison of Feature Representations
We then evaluated the performance of fully automated clustering using three different feature representations: (1) Whisper embeddings, (2) raw spectrograms, and (3) PCA-reduced spectrograms. Figure 6 illustrates the clustering agreement (ARI and NMI) for each method compared to the expert manual labels. Whisper embeddings consistently outperformed both baseline methods. Fully automated clustering using Whisper features achieved the highest agreement with human experts (Mean ARI ≈ 0.62), significantly surpassing raw spectrograms (Mean ARI ≈ 0.53) and PCA-reduced spectrograms (Mean ARI ≈ 0.44). Therefore, we only used Whisper embeddings for all subsequent analyses since they capture acoustic structure that aligns more closely with expert perception than do purely spectral features.
3.2.2. Comparison to Gold Standard
Having established Whisper embeddings as the superior feature representation, we then compared the fully automated (Whisper-based) and semi-automated methods against the human gold standard (Figure 7). Semi-automated clusters from Experts 2 and 3 (SemiAuto2 and SemiAuto3) approached this benchmark most closely.
Both fully automated methods (HDBSCAN vs. Manual and KMeans vs. Manual) fell short of the gold standard, even when using the superior Whisper embeddings.
Table 1 aggregates the mean performance scores across the three approaches. As expected, the fully manual gold standard yields the highest internal coherence (ARI = 0.78, NMI = 0.83). The semi-automated pipeline closely approximates this benchmark (ARI = 0.73, NMI = 0.81). Conversely, the fully automated methods (the best performing being Whisper and KMeans) exhibit a marked drop in performance (ARI ≈ 0.62, NMI ≈ 0.71), though well above the spectral baselines.

Table 1.
Inter-annotator agreement scores (mean ARI and NMI).
In terms of annotation efficiency, the semi-automated workflow yielded a substantial reduction in time investment. While fully manual annotation required an average of approximately 90 min per bird, the semi-automated proofreading phase was completed in approximately 45 min—a reduction in total task time. This acceleration did not come at the cost of accuracy, as evidenced by the ARI and NMI scores reported above.
3.3. Scalability of Semi-Automated Clustering
To empirically validate the scalability of the semi-automated workflow, we evaluated the performance of the KNN classifier described in the Quantitative Evaluation of Semi-Automated Clustering Section. Across all three birds and three experts ( experiments), the classifier achieved a mean accuracy of on the held-out test sets. This high classification performance indicates that once cluster boundaries are defined on a representative sample, extending these labels to the rest of the dataset is a highly accurate automated process.
4. Discussion
In this study, we compared three approaches to vocal clustering: manual expert annotation, a fully automated approach using UMAP-projected Whisper embeddings, and a semi-automated method involving 2D visual clustering followed by expert proofreading. Our results indicate that while fully automated clustering provides a rapid reference, it struggles to match the nuances of expert judgment, particularly for acoustically less distinct vocalizations. In contrast, the semi-automated approach achieves a performance comparable to inter-expert agreement, highlighting its potential as an efficient and reliable method for bioacoustic analysis.
To minimize inter-annotator variability (which is often not quantified), we first provided a clustering guideline to align human efforts. Developing this guideline and comparing the manual clusterings among experts revealed that it is difficult to define general, universally applicable rules for choosing clusters. Human experts demonstrated high agreement with each other overall, but diverged in their classification of subsets of acoustically variable calls (upper-right parts of the Bird 3 panels in Figure 2; such instances also proved challenging for the automated methods). We leave further refinement of these guidelines to future work.
4.1. Interpretation of Clustering Performance
Our analysis confirmed the effectiveness of Whisper embeddings, whereby acoustically similar sounds are successfully grouped in UMAP space (Figure 4). The fully automated approach produced groupings that differed significantly from expert consensus, particularly in how it grouped or split certain clusters (Figure 3). By incorporating expert knowledge during proofreading, the semi-automated method was less sensitive to initial errors caused by automation. Consequently, our findings suggest that the semi-automated method effectively replicates expert consensus while significantly reducing the annotation burden.
While fully manual annotation remains the gold standard for precision, it is labor-intensive and scales poorly with dataset size. The semi-automated approach achieves a favorable tradeoff: it matches the inter-expert agreement levels (ARI ≈ 0.73) but does so in a fraction of the time required for manual clustering. This combination of reliability and efficiency makes it particularly well-suited for large-scale bioacoustic studies where fully manual validation is impractical.
4.2. Comparison of Methodologies
Our findings illuminate the tradeoffs between the three approaches:
- Fully manual: It remains the gold standard for capturing subtle acoustic distinctions. However, it is time-consuming, requires significant expertise, and can suffer from inter-annotator variability.
- Fully automated: It offers speed and objectivity but is sensitive to parameter choices (e.g., minimum cluster size for HDBSCAN) and may fail to capture perceptually relevant groupings identified by experts, potentially creating acoustically heterogeneous clusters or splitting homogeneous ones. Its lower performance suggests that further work is needed to improve unsupervised algorithms for complex bioacoustic data.
- Semi-automated: It provides a good balance. It leverages the speed of automation for initial ‘blobbing’, which requires human effort, independent of the amount of data to be clustered (but scales with the number of clusters to be generated). As demonstrated in Section 3.3, the cluster definitions established on a subset of data generalize with high accuracy (>93%) to unseen data. This implies that the primary human effort lies in the initial definition of clusters—a task that scales in complexity with acoustic diversity—rather than the labeling of every individual vocalization. Focusing expert effort on verifying and correcting semi-automated suggestions significantly reduces manual workload while achieving high accuracy for well-structured data.
4.3. Limitations and Further Directions
Our findings are based on a specific dataset and feature representation (Whisper embeddings). The performance of automated methods might change under alternative embeddings or clustering algorithms. Furthermore, the comparison involved only three experts; a larger pool might reveal different consistencies. In addition, our evaluation focused on hard cluster assignments and did not fully exploit the richer tag information, which could enable more nuanced agreement measures and downstream analyses.
Our analysis revealed an interesting issue with UMAP in that it sometimes incorrectly places outlier vocalizations near the center of a blob (the red boxes in Figure 4), leading to clustering errors arising from poor dimensionality reduction (projections can obscure true high-dimensional structure). It will be interesting to analyze this issue in more depth in future work and to explore improvements of the fully automated methods, for example, by devising a KNN-clustering procedure specifically for the outliers in the original spectrogram space.
With regards to the semi-automated method, the choice of parameters for defining “blobs” (radius r and density threshold ) currently relies on expert judgment, introducing variability. Future work should therefore focus on developing automated tools to assist in both outlier detection and parameter tuning—for example, by maximizing cluster stability or optimizing internal validity metrics. Moreover, as more annotations (generated both manually and using the semi-supervised method) become available, it will be possible to infer optimal UMAP hyperparameters (such as and ) that work best for the species at hand, specifically by choosing parameters that maximize classification agreement with expert annotations [18]. By standardizing these ‘human-in-the-loop’ components, we can reduce bias and enhance the method’s universality, providing a robust and reproducible standard for bioacoustic analysis.
Moreover, the statistical power of our comparative analysis was constrained by the sample size ( per distribution), derived from three experts annotating three specific birds. While sufficient to observe strong trends, expanding the dataset to a broader range of species and annotators would be necessary to generalize these findings universally.
4.3.1. Context-Aware Clustering
Some authors argue for classifying vocalizations according to behaviorally defined call types (e.g., tet, stack, or whine), rather than acoustic form alone [1,2,3]. Such behavior-based discrimination connects the acoustic structure with ethological meaning across taxa [19,20,21]. For example, complementary multimodal studies have combined audio with behavioral or spatial data (e.g., video tracking and accelerometers) to investigate how movement and context shape vocal organization [22,23]. Context provides clues into the meaning of the vocalization, i.e., the functional roles they play in the presence of other animals. While the present study focuses solely on sound-based clustering and ignores context, one could envision a definition of clustering that encompasses this broader meaning of a bioacoustic signal. However, some caution is due: if both sounds and context were used to define a vocalization type, then we could risk circular reasoning, and alarm calls could become those calls whose acoustic structure resembles the structure of calls that animals produce when alarming other animals.
4.3.2. End-to-End Clustering Pipeline Including Vocal Activity Segmentation
So far, we fixed the VAD step by focusing on preprocessed vocal activity segments detected with WhisperSeg. However, if the segmentation step is to be included in the clustering task, vocal clustering must be performed directly on raw data. Similarly, comparing multiple annotations becomes challenging when they are based on different vocal segments, as often occurs when segmentation and clustering are performed by different individuals focusing on different scientific questions.
In future work, it would be desirable to treat vocal activity segmentation itself as a variable component of the clustering pipeline, rather than fixing it in advance, like in [17]. Doing this in an automated way would require a method for jointly evaluating segmentation and clustering that penalizes inconsistencies between them. In the remainder of this section, we outline a possible method for evaluating clustering performance under arbitrary vocal segmentation.
Using linear assignment techniques, it is possible to find the optimal correspondence between pairs of annotations by minimizing the number of reassignments that would be needed to achieve perfect congruence. Such methods even work when one set of annotations focuses on long events, such as song motifs, and the other set on much shorter events, such as song syllables or song notes. Namely, by dividing the time into small bins and counting the number of bins that need to be reassigned a new cluster label, the Hungarian method [24] computes the alignment requiring the minimal number of reassignments. Thus, whatever two experts are working on, by solving the linear assignment problem between their annotations, we are guaranteed to find the optimal compromise, since it is not possible to find a better agreement between their annotations.
For pairs of experts, this solution can be conveniently computed in cubic complexity in terms of the number of cluster types, but the situation becomes more complex when more than two sets of annotations need to be compared. This generalizes to the Multidimensional Assignment Problem, for which no efficient polynomial-time solution is known [25].
Note that, as an alternative, the NMI and ARI metrics could be generalized to time bins instead of vocalization segments; in principle, these metrics could be made sensitive to segmentation differences as well. However, these methods do not constitute an optimum in the sense of minimal reassignments and, therefore, do not represent the "best compromise" alignment in the strict sense.
5. Conclusions
In conclusion, while fully manual annotation remains the benchmark, its associated costs are significantly high, and human variability is often unquantified. Fully automated clustering, although fast, may not achieve sufficient accuracy for nuanced bioacoustic analyses. Our results strongly advocate for a semi-automated approach, which combines the efficiency of automated methods with targeted expert validation. This workflow yields results comparable to expert consensus for well-structured vocalizations and offers a practical, scalable, and reliable solution for clustering complex biological signals like birdsong.
To advance the field further, future research should prioritize two key directions. First, applying this semi-automated framework to a broader diversity of species—including those with different vocal complexities and repertoire sizes—will be essential to empirically validate its universality and robustness across taxa. Second, moving beyond purely acoustic features to integrate contextual information, such as behavioral states or movement data, holds great promise. By differentiating vocalizations not just by how they sound but by when and how they are used, we can resolve ambiguities in sound-based clusters and achieve a more holistic understanding of animal communication.
To facilitate future work, we release our manually clustered dataset, including the three independent expert annotations per vocalization, as a benchmark for evaluating alternative clustering methods and inter-expert agreement.
Author Contributions
Conceptualization, K.L. and R.H.R.H.; methodology, K.L. and R.H.R.H.; software, K.L. and R.H.R.H.; validation, K.L. and R.H.R.H.; formal analysis, K.L.; investigation, K.L. and R.H.R.H.; resources, R.H.R.H.; data curation, K.L., M.B. and A.T.Z.; writing—original draft preparation, K.L.; writing—review and editing, K.L., M.B., A.T.Z. and R.H.R.H.; visualization, K.L. and R.H.R.H.; supervision, R.H.R.H.; project administration, R.H.R.H.; funding acquisition, R.H.R.H. All authors have read and agreed to the published version of the manuscript.
Funding
This research was funded by the Swiss National Science Foundation, Projects 31003A_182638 and 205320_215494/1.
Institutional Review Board Statement
Not applicable
Informed Consent Statement
Not applicable
Data Availability Statement
The datasets presented in this article are openly available in Zenodo at https://doi.org/10.5281/zenodo.18156254. The code for semi-automated clustering is also openly available in GitHub at https://github.com/hwiora/semi_automated_clustering (accessed on 4 November 2024).
Acknowledgments
We acknowledge and thank Dina Lipkind for granting us permission to use a subset of her dataset. During the preparation of this study, the authors used OpenAI’s ChatGPT (GPT 5.1) and Google’s Gemini 3.0 for the purpose of editing the manuscript and the code for visualization. The authors have reviewed and edited the output and take full responsibility for the content of this publication.
Conflicts of Interest
The authors declare no conflicts of interest.
References
- Elie, J.E.; Theunissen, F.E. The vocal repertoire of the domesticated zebra finch: A data-driven approach to decipher the information-bearing acoustic features of communication signals. Anim. Cogn. 2016, 19, 285–315. [Google Scholar] [CrossRef] [PubMed]
- Gill, L.F.; Goymann, W.; Ter Maat, A.; Gahr, M. Patterns of call communication between group-housed zebra finches change during the breeding cycle. eLife 2015, 4, e07770. [Google Scholar] [CrossRef] [PubMed]
- Robotka, H.; Thomas, L.; Yu, K.; Wood, W.; Elie, J.E.; Gahr, M.; Theunissen, F.E. Sparse ensemble neural code for a complete vocal repertoire. Cell Rep. 2023, 42, 112034. [Google Scholar] [CrossRef] [PubMed]
- Zann, R.A. The Zebra Finch: A Synthesis of Field and Laboratory Studies; Oxford University Press: Oxford, UK, 1996. [Google Scholar]
- Nicholson, D.; Queen, J.E.; Sober, S.J. Bengalese Finch Song Repository. 2017. Available online: https://figshare.com/articles/dataset/Bengalese_Finch_song_repository/4805749/5 (accessed on 4 November 2024).
- Koumura, T. BirdsongRecognition. 2016. Available online: https://figshare.com/articles/media/BirdsongRecognition/3470165/1 (accessed on 4 November 2024).
- Trouvain, N.; Hinaut, X. Canary Song Decoder: Transduction and Implicit Segmentation with ESNs and LTSMs. In Proceedings of the Artificial Neural Networks and Machine Learning–ICANN 2021: 30th International Conference on Artificial Neural Networks, Bratislava, Slovakia, 14–17 September 2021; Proceedings, Part V. Springer: Berlin/Heidelberg, Germany, 2021; pp. 71–82. [Google Scholar] [CrossRef]
- Cohen, Y.; Nicholson, D.A.; Sanchioni, A.; Mallaber, E.K.; Skidanova, V.; Gardner, T.J. Automated annotation of birdsong with a neural network that segments spectrograms. eLife 2022, 11, e63853. [Google Scholar] [CrossRef] [PubMed]
- Sainburg, T.; Thielk, M.; Gentner, T.Q. Finding, visualizing, and quantifying latent structure across diverse animal vocal repertoires. PLoS Comput. Biol. 2020, 16, e1008228. [Google Scholar] [CrossRef] [PubMed]
- Best, P.; Paris, S.; Glotin, H.; Marxer, R. Deep audio embeddings for vocalisation clustering. PLoS ONE 2023, 18, e0283396. [Google Scholar] [CrossRef] [PubMed]
- Fukuzawa, Y.; Kelly, D.; Kawaguchi, M.; Nakajima, C.; Kawahara, S.; Urando, T. Koe: A web-based software to visualise, segment and classify acoustic units in animal vocalisations. Methods Ecol. Evol. 2020, 11, 431–436. [Google Scholar] [CrossRef]
- Radford, A.; Kim, J.W.; Xu, T.; Brockman, G.; McLeavey, C.; Sutskever, I. Robust Speech Recognition via Large-Scale Weak Supervision. arXiv 2022, arXiv:2212.04356. [Google Scholar] [CrossRef]
- McInnes, L.; Healy, J.; Astels, S. hdbscan: Hierarchical density based clustering. J. Open Source Softw. 2017, 2, 205. [Google Scholar] [CrossRef]
- McInnes, L.; Healy, J.; Melville, J. UMAP: Uniform Manifold Approximation and Projection for Dimension Reduction. arXiv 2018, arXiv:1802.03426. [Google Scholar] [CrossRef]
- Basha, M.; Zai, A.; Stoll, S.; Hahnloser, R. VocSim: A Training-free Benchmark for Zero-shot Content Identity in Single-source Audio. arXiv 2025, arXiv:2512.10120. [Google Scholar] [CrossRef]
- Gu, N.; Lee, K.; Basha, M.; Ram, S.K.; You, G.; Hahnloser, R.H.R. Positive Transfer of the Whisper Speech Transformer to Human and Animal Voice Activity Detection. In Proceedings of the ICASSP 2024-2024 IEEE International Conference on Acoustics, Speech and Signal Processing (ICASSP), Denver, CO, USA, 9–13 June 2024. [Google Scholar] [CrossRef]
- Lorenz, C.; Hao, X.; Tomka, T.; Rüttimann, L.; Hahnloser, R.H. Interactive extraction of diverse vocal units from a planar embedding without the need for prior sound segmentation. Front. Bioinform. 2023, 2, 966066. [Google Scholar] [CrossRef] [PubMed]
- Koch, T.M.; Marks, E.S.; Roberts, T.F. A deep learning approach for the analysis of birdsong. eLife 2025, 13, RP101111. [Google Scholar] [CrossRef]
- Michaud, F.; Sueur, J.; Cesne, M.L.; Haupert, S. Unsupervised classification to improve the quality of a bird song recording dataset. Ecol. Inform. 2023, 74, 101952. [Google Scholar] [CrossRef]
- Casoli, M.; Johnson, M.; McHugh, K.A.; Wells, R.S.; Tyack, P.L. Parameterizing animal sounds and motion with animal-attached tags to study acoustic communication. Behav. Ecol. Sociobiol. 2022, 76, 59. [Google Scholar] [CrossRef]
- Elie, J.E.; de Witasse-Thézy, A.; Thomas, L.; Malit, B.; Theunissen, F.E. Categorical and semantic perception of the meaning of call types in zebra finches. Science 2025, 389, 1210–1215. [Google Scholar] [CrossRef] [PubMed]
- Sainburg, T.; Gentner, T.Q. Toward a computational neuroethology of vocal communication: From bioacoustics to neurophysiology, emerging tools and future directions. Front. Behav. Neurosci. 2021, 15, 811737. [Google Scholar] [CrossRef] [PubMed]
- Paul, A.; McLendon, H.; Rally, V.; Sakata, J.T.; Woolley, S.C. Behavioral discrimination and time-series phenotyping of birdsong performance. PLoS Comput. Biol. 2021, 17, e1008820. [Google Scholar] [CrossRef] [PubMed]
- Kuhn, H.W. The Hungarian method for the assignment problem. Nav. Res. Logist. Q. 1955, 2, 83–97. [Google Scholar] [CrossRef]
- Burkard, R.; Dell’Amico, M.; Martello, S. Chapter 7. Quadratic Assignment Problems: Formulations and Bounds. In Assignment Problems; SIAM: Philadelphia, PA, USA, 2009. [Google Scholar] [CrossRef]
Disclaimer/Publisher’s Note: The statements, opinions and data contained in all publications are solely those of the individual author(s) and contributor(s) and not of MDPI and/or the editor(s). MDPI and/or the editor(s) disclaim responsibility for any injury to people or property resulting from any ideas, methods, instructions or products referred to in the content. |
© 2026 by the authors. Licensee MDPI, Basel, Switzerland. This article is an open access article distributed under the terms and conditions of the Creative Commons Attribution (CC BY) license.