Abstract
River ecosystems play a crucial role in the global water cycle and regional ecological security, yet they face severe challenges under the dual pressures of human activities and climate change. To systematically assess the spatiotemporal characteristics and driving mechanisms of river ecological impacts, this study proposes a modular and transferable method, which is Quantitative Analysis of Spatiotemporal Variations in Ecological Water-Supplementation Benefits of Rivers Based on Remote Sensing (QASViewSBR). Taking the Yongding River (Beijing section) from 2016 to 2023 as a case study, this research integrates multi-source remote sensing and ground monitoring data to extract river water bodies using an improved Normalized Difference Water Index and Vertical–Horizontal polarization characteristics. The Seasonal and Trend decomposition using Loess (STL) method was employed for time-series trend decomposition, Pearson correlation analysis was applied to identify driving factors of area changes, and the Pelt algorithm was used to quantify the response range of riparian vegetation to changes of river water levels. An integrated analytical framework of “dynamic monitoring—time series analysis—driving factor identification—spatial heterogeneity assessment” was established, enabling standardized end-to-end analysis from data acquisition to evaluation. The results indicate that the river water area in the basin increased significantly after 2019, with enhanced seasonal fluctuations. Under the ecological water supplementation policy, the “human-initiated, natural-response” mechanism was clearly observed, and the ecological responses along both riverbanks exhibited significant spatial heterogeneity due to variations in surface features and topography. QASViewSBR exhibits good universality and transferability, providing methodological support for ecological restoration and management in different river basins.
1. Introduction
Rivers, as critical ecosystems connecting terrestrial and aquatic environments, not only sustain regional water resource allocation and biodiversity but also profoundly influence the sustainable development of human society [1,2,3]. In recent years, under the combined effects of intensive human intervention and climate change, river ecosystems worldwide have been facing issues such as flow depletion, habitat fragmentation, and degradation of ecological functions. How to scientifically assess these ecological impacts and formulate targeted restoration strategies has become a core issue in the field of watershed management [4,5,6,7,8].
Ecological water supplementation refers to a water resources management measure that involves artificially regulating and replenishing water to rivers, lakes, and other water bodies, aiming to restore or maintain their ecological functions and improve hydrological connectivity [9,10,11,12]. Currently, existing research predominantly focuses on the assessment of single elements or localized processes, such as water quality changes, ecological flow or vegetation responses [13,14]. For instance, Haonan S et al. employed methods like Pearson correlation analysis, multiple linear regression, and geographically weighted regression to explore the impact of landscape patterns on water quality at different spatial scales in the Wenruitang River Basin [15]. Using ecological flow thresholds and the “observation vs. simulation” comparison, Jiang Shanhu et al. [16] quantified the contributions of climate change and human activities to the hydrological health of the Laoha River Basin. Kuai Shengyang studied the response relationship between water and sediment changes and floodplain vegetation coverage in the lower Yellow River [17]. Overall, current research lacks a comprehensive evaluation framework that systematically integrates the multi-dimensional impacts of “hydrology–ecology–human activities.” Furthermore, Bonacina et al. [18] and Pang et al. [19] revealed the localized impacts of hydrological regulation on habitat structure and vegetation dynamics through case studies of mountain streams in Italy and rivers in Inner Mongolia, respectively. While these studies are valuable, they exhibit two main limitations [20,21,22,23]: first, in terms of analytical frameworks, they often fail to systematically integrate the interactions among multi-dimensional drivers and responses across the “hydrological–ecological–social” spectrum; second, in terms of methodology, they rely heavily on region-specific data and models, lacking standardized assessment tools that can be generalized across different geographical and governance contexts. Therefore, developing a modular and transferable comprehensive assessment method for river ecological impacts holds significant theoretical value and practical relevance. This study aims to construct an analytical framework integrating multi-source remote-sensing and ground-based observation data. Through methods such as time-series decomposition, driver identification, and spatial heterogeneity analysis, it systematically reveals the spatiotemporal differentiation characteristics and formation mechanisms of ecological water supplementation benefits in rivers. To validate the applicability of the methodology, we selected the Yongding River (Beijing section), a typical case reflecting both natural and artificial dual-driver characteristics, as the study area. Empirical analysis was conducted with the following specific objectives: (1) to reveal the spatiotemporal trends of water surface area over a long time series; (2) to identify key driving factors influencing changes in water area and their evolution; (3) to quantify the response range and spatial heterogeneity of riparian vegetation to river water level changes. By implementing this research, we aim to provide a replicable and scalable systematic assessment and analytical tool for river ecological restoration and management.
2. Study Area and Data Sources
2.1. Case Study Area Overview
To validate the universality of the method developed in this study, a representative river in the Haihe River Basin within China, the Yongding River (Beijing Section), was selected as the case study area (Figure 1). This section of the river is geographically located between 115°25′–116°40′ E and 39°30′–40°10′ N, with a total length of approximately 170 km and a basin area of about 3200 square kilometers. It flows through six administrative districts in Beijing: Yanqing, Mentougou, Shijingshan, Fengtai, Fangshan, and Daxing [24]. The study area exhibits significant topographical variation: the upper reaches, dominated by mountainous terrain, have an average elevation about 500–800 m, while the middle and lower reaches transition into plain areas [24], with an average elevation dropping to 20–50 m, forming a distinct topographic gradient. Several hydrological monitoring stations along the river, such as Bahaoqiao and Lugouqiao, provide reliable observational data to support this study.
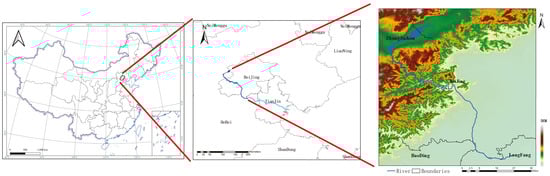
Figure 1.
Schematic Diagram of the Case Study Area.
The representativeness of this area lies in its combination of natural and anthropogenic influences: the upper reaches are strongly controlled by topography and geomorphology, while the middle and lower reaches pass through the highly urbanized Beijing metropolitan area, facing typical riverine issues such as flow interruption and ecological degradation. The spatial heterogeneity of hydrological processes, the prominence of ecological challenges, and the intensity of human activities together form a comprehensive environmental gradient for testing the river ecological-impact-assessment framework, making it an ideal site for methodological validation.
2.2. Data Sources
All data adopted in this study are from publicly available domestic and international datasets or conventional hydrological monitoring data, as shown in Table 1. This data selection strategy ensures the reproducibility of the method and its potential for application in other river basins.

Table 1.
Data Sources and Attributes.
3. Research Methodology
3.1. Modular Assessment Framework
This study proposes a systematic and transferable method for assessing river-ecological impact relationships. The technical pathway is illustrated in the Figure 2, which consists of four core modules.
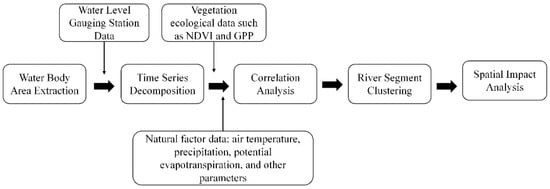
Figure 2.
QASViewSBR Workflow.
- Water Body Dynamic Extracting Module: Long-term river surface area data are retrieved from multi-source satellite imagery (e.g., Sentinel series). The reliability of water-body-extraction results is ensured through cross-validation using measured water level/flow data from conventional hydrological stations within the watershed and inspecting each one against the remote-sensing imagery.
- Hydrological Time-Series Analysis Module: The STL (Seasonal and Trend decomposition using Loess) method is employed to decompose the water area time series into trend, seasonal, and residual components. This quantitatively reveals the long-term trends and periodic characteristics of water-body dynamics.
- Driving Factor Identification Module: Integrates collected meteorological, hydrological, and vegetation ecological parameters to calculate the Pearson correlation coefficient and its statistical significance (p-value) between each parameter and the water surface area across different time periods. This identifies key driving factors influencing water-body changes and tracks their temporal evolution.
- Spatial Heterogeneity Analysis Module: Based on the correlation between “water area” and “ecological parameters (e.g., NDVI)” for each river segment, the K-means clustering algorithm is applied to group segments spatially. This is combined with the Pelt change point detection method to quantify the significant dynamic changes in ecological impact boundaries along the river.
The integrated framework achieves a holistic and standardized analytical pathway from data acquisition and time-series analysis to driver identification and spatial zoning.
3.2. Data Preprocessing
3.2.1. Temporal Scale Fusion
To achieve temporal alignment of multi-source data, higher-frequency daily scale data (such as reservoir discharge, water level of the Yongding River) were aggregated into monthly scale data through summation. Specifically, the daily values were summed to obtain the corresponding monthly total value. This aggregated monthly data was then used for all subsequent experiments and analysis.
where represents the monthly aggregated value, denotes the daily value, and is the number of days in the corresponding month.
3.2.2. Spatial Scale Fusion
To ensure the accuracy of spatial analysis, the bilinear interpolation method [25] was employed to uniformly resample all factor data with different resolutions to the highest resolution, thereby meeting the requirements for spatial overlay analysis. In this study, bilinear spline interpolation was specifically applied to resample the spatial resolution of natural factor data to a uniform 10 m × 10 m resolution—such as air temperature, precipitation, and evapotranspiration—to a uniform 10 m × 10 m resolution. This aligns their resolution with that of the water-body-area data, facilitating subsequent spatial overlay and statistical analysis.
Bilinear interpolation is a widely used image processing technique for enhancing image resolution during upsampling. It estimates the values of unknown pixels based on the values of known neighboring pixels, thereby generating a higher-resolution image. The calculation formula is as follows:
where , , , represent the horizontal and vertical coordinates of point , , , in Figure 3 relative to point , respectively. , , , denote the pixel values at these four points, and is the target pixel value to be determined [26].
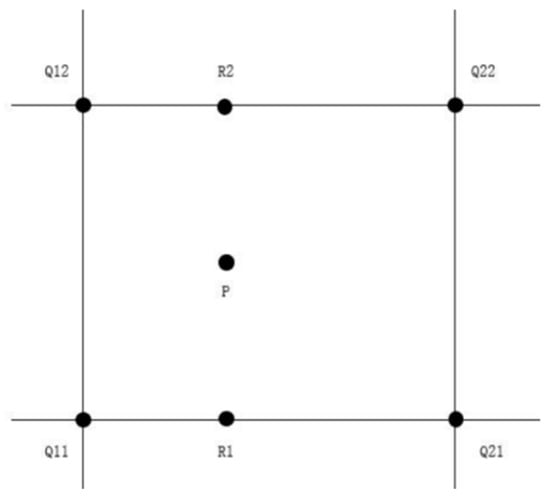
Figure 3.
Schematic Diagram of Bilinear Interpolation.
3.3. Cascade “Coarse-to-Fine” River Water Body Extraction
As the data-acquisition method supporting this study, the extraction process deeply integrates the technical advantages of Synthetic Aperture Radar (SAR) and optical remote sensing, jointly utilizing Sentinel-1 and Sentinel-2 satellite imagery. This approach forms a water-body extraction solution with strong automation capability and robustness, suitable for river water-body monitoring in diverse geographical environments. Although both Sentinel-1 and Sentinel-2 belong to the European Union’s Copernicus Earth observation program, their observation mechanisms have distinct characteristics. Sentinel-1 is a radar satellite with all-weather and day–night observation capabilities, unaffected by clouds or rain. Sentinel-2 is an optical satellite capable of acquiring high-resolution multispectral imagery, making it suitable for detailed surface-feature identification. Both have established mature applications in water-body extraction.
Building on these complementary features, the river water-body extraction process developed in this study is divided into three systematic steps: data acquisition and preprocessing, coarse extraction, and fine extraction. By integrating the strong penetration capability of SAR with the rich spectral information of optical imagery, this method effectively enhances the accuracy and stability of water-body identification, providing reliable data support for eco-hydrological analysis at the watershed scale. First, fused images are selected based on the defined spatiotemporal range. SAR images are subjected to Lee filtering for noise reduction, while optical images undergo cloud masking. Subsequently, Sentinel-1 data is prioritized, and a preliminary water body extent is initially extracted using the threshold segmentation method based on empirical thresholds. If Sentinel-2 imagery is available for the same period, the coarse extraction result is further validated using the Modified Normalized Difference Water Index (MNDWI) combined with an empirical threshold. If not, Sentinel-2 data from January to March of each year is used by default for validation. The empirical thresholds are obtained by batch calculating and averaging typical water-body samples using the OTSU algorithm.
Next, the precise distribution range of river water bodies obtained from Sentinel-1 and validated by Sentinel-2 is extracted one by one. If Sentinel-2 data exists, MNDWI is calculated and the water-body extraction result is obtained using the OTSU algorithm. Otherwise, the VH polarization image from Sentinel-1 is automatically used, and the segmentation threshold is determined via the OTSU algorithm to complete the extraction. During the extraction process, SRTM DEM data is used to calculate slope, and pixels with slopes greater than 5° are eliminated to remove interference from mountain shadows. Validation shows that this method achieves high extraction accuracy, outperforming other common methods.
The formula for calculating MNDWI is as follows:
where represents the reflectance of the green band, and represents the reflectance of the short-wave infrared band [27].
During the calculation process, it is important to note that for Sentinel-2 data, the green band has a spatial resolution of 10 m, while the short-wave infrared (SWIR) band has a resolution of 20 m. To ensure spatial consistency, the SWIR band was resampled to a 10 m resolution using the nearest-neighbor resampling method prior to calculating the MNDWI. This step ensures that both input bands share the same pixel grid, thereby maintaining the geometric integrity and accuracy of the resulting water index.
OTSU Algorithm (also known as the Otsu method or Maximum Between-Class Variance method) is an adaptive threshold segmentation technique. It automatically determines the optimal threshold by maximizing the inter-class variance between the foreground and background in the grayscale histogram, thereby achieving automatic binarization of images. This method is computationally simple, highly adaptive, and efficient for image binarization segmentation, which makes it widely applicable [28]. The calculation formula for OTSU is as follows:
where represents the occurrence probability of each gray level; denotes the pixel value at the -th gray level; is the total number of image pixels; represents the gray level, indicates the probability of being classified into the first category; and represent the cumulative pixel values of the gray levels for the two categories, respectively; is the between-class variance, and when this value reaches its maximum, the corresponding is the optimal segmentation threshold.
3.4. Hydrological Time Series Analysis
This study employs the STL (Seasonal-Trend decomposition using Loess) method as a standardized time series analysis tool [29] to disentangle the trend, seasonal, and residual components within hydrological sequences. This approach is suitable for revealing the evolutionary patterns of different rivers under varying management strategies. STL is a time series decomposition method based on Locally Weighted Regression (Loess). Loess is a non-parametric technique that fits simple models to localized subsets of data, assigning higher weights to nearby points, thereby effectively capturing complex, non-linear trends without assuming a global functional form [30,31]. As a nonparametric local polynomial regression technique, Loess can effectively capture complex data characteristics without relying on extensive training data, combining the simplicity of linear regression with the strong adaptability of nonlinear regression.
Through the STL method, a time series can be decomposed into three components: trend, seasonal, and residual. This decomposition clarifies the internal structure and fluctuation characteristics of the data. The trend component reflects the long-term directional change in the data, such as an increasing, decreasing, or stable state. The seasonal component captures regular fluctuations caused by natural seasons or other periodic factors. The residual component represents irregular variations due to random factors, such as noise or unobserved external influences, which typically cannot be explained by the trend or seasonality.
In the decomposition model, these three components collectively form the complete expression of the time series:
where represents the trend component, denotes the seasonal component, and signifies the irregular component.
Commonly used decomposition models include additive and multiplicative models. The additive model is suitable when the magnitude of seasonal fluctuations and the variations of the trend-cycle do not change over time or change only marginally. The formula for the additive model is expressed as:
The multiplicative model is applicable when “the fluctuation amplitude of the time series is proportional to the trend level of the series itself.” Its formula is expressed as:
In this study, since the long-term fluctuation amplitude of water surface area is generally not strictly proportional to the trend level, it does not meet the fundamental assumption of the multiplicative model. Therefore, the additive model was selected for analysis. This choice better aligns with the actual characteristics of the research data, facilitating the accurate separation of trend, seasonal, and residual components, thereby more reliably revealing the temporal variation patterns of water surface area.
3.5. Driving Factor Identification
This framework employs Pearson correlation coefficient calculation and significance testing to identify key driving factors. By computing these coefficients, the statistical associations between changes in river water bodies and various environmental and natural factors can be quantified.
3.5.1. Pearson Correlation Calculation
The Pearson correlation coefficient is a statistic that measures the degree of linear correlation between two continuous variables [32,33]. The specific calculation formula is as follows:
where and represent the -th observations of the two variables, and denote the sample means of the two variables, is the number of observations, and is the calculated Pearson correlation coefficient.
When the Pearson correlation coefficient is 1, it indicates a perfect positive linear relationship between the two variables; when the coefficient is −1, it indicates a perfect negative linear relationship; and when the coefficient is 0, it indicates no linear relationship between the two variables.
3.5.2. T-Test
To evaluate the significance of the correlation calculation, a t-test method is employed. The t-test assesses whether the difference between the means of two datasets is sufficiently large compared to the inherent uncertainty (i.e., the variability) of the data themselves. If the difference in means is significantly greater than the combined variability of the data, there is reason to believe that this difference is not due to chance but is statistically significant [34]. The calculation formula is as follows:
By consulting the distribution table, the p-value can be obtained. Typically, if the p-value < 0.05, the two datasets are considered to exhibit high statistical significance. If the p-value ≥ 0.05, no significant difference between the two can be concluded.
3.6. Spatial Heterogeneity Analysis
This module employs a combined strategy of “classification first, demarcation second” as an effective tool for quantifying spatial heterogeneity. Specifically, river segments are grouped based on their eco-hydrological response characteristics through clustering, followed by the precise delineation of ecological impact boundaries using change point detection.
3.6.1. K-Means Clustering and Result Evaluation
The core principle of the K-means clustering algorithm is to partition data points into K clusters such that points within the same cluster are similar (close in distance), while points in different clusters are dissimilar (far apart) [35]. The specific procedure includes initialization, assignment step, update step, and iteration. During the initialization phase, K data points are randomly selected as initial cluster centers (centroids), where K is the pre-specified number of clusters. Subsequently, in the assignment step, for each point in the dataset, the Euclidean distance to each of the K centroids is calculated using the formula:
where represents the coordinates of the data point, denotes the coordinates of the centroid of the cluster to which it belongs, and is the Euclidean distance between the two points.
Each point is then assigned to the cluster with the nearest centroid. In the update step, for each newly formed cluster, the centroid is recalculated as the mean of all data points within that cluster. The assignment and update steps are iteratively repeated until the stopping criterion is met, which aims to minimize the sum of squared distances from each point to its cluster center. The objective function is defined as:
where is the number of clusters, is the set of points in the -th cluster, is a data point belonging to , and represents the sum of squared distances from each point to its cluster center [36].
To determine the optimal number of clusters , this study adopts a deterministic method based on an internal evaluation metric, namely the Silhouette Coefficient [37]. The value of is traversed from 2 to 10, and for each , clustering is performed and the results are evaluated. The Silhouette Coefficient quantifies how well each data point matches its assigned cluster by combining intra-cluster cohesion and inter-cluster separation. For an individual sample point , (the average distance between point and all other points in the same cluster, reflecting cohesion) and (the average distance between point and all points in the nearest neighboring cluster, reflecting separation) are calculated. The formula is as follows:
The overall Silhouette Coefficient for all samples is the mean of all , with a value range of . A value close to 1 indicates ideal cluster assignment, a value close to 0 suggests that points lie near cluster boundaries, and a value close to −1 implies potential misassignment. By maximizing the mean Silhouette Coefficient, the clustering structure with the most compact intra-cluster cohesion and clearest inter-cluster separation can be identified, thereby scientifically determining the optimal number of clusters.
Furthermore, to evaluate the quality of clustering results derived from the relationship between NDVI and water-body area changes across different buffer scales, and to select the buffer distance and corresponding clustering scheme with the highest discriminative power, this study introduces the Gini coefficient as a criterion for assessing clustering separation effectiveness. Originating from economics, the Gini coefficient measures the purity within clusters, i.e., the probability that two randomly selected samples from the same cluster belong to the same subclass [38,39]. A higher purity corresponds to a lower Gini coefficient. For calculation, starting with a single cluster containing samples distributed across distinct categories, let denote the proportion of samples in the cluster belonging to the -th category. The Gini coefficient for this cluster is calculated as:
Subsequently, the weighted average Gini coefficient for the overall clustering result is calculated as follows:
where is the number of samples in cluster , and is the total number of samples.
When approaches 0, it indicates extremely high purity within clusters and excellent inter-cluster separation; when it approaches 1, it suggests a chaotic distribution of categories within clusters and low purity. Therefore, by minimizing the overall Gini coefficient, the buffer distance and clustering partition that yield the purest internal clusters and the most distinct inter-cluster separation can be identified. This scheme is considered optimal.
3.6.2. Pelt Change Point Detection Method
After determining the optimal clustering result, this study selected representative areas (1 km) along both sides of the river as key study regions. Within these regions, using 50 m as the basic computational unit, the Pearson correlation coefficient between river surface area changes and NDVI (Normalized Difference Vegetation Index) was systematically calculated. To quantitatively identify the critical boundary of the river’s influence range, the Pelt (Pruned Exact Linear Time) algorithm was applied. Starting from the river centerline [40], the optimal mutation point in the correlation coefficient sequence within the 1 km range was computed and detected. This mutation point is defined as a key quantitative indicator of the spatial extent to which hydrological changes in the river significantly impact the ecological environment on both banks.
The Pelt algorithm is an efficient computational method for detecting change points in time series or spatial sequences. Its core advantage lies in its ability to accurately and rapidly identify the optimal segmentation scheme for multiple mutation points. Compared to traditional sliding window methods, the Pelt algorithm ensures a global optimum rather than a local one through dynamic programming and pruning strategies [41].
The fundamental principles of the algorithm are as follows.
Objective Function: The goal of the algorithm is to identify a set of change points such that the homogeneity of data within each segment of the divided sequence is maximized. This is achieved by minimizing a cost function:
where is a cost function measuring the heterogeneity of a data segment (e.g., negative log-likelihood, sum of squared errors, etc.); represents the -th segment of data; is a critical penalty parameter controlling the cost of adding new change points to prevent overfitting; is the number of change points.
Exact Linear Time Solution: The Pelt algorithm recursively computes the minimal cost through dynamic programming and utilizes inequality conditions for pruning, thereby eliminating positions that cannot be optimal mutation points in advance. This allows its computational complexity to achieve an ideal level in most cases, enabling rapid processing of long sequences.
In the application of this study, the Pearson correlation coefficients calculated along the river gradient are treated as a spatial sequence. The task of the Pelt algorithm is to accurately locate points where these correlation coefficients undergo significant changes, i.e., the critical distance at which the ecological environmental response shifts from being dominated by the river to being influenced by other factors. By adjusting the penalty parameter , the sensitivity of change point detection can be controlled, ensuring that the identified change points possess clear ecological significance.
4. Results and Analysis
4.1. Long-Term Time Series Analysis of Water-Body Area in the Case Study Area
Based on the QASViewSBR, the time-series data of water surface area in the Yongding River (Beijing section) from 2016 to 2023 was decomposed. The results are shown in Figure 4 that the dynamics of water surface area exhibit distinct trend variations. In terms of the trend component, the water area remained relatively stable before 2019, with an overall variation of less than 16.46%. However, a significant upward trend emerged starting in 2019, with an overall change rate of 37.23% and an average annual growth rate of 6.54%, peaking at 7.08 km2 in 2022. To verify the reliability of the aforementioned trend, this study further incorporated daily scale water-level monitoring data from the Yongding River No. 8 Bridge (located in Huailai County, Zhangjiakou City) published by the Beijing Water Authority. By applying monthly scale aggregation and Seasonal-Trend decomposition using Loess (STL) analysis, the trend component of the water-level time series was extracted and comparatively analyzed (Figure 5). The results indicate a high consistency between the water level trend and the water surface-area trend derived from remote-sensing data, thereby supporting the credibility of the conclusions based on remote sensing from the perspective of measured hydrological data.
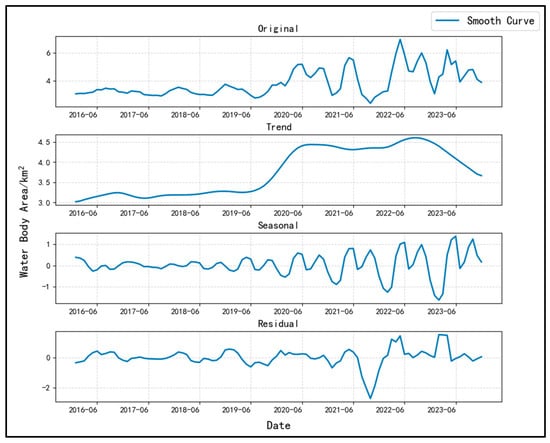
Figure 4.
Contributions to Water-Body Area in the Yongding River (Beijing Section).
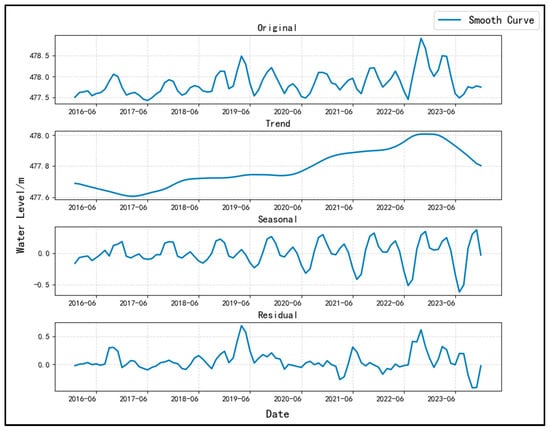
Figure 5.
Flow Composition at the Yongding River Bridge No. 8 Gauging Station.
Regarding seasonal variations, no significant seasonal fluctuations in water area were observed between 2016 and 2019, with overall changes remaining relatively smooth. However, since 2019, seasonal fluctuations have become increasingly pronounced, with their amplitude growing annually and reaching 3.66 km2 by 2023. This evolutionary trend is closely related to the regulatory role of water-conservancy projects in the basin. In the earlier period, the Yongding River relied on hydraulic infrastructure, represented by the Guanting Reservoir, for regulation and water supply, and the river was not fully connected along its entire course. As a result, the natural hydrological rhythm of the river was suppressed, leading to a stable water area. With the implementation of ecological water-supplementation policies, the Yongding River (Beijing section) gradually achieved full connectivity, and seasonal fluctuations were subsequently restored, reflecting the gradual recovery of the river’s natural hydrological dynamics.
Around 2019, driven by an enhanced understanding of river ecological functions, systematic ecological water supplementation projects were initiated in the Yongding River Basin. These projects not only facilitated the preliminary reconnection of the entire river but also progressively restored the basic ecological flow of the river. This shift marks a transition in water-resource management for the Yongding River (Beijing section) from human-dominated influences to an ecology-oriented restoration approach. This transformation is clearly reflected in the time-series analysis results, further confirming the positive impact of ecological water supplementation on the river’s hydrological regime. The findings of Li Xiaolin et al. [42] provide strong supporting evidence for this, indicating that after the implementation of the ecological water-supplementation project, the inflow into the Guanting Reservoir increased significantly—the inflow in 2019 had already exceeded twice the multi-year average prior to the water supplementation. This offers direct water-source support for the observed recovery of ecological flow in this study. Meanwhile, the water-supplementation project effectively altered the previously low and rigid runoff pattern, restoring the “bimodal” natural hydrological rhythm shaped jointly by spring snowmelt and autumn rainfall. This further corroborates the conclusion of this study regarding the positive impact of ecological water supplementation on the hydrological regime. In summary, the results of this study align with existing literature, collectively demonstrating that the ecological water supplementation in the Yongding River has achieved systematic and significant outcomes in increasing runoff and optimizing hydrological rhythms.
4.2. Correlation Analysis of Driving Factors in the Case Study Area
Applying the driving factor identification module of the QASViewSBR framework, correlation analysis and significance evaluation were conducted based on natural factor data (such as air temperature, precipitation, and evapotranspiration) within the Yongding River Basin from 2016 to 2023, alongside NDVI (Normalized Difference Vegetation Index) and GPP (Gross Primary Productivity) data representing ecological vegetation changes, combined with discharge data from the upstream Guanting Reservoir. The results are shown in Figure 6, the long-term time series analysis reveals a highly significant positive correlation between changes in water surface area and the discharge from the Guanting Reservoir. Significant positive correlations were also observed with potential evapotranspiration and air temperature, while a non-significant negative correlation was found with precipitation changes. Non-significant positive correlations were identified with changes in GPP and NDVI. These results indicate that the variation in water surface area in the Yongding River (Beijing section) is primarily regulated by the discharge from the upstream Guanting Reservoir, with air temperature and potential evapotranspiration also exerting some influence, whereas the relationship with precipitation is weak. Furthermore, the impact of these water-area changes on NDVI and GPP appears relatively limited. This suggests that human activities (such as reservoir regulation) likely play a dominant role in the dynamics of the water surface area, while the direct effects of natural climatic factors and vegetation ecological factors are comparatively minor. This conclusion aligns with the findings of Shen Jie’ao [43] regarding landscape changes in the Yongding River (Mentougou section), both indicating that human activities are the primary drivers of change, while the role of natural factors is relatively limited.
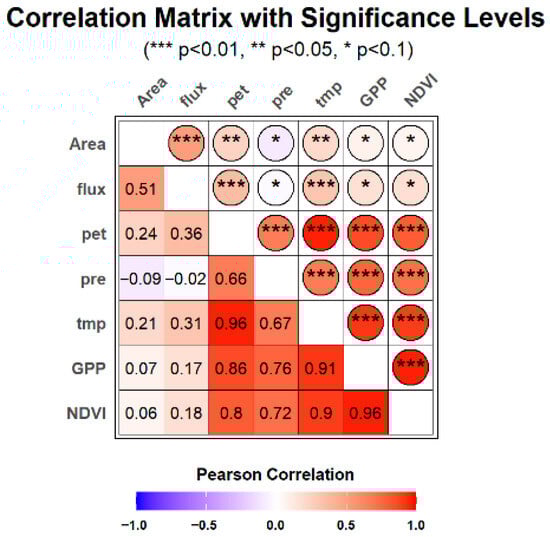
Figure 6.
Correlation Coefficients and Significance Between River Water Area and Various Factors.
To investigate the evolution of driving mechanisms across different periods, this study conducted phased correlation analysis using 2019 as the demarcation point. The results reveal distinct differences in correlation characteristics between the two phases. During 2016–2019, as shown in Figure 7, water surface area exhibited a highly significant correlation with discharge from the Guanting Reservoir (r = 0.63, p < 0.01). In contrast, as shown in Figure 8, during 2019–2023, both the correlation coefficient and statistical significance decreased (r = 0.41, p < 0.05). Meanwhile, the relationship between water surface area and potential evapotranspiration and air temperature shifted from a non-significant negative correlation before 2019 (r = −0.07, p > 0.1) to a significant positive correlation after 2019 (r = 0.38, p < 0.05). This shift indicates that, with the implementation of the Yongding River ecological water supplementation project, the influence of natural climatic factors on water surface-area changes has significantly strengthened, and their relative contribution within the driving mechanism has markedly increased.
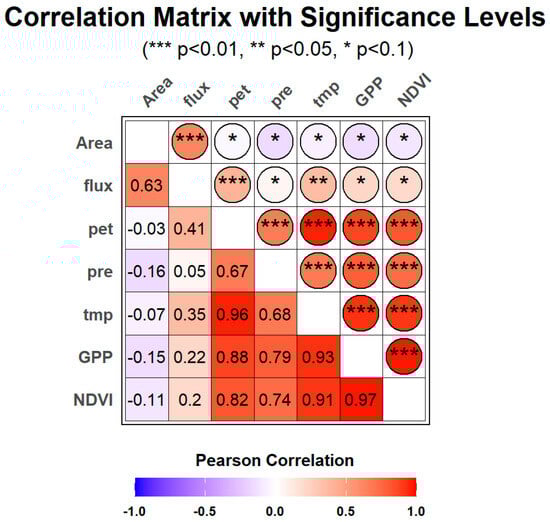
Figure 7.
Correlation Coefficients and Significance Between River Water Area and Various Factors (2016–2019).
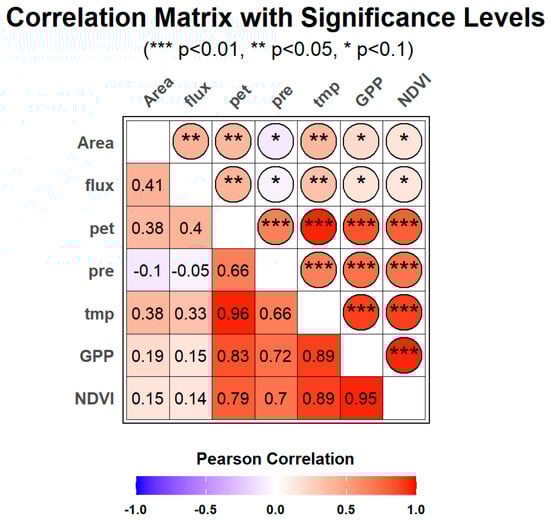
Figure 8.
Correlation Coefficients and Significance Between River Water Area and Various Factors (2019–2023).
Furthermore, the correlation between water surface area and NDVI/GPP also transitioned from a non-significant negative correlation before 2019 (r = −0.15, p > 0.1) to a non-significant positive correlation after 2019 (r = 0.19, p > 0.1). Although still statistically non-significant, the directional change in correlation suggests a gradually emerging influence of water surface area on the basin’s ecological conditions. Ecological water supplementation may have fostered a potential positive linkage between water dynamics and vegetation ecology.
In summary, the implementation of the ecological water supplementation project has systematically restructured the hydrological–ecological driving mechanisms of the Yongding River (Beijing section). It has effectively reversed the previous systemic state characterized by disrupted hydrological rhythms and weakened natural responsiveness, propelling it toward a new equilibrium where natural climatic driving forces are enhanced and hydrological–ecological processes are more coordinated and orderly. This transformation aligns closely with the forward-thinking concept proposed in reference [44], which emphasizes that water flow and sediment collectively constitute the fundamental driving forces of river physical habitats and ecological processes. The water supplementation project, by restoring river continuity and natural hydrological rhythms, has reconstructed a framework for positive water–sediment interactions. The temporal analysis in this study similarly demonstrates a significant enhancement in the correlation between post-supplementation water surface dynamics and climatic factors, indicating the effective restoration of the hydrological processes’ responsiveness to natural climatic drivers. Furthermore, the research findings corroborate the critical role of suitable hydrological regimes, as emphasized in reference [44], in promoting sediment–vegetation coupling processes, specifically reflected in the positive response of riparian vegetation communities to the improved hydrological conditions. In conclusion, the ecological water-supplementation project, aimed at restoring river continuity, has successfully implemented the “human-initiation, natural-response” mechanism. It has effectively activated the river’s inherent natural hydrological processes, thereby achieving systematic and sustainable ecological restoration outcomes.
4.3. Cluster Analysis of River Segments in the Case Study Area
To deeply investigate the influence mechanisms of river water dynamics on riparian ecosystems, this study adopted a segmented analytical framework. First, the study river reach was systematically divided into 100 m segments. For each segment, gradient buffer zones (at 50 m intervals, up to a maximum distance of 1 km) were constructed outward from the river centerline, and the correlation coefficients between the Normalized Difference Vegetation Index (NDVI) and changes in water surface area were calculated within each buffer zone. Based on this, the correlation sequences of each river segment across different buffer widths were extracted as feature vectors, and the K-means clustering algorithm was applied to group the river segments. The optimal number of clusters (K) for each buffer width was determined using the silhouette coefficient, and the clustering quality under different buffer widths was comprehensively evaluated by integrating both the silhouette coefficient and the Gini coefficient. Accordingly, the optimal buffer distance and its corresponding K value were selected. For the case-study area, the clustering results are presented in Table 2. The highest Silhouette Coefficient and Gini coefficient from the clustering results for each buffer width were normalized and summed to derive a “Best Coincidence Ratio” metric. The clustering scheme corresponding to the maximum value of this metric, specifically the cluster number identified for a buffer width of 900 m, was ultimately selected as the optimal clustering result for the entire study (Figure 9). This method effectively balances clustering quality and inter-class distinction, providing a reliable basis for identifying the eco-hydrological response characteristics of different river segments.
Table 2.
Evaluation of Clustering Results.
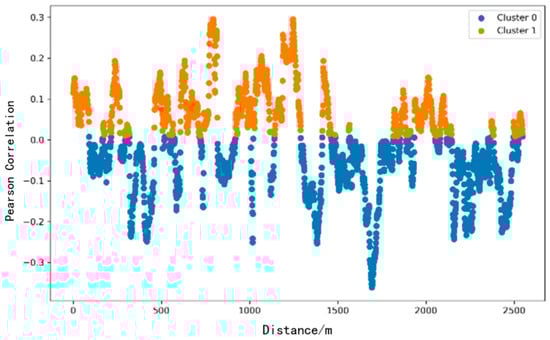
Figure 9.
River Reach Classification and Clustering Results.
To systematically evaluate the spatiotemporal impact of river water surface area changes on the ecological environment of both banks, this study merged spatially adjacent river segments belonging to the same cluster, forming river segment type zones characterized by consistent ecological responses, thereby achieving robust classification of the river segments. Subsequently, the Pelt algorithm was employed to identify mutation points in the correlation coefficients between NDVI and water surface area for each merged segment, thereby quantifying the spatial boundaries of ecological responses. By analyzing the distribution characteristics of these mutation points, the study revealed the response patterns of different river segment ecosystems to changes in water volume and their underlying driving mechanisms.
Spatial Patterns: the ecological response scope and patterns in the upper, middle, and lower reaches of the case study area exhibit significant differences. In the upper reaches flowing through mountainous areas, the ecological impact scope is primarily confined to the river valley due to topographic constraints, with an average mutation point distance of 175 m from the river centerline. The middle reaches pass through urban areas, where the distribution of mutation points is largely restricted within approximately 150 m from the river channel, closely aligned with urban land boundaries and constrained by artificial embankments and built-up areas. The lower reaches flow through agricultural zones, where the correlation between NDVI and water surface area is generally weak due to farming practices and human management interventions, and no statistically significant spatial-mutation point pattern was formed.
Temporal Dynamics: following the implementation of the ecological water supplementation project in 2019, the positions of mutation points in most river segments showed varying degrees of outward expansion, this expansion indicates that the riparian zone where vegetation shows a statistically significant response to river water fluctuations is widening. Taking a typical natural vegetation segment as an example (Figure 10), the average outward shift of mutation points was 343.75 m, with a maximum expansion of 500 m, indicating that the increase in river water volume significantly promotes the growth of riparian natural vegetation and expands its zone of influence. Moreover, as shown in Figure 10, although this expansion is uneven, with varying ranges across different months, it is consistently and significantly greater after 2019 compared to the period before 2019, providing visual confirmation of the policy’s effectiveness. In contrast, within urban segments (Figure 11), mutation points remained strictly confined inside the embankments (average distance ≈ 150 m), reflecting the strong constraints imposed by hard engineering structures on ecological processes. Furthermore, there is no significant movement observed across different periods, indicating the persistent and enduring restriction of hard engineering structures on ecological dynamics. Similarly, the mutation point distance in a segment near a residential area (Figure 12) remained largely unchanged, roughly corresponding to the residential boundary, further demonstrating that land use patterns dominated by human activities are key factors controlling the ecological response scope in these segments.
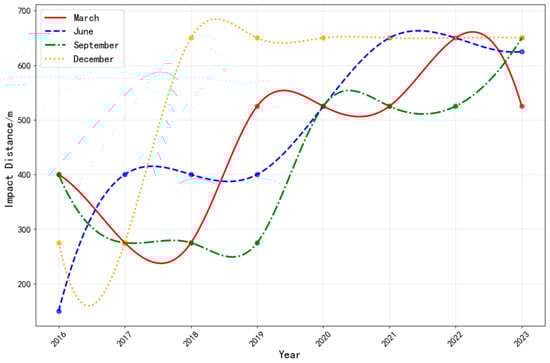
Figure 10.
Impact Range of River Changes in the Natural Vegetation Segment: Line Chart.
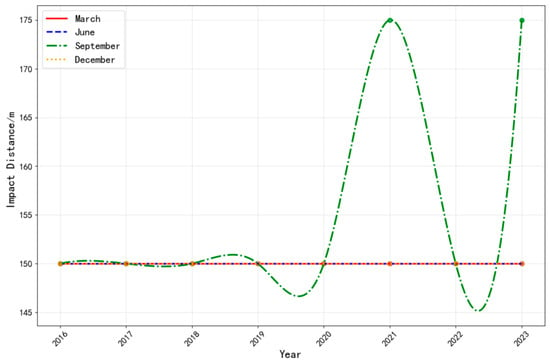
Figure 11.
Impact Range of River Changes in the Embankment Segment: Line Chart.
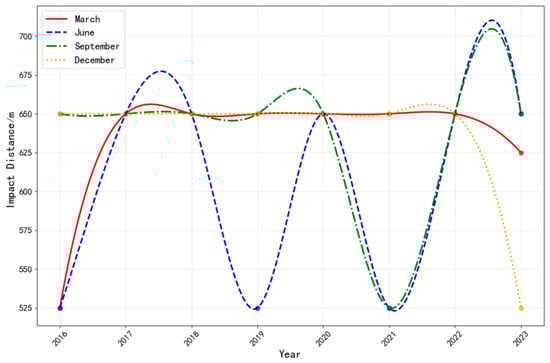
Figure 12.
Impact Range of River Changes in the Residential Segment: Line Chart.
The impact of water surface area changes on the riparian ecosystem in the case study area exhibits significant spatiotemporal heterogeneity. In river segments dominated by natural vegetation, increased water flow effectively promotes vegetation restoration and expands its ecological influence range. In contrast, in areas with intensive human activities, the scope of ecological response is primarily constrained by land-use types and the layout of artificial structures.
The findings of this study are highly consistent with the theoretical consensus and cutting-edge developments in riparian ecology, providing concrete case support for existing knowledge in the field. Guo Erhui et al. [45] noted in a systematic review that hydrological changes are the primary driver of riparian ecosystems, directly influencing the spatial distribution, functional traits, and survival adaptation strategies of vegetation, as well as regulating the migration and transformation of key elements such as nitrogen and phosphorus in soil by modulating surface and groundwater dynamics. The phenomenon observed in this case—“increased water flow in natural river segments promotes vegetation restoration and expands its ecological influence range”—exemplifies this mechanism: appropriate hydrological restoration reshapes soil moisture gradients, improves microhabitats for seed germination and plant establishment, and enhances photosynthesis and biomass accumulation in typical riparian vegetation such as reeds, thereby driving the natural expansion of ecosystem structure and function.
More importantly, the findings of this study further reveal the fundamental differences in hydrological–ecosystem coupling under natural and anthropogenic disturbance conditions. Guo Erhui et al. [45] emphasized that riparian ecological processes are influenced by multiple interactions among hydrology, soil, vegetation, and human activities, with river morphology and soil heterogeneity collectively shaping the complex characteristics of hydrological effects. In the human activity-intensive areas examined in this study, “land use types and the layout of artificial structures” have emerged as key structural constraints on ecological responses. Specifically, engineered structures such as hardened revetments and channelization projects weaken hydrological connectivity and disrupt natural water level fluctuations and inundation patterns, while urbanization or agricultural development replace original complex vegetation layers and simplify soil biogeochemical cycling functions. These anthropogenic disturbances significantly reduce the ecosystem’s capacity to adapt to and recover from hydrological changes, leading to “compressed” or “directionally locked” ecological response ranges limited in spatial extent and functional dimensions, unlike the systemic expansion observed in natural river segments. This conclusion aligns perfectly with the discussion in reference [45] regarding how vegetation structure (width, continuity) regulates nutrient retention efficiency and how human activities trigger declines in ecosystem services.
The methodology proposed in this study quantitatively delineates the differential effects of the ecological water supplementation policy across various river segments from a spatial perspective, providing a scientific basis for subsequent refined and differentiated river ecological restoration and management.
To conclude, in the Yongding River case, the method clearly revealed a significant expansion trend in water surface area after 2019. While ecological water supplementation achieved full river connectivity by increasing water volume, it did not simply enhance artificial regulation but reconfigured the watershed’s driving mechanisms. The analysis results indicated that the relative contribution of artificial regulation (discharge from the Guanting Reservoir) decreased by approximately 35%, while the influence of natural climatic factors shifted from statistically non-significant to significant. This demonstrates that the success of the ecological water-supplementation project lies not only in the water transfer itself but also in its ability to reactivate the inherent connection between river hydrological processes and regional natural climatic conditions, thereby enhancing the resilience of the river ecosystem. The aforementioned conclusions strongly resonate with the findings of Jiao et al. [46] on vegetation net primary productivity (NPP) changes driven by ecological water conveyance in the mainstream of the Tarim River. Although the two studies focus on different ecological indicators and regional hydrological characteristics, they both reveal that the core role of ecological water replenishment projects lies in reconstructing the “natural–anthropogenic” driving balance, rather than merely supplementing water volume. The value of this method lies in providing a quantitative means to capture this “mechanism reconfiguration” process.
5. Conclusions
This study proposes a universal quantitative analysis method based on remote sensing for assessing the spatiotemporal variations in rivers, which can provide methodological support for monitoring physical water area, evaluating ecological restoration effectiveness, and guiding management in different river basins. The feasibility of this method was successfully validated using the Yongding River (Beijing Section) as a case study. The main conclusions are as follows. (1) Method Application Effectiveness: Through systematic analysis, this study reveals the spatiotemporal variation trends of water surface area in the Yongding River (Beijing section) from 2016 to 2023, quantitatively assesses the impact of its dynamics on the ecosystems of both banks, and further clarifies the critical role of the ecological water-supplementation policy in activating the natural climatic driving forces within the watershed. (2) Methodological Value: This study confirms that the constructed modular framework, “Dynamic Monitoring—Time Series Analysis—Driver Identification—Spatial Heterogeneity Analysis”, exhibits strong logical consistency and technical feasibility. The core methods used (STL, correlation analysis, clustering, Pelt) are all mature techniques, but their cascaded integration forms a universal analytical framework that transcends individual case studies. This framework is suitable for revealing the eco-hydrological processes of rivers with different characteristics. Its data foundation (public datasets) and methodological core (standardized workflow) ensure good transferability.
The modular framework proposed in this study for assessing the spatiotemporal variation in ecological water-replenishment benefits of rivers demonstrates notable advantages in terms of data accessibility, methodological maturity, and transferability. However, the framework still exhibits certain limitations: the current QASViewSBR has not yet achieved deep integration with eco-hydrological mechanism models, and it lacks systematic incorporation of multi-source observational data, such as groundwater levels and soil moisture. These factors collectively constrain its accuracy and predictive capability in evaluating the service functions of complex river ecosystems. Future research will focus on advancing model integration and multi-source data synergy to further enhance the comprehensive analytical performance of this framework.
Author Contributions
Conceptualization, Q.Q. and L.L.; methodology, L.L.; validation, L.L.; formal analysis, H.Z. and Q.Q.; investigation, L.L.; resources, Q.Q.; data curation, L.L.; writing—original draft preparation, L.L.; writing—review and editing, Q.Q. and H.Z.; visualization, L.L.; supervision, Q.Q. and H.Z.; project administration, Q.Q.; funding acquisition, Q.Q. All authors have read and agreed to the published version of the manuscript.
Funding
This research received no external funding.
Institutional Review Board Statement
Not applicable.
Informed Consent Statement
Not applicable.
Data Availability Statement
The data that support the findings of this study are available from the corresponding author upon reasonable request.
Conflicts of Interest
The authors declare that the research was conducted in the absence of any commercial or financial relationships that could be construed as a potential conflict of interest.
Abbreviations
The following abbreviations are used in this manuscript:
| QASViewSBR | Quantitative Analysis of Spatiotemporal Variations in Ecological Water Supplementation Benefits of Rivers Based on Remote Sensing |
| STL | Seasonal and Trend decomposition using Loess |
| NDVI | Normalized Difference Vegetation Index |
| MNDWI | Modified Normalized Difference Water Index |
| OTSU | Otsu’s method |
| GPP | Gross Primary Productivity |
| pet | Potential Evapotranspiration |
| pre temp | Precipitation Temperature |
References
- Meyer, J.L. Stream health: Incorporating the human dimension to advance stream ecology. J. N. Am. Benthol. Soc. 1997, 16, 439–447. [Google Scholar] [CrossRef]
- Nangyal, H.; Khan, S.M. Environmental Pollution, Biodiversity, and Sustainable Development: Issues and Remediation; Apple Academic Press: New York, NY, USA, 2019. [Google Scholar]
- Zhang, S.; Zhou, Y.; Yu, R.; Xu, X.; Xu, M.; Li, G.; Wang, W.; Yang, Y. China’s biodiversity conservation in the process of implementing the sustainable development goals (SDGs). J. Clean. Prod. 2022, 338, 130595. [Google Scholar] [CrossRef]
- Qi, L.; Jinlong, X.; Ming, L. Review of River Health Research in China and Abroad. China Water Transp. 2021, 21, 86–88. [Google Scholar]
- Zhang, W.; Liu, H.; Luo, H. Research Status and Prospects of River Health Assessment. Water Resour. Plan. Des. 2021, 4, 57–62. [Google Scholar]
- Gunawardhana, L.N.; Al-Rawas, G.A. Investigating meteorological effect on river flow recession rate in an arid environment. Hydrol. Sci. J. 2020, 65, 2249–2255. [Google Scholar] [CrossRef]
- Zhang, B.; Wang, Y.; Li, J.; Zheng, L. Degradation or Restoration? The Temporal-Spatial Evolution of Ecosystem Services and Its Determinants in the Yellow River Basin, China. Land 2022, 11, 863. [Google Scholar] [CrossRef]
- Fu, L.; Dong, X.; Shen, H.; Zhu, T.; Sun, F. River Ecosystem Health Assessment in Rapid Urbanization Regions (Shenzhen, China) under the Guidance of Bioremediation Objectives. Water 2023, 15, 3859. [Google Scholar] [CrossRef]
- Li, T.; Wu, P.; Zuo, L.; Yang, J. Impacts of tidal creek development on vegetation restoration during ecological water supplement in the Yellow River Delta. J. Geogr. Sci. 2025, 35, 1365–1380. [Google Scholar] [CrossRef]
- Pu, Z.; Bai, J.; Zhang, Q.; Tian, K.; Yan, Y.; Zhao, W. Ecological water replenishment through optimal allocation of lake water in water-scarce areas based on channel selection and replenishment period: A case study of China’s Baiyangdian Lake. Sci. Total Environ. 2024, 956, 177340. [Google Scholar] [CrossRef]
- Jiang, W.; Zhuang, W.; Wen, C.; Pang, Y.; Chao, J. Calculation of ecological water replenishment in small coastal watersheds based on environmental capacity constraints: A case study of eastern Xiamen, China. Ecol. Indic. 2023, 155, 111034. [Google Scholar] [CrossRef]
- Nan, T.; Cao, W. Effect of Ecological Water Supplement on Groundwater Restoration in the Yongding River Based on Multi-Model Linkage. Water 2023, 15, 374. [Google Scholar] [CrossRef]
- Shen, Y.; Liu, X.; Yuan, X.; Qing, D.; Cau, H.; Wang, H. Spatiotemporal characterization and relationships of meteorological factors, river water quality and quantity in the Weihe River Basin, China. J. Hydrol. Reg. Stud. 2025, 61, 102733. [Google Scholar] [CrossRef]
- Yan, Y.; Wang, G.; A, Y.; Zhang, X.; Xue, B.; Wu, J.; Wang, Y. Spatiotemporal evolution of time-lagged vegetation responses to moisture conditions and the influencing factors in a highly human-impacted area in China. Ecol. Inform. 2025, 90, 103335. [Google Scholar] [CrossRef]
- Shi, H.; Mei, K.; Wu, Y.P.; Yang, M.M.; Wang, X.Y. The spatial scale effects of landscape pattern on water quality in the Wen-Rui Tang River watershed. Acta Sci. Circumstantiae 2024, 44, 390–402. [Google Scholar]
- Jiang, S.; Zhou, L.; Ren, L.; Wang, M.; Wei, L.; Yuan, F. Quantifying attribution of the river hydrological health variative based on ecological-flow threshold method. Adv. Water Sci. 2021, 32, 356–365. [Google Scholar] [CrossRef]
- Kuan, S. Study on lateral hydrological connectivity evaluation and floodplain vegetation response in the lower Yellow River. Master’s Thesis, North China Electric Power University, Beijing, China, 2023. [Google Scholar] [CrossRef]
- Bonacina, L.; Fornaroli, R.; Mezzanotte, V.; Vezzoli, G. Investigating the Effects of Flow Regulation Combining Stream Geomorphology With Macroinvertebrate Ecology: A Case Study in the Orobic Alps (Italy). Ecohydrology 2025, 18, e70082. [Google Scholar] [CrossRef]
- Pang, S.; Wu, L.; Luo, Y.; Wang, R.; Gao, T.; Guo, Z. A study on ecohydrological mutual feedback relationship of the Shangdong River basin based on hydrological connectivity. Sci. Total Environ. 2024, 927, 171957. [Google Scholar] [CrossRef]
- Calabrese, S.; Mezzanotte, V.; Marazzi, F.; Canobbio, S.; Fornaroli, R. The influence of multiple stressors on macroinvertebrate communities and ecosystem attributes in Northern Italy pre-Alpine rivers and streams. Ecol. Indic. 2020, 115, 106408. [Google Scholar] [CrossRef]
- Peng, S.; Shang, W.; Wang, Y.; Lu, J.; Zheng, X. Research on ecological impacts of the joint operation of cascade reservoirs in the upstream of the Yellow River. J. Hydraul. Eng. 2018, 49, 1187–1198. [Google Scholar] [CrossRef]
- Wang, X.; Ma, Y.; Zhuo, B.; Li, F.; Su, S.; Du, H.; Ma, H.; Sun, S.; Ji, H.; Zhang, R. Response of carbon flux of alpine ecosystems to hydrological and meteorological factors on the Qinghai-Tibet Plateau. J. Mt. Sci. 2025, 22, 2916–2935. [Google Scholar] [CrossRef]
- Zhu, E.; Samat, A.; Li, W.; Xu, R.; Xia, J.; Qiu, Y.; Abuduwaili, J. Intra- and inter-annual spatiotemporal variations and climatic driving factors of surface water area in the Irtysh River Basin during 1985–2022. Remote Sens. Appl. Soc. Environ. 2025, 37, 101455. [Google Scholar] [CrossRef]
- Zhang, T.J.; Du, L.W.; Li, T.Y.; Li, W.Z.; Zhang, Y.F.; Ye, Z.H.; Shi, C.Q.; Yu, Y.P. Phytoplankton community characteristics and their associations with environmental factors following ecological water replenishment in the Yongding River (Beijing section). Chin. J. Ecol. 2025, 44, 4041–4051. [Google Scholar]
- Shi, W.; Wang, B.; Tian, Y. Accuracy Analysis of Digital Elevation Model Relating to Spatial Resolution and Terrain Slope by Bilinear Interpolation. Math. Geosci. 2014, 46, 445–481. [Google Scholar] [CrossRef]
- Zhou, Q.X.; Jing, Z.L.; Jiang, S.Z. Wavelet Fusion Method for Remote Sensing Images Based on Bilinear Interpolation. J. Shanghai Jiaotong Univ. 2004, 4, 547–550. [Google Scholar] [CrossRef]
- Zhou, J.J.; Li, X.J.; Yu, X.Y. Extraction of Subsided Water Information in High Phreatic Coal Mining Area. Sci. Surv. Mapp. 2021, 46, 104–111. [Google Scholar] [CrossRef]
- Mandal, S.; Nunchhani, V.; Bandyopadhyay, A.; Bhadra, A. Development of QGIS plugin for flood inundation mapping: Applying Otsu’s thresholding technique. Sustain. Water Resour. Manag. 2024, 11, 7. [Google Scholar] [CrossRef]
- Yang, T.; Huang, L.; Fu, P.; Chen, X.; Zhang, X.; He, S. Combined multi-component composite time series power prediction model for distributed energy systems based on STL data decomposition. Measurement 2025, 253, 117299. [Google Scholar] [CrossRef]
- Wu, X.; Yang, X. A Nonlinear Subspace Predictive Control Approach Based on Locally Weighted Projection Regression. Electronics 2024, 13, 1670. [Google Scholar] [CrossRef]
- Darnah; Hayati, M.N.; Wahyuningsih, S.; Kamaruddin, I.; Suyitno; Dan, R.T.A.; Goejantoro, R.; Yuniarti, D.; Amijaya, T.D.F.; Purnamasari, I. Locally kernel weighted maximum likelihood estimator for local linear multi-predictor poisson regression. MethodsX 2025, 14, 103258. [Google Scholar] [CrossRef]
- Zeng, J.; Zhang, Y.; Zhang, Z.; Shan, F.; Shen, Z.; Liu, X. Identification of power battery voltage inconsistency faults in electric vehicles based on K-means++ clustering with dynamic k-values. Sci. Sin. Tech. 2023, 53, 28–40. (In Chinese) [Google Scholar] [CrossRef]
- Priyajit, B.; Tuhina, S. A Method for Fault Detection in Wireless Sensor Network Based on Pearson’s Correlation Coefficient and Support Vector Machine Classification. Wirel. Pers. Commun. 2021, 123, 2649–2664. [Google Scholar] [CrossRef]
- Yu, X.T.; Gao, C.; Lu, S.F.; Tang, X.P.; Zhang, S.L.; Zhan, X.Q.; Li, J.P. Risk Evolution of Compound Rainfall and Storm Surge Encounters in Qianshan River Basin Based on Copula Function [J/OL]. Hydrology 2025, 1–8. [Google Scholar] [CrossRef]
- Liu, Y.; Bao, Y.; Lu, H.; Gao, Q. Fuzzy K-means clustering without cluster centroids. Signal Process. 2026, 241, 110406. [Google Scholar] [CrossRef]
- Wang, H.S.; Cheng, C.; Shi, H.L.; Wang, X.H.; Ye, H.; Wu, S.C.; Sun, E.C. Construction Method of Atmospheric Modes Based on K-means Clustering and Random Forest Regression. Acta Opt. Sin. 2025, 45, 128–142. [Google Scholar]
- Wei, X.; Fan, J.; Wang, H.; Cai, L. Remaining Useful Life Prediction Method for Bearings Based on Pruned Exact Linear Time State Segmentation and Time-Frequency Diagram. Sensors 2025, 25, 1950. [Google Scholar] [CrossRef]
- Shu, X.; Xu, Z.X.; Ye, C.L.; Liao, R.T.; Jia, S.H. Coupled Micro- and Macro-Scale Modeling Under Flood Drivers: Social System Response and Resilience Analysis in Jincheng City. Water Resour. Prot. 2025, 41, 65–74+118. [Google Scholar]
- Katanbaf, R.; Misch, M.; Hoveidaei, H.A.; Smitterberg, C.; Petri, O.A.W.; Mont, A.M.; Nace, J.; Delanois, E.R. Income Inequality Quantified by the Gini Index Is an Indicator for Adverse Total Knee Arthroplasty Outcomes. J. Arthroplast. 2025; in press. [Google Scholar] [CrossRef]
- Kong, W.J.; Liu, Y.; Cao, Y.D.; Liu, S.X.; Xing, C.J. Research on Degradation State Division of AC Contactors Based on Improved Weighted TOPSIS and Pelt Algorithm. Proc. CSEE 2025, 45, 7306–7316. [Google Scholar] [CrossRef]
- Wang, Y.; Yuan, L.; Lu, Y.; Zeng, Y.; Liu, H. Structural succession and functional changes in the river ecosystem of the Yellow River estuary under the influence of ecological restoration measures. Ecol. Indic. 2025, 173, 113428. [Google Scholar] [CrossRef]
- Li, X.L.; Pan, X.Y.; Yang, M.Y.; Liu, B. Analysis of Runoff Changes in the Yongding River Basin Based on Ecological Water Supplementation. J. Beijing Norm. Univ. (Nat. Sci.) 2022, 58, 886–892. [Google Scholar]
- Shen, J. Study on the Evolution of Riverside Landscape Pattern and Planning Strategies in the Mentougou Gorge Section of the Yongding River. Master’s Thesis, North China University of Technology, Beijing, China, 2025. [Google Scholar] [CrossRef]
- Wohl, E.; Bledsoe, B.P.; Jacobson, R.B.; Poff, N.L.; Rathburn, S.L.; Walters, D.M.; Wilcox, A.C. The Natural Sediment Regime in Rivers: Broadening the Foundation for Ecosystem Management. Bioscience 2015, 65, 358–371. [Google Scholar] [CrossRef]
- Guo, E.H.; Fan, Z.H.; Zhang, R.X.; Sun, J.H.; Yang, X.T. Research progress on the responses of riparian ecosystem vegetation and soil to hydrological changes. Acta Ecol. Sin. 2021, 41, 9164–9173. [Google Scholar]
- Jiao, A.; Xu, J.; Deng, M.; Ling, H. Vegetation net primary productivity variation characteristics and optimization path in inland river basins of arid areas driven by ecological water conveyance: A case study of the mainstream of the Tarim river. Ecol. Indic. 2025, 176, 113676. [Google Scholar] [CrossRef]
Disclaimer/Publisher’s Note: The statements, opinions and data contained in all publications are solely those of the individual author(s) and contributor(s) and not of MDPI and/or the editor(s). MDPI and/or the editor(s) disclaim responsibility for any injury to people or property resulting from any ideas, methods, instructions or products referred to in the content. |
© 2026 by the authors. Licensee MDPI, Basel, Switzerland. This article is an open access article distributed under the terms and conditions of the Creative Commons Attribution (CC BY) license.