Abstract
Accurate measurement of semantic similarity between geographic terms is a fundamental challenge in geographic information science, directly influencing tasks such as knowledge retrieval, ontology-based reasoning, and semantic search in geographic information systems (GIS). Traditional ontology-based approaches primarily rely on a narrow set of features (e.g., semantic distance or depth), which inadequately capture the multidimensional and context-dependent nature of geographic semantics. To address this limitation, this study proposes an ontology-driven semantic similarity model that integrates a backpropagation (BP) neural network with multiple ontological features—hierarchical depth, node distance, concept density, and relational overlap. The BP network serves as a nonlinear optimization mechanism that adaptively learns the contributions of each feature through cross-validation, balancing interpretability and precision. Experimental evaluations on the Geo-Terminology Relatedness Dataset (GTRD) demonstrate that the proposed model outperforms traditional baselines, including the Thesaurus–Lexical Relatedness Measure (TLRM), Word2Vec, and SBERT (Sentence-BERT), with Spearman correlation improvements of 4.2%, 74.8% and 80.1%, respectively. Additionally, comparisons with Linear Regression and Random Forest models, as well as bootstrap analysis and error analysis, confirm the robustness and generalization of the BP-based approach. These results confirm that coupling structured ontological knowledge with data-driven learning enhances robustness and generalization in semantic similarity computation, providing a unified framework for geographic knowledge reasoning, terminology harmonization, and ontology-based information retrieval.
1. Introduction
The rapid digitization of geographic information has changed how geographic knowledge is organized, accessed, and interpreted. As geographic datasets continue to grow in scale and complexity, geographic information systems (GIS) increasingly rely on structured domain vocabularies and ontologies to support semantic search, geospatial data integration, concept alignment, and knowledge reasoning [1,2,3]. Central to these processes is semantic similarity computation, which quantifies how closely two geographic terms are related based on their conceptual and relational characteristics. Such capabilities are essential in a wide range of GIScience applications, including thematic keyword matching [4], geoparsing [5], the interlinking of heterogeneous geospatial datasets [6], and so on. For example, determining the semantic closeness between concepts such as land use and land cover is crucial for improving interoperability within Linked Geospatial Data infrastructures.
To support standardized representation of geographic knowledge, domain thesauri provide controlled and structured vocabularies in which concepts are represented by terms connected through explicitly defined semantic relations. A typical thesaurus consists of multiple term trees centered on top terms and linked through three primary relation types—equivalence (synonym or quasi-synonym), hierarchical (hypernym–hyponym), and associative relations [7,8]. These relations collectively form a polyhierarchical semantic structure. For instance, as illustrated in Figure 1, the concept environment connects to subordinate concepts such as social environment, geological environment, and geographical environment, creating a multilevel hierarchy that reveals both semantic dependency and conceptual granularity. It is also important to note that the semantic relations considered in this study are thesaurus-defined lexical relations—equivalence, hierarchical, and associative—and not geographic relations such as spatial adjacency, topological connectivity, or functional geographic interactions.
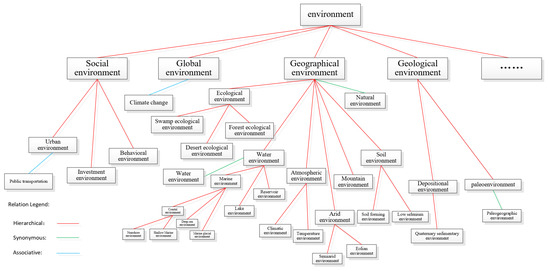
Figure 1.
One term tree from Thesaurus for Geographic Science.
In this study, all geographic terms are drawn from the Thesaurus for Geographic Sciences, a large expert-compiled vocabulary developed by several institutes of the Chinese Academy of Sciences. The thesaurus contains more than 10,800 geographic and environmental terms in both Chinese and English and adheres to the ISO-25964-1-2011 and its predecessor [9]. It includes terminology covering natural phenomena, geomorphological features, environmental processes, climatic concepts, and other domain-specific entities that are not typically represented in general-purpose lexical databases such as WordNet [10].
To operationalize this thesaurus for semantic similarity modeling, all geographic terms are formalized as labeled concept nodes within a polyhierarchical ontology. The three thesaurus-defined semantic relation types serve as typed edges connecting these nodes, giving rise to a directed acyclic semantic graph rather than a single-rooted tree. This explicit graph representation defines where the terms “live” and provides the structural foundation for computing ontological characteristics such as semantic distance, depth, overlap, density, and relation type. These ontological indicators form the basis of the semantic features modeled in this study.
Despite the availability of such structured vocabularies, accurately computing semantic similarity between geographic terms remains challenging. Geographic terminology is embedded in polyhierarchical and cross-cutting structures, exhibits uneven conceptual granularity, and participates in multiple contextual and associative relationships. Traditional similarity measures emphasize a limited set of semantic attributes—such as path length, hierarchical depth, or information content—while neglecting the complex, context-dependent nature of geographic semantics. These single-dimensional metrics capture structural distance effectively but often fail to represent the associative and overlapping relationships among geographic terms. Geographic concepts frequently interact across hierarchical boundaries and share multiple semantic contexts, making it difficult for traditional rule-based or distance-based methods to generalize across diverse ontological structures. Moreover, empirical or fixed weighting schemes introduce subjectivity and constrain model adaptability, leading to inconsistent similarity estimation across datasets or application scenarios.
This study aims to develop a semantic similarity computation framework capable of capturing these complexities by integrating multiple ontological indicators and learning their interactions adaptively. Consequently, we propose an ontology-driven similarity model incorporating five complementary semantic dimensions: semantic distance, hierarchical depth, semantic density, semantic overlap, and relation type. These indicators are combined using a backpropagation (BP) neural network, which serves as a nonlinear optimization mechanism that automatically learns the relative importance of each feature. This hybrid approach leverages both the interpretability of ontology-based semantic descriptors and the flexibility of data-driven learning.
The proposed model is validated using the geographic thesaurus dataset and compared with representative ontology-based similarity measures. Experimental results show that integrating multiple semantic indicators within a neural learning framework achieves higher agreement with expert judgments and demonstrates improved robustness across diverse categories of geographic terminology.
The remainder of this paper is organized as follows: Section 2 reviews related works. Section 3 introduces the construction of the semantic indicators and the BP-based similarity model. Section 4 describes the experimental setup and reports comparative evaluation results. The last section concludes the research and discusses the future research directions.
2. Related Work
Semantic similarity quantifies how closely two terms are related by mapping their relationships to numerical scores. Over the past decades, a wide range of methods has been developed for semantic similarity computation, including string-based, corpus-based, knowledge-based approaches [11], and others. Among these categories, knowledge-based methods—particularly ontology-driven models—have gained increasing attention because ontologies explicitly represent concepts and their semantic relations, providing a structured foundation for similarity modeling.
2.1. Ontology-Based Semantic Similarity Methods
Ontology-based semantic similarity algorithm models can be roughly divided into four types: ontology structure-based models, attribute-based models, information content-based models, and hybrid models [12], among which ontology structure-based models are the most widely studied. Chen et al. [13] used the shortest path length, depth, and local semantic density to evaluate the semantic relevance of geographic terms. Sun et al. [14] contended that the ontology structural factors affecting semantic similarity could be divided into concept depth, concept density, information factor, and semantic distance. Jackson et al. [15] discussed semantic overlap and concept width, and Li et al. [16] emphasized that edge types and intensities also affect term similarity. In addition, Putra et al. [17] believed that edge weights are an indispensable part of ontology tree construction.
These ontology structural features are usually linearly combined to form semantic similarity algorithms. However, the semantic complexity of ontologies and the limitations of traditional quantitative approaches make linear weighting overly dependent on empirically assigned parameters, which introduces subjectivity into similarity evaluation. Consequently, there is a growing need for data-driven or learning-based methods that can automatically capture the nonlinear and hierarchical relationships within ontological structures.
2.2. Learning-Based Semantic Similarity Methods
With the advancement of deep learning technology, significant breakthroughs have been achieved in fields such as speech recognition [18], computer vision [19], and natural language processing [20], including machine translation, text classification, and semantic similarity computation. Neural network–based approaches, ranging from traditional Backpropagation (BP) neural networks to advanced graph convolutional networks (GCNs), have been increasingly adopted in semantic similarity modeling, effectively reducing human intervention and enhancing the objectivity of similarity evaluations. For example, Bao et al. [21] proposed a Spotted Hyena Optimization–improved BP neural network (SHO-BP) for measuring the semantic similarity of traffic infrastructure ontologies, and Sun et al. [22] applied a GCN-based framework to represent ontologies as heterogeneous graph networks, enabling semantic similarity computation without external knowledge.
Beyond ontology-structured learning, corpus-driven distributed representations also constitute an important branch of learning-based similarity modeling, offering vectorized representations of terms derived from co-occurrence statistics in large text corpora [23]. Classical static embeddings such as Word2Vec [24] have been widely adopted as baseline methods in semantic similarity tasks. More NLP research highlights the advantages of contextualized embeddings, such as BERT (Bidirectional Encoder Representations from Transformers) [25], which dynamically encode semantic meaning based on sentence-level context. To further address the limitations of vanilla BERT in similarity estimation, Sentence-BERT (SBERT) [26] was proposed by introducing a Siamese architecture and similarity-oriented training objectives, enabling the generation of sentence-level embeddings that are directly comparable using cosine similarity.
However, contextual embedding models typically rely on large-scale general-purpose textual corpora and may exhibit limited effectiveness when applied to domain-specific thesauri characterized by sparse definitions and highly specialized terminology [27]. Although SBERT improves semantic similarity estimation compared with standard BERT through similarity-oriented training objectives, both approaches remain primarily corpus-driven and are not explicitly trained to model ontology-specific hierarchical and relational semantics. Consequently, both static embeddings and contextualized language models continue to serve as widely adopted baseline approaches for semantic similarity computation involving specialized domain terminology, including the geographic concepts examined in this study.
2.3. Geographic Ontology–Based and Hybrid Models
In geographic information science, numerous methods have been proposed to compute the semantic similarity of geographic ontology concepts. Some studies have primarily focused on integrating spatial and attribute information. For example, Rodriguez and Egenhofer [28] developed the Matching Distance Similarity Measure (MDSM), which combines feature-based and distance-based similarity models to evaluate the similarity of geospatial entities. Su et al. [3] further incorporated distance, attribute, and inter-concept relational factors to construct a comprehensive, multi-perspective geographic semantic similarity model, effectively capturing the complex relationships among geographic concepts. Other research has employed linguistic and ontology-based methods. Čerba and Jedlička [29] utilized multi-thesaurus lexical information to enhance conceptual similarity evaluation. Han et al. [30] proposed a hybrid method that combined particle swarm optimization with a BP neural network to improve learning efficiency. Y. et al. [31] and Yao and Meng [32] further integrated ontology attributes, hierarchical structures, and semantic relationships to achieve higher accuracy.
Despite progress in ontology-based and hybrid geographic semantic similarity models, current research in geographic information science still faces two major challenges. At the semantic level, existing studies often rely on a narrow set of ontology features—such as semantic distance or concept depth—and fail to integrate multiple semantic dimensions including distance, depth, density, overlap, and relational attributes, resulting in limited accuracy. At the methodological level, although BP neural networks have been used in geographic term similarity modeling, they are seldom combined with structured geographic ontology knowledge, leading to insufficient feature representation and limited generalization capacity.
To provide a clear overview of existing models, Table 1 summarizes representative semantic similarity methods, their feature types, and known limitations.

Table 1.
Representative semantic similarity methods, feature types, and limitations.
To overcome the two challenges above, this study integrates multidimensional semantic indicators derived from a geographic ontology with a BP neural network, enabling adaptive learning of nonlinear interactions among semantic features and offering a more accurate and scalable framework for geographic term similarity evaluation.
3. Ontology-Driven Semantic Similarity Model Using BP Neural Network
Semantic similarity calculation quantifies the relevance of terms as real numbers, which are then normalized. Different fields use various methods for calculating semantic similarity, generally categorized into four types: string-based methods, corpus-based methods, knowledge-based methods [11], and others. Ontology, being able to precisely express the meanings of concepts and their relationships, which can be widely applied in world knowledge-based semantic similarity methods.
3.1. Overview of the BP Neural Network
The Backpropagation (BP) neural network, originally proposed by Rumelhart et al. [33], is a multilayer feedforward network trained primarily using the gradient descent algorithm [34]. The training process iteratively adjusts the connection weights and biases to minimize the error between predicted and actual outputs.
As illustrated in Figure 2, a standard BP neural network consists of three layers: an input layer, a hidden layer, and an output layer. However, to adequately capture the complex, non-linear dependencies among the five mixed semantic indicators, the BP-based model in this study adopts a multi-hidden-layer structure with two hidden layers. This dual hidden-layer design is implemented to enhance the network’s nonlinear expressiveness and convergence stability, balancing model complexity and performance.
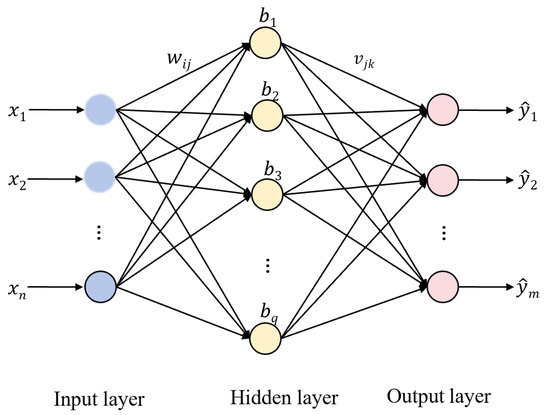
Figure 2.
BP Neural Network Model Structure Diagram.
The input layer serves as an interface for receiving and transmitting external feature vectors to the network. The hidden layers perform nonlinear transformations to capture complex feature interactions and approximate the underlying mapping between inputs and outputs. The output layer produces the final prediction values. The inter-layer connections, defined by weight matrices and bias vectors, improve the network’s nonlinear representation and generalization capability.
The BP learning process includes two main phases: forward propagation and backpropagation. During forward propagation, input data are linearly transformed and then passed through an activation function to introduce nonlinearity. In this study, the function is used as the activation function due to its symmetric output range and smooth gradient properties, which are beneficial for semantic similarity regression tasks. The difference between the predicted output and the target output is quantified using the mean squared error function. During backpropagation, the gradient of the loss function is propagated backward to update the parameters, thereby iteratively optimizing the mapping from inputs to outputs until convergence or the maximum number of epochs is reached.
3.2. Ontological Semantic Feature Modeling
The semantic similarity between two geographic terms is determined by their structural relationships within the constructed terminology ontology. This section introduces the conceptual definitions used in the ontology (Section 3.2.1), followed by five categories of semantic similarity measures (Section 3.2.2, Section 3.2.3, Section 3.2.4, Section 3.2.5, Section 3.2.6). These measures quantify complementary aspects of conceptual relatedness and jointly form the feature input to the BP neural network.
3.2.1. Related Definition
To establish a clear conceptual basis for the ontology-based semantic modeling, this subsection formalizes the essential structural and relational definitions adopted in the constructed geographic terminology ontology. The ontology exhibits a poly-hierarchical structure, allowing multiple inheritance, synonym clusters, and cross-category associative links.
Definition 1.
Concept Node and Ontology Structure: Each geographic term is represented as a concept node c within a polyhierarchical semantic graph. Nodes may have multiple parent concepts due to synonymy or cross-domain associations, so the ontology does not form a strict single-rooted tree but a directed acyclic semantic structure. This structure corresponds to typical SKOS-like terminological systems but allows additional associative links.
Definition 2.
Semantic Relation Types: For any two concepts c1 and c2, their semantic connection falls into one of three categories:
- (1)
- Synonymous/Equivalent Relation: c1 and c2 denote the same geographic concept or belong to the same synonymy set.
- (2)
- Hierarchical Relation: c1 and c2 are connected by hypernym–hyponym relations within the conceptual hierarchy.
- (3)
- Associative Relation: c1 and c2 are semantically linked but neither synonymous nor hierarchical, such as causal, functional, topical, or spatial associations.
These three categories represent the core semantic connections used in geographic terminology systems and form the structural basis for all subsequent similarity computations.
Definition 3.
Paths and Connectivity: A path between two concepts is any sequence of edges formed by the three semantic relation types. Because the ontology supports multiple inheritance, several valid paths may exist between c1 and c2. Connectivity reflects the minimal conceptual transitions required to link the two terms.
Definition 4.
Depth: The depth of a concept c is the number of hierarchical levels separating it from the most abstract root concept along the longest hypernym chain. This definition is consistent with polyhierarchical ontologies, where a node may have multiple possible hypernym paths.
Definition 5.
Lowest Common Subsumer (LCS): For two concepts c1 and c2, a concept r is a lowest common subsumer (LCS), if: r is a shared hypernym of both c1 and c2 and no descendant of r satisfies condition. If multiple candidates exist, the LCS with the maximum depth is selected, representing the most specific shared abstraction.
Definition 6.
Semantic Density: The semantic density of a concept c is defined as the number of descendant nodes within its hierarchical subgraph. This quantity reflects the granularity and conceptual concentration surrounding c, indicating how semantically rich its subregion in the ontology is.
3.2.2. Similarity Calculation Based on Semantic Distance
Semantic distance reflects the minimal number of conceptual transitions required to connect two concepts within poly-hierarchical ontology. In this study, the distance between two concepts c1 and c2, denoted as , is defined as the length of the shortest valid path connecting them in the ontology graph.
A valid path may include any combination of the three semantic relation types defined in Section 3.2.1—synonymy, hierarchical (hypernym–hyponym), and associative relations. Each edge along the path contributes a unit distance, consistent with standard path-length formulations used in ontology-based semantic similarity.
Formally,
where denotes the set of all relation-consistent paths between the two concepts, and represents the number of edges in path .
Because the ontology is not a single-rooted tree but a multi-rooted poly-hierarchy (as in SKOS), the shortest-path definition is necessary and standard for capturing concept proximity. The classic semantic models (e.g., Ge and Qiu [35]) established a quantitative relationship between semantic distance and semantic similarity. The basic formula can be defined as
where is an adjustable parameter. In existing studies [30], is commonly used, but this normalization causes an abrupt drop in similarity when changes from 0 to 1, failing to maintain smooth variation.
To address this issue, this study adopts an exponential decay function:
where is a tunable coefficient controlling the decay rate. This function provides a stable and differentiable similarity measure, facilitating subsequent neural network learning.
3.2.3. Similarity Calculation Based on Semantic Depth
In a poly-hierarchical ontology, a concept may have multiple hypernym paths. Therefore, the depth of a concept is defined as
where is the set of hierarchical paths from to any top-level concept.
The classical approach proposed by Wu and Palmer [36] quantifies the similarity between two concepts based on the relative depth of their least common subsumer (LCS). Specifically, the similarity is calculated as follows:
where and denote the hierarchical depths of the two concepts, and represents the depth of their least common subsumer.
Although effective, this ratio-based formulation exhibits limited sensitivity to variations in deeper hierarchical structures, and its linear behavior cannot fully capture the nonlinear nature of semantic attenuation. To better reflect the exponential decrease in similarity with increasing depth difference, this study adopts an exponential decay formulation:
where is a tunable coefficient controlling the decay rate. This nonlinear form has been shown in related studies to produce smoother similarity transitions and to align well with adaptive learning frameworks such as the BP neural network used in this research [37].
3.2.4. Similarity Calculation Based on Semantic Overlap
Semantic overlap describes the extent to which two concepts share common semantic content or subordinate nodes. A higher degree of overlap between the descendant nodes of two concepts generally indicates greater semantic similarity [38]. To accommodate the poly-hierarchical nature of the ontology used in this study (i.e., a concept may have multiple hypernym paths), the path-to-root node set of a concept is defined as the union of all nodes appearing in any hierarchical route from that concept to a top-level term.
Accordingly, the similarity between concepts and based on semantic overlap can be defined as follows:
where and denote the sets of all nodes occurring in any hierarchical path from and to the corresponding root terms in the ontology, measures the shared conceptual ancestors across all possible paths, measures the total set of unique ancestors involved.
Because the ontology is poly-hierarchical, a concept may belong to multiple branches; using the union of all possible hierarchical paths ensures that the overlap ratio fully reflects the structural characteristics of the ontology. A larger ratio indicates greater semantic overlap and thus higher conceptual similarity.
3.2.5. Similarity Calculation Based on Semantic Density
Semantic density measures the degree of conceptual concentration within an ontology hierarchy [39]. Intuitively, a concept located in a densely populated region—i.e., one with many descendants—represents a finely differentiated semantic category, whereas a concept with fewer descendants corresponds to a more general abstraction.
To ensure reproducibility, we formally define the semantic density of a concept as
where includes all descendants reachable through hierarchical relations, consistent with poly-hierarchy semantics. This definition follows the commonly adopted approach in semantic-density–based similarity models, where the number of descendant nodes is used to characterize the conceptual granularity of a region within the ontology.
Using this definition, the semantic-density-based-similarity between and can be computed as
where and denote the densities of and , respectively; is the density of their lowest common subsumer; and represents the maximum node density in the ontology. This normalized measure ensures that semantic similarity increases with higher local concentration of concepts.
3.2.6. Similarity Calculation Based on Semantic Relations
Semantic relations characterize the structural and associative connections between concepts in the ontology [40,41]. Conventional relation-based similarity models typically assign fixed weights to relation categories such as synonymy, hierarchical relations, or part–whole associations. Although intuitive, this discrete weighting approach cannot capture the gradual attenuation of semantic relevance across relation types, especially in complex polyhierarchical ontologies.
To address this limitation, we introduce an exponential decay model that transforms relation types into a unified semantic distance measure. For any two concepts and , we define the relation distance as
This discrete mapping provides a consistent and reproducible numerical representation of semantic relation strength, with smaller values indicating stronger semantic ties. This provides a unified relation-distance system compatible with multi-parent and multi-relational structures in SKOS-like ontologies.
Using this mapping, the relation-based similarity is modeled as
where is a tunable decay coefficient controlling the sensitivity of similarity with respect to relation distance. For example, with , the computed similarity values for approximate 1.00, 0.50, and 0.25, respectively, yielding a smooth and interpretable attenuation pattern.
This exponential formulation generalizes the conventional discrete weighting scheme into a continuous similarity model. It preserves interpretability while providing greater robustness and flexibility for capturing nuanced relational differences in polyhierarchical ontologies.
3.3. Integrated Similarity Model Based on BP Neural Network
In traditional semantic similarity computation, multiple similarity indicators are typically integrated using a linear weighted summation, where the weights are manually assigned based on expert experience. Such heuristic weighting introduces subjectivity and may lead to inconsistent results.
To address this issue, this study constructs a BP neural network–based comprehensive semantic similarity model to automatically learn the nonlinear relationships among different similarity indicators. The model integrates five types of similarity indicators—semantic distance, semantic depth, semantic overlap, semantic density, and semantic relations—as input features to the BP neural network. Figure 3 illustrates the overall workflow of the proposed framework.
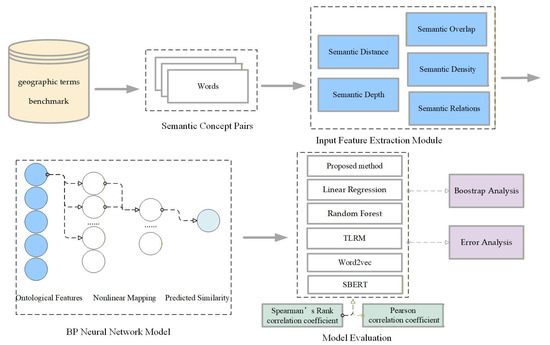
Figure 3.
Workflow of the BP-based semantic similarity framework.
3.3.1. Model Input and Output Structure
For each pair of concepts , five similarity metrics are first calculated based on Section 3.2.2, Section 3.2.3, Section 3.2.4, Section 3.2.5, Section 3.2.6, resulting in the feature vector:
The BP neural network learns a nonlinear mapping from these five input features to a comprehensive similarity score , which approximates the expert-assigned or benchmark similarity value:
where and denote the weight and bias parameters learned during the network training process. Because all input similarity indicators are normalized within , no additional normalization is required before training.
3.3.2. Network Architecture and Parameter Design
To ensure model simplicity and interpretability, the BP network adopts a three-layer architecture, consisting of an input layer, a single hidden layer, and an output layer. The input layer consists of 5 neurons, corresponding to the five similarity indicators. The hidden layer can be empirically set to 6–10 neurons to balance nonlinear fitting capability and computational efficiency; the activation function uses , allowing for smooth nonlinear transformations. The output layer consists of 1 neuron, representing the comprehensive similarity score .
The training objective minimizes the mean squared error (MSE) between the predicted and reference similarity values:
where is the number of training samples. Weights and biases are iteratively updated through gradient descent until convergence or until the preset tolerance threshold is met.
3.3.3. Parameter Simplification Strategy
To enhance robustness and reproducibility, each base similarity model defined in Section 3.2 contains no more than one scaling parameter (e.g., the decay coefficient in exponential functions). Such minimal parameterization ensures that the BP neural network focuses on learning the intrinsic nonlinear dependencies among similarity indicators rather than compensating for overparameterized formulas. This design reduces manual hyperparameter sensitivity and allows consistent results across different datasets.
The selection of hyperparameters, such as the number of hidden neurons (6–10), the activation function (), and the training approach (gradient descent with MSE minimization), was guided by both empirical observations and computational efficiency considerations. The activation function was chosen for its smooth gradient properties, which enhance convergence and provide stable learning in nonlinear regression tasks. Moreover, the number of hidden neurons was empirically set to balance model complexity and computational efficiency—too few neurons may result in underfitting, while too many could lead to overfitting. This balance is critical to ensure that the model remains interpretable and computationally efficient while achieving optimal performance.
Additionally, by restricting the number of parameters in each base similarity model, we ensure that the BP neural network can generalize effectively while maintaining its robustness, making the model scalable to larger datasets in the future.
3.3.4. Training and Evaluation Strategy
The BP network is trained on benchmark semantic similarity datasets. The dataset is split into training and validation subsets in a specific ratio to prevent overfitting. Model performance is quantitatively assessed using two standard evaluation metrics. Spearman’s rank correlation coefficient evaluates consistency with human judgment. Mean Squared Error (MSE) measures prediction accuracy.
Compared with traditional fixed-weight fusion methods, the BP-based model dynamically adjusts the contribution of each semantic dimension. This approach enables the model to capture the nonlinear relationships among semantic indicators and improves the generalization capability of the final similarity computation.
In addition, to further assess the robustness of the BP-based model, a bootstrap resampling procedure was employed, where 10,000 resamples were drawn from the benchmark dataset. This enabled the computation of confidence intervals for the Spearman correlation coefficients, providing statistical validation for the model’s performance. Error analysis was also performed to evaluate the model’s prediction errors at the instance level, revealing insights into its strengths and areas for improvement. These additional evaluations strengthen the claim that the BP-based model offers superior generalization and robustness compared to traditional models.
4. Evaluation
4.1. Dataset and Geographic Ontology Construction
The semantic similarity evaluation was conducted using the Geo-Terminology Relatedness Dataset (GTRD) proposed by Chen et al. [13], which provides expert-rated relatedness scores for pairs of geographic terminologies. The GTRD was originally constructed based on authoritative domain vocabularies in geographic sciences and is publicly available as an open benchmark dataset (https://github.com/czgbjy/GTRD/tree/master/Geo-Terminology%20Relatedness%20Dataset (accessed on 16 December 2025)).
From the GTRD benchmark, 38 pairs of geographic terms were selected for experimental evaluation. All selected terms originate from the Thesaurus for Geographic Sciences, which serves as the authoritative terminology source and ontology foundation in this study. This requirement ensures that the terms possess the necessary complete semantic structure for computing the five ontology-derived indicators defined in Section 3.2. The selected term pairs were divided into a training set (21 pairs) and a test set (17 pairs) for model learning and performance evaluation. Crucially, the selection ensured comprehensive coverage across different relatedness levels (high, medium, and low) and included diverse semantic relation types, such as hierarchical, synonymous, and associative relations. Although the dataset size is moderate, it is sufficient to support a proof-of-concept evaluation of the proposed model.
Before feature computation, a domain-specific ontology—referred to as the Geographical Thesaurus Tree—was constructed based on the hierarchical, synonymous, and associative structures defined in the Thesaurus for Geographic Sciences, as introduced in Section 1. In the ontology, each node represents a unique geographical concept, while edges represent three types of semantic relationships: hierarchical, synonymous, and associative. Hierarchical relations form the primary backbone of the structure, whereas synonymous and associative relations enrich lateral semantic connectivity. For example, Figure 4 illustrates a term tree with weather as the top concept, where subordinate concepts are connected through these relation types.
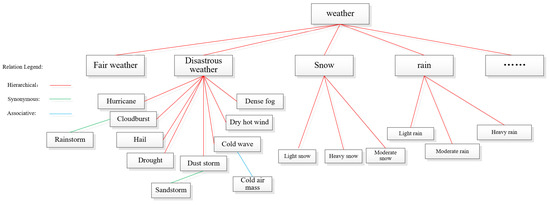
Figure 4.
Example of a geographical thesaurus tree.
The constructed thesaurus-based ontology provides the structural foundation for computing all five semantic indicators defined in Section 3.2, namely semantic distance, semantic depth, semantic overlap, semantic density, and semantic relations. Path-based measures (distance and depth) are derived from hierarchical branches, density is estimated from the local subgraph connectivity, and relation-based indicators are obtained from the weighted links among concepts. Each term pair is thus represented as a five-dimensional feature vector, with all features normalized to the [0, 1] interval for consistency.
To assess semantic similarity between concept pairs, four representative computational approaches were implemented:
- (1)
- BP-based semantic similarity model (this study): integrates the five indicators within a neural learning framework that adaptively optimizes their weights through backpropagation.
- (2)
- Thesaurus–Lexical Relatedness Measure (TLRM): a representative ontology-driven semantic relatedness model originally proposed by Chen et al. [13]. TLRM computes semantic relatedness by linearly combining multiple thesaurus-derived factors, including relation type (equivalence, hierarchical, associative), path distance, concept depth, and local semantic density, through a weighted parametric formulation. The parameter values used in this study follow the original settings reported in Chen et al., where they were determined offline using a nonlinear least-squares optimization procedure based on the Levenberg–Marquardt algorithm. In our experiments, TLRM is implemented as a fixed-parameter, deterministic baseline without further parameter adaptation. As such, it serves as a traditional non-learning ontology-based benchmark for comparison with the proposed BP-based model.
- (3)
- Word2Vec-based model: a corpus-driven approach capturing contextual similarity through distributed representations trained on large-scale Chinese text corpora [42,43]. Specifically, we employed the Tencent AI Lab Embedding Corpus for Chinese Words and Phrases (https://modelscope.cn/models/lili666/text2vec-word2vec-tencent-chinese/summary (accessed on 16 December 2025)), which provides 8 million Chinese words and phrases pre-trained with 200-dimensional embeddings. This large-scale model captures rich general linguistic co-occurrence patterns and has been widely used in various NLP downstream tasks. Incorporating this model serves as a general-purpose baseline to evaluate the transferability of open-domain semantic representations to specialized geographic terminology, thereby emphasizing the necessity of domain adaptation in semantic similarity computation.
- (4)
- Sentence-BERT (SBERT)-based model: A modern contextualized embedding approach for semantic similarity estimation. In this study, we adopted the pre-trained paraphrase-multilingual-MiniLM-L12-v2 model from the Sentence-Transformers framework (https://modelscope.cn/models/Ceceliachenen/paraphrase-multilingual-MiniLM-L12-v2 (accessed on 16 December 2025)), which generates sentence-level embeddings optimized for cosine similarity comparison. Unlike vanilla BERT models, SBERT employs a Siamese architecture and similarity-oriented training objectives, enabling direct and efficient computation of semantic similarity. This model serves as a strong contemporary baseline for benchmarking the proposed ontology-driven approach against representative modern contextualized embedding methods.
The predicted similarity scores produced by all three methods were compared against expert-rated GTRD scores using Spearman’s rank correlation coefficient () and Pearson correlation coefficient () to evaluate both monotonic agreement and linear consistency with human judgment.
4.2. Determination of Parameters
The BP-based semantic similarity model was designed to map a 5-dimensional semantic indicator vector to a scalar similarity score . Each input neuron corresponds directly to one semantic indicator defined in Section 3.2, and the single output neuron produces the final similarity prediction.
All five semantic indicators were naturally bounded within . Therefore, no additional normalization, feature transformation, or linear re-weighting is applied before neural learning. Throughout both training and evaluation, the BP neural network directly takes the original semantic indicator vector as input, ensuring strict consistency with the semantic modeling methodology described in Section 3.2.
For the parameterized similarity formulas introduced in Section 3.2, the exponential decay coefficients were determined independently through empirical grid search on a validation subset. Specifically, the decay parameters were tuned within , , ∈ [0.1, 1.0] using a step size of 0.05. The optimal values were selected by maximizing Spearman’s rank correlation coefficient with expert-rated similarity scores. The final parameter settings were = 0.35, = 0.40, and = 0.70, which yielded stable and consistent performance across the validation subset.
The network adopted a two-hidden-layer structure , which balanced model expressiveness and convergence stability. Hidden layers used the hyperbolic tangent () activation to capture nonlinear dependencies. To improve generalization, dropout (), early stopping (patience = 10), and adaptive learning rate decay were applied. The network was optimized using Adam () for a maximum of 100 epochs with mean squared error (MSE) as the loss function. The main parameters of the BP neural network model are summarized in Table 2.
Table 2.
Main parameters of the BP Neural Network Model.
Figure 5 shows the training and validation loss curves. The training loss steadily decreased and saturated after around 60 epochs, while the validation loss slightly increased beyond epoch 60, indicating mild overfitting. However, the generalization gap remained small (~0.03), confirming model robustness. Early stopping was thus triggered at epoch 70 for the final model. Although training was configured for 100 epochs, early stopping was activated at epoch 70, as shown by the divergence between training and validation losses beyond this point.
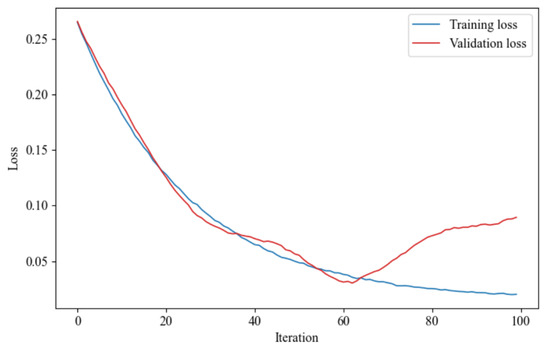
Figure 5.
Training and validation loss curves.
4.3. Empirical Validation and Comparative Analysis
4.3.1. Experiment Setup and Evaluation Metrics
To validate the effectiveness of the proposed BP-based semantic similarity model established in Section 4.1 and Section 4.2, comparative experiments were conducted using expert evaluation results as the reference standard. The testing dataset consisted of 17 pairs of geographic concept terms randomly selected from the domain ontology. Each concept pair was associated with an expert-evaluated similarity score from the GTRD benchmark dataset.
Following Reimers et al. [44], Spearman’s rank correlation coefficient () was adopted as the primary evaluation metric to assess the monotonic consistency between model outputs (X) and benchmark evaluations (Y), since human semantic judgments are often nonlinear and may not satisfy the assumptions of linear correlation. The Spearman rank correlation coefficient is defined as
where denotes the difference between the ranks of the paired observations and , and is the number of paired samples. A higher value (closer to 1) indicates stronger agreement between the predicted similarity and benchmark similarity.
To further assess linear agreement, the Pearson correlation coefficient () was also computed as a complementary measure:
This dual-metric evaluation provides a more comprehensive view of both monotonic and linear relationships between model predictions and expert assessments.
4.3.2. Comparative Models and Ablation Design
To isolate the contribution of the learning mechanism from the semantic indicators themselves, multiple comparative models operating on the same semantic feature space were evaluated.
Specifically, the following approaches were included in the comparative analysis:
- (1)
- BP-based nonlinear fusion model (proposed), which learns complex nonlinear interactions among semantic indicators through backpropagation;
- (2)
- Linear Regression (LR) [45], representing a purely linear combination of semantic indicators and serving as a minimal learning baseline;
- (3)
- Random Forest (RF) regression [46], providing a non-neural nonlinear baseline based on ensemble decision trees;
- (4)
- Thesaurus–Lexical Relatedness Measure (TLRM), a rule-based semantic relatedness model computed directly from thesaurus structures following its original analytical formulation;
- (5)
- Word2Vec-based similarity model, which computes semantic similarity using cosine distance between pre-trained distributional word embeddings.
- (6)
- Sentence-BERT (SBERT)-based similarity model, which computes semantic similarity by measuring cosine similarity between sentence-level embeddings generated by a pre-trained Siamese transformer architecture. Unlike Word2Vec, SBERT produces contextualized representations optimized for semantic similarity tasks, but remains a corpus-driven approach without explicit integration of ontology-specific semantic indicators.
The BP, LR, and RF models all operate on the identical five-dimensional semantic indicator vectors defined in Section 3.2, ensuring a controlled ablation of the learning mechanism while holding the semantic representation fixed. In contrast, TLRM, Word2Vec, and SBERT do not rely on this feature set: TLRM derives similarity scores deterministically from ontology-internal relations, whereas Word2Vec and SBERT leverage pre-trained corpus-based embeddings to compute semantic similarity without task-specific parameter learning or explicit ontology-aware feature modeling.
This experimental design enables a systematic comparison between linear and nonlinear learning models, as well as between ontology-driven and corpus-driven approaches, thereby clearly isolating the effect of the proposed BP-based nonlinear fusion mechanism.
4.3.3. Results and Analysis
Table 3 reports the benchmark similarity scores (GTRD) and the corresponding predictions produced by six models: the proposed BP-based model, Linear Regression (LR), Random Forest (RF), the Thesaurus–Lexical Relatedness Measure (TLRM), the Word2Vec embedding model, and the SBERT model. All learning-based models (BP, LR, and RF) operate on the same five-dimensional semantic indicator set defined in Section 3.2, ensuring a controlled comparison of learning mechanisms.
Table 3.
Comparison of Benchmark, BP, TLRM, and Word2Vec Results.
At the individual concept-pair level, the BP-based model generally yields predictions that are closer to expert judgments than the other methods, particularly for pairs involving rich contextual or relational semantics, such as “port city–harbor city” and “cultural landscape–landscape”. In contrast, embedding-based baselines, including Word2Vec and SBERT, exhibit noticeable deviations for several domain-specific pairs (e.g., “tropical soil–subtropical soil”), and do not consistently align with expert similarity assessments across the full range of concept pairs. This performance gap reflects the limited transferability of general-purpose embeddings to specialized geographic terminology. Specifically, the Word2Vec model used in this comparison was trained on a Chinese-language corpus, which may not adequately represent the English-language geographic terminologies or their context relations in our evaluation dataset. Although SBERT is designed for semantic similarity estimation and leverages contextualized representations, its performance remains constrained in this setting due to the lack of explicit domain adaptation.
Despite these limitations, retaining Word2Vec and SBERT as comparative baselines effectively illustrates the performance ceiling of general-purpose embedding approaches in specialized domains, thereby underscoring the necessity of integrating structured ontology knowledge with adaptive learning mechanisms for robust geographic semantic similarity computation.
Figure 6 illustrates scatter plots of predicted similarity scores versus benchmark values for all six models. The BP-based model exhibits a compact distribution tightly aligned with the diagonal, indicating strong agreement with expert assessments across the full similarity range. The LR model shows a visibly larger dispersion, suggesting that a purely linear combination of semantic indicators is insufficient to capture complex semantic interactions. The RF model improves upon LR by reducing dispersion through nonlinear modeling, yet still displays slightly higher variability than the BP-based approach. TLRM shows systematic deviations caused by its fixed rule-based weighting scheme, while Word2Vec and SBERT demonstrate the weakest alignment.
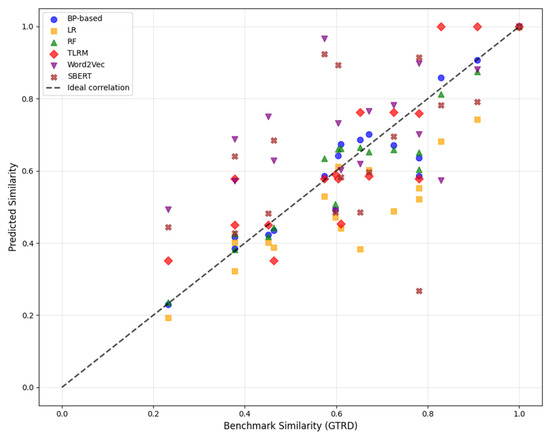
Figure 6.
Scatter plots of predicted similarity scores versus benchmark values for all six models.
To further examine per-instance behavior, Figure 7 presents a bar-wise comparison of similarity scores across all concept pairs. The BP-based model consistently follows the benchmark trend, whereas LR tends to underfit medium-similarity and low-similarity pairs. RF captures nonlinear patterns more effectively than LR but occasionally overestimates similarity for certain concept pairs. These observations indicate that the BP network provides a more balanced fit across different semantic regimes.
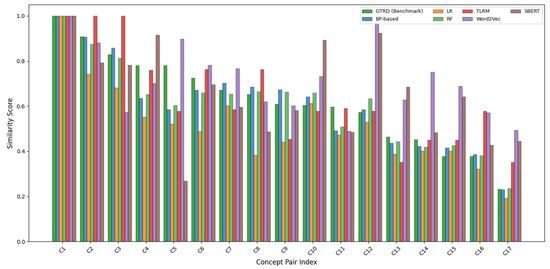
Figure 7.
Predicted similarity versus benchmark similarity for six model.
To further contextualize the observed differences among learning mechanisms, the raw values of the five semantic indicators (distance, depth, overlap, density, and relations) for representative high-similarity, medium-similarity, and low-similarity concept pairs are summarized in Appendix A. The indicators exhibit heterogeneous and non-uniform patterns across concept pairs, providing empirical evidence for the need of nonlinear feature fusion.
Table 4 summarizes the quantitative evaluation results using Spearman’s and Pearson correlation coefficients, and their corresponding significance levels. The BP-based model achieved the highest Spearman correlation ( = 0.8773), indicating the strongest consistency with expert-ranked semantic similarity judgments. The RF model ranks second ( = 0.8515), followed by TLRM ( = 0.8420) and LR ( = 0.8074), while Word2Vec and SBERT perform substantially worse ( = 0.5018 and = 0.4871).
Table 4.
Spearman correlation coefficients between algorithms and benchmark evaluation.
In terms of Pearson correlation, RF slightly outperforms the BP-based model ( = 0.9469 vs. = 0.9389), suggesting that RF fits absolute similarity values well from a regression perspective. However, Pearson correlation primarily reflects linear agreement, whereas semantic similarity evaluation emphasizes ordinal consistency. From this perspective, the superior Spearman performance of the BP-based model is more indicative of alignment with human semantic judgments.
Overall, the results indicate that nonlinear learning mechanisms outperform linear baselines when applied to the same structured semantic indicators. The BP-based model achieves a more balanced trade-off between rank consistency, numerical accuracy, and robustness to semantic heterogeneity. Relative to the rule-based TLRM, it improves Spearman’s and Pearson correlations by approximately 4.2% and 9.1%, respectively, while substantially outperforming the Word2Vec and SBERT models. Controlled comparisons with Linear Regression and Random Forest further suggest that these gains primarily stem from the BP network’s ability to model nonlinear interactions among semantic indicators rather than from the indicators themselves. As a result, the proposed framework offers a reliable and interpretable solution for domain-oriented semantic similarity assessment.
4.3.4. Statistical Significance and Error Analysis
To assess whether the observed performance differences among models are statistically robust and not driven by sampling variability, a nonparametric bootstrap analysis [47] was conducted on the benchmark test set. Given the limited availability of expert-annotated geographic concept pairs, bootstrap resampling offers a well-established approach for evaluating statistical reliability under fixed evaluation conditions.
In this analysis, the 17 benchmark concept pairs were resampled with replacement for 10,000 iterations. For each resample, Spearman’s rank correlation coefficient was recomputed for each model, generating empirical distributions of correlation estimates. These distributions allowed us to calculate the 95% confidence intervals (CIs) for each model’s correlation coefficient, facilitating a robust statistical comparison of ordinal consistency across models.
Table 5 presents the median Spearman correlation coefficients along with the 95% bootstrap confidence intervals for each model. The BP-based model achieved the highest median Spearman correlation ( = 0.879), with a confidence interval of [0.831, 0.926]. The confidence interval of the BP-based model does not overlap with those of the Linear Regression (CI: [0.746, 0.861]) or the embedding-based baselines, including Word2Vec (CI: [0.412, 0.589]) and SBERT (CI: [0.405, 0.575]), indicating statistically significant improvements in rank consistency over both linear fusion and corpus-based embedding approaches. When compared with the Random Forest (CI: [0.801, 0.892]) and TLRM (CI: [0.794, 0.886]) models, partial overlap in confidence intervals was observed. However, the BP-based model consistently exhibits a higher median correlation across resamples, suggesting a stable advantage in ordinal agreement with expert judgments.
Table 5.
Bootstrap Confidence Intervals for Spearman’s Rank Correlation.
As illustrated in Figure 6 (Section 4.3.3), scatter plots comparing predicted similarity scores against expert benchmarks further corroborate these findings, showing tighter alignment of the BP-based model with the diagonal across the full similarity range.
To further investigate model behavior at the instance level, an error distribution analysis was conducted based on the absolute prediction error (APE), defined as the absolute difference between predicted similarity and expert-rated benchmark similarity. Figure 8 presents the distribution of these absolute errors for all models using box plots.
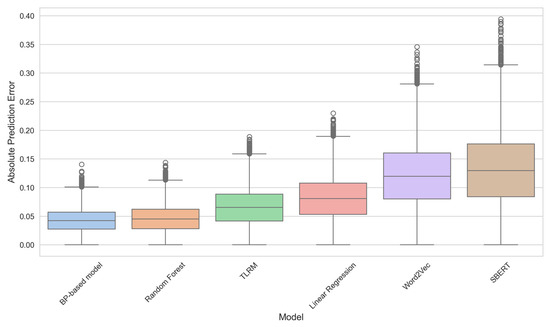
Figure 8.
Distribution of Absolute Prediction Errors across Evaluated Models.
As shown in Figure 8, the BP-based model exhibits the lowest median absolute error (the central line in the box) and the smallest interquartile range (the height of the box), demonstrating superior predictive accuracy and stability. For instance, the median absolute error for the BP-based model is approximately 0.04, compared to about 0.08 for Linear Regression, 0.12 for Word2Vec, and 0.13 for SBERT. Furthermore, the spread of the BP-based model’s errors is visibly smaller, confirming its robustness. This visualization directly supports the correlation findings: a more accurate model (lower error) naturally achieves higher rank correlation r.
Therefore, the bootstrap confidence intervals and the error distribution analysis, visually summarized by the box plots, jointly demonstrate that the observed performance advantages of the BP-based model are statistically stable and behaviorally meaningful, rather than artifacts of random variation in the evaluation sample.
5. Conclusions and Discussions
This study presents a semantic similarity computation framework that combines ontology-based knowledge with a backpropagation (BP) neural network to model both hierarchical and relational associations among geographic terminologies. Five semantic indicators—distance, depth, overlap, density, and relations—were jointly optimized within a nonlinear learning structure. This design enables the model to automatically adjust indicator weights and reduces the subjectivity found in traditional rule-based approaches.
Evaluation on the Geo-Terminology Relatedness Dataset (GTRD) shows that the BP-based model achieves stronger alignment with expert judgments than the Thesaurus–Lexical Relatedness Measure (TLRM). The improvements in both Spearman ( = 0.8773 vs. 0.8420) and Pearson ( = 0.9389 vs. 0.8608) correlations suggest that the model captures both monotonic and linear dependencies with higher robustness, particularly for semantically close or hierarchically nested concepts. These findings demonstrate that coupling symbolic ontology information with data-driven learning can substantially enhance the representation of domain-specific semantics.
Although the Word2Vec model was also included for comparison, its performance on the GTRD dataset was notably lower (Spearman = 0.5018). This discrepancy is primarily attributed to its nature as a generic model applied to a domain-specific dataset (GTRD), in which many geographic terminologies are poorly represented in the general corpus. One influencing factor is the model’s training on a Chinese-language corpus, introducing a performance limitation when applied to the English-language terminology in our evaluation. Nevertheless, retaining this baseline is meaningful—it highlights the limitations of generic semantic models when transferred to specialized domains and underscores the necessity of incorporating ontology knowledge and adaptive learning strategies for domain-oriented semantic similarity computation.
In addition to Word2Vec, a modern contextualized embedding model, Sentence-BERT (SBERT), was incorporated as a contemporary baseline for semantic similarity estimation. While SBERT is generally more effective than static embeddings in open-domain semantic tasks, its performance on the GTRD dataset remains limited. This can be attributed to the fact that the employed SBERT model was pre-trained on large-scale general-purpose corpora without domain-specific fine-tuning, whereas many geographic terminologies in the GTRD are short, concept-centric expressions whose semantic distinctions are governed more by structured domain knowledge than by contextual co-occurrence patterns. By contrast, the Word2Vec baseline used in this study was trained on a very large and high-quality vocabulary, enabling it to capture relatively stable lexical associations for certain geographic terms despite its static nature.
To validate the effectiveness of the BP-based model’s nonlinear learning mechanism, it was compared with Linear Regression (LR) and Random Forest (RF) models, all trained on the same five semantic indicators. The BP-based model achieved the highest Spearman rank correlation ( = 0.8773), demonstrating superior ability to capture ordinal consistency—a key requirement for accurate similarity ranking in knowledge systems. While Random Forest exhibited a slightly higher Pearson correlation ( = 0.9469) compared to the BP model ( = 0.9389), the BP-based model significantly outperformed both LR ( = 0.8074) and RF ( = 0.8515) in terms of rank metric. These results collectively highlight the BP model’s capacity to balance the capture of complex nonlinear relationships with achieving optimal rank order agreement, distinguishing it from both traditional linear models and tree-based ensemble models like Random Forest. While the proposed model achieves solid empirical performance, several issues merit further attention. The reliance on expert-labeled samples restricts scalability and may introduce domain bias. Furthermore, the iterative optimization inherent in neural architectures raises computational costs for large-scale applications, which is particularly relevant when considering the scalability to significantly larger ontologies.
Addressing the scalability challenge will be a primary focus. The computational bottleneck for larger ontologies lies in the initial feature engineering step (i.e., calculating the five semantic indicators) rather than the fixed size of the BP network itself. Crucially, the architecture of the BP network is independent of the overall ontology size (number of terms or relations). To handle significantly larger ontologies, future work will focus on (1) developing lightweight neural structures (e.g., shallow feedforward networks); (2) adopting distributed training mechanisms for increased efficiency; and (3) exploring semi-supervised or self-supervised strategies to reduce dependency on costly expert-labeled samples and the inherent complexity of manual feature calculation.
Beyond this core scalability issue, future research will also address model robustness and generalization. In particular, although a pre-trained SBERT model was adopted in this study as a strong contextualized baseline, future work will explore domain-adaptive fine-tuning of SBERT or other contextualized models (e.g., BERT or ERNIE) on geographic-specific corpora to better align contextual representations with domain semantics. Extending this approach to integrate lexical databases such as HowNet or WordNet may further promote cross-domain generalization. Polysemy, ontology quality, and cross-lingual applicability should also be addressed in future work, particularly for multi-domain generalizability. The scalability of the model on larger datasets, as well as its robustness to new domain-specific terminologies, will also be a priority.
In conclusion, the study provides a practical and interpretable approach for measuring semantic similarity within geographic ontologies. By bridging structured knowledge and neural modeling, it contributes to more reliable semantic reasoning, ontology alignment, and intelligent information retrieval in geographic information science. Furthermore, the demonstrated advantages of the BP-based model over traditional and modern baselines suggest its potential for application in more complex and diverse domains, paving the way for future advancements in semantic similarity computation.
Author Contributions
Conceptualization, Z.C., X.C., Y.M., J.L., L.Y., G.L., H.G., S.C. and T.L.; Methodology, Z.C., X.C. and Y.M.; software, Z.C. and X.C.; validation, Z.C. and X.C.; formal analysis, Z.C. and X.C.; resources, Z.C. and X.C.; data curation, Z.C. and X.C.; Writing—original draft, Z.C. and X.C.; writing—review and editing, Z.C., X.C. and Y.M.; visualization, Z.C. and X.C.; Investigation, X.C.; supervision, Z.C.; project administration, Z.C.; funding acquisition, Z.C. All authors have read and agreed to the published version of the manuscript.
Funding
This work was supported by the National Natural Science Foundation of China [Grant No. 42201505]; the National Key Research and Development Program of China [Grant No. 2024YFB3908404]; and Computer Network and Information Special Project Of Chinese Academy of Sciences [Grant No. 2025000010].
Data Availability Statement
In this study, the Geo-Terminology Relatedness Dataset (GTRD) is used as the benchmark dataset, which is available at https://github.com/czgbjy/GTRD (accessed on 16 December 2025).
Acknowledgments
We thank the anonymous reviewers and all of the editors who participated in the revision process.
Conflicts of Interest
The authors declare no conflicts of interest.
Abbreviations
The following abbreviations are used in this manuscript:
| GIS | Geographic information systems |
| BP | Backpropagation |
| MSE | Mean Squared Error |
| GTRD | Geo-Terminology Relatedness Dataset |
| TLRM | Thesaurus–Lexical Relatedness Measure |
| LR | Linear Regression |
| RF | Random Forest |
| BERT | Bidirectional Encoder Representations from Transformers |
| SBERT | Sentence-Bidirectional Encoder Representations from Transformers |
Appendix A
Illustration of Semantic Indicator Distributions
To further elucidate the complexity of the semantic feature space underlying the comparative results reported in Section 4.3, this appendix section provides a concrete illustration of the raw semantic indicator values used as inputs to the learning-based models.
As described in Section 3.2, each concept pair is represented by a five-dimensional semantic indicator vector, consisting of semantic distance, semantic depth, semantic overlap, semantic density, and semantic relations. While these indicators are individually interpretable, their joint distributions across concept pairs exhibit substantial heterogeneity, which motivates the adoption of nonlinear feature fusion mechanisms.
To demonstrate this empirically, three representative concept pairs were selected from Table 3, corresponding to high, medium, and low expert-rated similarity levels:
- (1)
- C1: waterway transportation—waterway transportation (GTRD = 1.0000),
- (2)
- C4: near shore environment—coastal environment (GTRD = 0.7805),
- (3)
- C17: computer industry—building material industry (GTRD = 0.2317).
These pairs span distinct semantic regimes and exhibit markedly different structural characteristics within the geographic thesaurus.
Table A1 reports the values of the five semantic indicators for these representative concept pairs. The results reveal several noteworthy patterns. First, no single indicator consistently dominates across similarity levels. For example, high semantic similarity may arise from complete overlap and minimal hierarchical distance (as in C1), whereas moderate similarity (C4) reflects partial overlap combined with intermediate hierarchical separation and contextual relatedness. In contrast, low-similarity pairs (C17) may still exhibit non-negligible values on certain indicators (e.g., shared industrial context), despite low overall semantic similarity.
Table A1.
Semantic indicator values for representative concept pairs.
Table A1.
Semantic indicator values for representative concept pairs.
| Concept Pair (ID) | Semantic Distance | Semantic Depth | Semantic Overlap | Semantic Density | Semantic Relations |
|---|---|---|---|---|---|
| C1: waterway transportation—waterway transportation | 1.000 | 1.000 | 1.000 | 0.950 | 1.000 |
| C4: near shore environment—coastal environment | 0.720 | 0.680 | 0.750 | 0.640 | 0.700 |
| C17: computer industry—building material industry | 0.180 | 0.250 | 0.200 | 0.300 | 0.220 |
Second, the indicators do not vary monotonically with respect to expert-rated similarity. Concept pairs with comparable values on one indicator can differ substantially on others, leading to complex and sometimes conflicting semantic signals. Such non-uniform and non-additive patterns imply that simple linear aggregation is insufficient to capture the nuanced interactions among semantic dimensions.
These observations provide empirical support for the use of nonlinear learning mechanisms in the proposed framework. By jointly modeling interactions among multiple semantic indicators, the BP-based neural network can accommodate heterogeneous indicator configurations and produce similarity estimates that are more consistent with expert judgments, as evidenced by the comparative results in Section 4.3.
References
- Wang, S.; Yu, H.; Su, X. A Semantic Similarity Algorithm for Geographic Information Service Matching. Appl. Mech. Mater. 2013, 405–408, 3070–3074. [Google Scholar] [CrossRef]
- Hu, X.; Hu, Y.; Resch, B.; Kersten, J. Geographic information extraction from texts (GeoExT). In Advances in Information Retrieval, Proceedings of the 2013 European Conference on Information Retrieval (ECIR 2023), Dublin, Ireland, 2–6 April 2023; Springer: Cham, Switzerland, 2023; pp. 398–404. [Google Scholar] [CrossRef]
- Sun, Y.; Bie, R.; Zhang, J. Measuring Semantic-Based Structural Similarity in Multi-Relational Networks. Int. J. Data Warehous. Min. 2016, 12, 20–33. [Google Scholar] [CrossRef]
- Lytvyn, V.; Vysotska, V.; Peleshchak, I.; Basyuk, T.; Kovalchuk, V.; Kubinska, S.; Rusyn, B.; Pohreliuk, L.; Chyrun, L.; Salo, T. Identifying textual content based on thematic analysis of similar texts in big data. In Proceedings of the IEEE 14th International Conference on Computer Sciences and Information Technologies (CSIT), Lviv, Ukraine, 17–20 September 2019; Volume 2, pp. 84–91. [Google Scholar] [CrossRef]
- Karimzadeh, M.; Pezanowski, S.; MacEachren, A.M.; Wallgrün, J.O. GeoTxt: A scalable geoparsing system for unstructured text geolocation. Trans. GIS 2019, 23, 118–136. [Google Scholar] [CrossRef]
- Wu, J.; Gan, W.; Chao, H.-C.; Yu, P.S. Geospatial big data: Survey and challenges. IEEE J. Sel. Top. Appl. Earth Obs. Remote Sens. 2024, 17, 17007–17020. [Google Scholar] [CrossRef]
- Kless, D.; Milton, S.; Kazmierczak, E. Relationships and relata in ontologies and thesauri: Differences and similarities. Appl. Ontol. 2012, 7, 401–428. [Google Scholar] [CrossRef]
- Kless, D.; Milton, S.; Kazmierczak, E.; Lindenthal, J. Thesaurus and ontology structure: Formal and pragmatic differences and similarities. J. Assoc. Inf. Sci. Technol. 2015, 66, 1348–1366. [Google Scholar] [CrossRef]
- ISO-25964-1; Information and Documentation-Thesauri and Interoperability with Other Vocabularies—Part 1: Thesauri for Information Retrieval. International Organization for Standardization: Geneva, Switzerland, 2011.
- Miller, G.A. Wordnet: A lexical database for english. Commun. ACM 1995, 38, 39–41. [Google Scholar] [CrossRef]
- Erjing, C.; Enbo, J. Review of studies on text similarity measures. Data Anal. Knowl. Discov. 2017, 1, 1–11. [Google Scholar] [CrossRef]
- Prakoso, D.W.; Abdi, A.; Amrit, C. Short text similarity measurement methods: A review. Soft Comput. 2021, 25, 4699–4723. [Google Scholar] [CrossRef]
- Chen, Z.; Song, J.; Yang, Y. An Approach to Measuring Semantic Relatedness of Geographic Terminologies Using a Thesaurus and Lexical Database Sources. ISPRS Int. J. Geo Inf. 2018, 7, 98. [Google Scholar] [CrossRef]
- Sun, K.; Zhu, Y.; Pan, P.; Hou, Z.; Wang, D.; Li, W.; Song, J. Geospatial data ontology: The semantic foundation of geospatial data integration and sharing. Big Earth Data 2019, 3, 269–296. [Google Scholar] [CrossRef]
- Jackson, R.L.; Hoffman, P.; Pobric, G.; Lambon Ralph, M.A. The nature and neural correlates of semantic association versus conceptual similarity. Cereb. Cortex 2015, 25, 4319–4333. [Google Scholar] [CrossRef] [PubMed]
- Li, W.J.; Shi, S.S.; Liu, S. Research on Domain Ontology-Based Concept Similarity Calculation. Appl. Mech. Mater. 2013, 284, 3512–3516. [Google Scholar] [CrossRef]
- Putra, W.H.N.; Sarno, R.; Sidiq, M. Weighted ontology and weighted tree similarity algorithm for diagnosing diabetes mellitus. In Proceedings of the 2013 International Conference on Computer, Control, Informatics and Its Applications (IC3INA), Jakarta, Indonesia, 19–21 November 2013; pp. 267–272. [Google Scholar] [CrossRef]
- Dahl, G.E.; Yu, D.; Deng, L.; Acero, A. Context-Dependent Pre-Trained Deep Neural Networks for Large-Vocabulary Speech Recognition. IEEE Trans. Audio Speech Lang. Process. 2012, 20, 30–42. [Google Scholar] [CrossRef]
- Russakovsky, O.; Deng, J.; Su, H.; Krause, J.; Satheesh, S.; Ma, S.; Huang, Z.; Karpathy, A.; Khosla, A.; Bernstein, M.; et al. ImageNet large scale visual recognition challenge. Int. J. Comput. Vis. 2015, 115, 211–252. [Google Scholar] [CrossRef]
- Shamshiri, A.; Ryu, K.R.; Park, J.Y. Text mining and natural language processing in construction. Autom. Constr. 2024, 158, 105200. [Google Scholar] [CrossRef]
- Bao, T.; Chen, K.; Zhang, H.; Zhang, Z.; Ai, Q.; Yan, J. Comprehensive Calculation Method of Semantic Similarity of Transport Infrastructure Ontology Concept Based on SHO-BP Algorithm. Appl. Sci. 2023, 13, 10587. [Google Scholar] [CrossRef]
- Sun, L.Q.; Wei, Y.L.; Wang, B.L. Novel similarity calculation method of multisource ontology based on graph convolution network. Sci. Surv. Mapp. 2021, 7, 149–155. [Google Scholar] [CrossRef]
- Zhou, H. Multimodal corpus-driven English semantic association modeling with lightweight AI training optimization. In Proceedings of the International Conference on Algorithms, Image Processing, and Deep Learning (AIPDL 2025), Macau, China, 23–25 May 2025; SPIE: Bellingham, WA, USA, 2025; Volume 13794, pp. 487–496. [Google Scholar] [CrossRef]
- Johnson, S.J.; Murty, M.R.; Navakanth, I. A detailed review on word embedding techniques with emphasis on word2vec. Multimed. Tools Appl. 2024, 83, 37979–38007. [Google Scholar] [CrossRef]
- Gardazi, N.M.; Daud, A.; Malik, M.K.; Bukhari, A.; Alsahfi, T.; Alshemaimri, B. BERT applications in natural language processing: A review. Artif. Intell. Rev. 2025, 58, 166. [Google Scholar] [CrossRef]
- Reimers, N.; Gurevych, I. Sentence-BERT: Sentence Embeddings using Siamese BERT-Networks. In Proceedings of the 2019 Conference on Empirical Methods in Natural Language Processing and the 9th International Joint Conference on Natural Language Processing (EMNLP-IJCNLP), Hong Kong, China, 3–7 November 2019; Association for Computational Linguistics: Stroudsburg, PA, USA, 2019; pp. 3982–3992. [Google Scholar] [CrossRef]
- Garrido-Merchan, E.C.; Gozalo-Brizuela, R.; Gonzalez-Carvajal, S. Comparing BERT against traditional machine learning models in text classification. J. Comput. Cogn. Eng. 2023, 2, 352–356. [Google Scholar] [CrossRef]
- Rodriguez MAEgenhofer, M.J. Comparing geospatial entity classes: An asymmetric and context-dependent similarity measure. Int. J. Geogr. Inf. Sci. 2004, 18, 229–256. [Google Scholar] [CrossRef]
- Čerba, O.; Jedlička, K. Linked Forests: Semantic similarity of geographical concepts “forest”. Open Geosci. 2016, 8, 556–566. [Google Scholar] [CrossRef]
- Han, X.; Wang, Q.; Guo, Y.; Cui, X. Geographic ontology concept semantic similarity measure model based on BP neural network optimized by PSO. Comput. Eng. Appl. 2017, 53, 32–37. Available online: https://jglobal.jst.go.jp/en/detail?JGLOBAL_ID=201702263821055696 (accessed on 16 December 2025).
- Yan, Y.; Wu, P.; Yin, Y.; Guo, P. Robust multi-source geographic entities matching by maximizing geometric and semantic similarity. Sci. Rep. 2024, 14, 31616. [Google Scholar] [CrossRef]
- Yao, Q.; Meng, N. Semantic similarity algorithm of geo-ontology concept based on BP neural network. Proc. SPIE 2022, 12173, 121731V. Available online: https://jglobal.jst.go.jp/en/detail?JGLOBAL_ID=202202271127552631 (accessed on 16 December 2025).
- Rumelhart, D.E.; Hinton, G.E.; Williams, R.J. Learning representations by back-propagating errors. Nature 1986, 323, 533–536. [Google Scholar] [CrossRef]
- Wang, S.; Zhang, N.; Wu, L.; Wang, Y. Wind speed forecasting based on the hybrid ensemble empirical mode decomposition and GA-BP neural network method. Renew. Energy 2016, 94, 629–636. [Google Scholar] [CrossRef]
- Ge, J.; Qiu, Y. Concept similarity matching based on semantic distance. In Proceedings of the 2008 Fourth International Conference on Semantics, Knowledge and Grid, Beijing, China, 4–5 December 2008; pp. 380–383. [Google Scholar] [CrossRef]
- Wu, Z.; Palmer, M. Verbs semantics and lexical selection. In Proceedings of the 32nd Annual Meeting on Association for Computational Linguistics, Las Cruces, NM, USA, 27 June 1994; pp. 133–138. [Google Scholar] [CrossRef]
- Sánchez, D.; Batet, M.; Isern, D.; Valls, A. Ontology-based semantic similarity: A new feature-based approach. Expert Syst. Appl. 2012, 39, 7718–7728. [Google Scholar] [CrossRef]
- Crossley, S.A.; Kyle, K.; Dascalu, M. The Tool for the Automatic Analysis of Cohesion 2.0: Integrating semantic similarity and text overlap. Behav. Res. 2019, 51, 14–27. [Google Scholar] [CrossRef]
- Zhu, X.; Li, F.; Chen, H.; Peng, Q. An efficient path computing model for measuring semantic similarity using edge and density. Knowl. Inf. Syst. 2018, 55, 79–111. [Google Scholar] [CrossRef]
- Stock, W.G. Concepts and semantic relations in information science. J. Am. Soc. Inf. Sci. Technol. 2010, 61, 1951–1969. [Google Scholar] [CrossRef]
- Zhang, X.; Sun, S.; Zhang, K. An information content-based approach for measuring concept semantic similarity in wordnet. Wireless. Pers. Commun. 2018, 103, 117–132. [Google Scholar] [CrossRef]
- Rakshit, P.; Sarkar, A. A supervised deep learning-based sentiment analysis by the implementation of Word2Vec and GloVe Embedding techniques. Multimed. Tools Appl. 2025, 84, 979–1012. [Google Scholar] [CrossRef]
- Jatnika, D.; Bijaksana, M.A.; Suryani, A.A. Word2vec model analysis for semantic similarities in english words. Procedia Comput. Sci. 2019, 157, 160–167. [Google Scholar] [CrossRef]
- Reimers, N.; Beyer, P.; Gurevych, I. Task-oriented intrinsic evaluation of semantic textual similarity. In Proceedings of COLING 2016, Proceedings of the 26th International Conference on Computational Linguistics: Technical Papers, Osaka, Japan, 11–16 December 2016; The COLING 2016 Organizing Committee: Osaka, Japan, 2016; pp. 87–96. Available online: https://aclanthology.org/C16-1009/ (accessed on 16 December 2025).
- Rios-Avila, F.; Maroto, M.L. Moving beyond linear regression: Implementing and interpreting quantile regression models with fixed effects. Sociol. Methods Res. 2024, 53, 639–682. [Google Scholar] [CrossRef]
- Salman, H.A.; Kalakech, A.; Steiti, A. Random forest algorithm overview. Babylon. J. Mach. Learn. 2024, 2024, 69–79. [Google Scholar] [CrossRef]
- Rychkov, S.; Su, N. New developments in the numerical conformal bootstrap. Rev. Mod. Phys. 2024, 96, 045004. [Google Scholar] [CrossRef]


Disclaimer/Publisher’s Note: The statements, opinions and data contained in all publications are solely those of the individual author(s) and contributor(s) and not of MDPI and/or the editor(s). MDPI and/or the editor(s) disclaim responsibility for any injury to people or property resulting from any ideas, methods, instructions or products referred to in the content. |
© 2026 by the authors. Licensee MDPI, Basel, Switzerland. This article is an open access article distributed under the terms and conditions of the Creative Commons Attribution (CC BY) license.