Abstract
This study investigates the creepage discharge method applied to a cold cathode to enhance discharge performance. Creepage discharge refers to the movement of electrical discharges along an insulating surface, increasing electron emission from dielectric materials. The research examines discharge behavior by varying the position of a ceramic pipe on the cathode and proposes a new average current calculation method. Findings indicate that when the ceramic pipe tip extends beyond the cathode, discharge intensity increases. The ceramic-covered cathode (CCC) configuration achieved an average discharge current exceeding 600 mA, compared to about 500 mA for the conventional rod-wire cathode (CRC). The CCC design also enabled arc plasma generation at voltages below 5 kV, whereas the CRC required 4–7 kV to achieve similar effects. For industrial applications, the CCC setup produced approximately 700 mA, whereas the CRC reached approximately 600 mA. These results demonstrate that the CCC configuration offers superior discharge current generation and plasma-column discharge.
1. Introduction
Creeping discharge is a critical phenomenon in high-voltage insulation systems, in which discharges propagate along the surface of a dielectric material (such as a ceramic pipe), often preceding dielectric failure. This type of discharge is commonly observed in gas-insulated switchgears, high-voltage bushings, and composite insulators. When a dielectric covers a cathode, the complexity of charge distribution, surface field enhancement, and ionization phenomena increases, making the behavior of creeping discharges difficult to predict and control.
Spark discharge is a complex and dynamic energy-release process influenced by various external factors [1]. These factors can be broadly categorized into two groups: circuit parameters and non-circuit parameters. Circuit parameters include capacitance, charging voltage, load inductance, and load resistance. In contrast, non-circuit parameters comprise environmental conditions and electrode characteristics. Environmental variables include air pressure, temperature, humidity, and airflow velocity, while electrode parameters include gap length, diameter, shape, and material [2,3,4,5,6].
Spark discharge is completed when the electron flow reaches the anode. According to classical interpretations, the discharge evolution comprises an intermediate stage characterised by an electron cascade along the surface, followed by a final stage that develops within the desorbed surface gas and/or along the surface of the ceramic pipe [7,8].
The Spark discharge mechanism becomes considerably more complex in configurations involving three distinct materials, commonly referred to as a triple junction. In such systems, the initial electron cascade critically influences the subsequent development of secondary-electron-emission avalanches. Energetic electron bombardment of the surface results in the desorption of adsorbed gas molecules, which are subsequently ionized through electron–gas interactions. A fraction of the generated positive ions migrates toward the cathode, thereby enhancing the local electric field intensity in the vicinity of the triple junction [9].
The strengthened electric field further promotes electron emission from the triple junction and intensifies the surface current along the insulator. Within this framework, the desorption of adsorbed nitrogen is regarded as the dominant mechanism initiating surface flashover on ceramic pipes.
Analogous phenomena are observed in creeping discharges at pressboard–oil interfaces, which originate from partial discharges at the weakest regions of insulating systems in oil-filled high-voltage apparatus, including power transformers, bushings, and capacitors [10]. These vulnerable regions are typically located at triple junctions where dissimilar insulating materials converge [10,11,12]. When a dielectric material is positioned between an anode and a cathode, a creeping discharge may propagate along its surface, reducing the dielectric withstand voltage.
Recent studies indicate that the triple junction is a critical region for the initiation of surface and vacuum discharges. Experimental evidence confirms that both the triple-junction geometry and the dielectric material significantly influence the maximum discharge current [13]. Integrated modelling studies further demonstrate that vacuum flashover development is typically initiated at the cathode triple junction, where the local electric field is strongly intensified [14].
Statistical analyses of vacuum feedthroughs incorporating modified triple-junction geometries have shown that even minor geometric variations can either suppress or promote flashover events [15]. These observations are consistent with approaches used to estimate the minimum breakdown voltage of surface flashovers initiated specifically at the triple junction [14,16]. In addition, alternative continuum and kinetic simulation methods have been developed to accurately model the early stages of surface flashover occurring at the triple junction [17]. Furthermore, investigations of solid–gas triple junctions in epoxy resin systems have demonstrated their role in driving transitions in surface discharge modes under compressed gas conditions [18].
Overall, the literature consistently identifies the triple junction as the most significant site of electric field enhancement in high-voltage applications. Moreover, studies indicate that triple-junction discharges can be deliberately controlled by modifying the metal–insulator boundary, thereby enabling adjustment of discharge inception voltage and current characteristics. This capability also facilitates the development of miniaturised, low-power discharge devices, as the triple junction provides substantial local electric field enhancement without requiring large inter-electrode voltages.
Published research therefore underscores the industrial relevance of triple-junction physics in the design of electrical insulation systems, high-voltage connectors, compact plasma switches, and ignition devices. In addition, triple-junction phenomena enable applications in vacuum electronics, particularly where thermionic heating is undesirable. Collectively, these findings justify continued investigation of triple-junction-assisted discharges to improve discharge efficiency and enhance controllability in plasma-based systems.
Despite the substantial body of research on surface discharges, a comprehensive understanding of the influence of dielectric coverings on cathode-initiated creeping discharges remains incomplete. In high-voltage equipment, triple junctions and associated creepage discharges pose significant challenges, compromising dielectric integrity and potentially leading to insulation failure and fire hazards.
Informed by this literature, the present study advances the following hypothesis: given the inherent electrical weakness at the triple junction, the implementation of an engineered dielectric layer that thoroughly covers the cathode, thereby forming a controlled triple-junction cathode (CCC)-will result in a higher spark probability and increased discharge current compared with an otherwise identical conventional cold cathode (CRC) under equivalent high-voltage charging conditions.
At present, conventional cold cathodes typically feature exposed metal tips that protrude from the surrounding insulating material. In contrast, this study proposes a novel cathode structure that deliberately exploits triple-junction effects and creeping discharge phenomena by fully encapsulating the cathode within a dielectric medium, thereby enabling a systematic investigation of discharge characteristics under these conditions.
Specifically, a ceramic pipe is integrated into a conventional cathode configuration. The proposed cathode comprises a one mm-diameter metal wire inserted into a ceramic pipe with an inner diameter of 1.01 mm, such that the ceramic completely encloses the metal electrode. This configuration is referred to as a ceramic-covered cathode (CCC) and is experimentally compared with a conventional rod–wire cathode (CRC) lacking dielectric coverage. The CCC configuration promotes creepage discharges driven by a high-voltage power supply, thereby enhancing plasma properties, including discharge luminosity and current magnitude.
The study further investigates the electrical characteristics of the discharge by analysing voltage waveforms and discharge currents between the electrodes in a closed vacuum chamber. Experiments are conducted in a stabilised nitrogen atmosphere to ensure controlled and repeatable conditions.
In addition, a novel method is introduced to estimate the average discharge current by calculating the transferred charge from oscilloscope-recorded discharge-voltage waveforms. This approach enables quantitative evaluation of the average discharge current between the electrodes.
Overall, this work aims to provide a comprehensive understanding of the role of creeping discharges in enhancing spark discharge current and to demonstrate their potential applicability in advanced cold-cathode discharge systems.
2. Experimental Setup and Methods
Figure 1 illustrates the experimental circuit employed in this study. The experimental system consists of two main components: an electric spark generation system and a measurement system. The spark generation system comprises a high-voltage power supply, including a variable autotransformer (SD) and a step-up transformer (Tr), an energy storage capacitor , and resistors , , and . The nominal values of the capacitor and resistors are 1328 pF and 1.02 MΩ, respectively, as measured using a Hioki 3531 Z HiTESTER (Nagano city, Japan). The resistors used are TKK ERBOBFH 1 MΩ K 501 types (Tokai Konetsu Kogyo Co., Ltd., Tokyo, Japan).
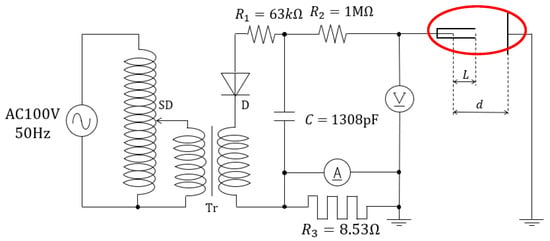
Figure 1.
The experimental circuit of the system. The red circle highlights the gap between the electrodes and the ceramic pipe.
The circuit additionally includes a diode , a flat-cut stainless-steel rod–wire cathode, a copper anode, and a ceramic pipe, as shown in Figure 1. The variable autotransformer (SD) is employed to apply a controllable input voltage, thereby enabling determination of the dielectric withstanding voltage. The system is powered by a 100 V AC main supply, which is stepped up to approximately 15 kV by the transformer and subsequently rectified to DC by the rectifier.
Resistor serves to charge the capacitor, protects against excessive current, and functions as a shunt resistor for discharge current measurement. A high voltage of up to 15 kV is applied to the cathode, while the vacuum chamber serves as the main body of the experimental setup.
The measurement system consists of a digital oscilloscope, an EP-50K high-voltage probe (Manufactured by Nissin Pulse Electronics Co., Ltd., Noda city, Japan) (model number L7682190; maximum measuring voltage: 50 kV DC, 50 kV peak-to-peak AC, and 18 kV RMS AC; voltage division ratio: 2000:1 ± 3%; frequency bandwidth: DC to 50 MHz), a current probe (Made by HIOKI E.E. CORPORATION, Nagano city, Japan), and a camera (Canon EOS 650 from Canon Inc. Ōta, Tokyo, Japan) for recording the optical emission (plasma) generated by the spark discharges between the electrodes.
In addition, two electric motors, each coupled to an actuator, are employed to adjust the inter-electrode gap and the ceramic pipe length without disturbing the chamber environment. Motor operation is controlled via an Arduino Uno R3 (made by Arduino S.r.l., Torino, Italy) interfaced with MATLAB R2022b.
All experiments are conducted at room temperature and pressure (r.t.p), namely 23.3 °C and 1017.5 hPa. Initially, a 12.4 L chamber is evacuated using a vacuum pump. Pure nitrogen gas is then introduced to restore r.t.p. conditions. Subsequently, spark discharge experiments are performed at fixed spark-gap lengths to investigate the withstanding voltage, average discharge current, and discharge plasma characteristics for both the ceramic-covered cathode (CCC) and the conventional rod-wire cathode (CRC).
For each discharge event, spark-voltage waveforms are recorded using an oscilloscope. The capacitor is charged by a 0–15 kV high-voltage power supply through a resistor and discharged through a resistor , as shown in Figure 1. The applied voltage is gradually increased from 0 to 15 kV until the dielectric withstanding voltage is exceeded, at which point the capacitor discharges across the gap, producing sparks or an arc. The recorded voltage waveforms are subsequently used to evaluate the average spark discharge current.
Figure 2 illustrates the discharge region, corresponding to the area highlighted by the red circle in Figure 1. The inter-electrode gap is fixed at mm. At the same time, the ceramic pipe position is varied to modify the length , thereby facilitating the creeping discharge process. The length is defined as the distance from the ceramic pipe tip to the rod-wire cathode tip, as depicted in Figure 2. Two configurations are investigated: mm and mm. A value of mm indicates that the cathode is fully enclosed by the ceramic pipe, forming the CCC. In contrasts, mm corresponds to an uncovered cathode, constituting the CRC (see Figure 2). The ceramic pipe is displaced forward and backwards in 4 mm increments to alternate between the CCC and CRC configurations. Figure 2b highlights the triple-junction region, which plays a critical role in surface flashover of solid insulation in gaseous environments.
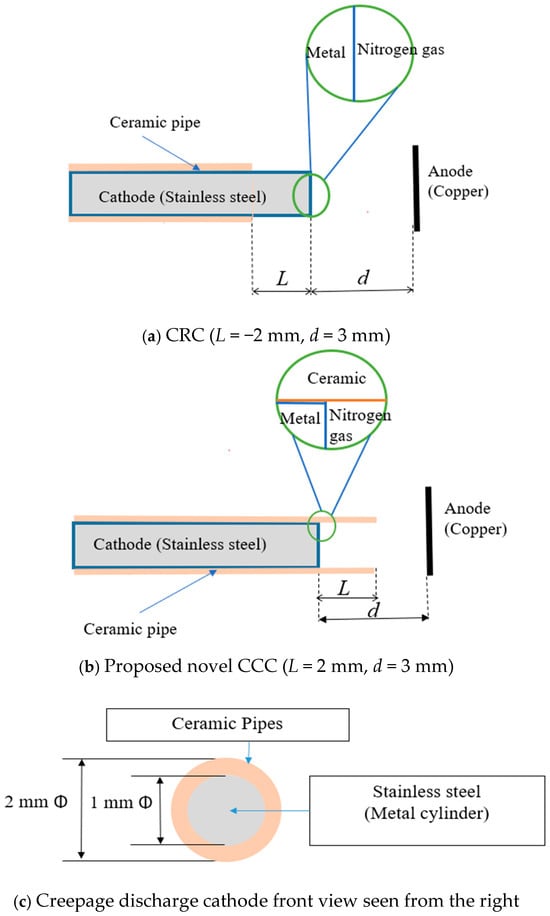
Figure 2.
Cathode electrode cases show the ceramic pipe positions on the cathode electrode, forming a CRC and a CCC. (a) CRC is the conventional cold cathode, primarily found in spark-assisted combustion engines. (b) CCC is the proposed structure. (c) Front view of the cathode, seen when viewed from the anode side.
In this study, an ivory alumina ceramic pipe fabricated from 99.9% pure Al2O3 is employed. The ceramic pipe provides a clearance of 0.05 mm between the rod-wire electrode and the inner surface of the ceramic, with a wall thickness of 0.5 mm. The curvature is defined as
where denotes the curvature, and represents the radius of the rod-wire. Accordingly, the curvature is calculated to be 2 mm−1 for both the rod-wire and the inner surface of the ceramic pipe.
A high-voltage probe is used to measure the time-resolved discharge voltage. These voltage measurements are subsequently utilized to evaluate the average spark discharge current associated with the capacitor discharge, thereby enabling quantitative assessment of the effects of creeping discharge.
Evaluation Methods for Averaged Discharge Current
The discharge process is monitored through voltage waveforms recorded by a digital oscilloscope. Figure 3 presents a representative discharge voltage waveform. To date, four methods have been proposed for estimating discharge current from voltage waveforms. These methods can be classified into three categories: (1) application of Ohm’s law for purely resistive loads, (2) analysis based on known circuit impedance, and (3) treatment of reactive or complex loads involving inductive, capacitive, or nonlinear elements.
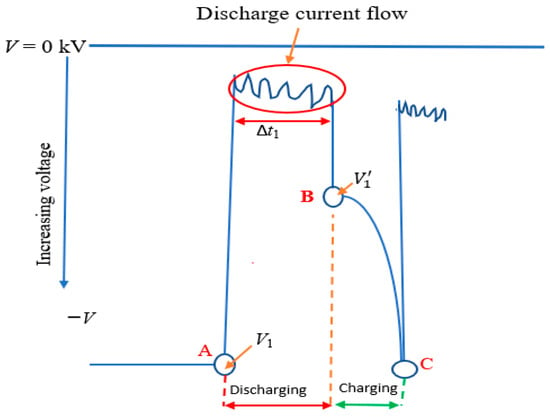
Figure 3.
A typical spark discharge voltage waveform. It is assumed there are no voltage drops after the capacitor to the electrodes; therefore, the capacitor discharge is used to determine the average current flowing between the electrodes during the discharging phase (within the circle); hence, the A-to-B path is considered to find voltage differences after a discharge cycle and is used to determine the charge for the averaged current evaluation.
Because the electrode-plasma gap exhibits predominantly capacitive behavior, the third category is adopted in this study. At present, two approaches have been developed to evaluate the discharge current for capacitive systems: (1) a charging-based method involving direct measurement of , and (2) direct current measurement using a shunt resistor or current probe. When current probe signals are contaminated by noise, the former approach is preferred. Accordingly, the discharge current is evaluated using The discharge process is monitored through voltage waveforms recorded by a digital oscilloscope. Figure 3 presents a representative discharge voltage waveform. To date, four approaches have been developed to estimate discharge current from voltage waveforms; these approaches can be classified into three categories: (1) application of Ohm’s law for purely resistive loads, (2) analysis based on a known circuit impedance, and (3) treatment of reactive or complex loads involving inductive, capacitive, or nonlinear elements.
Because the electrode–plasma gap exhibits predominantly capacitive behavior, the third category is adopted in this study. At present, two techniques are commonly used to evaluate the discharge current for capacitive systems: (1) a charging-based method that requires direct measurement of , and (2) direct current measurement using a shunt resistor or current probe. When current probe signals are significantly affected by noise, the discharge current may be estimated using
where is the instantaneous current, denotes time, is the capacitance, and dV(t)/dt represents the time derivative of the voltage.
However, due to noise present in both the current waveform and the voltage derivative, direct measurement of is often unreliable, making it difficult to accurately quantify the average spark discharge current using Equation (1). To address this limitation, a new voltage-based method for estimating discharge current is proposed in this study. This method relies solely on the measured voltage waveform and does not require waveform-pass filtering, which is typically employed for noise suppression.
In the proposed approach, the voltage waveform is divided into two distinct phases: capacitor discharge (A–B) and capacitor charging (B–C), as illustrated in Figure 3. The analysis is restricted to the A–B discharge phase. Accordingly, the voltage at node A is defined as the initial voltage at the onset of discharge, while the residual voltage corresponds to the remaining voltage at point B following completion of the first discharge front.
The charges available for sparks’ generation are estimated to be Qn, which is the product of the capacitance and ΔVn, the difference between Vn and , where n is the experiment trial number means: ΔVn = Vn − . The first wave front is used because it is crucial for the discharge current, as it marks the required withstanding voltage. Hence, this experiment has only used the first wave front for the average current evaluation.
- Spark current are given by the formula below:I1 = Q1/Δt1
- The current I for the first wave front of the 1st trial. But Q = C·ΔV; therefore, charge Q for the first discharged is computed as
I = C (ΔV/Δt)
- The total average spark discharge current isITot = (I1 + I2 +…+ I5)/5
- is the withstanding discharge voltage and is the residual voltage after the first discharge cycle. In addition, Δtn is the spark duration time. In is the spark current, Vn is the spark voltage for the nth trial, and C is the capacitance. In addition, ∆tn = t2n − t1n, where t1 is the time at node A before discharge, and t2 is taken at node B, for the first wavefront.
From a statistical perspective, increasing the number of experimental replications improves the accuracy of variability estimates and enhances the reliability of inferential conclusions. In this study, the number of repetitions was set to maintain consistent ceramic surface conditioning and to allow operation of the high-voltage power supply in continuous mode without inducing thermal drift within its limited operating window. Under these practical constraints, it represents a reasonable compromise between experimental stability and measurement reproducibility.
Given n independent measurements x1 … xn, then the mean value is computed as:
Then the standard deviation is
The standard error of the mean is
Since it is two-sided, then; 100 (1 − α)% will give the confidence intervals for the mean t-distribution:
where is the t-critical value with being the degree of freedom.
Uncertainty is reported using the sample standard deviation (SD) to characterise the dispersion of the observations, together with the two-sided 95% confidence interval (CI) of the mean, computed using Student’s distribution . Because and plasma inception metrics may deviate from normality, the robustness of the confidence intervals was additionally assessed using a nonparametric bootstrap procedure with 5000 resamples, which yielded qualitatively similar interval estimates. Statistical comparisons were conducted at a significance level of , performed in Python. Finally, conclusions were drawn based on the 95% confidence intervals of the mean withstanding voltage and the corresponding -values obtained from Welch’s -test.
3. Results
The characteristics of spark discharge were analyzed for both the ceramic-covered cathode (CCC) and conventional rod-wire cathode (CRC) configurations as a function of applied discharge voltage. The results indicate that the spark discharge current is higher when the cathode is fully enclosed by the ceramic pipe (CCC) compared with the uncovered CRC configuration.
When the voltage across the electrode gap exceeds the dielectric withstanding voltage, a high-conductivity plasma channel is formed. The discharge voltage waveforms for both CCC ( mm) and CRC ( mm) are similar and exhibit features characteristic of arc discharge. Five independent trials under identical conditions were conducted to determine the average discharge current.
Figure 4 presents representative discharge waveforms for the CRC configuration, plotted from oscilloscope data. Although only the first three trials are shown for clarity, all five trials were used in the calculation of the average spark discharge current. The analysis focuses on the portion of the waveform highlighted by the green square, specifically the red circle in Figure 4a, which corresponds to a small sub-waveform occurring at the peak of the primary discharge waveform. This sub-waveform is used to compute the average discharge current and is referred to as the “discharge current flow.” The durations of the discharge current between the electrodes, together with the corresponding data, were used to evaluate the average spark discharge current in this study.
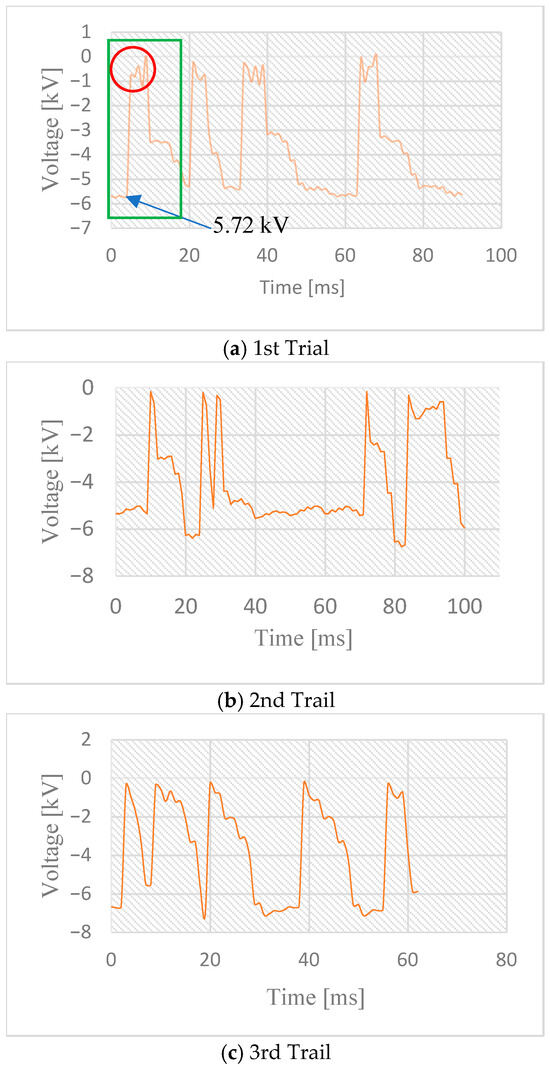
Figure 4.
Voltage waveforms for the CRC. (a) first trial, (b) second trial and (c) the third trial. Dielectric breakdown ranges of 4.76–6.68 kV. The negative sign on the vertical axis emphasizes the polarity of the applied voltage.
3.1. Withstanding Voltage
The dielectric withstanding voltage for spark initiation was determined from the first voltage wavefront observed for each discharge configuration. By analyzing the successive voltage values corresponding to the voltage drop at the crest of the initial wavefront, it is evident that the discharge durations occur over a range of voltages. In the first case, the discharge current oscillates between 0.04 kV and 1.24 kV (highlighted by the red circle) for 5 ms, yielding an average current of 586 mA, as calculated using Equations (3) and (4).
The “discharge current flow” was observed to oscillate between 0.36 kV and 1.0 kV for 2 ms, as illustrated in Figure 4b, and between 0.16 kV and 0.68 kV for 1 ms, as shown in Figure 4c. The voltage at node A (Figure 3) is critical for determining the minimum voltage required to overcome the gap’s dielectric withstanding voltage. For the CRC configuration, the withstand voltage ranged from 4.76 kV to 6.68 kV, and the corresponding discharge current durations ranged from 1 ms to 5 ms.
On the other hand, Figure 5 shows the first three CCC discharge waveforms. The CCC exhibits waveforms that are almost identical to those of the CRC. However, the duration of the discharge current flows is significantly shorter, ranging from 0.4 ms to 1 ms. The CCC has a higher average current, which reduces the discharge duration; as the capacitor charges are quickly depleted, the arc current cannot be sustained.
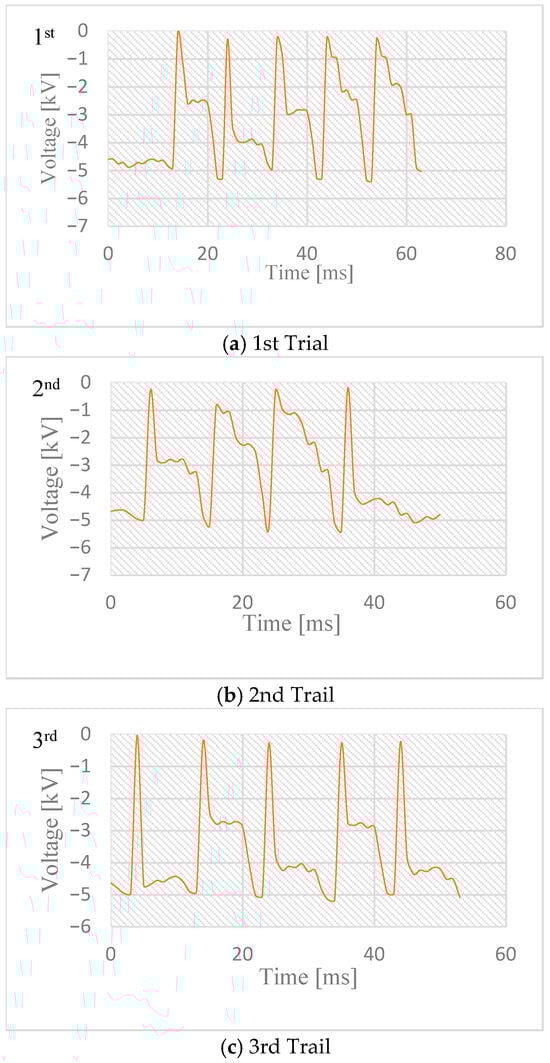
Figure 5.
Voltage waveforms for the CCC. (a) first trial, (b) second trial and (c) third trial. The dielectric breakdown occurs between 4.92 kV and 4.96 kV.
The discharge current flow for the CCC oscillates between 0.12 kV and 0.14 kV for 0.6 ms during the first trial, delivering an average current of 686 mA. Additionally, it oscillates between 0.28 kV and 0.32 kV for 0.6 ms during the second trial, and between 0.24 kV and 0.26 kV for 0.4 ms during the third trial.
3.2. Discharge Plasma
The plasma discharge was photographed using a high-speed camera, and the images were subsequently enhanced in Adobe Premiere. Due to the non-uniformity of the electric field, regions of highest field intensity experience localised discharge formation. In all CRC experiments, the plasma initially manifests as a corona discharge at the electrode tip. As the applied voltage increases, this corona evolves into a single arc column (Figure 6a).
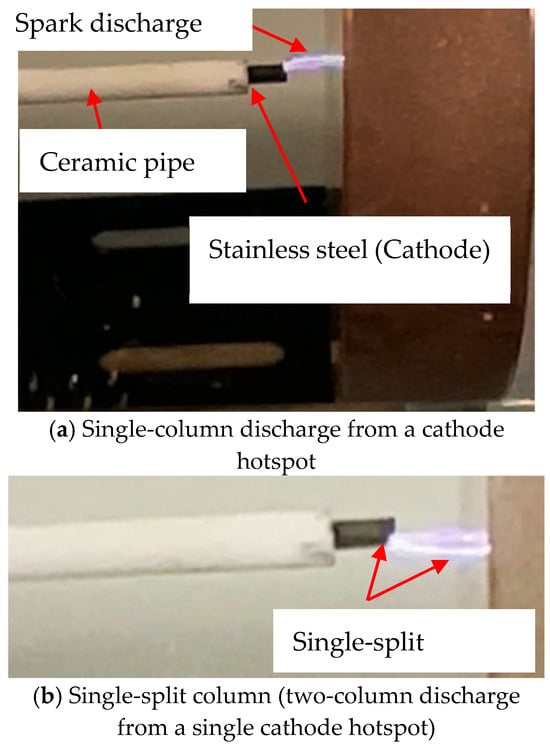
Figure 6.
Plasma discharge for the CRC. After the corona discharge is observed, a single column forms from the corona hotspot at the cathode. Additionally, when dielectric breakdown occurs at higher voltages, a single-split column can be observed. This case occurs when the withstand voltage is 6.68 kV.
Although the arc originates from a single point, once the plasma reaches the anode, it can follow multiple paths, striking different regions of the anode surface (Figure 6b). This behaviour may lead to localised damage at the electrode and, over time, increase the risk of misfiring. The hotspot region associated with the initial corona discharge is considered a primary factor in electrode tip deterioration, necessitating more frequent maintenance in industrial applications.
Furthermore, the plasma exhibits whitish and purplish colouration, which is indicative of temperature variations within the discharge channel. These visual features provide additional insight into the spatial and thermal dynamics of the spark discharge process.
Figure 7 shows the plasma discharge for the CCC, beginning with a double-column discharge. This discharge is observed every time. Sometimes the columns seem to be of the same diameter, and sometimes their sizes differ visually (see Figure 7a,b). The creeping process can alter the location of the plasma along the ceramic pipe. The results show intense spark discharge for the CCC arrangement. It is observed that the position of the plasma striking the anode remains almost steady. At the same time, the double column can transition to a full electrode discharge (see Figure 7d) without changing the applied voltage.
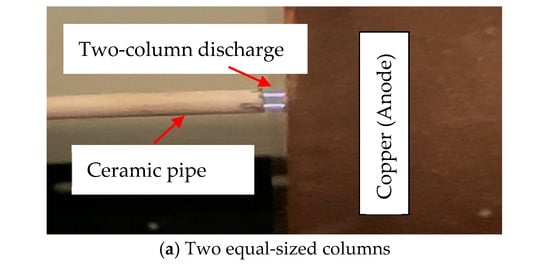
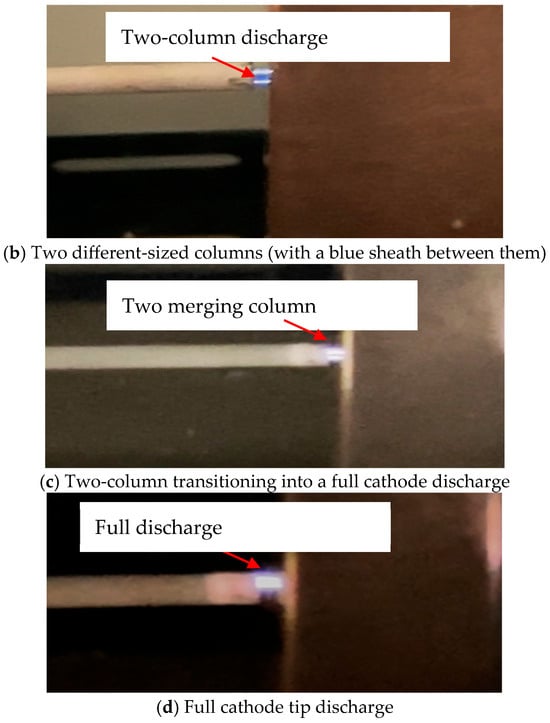
Figure 7.
Discharge plasma for the CCC. Two-column plasma is observed on the CCC, and it fuses into a full cathode discharge without a voltage increase.
3.3. Statistical Analysis for Withstanding Voltage
Determining the dielectric withstanding voltage for spark discharge is essential for proper circuit design, as it ensures that the system is neither undersized nor oversized for the intended spark generation between electrodes. The withstanding voltage data were extracted from the first voltage wavefront at node A for each trial, representing the minimum voltage required to overcome the dielectric barrier and initiate spark formation.
Individual measurements are represented as points (dots) in the analysis presented in Figure 8, with the mean ± standard deviation (SD) indicated by error bars. For the CRC configuration, the withstand voltage varied considerably across independent trials, with raw values of 4.76, 6.68, 5.72, 5.12, and 5.36 kV. The mean withstanding voltage was 5.528 ± 0.752 kV (mean ± SD, ), and the corresponding two-sided 95% confidence interval of the mean, computed using Student’s -test (), was 4.64–6.51 kV.
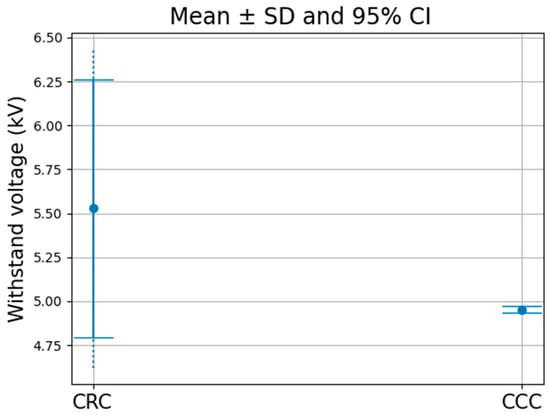
Figure 8.
The required withstand voltage and the variation in the CRC and CCC. There is a clear strong overlap between CCC and CRC.
For the CCC configuration, the raw withstanding voltage values were 4.92, 4.36, 4.96, 4.96, and 4.96 kV, resulting in a mean of 4.952 ± 0.018 kV (SD, ). The 95% confidence interval of the mean, calculated via Student’s -test (), was 4.9298–4.9742 kV. A bootstrap percentile 95% confidence interval based on 5000 resamples further confirmed the robustness of the estimate, yielding 4.936–4.960 kV.
The observed variability in withstanding voltage can be attributed to minor fluctuations in the dielectric’s surface charge distribution and to local microstructural variations at the metal–ceramic interface. Such variations are known to strongly influence the electric field enhancement at the triple junction, thereby affecting the spark initiation voltage.
The statistical comparison between the CRC and CCC with the Welch’s t-test (unequal variances) gives t = 1.845, p = 0.1387, where df ≈ 4.00. Since p > 0.05 and n = 5 is too small, it is concluded that there is no significant difference between the means of the withstanding voltages at the 95% confidence level. Because the 95% CI ranges overlap substantially, the p-value indicates no superiority of CCC or CRC in the discharge withstand voltage regime. The confidence interval is between 4.64 kV and 6. 52 kV for the CRC whereas for the CCC it is between 4.93 kV and 4.97 kV. However, the bootstrap confines the CRC above 5 kV while keeping the CCC below 5 kV. A complete summary is given in Table 1.

Table 1.
Withstand voltage statistical analysis.
3.4. Statistical Analysis for the Discharge Current
Figure 9 presents the average discharge current along with its variability for the CRC and CCC configurations. The CCC exhibits a substantially higher discharge current, exceeding 100 mA, compared with the CRC. Specifically, the mean discharge current for the CRC is 463 mA, whereas for the CCC it is 603 mA. This enhancement in discharge current is attributed to the creeping discharge occurring along the inner surface of the ceramic pipe.
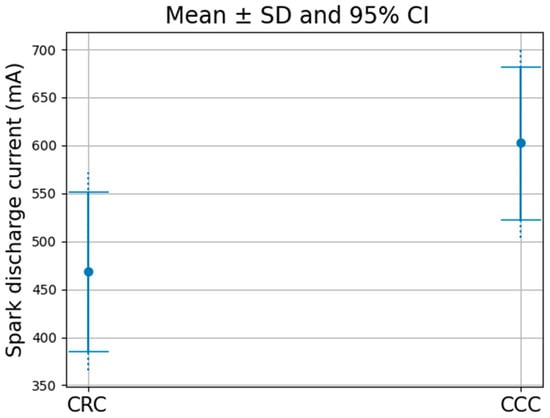
Figure 9.
Plasma discharge current comparison between the CRC and the CCC.
Across independent discharge cycles, the plasma discharge current showed marked differences between the two configurations in Table 2. The CRC exhibited an average current of 463.36 ± 83.17 mA (SD), with a 95% confidence interval of 365.09–571.64 mA, while the CCC achieved 602.48 ± 79.84 mA (SD), corresponding to a 95% confidence interval of 503.34–701.62 mA. The limited overlap of the 95% confidence intervals indicates a statistically meaningful increase in the discharge current under CCC conditions, likely resulting from enhanced surface-field intensification at the triple junction.
Table 2.
Averaged discharge current statistical analysis.
Bootstrap resampling (5000 iterations) yielded a 95% confidence interval of 412.04–539.67 for CRC and 537.30–663.08 for CCC, confirming the robustness of the estimated mean values.
The bootstrap analysis yielded a mean difference of 134.65, with a 95% confidence interval ranging from 40.09 to 217.19. Since the interval does not include zero, the difference between datasets CRC and CCC is statistically significant and robust against distributional assumptions.
Finally, A two-sample Welch t-test was performed to compare the mean discharge currents under the two conditions. The analysis yielded t = −2.60 with p = 0.0316, indicating a statistically significant difference between the mean currents at the 95% confidence level (p < 0.05).
4. Discussion
This study investigated the influence of creeping discharge characteristics when applied to a cold cathode, leading to the development of a novel cathode configuration referred to as the ceramic-covered cathode (CCC), and compared its discharge behavior with that of the ceramic-removed cathode (CRC). In addition, a new method for measuring the averaged discharge current was proposed. The spark charge was calculated from the recorded voltage discharge waveforms and subsequently used to determine the averaged spark discharge current quantitatively.
The results show that the creeping discharge process in the CCC configuration significantly increases the averaged discharge current to values exceeding 600 mA, compared with 463 mA for the CRC. Although the CCC exhibits higher discharge currents, the strong overlap of the 95% confidence intervals (CIs) for the withstanding voltage indicates that the difference between the two configurations is not statistically significant or that the CI is inconclusive in distinguishing the means.
Creeping discharge along the ceramic surface strongly influences both the spark duration and the discharge current. For the CCC configuration, enhanced charge generation results in shorter spark durations, whereas the CRC configuration exhibits longer discharge durations.
The key characteristics observed in this study can be summarized as follows:
- The p-values indicate no statistically significant difference in the mean withstanding voltage between the CCC and CRC, and the overlapping 95% CI suggests no significant difference in the standard deviations (Table 1).
- The CRC exhibits longer discharge cycles, exceeding 5 ms, compared with approximately 1 ms for the CCC.
- A full cathode plasma discharge is observed in the CCC configuration, whereas only a partial cathode discharge occurs in the CRC configuration.
- Although the variation in spark discharge current differs only slightly (approximately 80 mA), the averaged discharge current of the CCC exceeds that of the CRC by approximately 140 mA.
Triple-junction-assisted plasma discharges offer a wide range of technological applications. They are particularly effective for gas ignition in situations where only low trigger energy or limited local electric-field enhancement is available. As a result, such discharges are well suited for ultra-lean combustion ignition and for ignition in contaminated, humid, or low-pressure environments.
These discharges are also advantageous in high-efficiency plasma switching applications, where the rapid transition from a non-conducting to a conducting state is critical for pulsed power systems. Owing to the strong electric-field enhancement at the triple junction, switching can be achieved at lower operating voltages than those required in conventional cold-cathode devices.
In addition, triple-junction-assisted cathodes have potential as sensing elements in compact high-voltage sensors, as the initiation of surface discharges can serve as a reliable threshold reference signal. In this context, geometry-controlled field enhancement becomes a robust and reproducible engineering parameter.
Triple-junction-driven micro-discharges are also gaining increasing importance in vacuum electronics, where field emission and residual gas content can be precisely controlled. The presence of the triple junction helps stabilize electron emission in micro-gaps where thermionic cathodes are impractical due to their size or response time. Moreover, these micro-discharges can be configured in arrays to significantly enhance emission current density.
Overall, triple-junction plasma technology provides precise control and high local electric-field efficiency, enabling the development of miniaturized plasma devices that are not achievable with conventional uniform-gap discharge designs.
4.1. Limitations
An energy analysis of the discharge process was previously conducted and presented at the 11th International Conference on Electrical Engineering and Electronics, with the proceedings published under the title with the proceedings available at Characteristics of Discharge Phenomena on Novel Ceramic-Pipe Covered Cathode (https://avestia.com/EECSS2025_Proceedings/files/paper/EEE/EEE_121.pdf (accessed before 1 January 2026)). In that analysis, the plasma energy was approximated by equating it to the energy stored in the capacitor before and after the spark discharge, under the assumption of negligible energy losses. Accordingly, the spark energy was estimated as the difference between the capacitor’s stored energy prior to discharge and its residual energy after discharge.
Further analysis could be performed using alternative formulations, namely and . However, these expressions were not evaluated in the present study because the current values were derived from voltage waveforms. Any inaccuracy in the current calculation would therefore propagate into subsequent energy and power estimations, leading to cumulative errors. Moreover, accurate evaluation of the plasma current between the cathode and anode requires consideration of multiple factors, including electrode sheath formation, capacitive effects, electron temperature and density, secondary electron emission at surfaces, gas composition and pressure, measurement bandwidth and noise, and geometry-induced electric-field enhancement. In the absence of detailed knowledge of these parameters, precise quantification of the spark plasma energy remains challenging.
Finite element simulations of the electric-field enhancement at the triple junction could not be performed using COMSOL Multiphysics due to licensing limitations. Alternative numerical approaches based on Python 3.10 and finite-volume discretization yielded unphysical electric-field values, such as predicted magnitudes on the order of V/m (indicating no field enhancement), instead of the expected V/m for a 1 kV potential across a 3 mm gap. These discrepancies may be attributed to scaling or normalization errors, improper treatment of metallic boundary conditions on non-conforming meshes, or insufficient local mesh refinement in the vicinity of the triple junction. Attempts to implement an axisymmetric solver using FEniCS coupled with Gmsh were unsuccessful due to installation issues with the FEniCS framework. Consequently, the computational modeling component of this study remains incomplete.
4.2. Future Work
Distinct differences in plasma luminosity were observed between the two cathode configurations, with a reddish emission for the CRC and a whitish-blue emission for the CCC. These color variations may indicate differences in effective plasma temperature. Future experimental work will therefore focus on diagnosing electron and ion temperatures to better characterize the plasma properties.
In addition, the time derivative of the voltage, , will be directly measured, allowing the averaged discharge current to be calculated using . These results will then be compared with the current values obtained using the voltage-based method described in Equation (5), providing a means to validate and refine the proposed current measurement approach.
5. Conclusions
Considering the potential industrial applications of the two cathode configurations investigated in this study, it is concluded that the ceramic-removed cathode (CRC) can deliver an averaged discharge current of approximately 600 mA. In contrast, the ceramic-covered cathode (CCC) achieves a higher current of approximately 700 mA under the same applied voltage. The observed increase in discharge current supports the hypothesis that the introduction of creeping discharge along the ceramic surface enhances plasma generation. Moreover, the limited overlap of the 95% confidence intervals indicates a meaningful shift in the discharge current between the two configurations. As a result, the CCC configuration promotes a transition from partial to full cathode discharge, thereby expanding the effective discharge area.
Despite these promising results, further validation of the current, voltage, and energy characteristics under a broader range of operating conditions and with additional plasma diagnostic techniques is required to fully realize and confirm the advantages of the CCC configuration. Such diagnostics may include independent current measurements, optical emission spectroscopy, and time-resolved imaging.
The newly proposed current quantification method offers a practical alternative when conventional approaches—such as direct current probe measurements or energy-based calculations—are impractical because of probe damage, excessive noise, or bandwidth limitations. Although this method relies solely on voltage waveforms, it inherently accounts for the total current flowing between the electrodes, making it particularly suitable for harsh plasma discharge environments.
Author Contributions
Conceptualization, A.S.; experimental circuit design, Y.A.; technical experiment setups, I.L.S. and A.S.; methodology, I.L.S. and I.H.; MATLAB Codes, I.L.S., I.H. and K.H.; experimental data collection, A.S., K.H. and I.L.S.; formal analysis, I.L.S.; resources, A.S. and I.L.S.; writing—review and editing, A.S.; supervision. All authors have read and agreed to the published version of the manuscript.
Funding
This research received no external funding.
Institutional Review Board Statement
Not applicable.
Informed Consent Statement
Not applicable.
Data Availability Statement
The raw data supporting the conclusions of this article will be made available by the authors on request.
Conflicts of Interest
The authors declare no conflicts of interest.
References
- Bazelyan, E.M.; Raizer, Y.P. Spark Discharge; CRC Press Taylor & Francis Group: New York, YN, USA, 1998; pp. 12–247. [Google Scholar]
- Benson, R.S.; Whitehouse, N.D. Internal Combustion Engines Volume 1; Pergamon Press Ltd.: Oxford, UK, 1979; pp. 97–138. [Google Scholar]
- Loeb, L.B. Statistical factors in spark discharge mechanisms. Rev. Mod. Phys. 1948, 20, 151–160. [Google Scholar] [CrossRef]
- Top, T.V.; Lesaint, O. Streamer initiation in mineral oil part II: Influence of a metallic protrusion on a flat electrode. IEEE Trans. Dielectr. Electr. Insul. 2002, 9, 92–96. [Google Scholar] [CrossRef]
- Laihonen, S.J.; Gäfvert, U.; Schütte, T.; Gedde, U.W. DC breakdown strength of polypropylene films: Area dependence and statistical behavior. IEEE Trans. Dielectr. Electr. Insul. 2007, 14, 275–286. [Google Scholar] [CrossRef]
- Kenneth, K.L. Electrostatic Discharge; CRC Press Taylor & Francis Group: New York, YN, USA, 1999; pp. 1–98. [Google Scholar]
- Nishi, T.; Hanaoka, R.; Murdiya, F.; Miyagi, K. Positive Creeping Discharge along Aerial Insulated Wire Generated by Lightning Stroke. Electr. Eng. Jpn. (Engl. Transl. Denki Gakkai Ronbunshi) 2017, 199, 13–21. [Google Scholar] [CrossRef]
- Good, R.H.; Müller, E.W. Encylopedia of Physics Electron-Emission Gas Discharges I, vol. XXI; Springer: Berlin/Heidelberg, Germany, 1956; pp. 206–231. [Google Scholar]
- Uhm, H.S.; Choi, E.H.; Cho, G.; Whang, K.W. Electrical Breakdown Voltage in a Mixed Gas. Jpn. J. Appl. Phys. 2001, 40, 275–286. [Google Scholar] [CrossRef]
- Beroual, A.; Khaled, U. Influence of hydrostatic pressure on creeping discharge characteristics over solid/liquid insulating interfaces under AC and DC voltages. IET Gener. Transm. Distrib. 2018, 12, 267–271. [Google Scholar] [CrossRef]
- Nath, D.; Yang, Q.; Montanari, G.; Yin, W.; Xiong, H.; Younsi, K. Modeling and Characterization of Surface Discharges in Insulating Material for Spacers: Electrode Shape, Discharge Mode, and Revision of the Creepage Concept. Materials 2023, 16, 989. [Google Scholar] [CrossRef] [PubMed]
- Yi, X.; Wang, Z. Creepage discharge on pressboards in synthetic and natural ester transformer liquids under ac stress. IET Electr. Pow. Appl. 2013, 7, 191–198. [Google Scholar] [CrossRef]
- Saim, N.; Bitam-megherbi, F. Experimental Investigation of the Triple-Junction Effect on the Electric Discharge Characteristics and Modeling of the Maximum Discharge Current. ECTI Trans. Electr. Eng. Electron. Commun. 2020, 19, 115–126. [Google Scholar] [CrossRef]
- Yao, Y.; Yang, X.; Guo, B.; Wang, C.; Lian, R.; Song, B.; Mu, H.; Zhang, G. Integrated Modelling of Vacuum Flashover Development: Above-Surface Processes and Breakdown Threshold Analyses. High Volt. 2024, 9, 614–625. [Google Scholar] [CrossRef]
- Brooks, W.; Hopkins, M. Statistical Characterization of High Voltage Vacuum Surface Flashover with Gapped and Ungapped Anodes. Phys. Plasmas 2024, 31, 080701. [Google Scholar] [CrossRef]
- Hama, H.; Inami, K. Estimation of Breakdown Voltages of Surface Flashovers Initiated from Triple Junction in SF6 Gas. Electr. Eng. Jpn. (Engl. Transl. Denki Gakkai Ronbunshi) 1996, 116, 1078–1087. [Google Scholar]
- Padoan, F.; Clark, D.; Haddad, A.; Karch, C.; Westphal, P. Initiation of Electrical Discharge at the Triple Junction of the Lightning Protection of an Aircraft Radome. IEEE Electr. Insul. Mag. 2023, 39, 6–16. [Google Scholar] [CrossRef]
- Park, H.; Lim, D.; Bae, S. Surface Discharge Mechanism on Epoxy Resin in Electronegative Gases and Its Application. Appl. Sci. 2020, 10, 6673. [Google Scholar] [CrossRef]
Disclaimer/Publisher’s Note: The statements, opinions and data contained in all publications are solely those of the individual author(s) and contributor(s) and not of MDPI and/or the editor(s). MDPI and/or the editor(s) disclaim responsibility for any injury to people or property resulting from any ideas, methods, instructions or products referred to in the content. |
© 2026 by the authors. Licensee MDPI, Basel, Switzerland. This article is an open access article distributed under the terms and conditions of the Creative Commons Attribution (CC BY) license.